The Most Likely Futures for US Refiningrefiningcommunity.com/wp-content/uploads/2017/05/The...The...
35
London Houston Singapore Moscow Dubai New York Portland Calgary Santiago Rio de Janeiro Beijing Shanghai Tokyo Sydney Astana Kiev Cape Town Riga San Francisco Washington Market Reporting Consulting Events The Most Likely Futures for US Refining Ed Arnold May, 2017
Transcript of The Most Likely Futures for US Refiningrefiningcommunity.com/wp-content/uploads/2017/05/The...The...

London
Houston
Singapore
Moscow
Dubai
New York
Portland
Calgary
Santiago
Rio de Janeiro
Beijing
Shanghai
Tokyo
Sydney
Astana
Kiev
Cape Town
Riga
San Francisco
Washington
Market Reporting
Consulting
Events
The Most Likely Futures for US Refining
Ed ArnoldMay, 2017

� Oil prices
- Shale oil production trends
- OPEC behavior
- Asian and Latin American refined products demand
� MARPOL VI effects
- Light-Heavy spread outlook
� US refined products demand
- Domestic demand
- Export demand
- G/D demand ratio
� RFS and CAFE regulations
� Border taxes
� New pipelines
� Alberta bitumen
High level of uncertainty out 5-7 years
Copyright © 2017 Argus Media Ltd. All rights reserved.

3
Oil prices: Long term oversupply is the issue
Copyright © 2017 Argus Media Ltd. All rights reserved.
0
200
400
600
800
1,000
1,200
1,400
8.0
8.2
8.4
8.6
8.8
9.0
Q1-
2014
Q2-
2014
Q3-
2014
Q4-
2014
Q1-
2015
Q2-
2015
Q3-
2015
Q4-
2015
Q1-
2016
Q2-
2016
Q3-
2016
Q4 -
2016
Mil
lio
n b
bls
Bil
lio
n b
bl/
qu
art
er
World Oil Demand, Supply and Cumulative Oversupply(Data Source: IEA, March, 2017 Update. Calculations by Argus.)
Global oil demand (left axis)
Global oil supply (left axis)
Cumulative oversupply since Q1, 2014 (right axis)
Early indications are that oil was in oversupply in Q1, 2017.

4
High probability that monthly average prices will remain volatile, and will stay within the shale band, until shale oil production can’t keep up with demand growth, or until the long-term effects of lower E&P investment take hold.
Most likely scenario: Sticking in the shale band
Copyright © 2017 Argus Media Ltd. All rights reserved.
$0
$20
$40
$60
$80
$100
$120
$140$/bbl
Light Crude OIL Price History ($2016 basis, monthy average prices, through March, 2017)
Brent/North Sea Dated LLS Month 1
Shale Band:
$35 - $65/bbl
?

5
MARPOL VI
� The 2020 global marine fuel sulphur cap is the latest of a series of regulations enforced by the IMO
Copyright © 2017 Argus Media Ltd. All rights reserved.
Most likely scenario: Impact on US refining will be significant.

6
� Unless a ship-based option is widely adapted, a significant portion of the ~3mn bpd of high sulphur resid used in bunker fuel will need to find a new home or be converted to low sulphur material
� Demand for low sulfur distillate will, most likely, increase significantly
Implementation in 2020 will bring changes
0
2
4
6
8
10
12 million bpd
World Bunker Fuel and Resid Demand
Distillate Component of Bunker Fuel
Resid Component of Bunker Fuel
World Resid Demand (kbpd)
Copyright © 2017 Argus Media Ltd. All rights reserved.

7
MARPOL VI: Most likely scenario
Copyright © 2017 Argus Media Ltd. All rights reserved.
� Regional delays in implementation, temporary exemptions, uneven enforcement
� Plan for multi-year widening of light-heavy spreads
� High-sulphur distillate will be an undesirable product
� ULSD distillate demand will increase
� ULSD prices will rise
� No significant pre-emptive conversion or desulfurization investment
� Eventually, look for some additional resid conversion investment
� Slowly growing shift to marine LNG
� Wild cards: Longer term L-H spread differentials*, prolonged phase-in for the regulations, uneven enforcement
* if this occurs, could incentivize major conversion investment

8
� Initial switch will disrupt normal price relationships.
� Creating a stronger incentive for investment in scrubbing.
� Longer term, prices should return to pre-2020 basis once more vessels are scrubber ready, and as alternative fuel use grows.
� No significant level of preemptive refinery investment, beyond the normal, but will see some additional desulfurization and conversion capacity. (If long term L-H spread diff, expect conversion investment.)
Light-heavy product differentials will widen
Copyright © 2017 Argus Media Ltd. All rights reserved.
$0
$10
$20
$30
$40
$50
$60
$70
$80 $/bbl
USGC ULSD - 3%HSFO Differential(fob, through March, 2017)
?
Our
current,
most
likely
scenario
→

9
Light-heavy oil spread will widen, for a while
$0
$2
$4
$6
$8
$10
$12
$14
$16
Light-Heavy Crude Price Differential[Brent & North Sea Dated versus Maya (USGC). Yearly average prices, through 2016]
Brent & North Sea Dated - Maya (USGC) Differential
?
� But – most likely – not long enough to incentivize significant new US resid conversion investment
� Margins for refiners making HSFO will shrink
Copyright © 2017 Argus Media Ltd. All rights reserved.

10
Marine demand to compete for low sulfur distillate
Copyright © 2017 Argus Media Ltd. All rights reserved.
Military
0.2%
Utilities
0.9%
Oil Firms
1.9%
Industrial Use
3.3%
Off-Highway
3.3%
Bunkers
4.0%
Commercial Use
4.3%
Farms
5.3%
Railroads
6.0%
Residential
6.5%
Trucks, Buses &
Automobiles
64.2%
Breakdown of Current US Low S Distillate Use

11
�Different options available
� Total installed costs (“TIC”) probably more expensive than most current P50 estimates ($3m to $6m++ for new vessels, and $6m to $10m++ for retrofits)
- High level of uncertainty with current TIC estimates.
�More likely on new ships versus retrofits
� Space requirement is significant, costing revenue
� Caustic storage (fresh and spent) and other waste will be a major technical issue.
� Caustic disposal may be the key implementation-cost issue
� Can’t install fast enough to fit all large, viable ships
� If resid conversion or resid desulfurization investment is substantial, scrubber investors could be “burned”
Ship-board scrubbers

12
US gasoline demand finally above 2007 levels
Copyright © 2017 Argus Media Ltd. All rights reserved.
5,000
5,500
6,000
6,500
7,000
7,500
8,000
8,500
9,000
9,500
10,000
1991 1993 1995 1997 1999 2001 2003 2005 2007 2009 2011 2013 2015
US - Yearly Domestic Gasoline Component Demand
Ethanol used in gasoline
Gasoline and blendstock imports
US-produced oil derived gasoline for domestic use
’000 bpd
-Data from EIA. Calculations by Argus.
Petroleum-derived gasoline
demand not yet up to
2004 levels

13
US gasoline output continues to grow
Copyright © 2017 Argus Media Ltd. All rights reserved.
� Gasoline export growth has been accelerating the last 4 years
� Most likely export demand scenario: Demand growth rate will gradually shrink
� Most likely US demand scenario: RFS continues as is. Only moderate changes to CAFE
policy. (“54.5 in 2025”). Demand growth shrinks and eventually disappears.
5,000
5,500
6,000
6,500
7,000
7,500
8,000
8,500
9,000
US- Yearly Refinery Gasoline Production
US gasoline &
blendstock exports
US-produced oil
derived gasoline for
domestic use
’000 bpd
- Data from EIA. Calculations by Argus.

14
US gasoline inventories at all time highs
Copyright © 2017 Argus Media Ltd. All rights reserved.
This places downward pressure on gasoline prices (and oil prices)
160
170
180
190
200
210
220
230
240
250
260
1 3 5 7 9 11 13 15 17 19 21 23 25 27 29 31 33 35 37 39 41 43 45 47 49 51
Million bbls
Week Number
2016 and 2017 US Gasoline Inventory Levels
2001 - 2015 inventory range
2016 inventory levels
2017 inventory levels

15
US distillate demand dropped in 2016
Copyright © 2017 Argus Media Ltd. All rights reserved.
0
500
1,000
1,500
2,000
2,500
3,000
3,500
4,000
4,500
5,000
1991 1993 1995 1997 1999 2001 2003 2005 2007 2009 2011 2013 2015
US- Yearly Domestic Distillate Demand
Biodiesel
Distillate imports
US-produced distillate for domestic use
’000 bpd
-Data from EIA. Calculations by Argus.

16
US total distillate production dropped in 2016
Copyright © 2017 Argus Media Ltd. All rights reserved.
� 2016 growth in distillate exports could compensate for loss in domestic demand.
� Most likely scenario: Flat to slowly declining demand, until MARPOL VI hits, then
look for tight market to develop.
2,000
2,500
3,000
3,500
4,000
4,500
5,000
1991 1993 1995 1997 1999 2001 2003 2005 2007 2009 2011 2013 2015
US - Yearly Refinery Distillate Production
Distillate exports
US-produced distillate for domestic use
’000 bpd
-Data from EIA. Calculations by Argus.

17
US distillate inventories near all time highs
Copyright © 2017 Argus Media Ltd. All rights reserved.
This places downward pressure on distillate prices (and oil prices)
50
70
90
110
130
150
170
190
1 3 5 7 9 11 13 15 17 19 21 23 25 27 29 31 33 35 37 39 41 43 45 47 49 51
Million bbls
Week Number
2016 and 2017 US Distillate Inventory Levels
2001 - 2015 inventory range2016 inventory levels2017 inventory levels

18
G/D demand ratios have stopped dropping
Copyright © 2017 Argus Media Ltd. All rights reserved.
Most likely scenario: This ratio will head back to lower levels once
MARPOL VI takes effect
1.5
1.7
1.9
2.1
2.3
2.5
1991 1993 1995 1997 1999 2001 2003 2005 2007 2009 2011 2013 2015
US - Yearly US G/D Demand Ratios
US G/D Domestic Demand Ratio
US G/D Domestic + Exports Demand Ratio
-Data from EIA. Calculations by Argus.

19
US refined products exports are still growing
Copyright © 2017 Argus Media Ltd. All rights reserved.
Most likely scenario: This will continue, but expect decelerating growth
0
500
1,000
1,500
2,000
2,500
3,000
3,500
2000 2001 2002 2003 2004 2005 2006 2007 2008 2009 2010 2011 2012 2013 2014 2015 2016
000 bpd
US - Major Refined Products Exports
Unfinished Oils
Jet fuel & other kero.
Resid fuel oil
Pet. coke
Gasoline & Blendstocks
Distillate

20
Export product growth rates are variable
Copyright © 2017 Argus Media Ltd. All rights reserved.
-20%
-10%
0%
10%
20%
30%
40%
50%
Distillate NGLs & LRGs Gasoline &
blendstocks
Pet. coke Resid fuel oil
US- Export Growth Trends for Distillate and
Gasoline are On Different Tracks (Rolling CAGRs )
2012 - 2014 2013 - 2015 2014 - 2016

21
RFS and CAFE, most likely scenarios
Copyright © 2017 Argus Media Ltd. All rights reserved.
� RFS
- RFS stays at current levels
- RINS policy does not change
� CAFE Standards
- No significant change
- CARB has “clout.”
- Car manufacturers do not want to build multiple vehicle types.

22
Border taxes
Copyright © 2017 Argus Media Ltd. All rights reserved.
� Most likely scenario: Minor, measured changes
� Trump administration appears to be listening to US industry leaders
� Regardless, high level of uncertainty

23
� Both Dakota Access and Enbridge’s Keystone XL have new life
� Govt. of Canada has approved KM’s Trans Mountain pipeline twinning
� Govt. of Canada has approved Enbridge’s Line 3 “replacement” (enlargement)
� Probability of completion, for all 4 pipelines, within 2 - 4 years, higher than in 2016
� But numerous lawsuits and hearings are obstacles on the paths to completion
New Crude Oil Pipelines
Copyright © 2017 Argus Media Ltd. All rights reserved.

24
� Still face hurdles
- Hearings at Nebraska Pubic Services Commission
- Likely lawsuits: Sierra Club, NRDC and others
� Start of construction for KXL could be months or years off
� KXL less critical than when first envisioned
- Other pipelines and rail transport have filled the gap
� Alberta Dilbit and Synbit will get to the USGC, regardless
� Supply of Alberta bitumen will continue to grow, slowly
� Most Alberta bitumen majors are in the business for long term
- SAGD operations cannot easily be turned on and off
- Despite the flight of foreign capital, ~$14billion in oil sands spending is forecast for 2017
- Recent permitting requests for multiple new SAGD projects
Keystone XL, Enbridge Line 3 and Alberta bitumen
Copyright © 2017 Argus Media Ltd. All rights reserved.

25
� Majority of Canadian import growth is Alberta bitumen
� Alberta bitumen import growth will compensate for the loss of Mexican and Venezuelan imports
Alberta heavy oil import growth continues
Copyright © 2017 Argus Media Ltd. All rights reserved.
0
2,000
4,000
6,000
8,000
10,000
Jan-09 Jan-11 Jan-13 Jan-15 Jan-17
000 bpd
Canadian Oil Imports to US versus US Oil Production
and Mexican and Venezuelan Imports
US Oil Production
Canadian Crude Imports
Mexican Oil Imports
Venezuelan Oil Imports

� Total US bitumen demand dropped in 2016.
� PADD 2 demand grew slightly. PADD 3 demand dropped.
Today, most Alberta bitumen heads to US PADD 2
Copyright © 2017 Argus Media Ltd. All rights reserved.
1417 1436
293 289
0
500
1,000
1,500
2,000
2009 2010 2011 2012 2013 2014 2015 2016
kbpd
Canadian heavy sour crude shipments into US
PADD1
PADD5
PADD4
PADD3
PADD2
- Data from EIA. Calculations by Argus.

� Note the relative stability of PADD 3 heavy sour import levels, since 2009
� PADD 2 demand growth is probably close to its peak demand level
However, PADD 3 represents the largest opportunity
Copyright © 2017 Argus Media Ltd. All rights reserved.
0
1,000
2,000
3,000
4,000
5,000
6,000
2009 2010 2011 2012 2013 2014 2015 2016
’000b/d
PADD 3 Oil Import Quality Trend by Oil Type
heavy sweet light sour
light sweet medium sweet & sour
heavy sour
0
1,000
2,000
3,000
4,000
5,000
6,000
2009 2010 2011 2012 2013 2014 2015 2016
’000b/d
PADD 2 Oil Import Quality Trend by Oil Type
heavy sweet light sour
light sweet medium sweet & sour
heavy sour

There is room for additional Canadian bitumen in PADD 3
Copyright © 2017 Argus Media Ltd. All rights reserved.
Much of the Venezuelan heavy sour crude is high TAN and is a obvious candidate for “replacement.”
32%
27%
14%
10%
0%
20%
40%
60%
80%
100%
2009 2010 2011 2012 2013 2014 2015 2016
kbpd
US PADD 3 Heavy Sour Crude Source Breakdown
Other
Saudi Arabia
Ecuador
Brazil
Colombia
Canada
Mexico
Venezuela
29
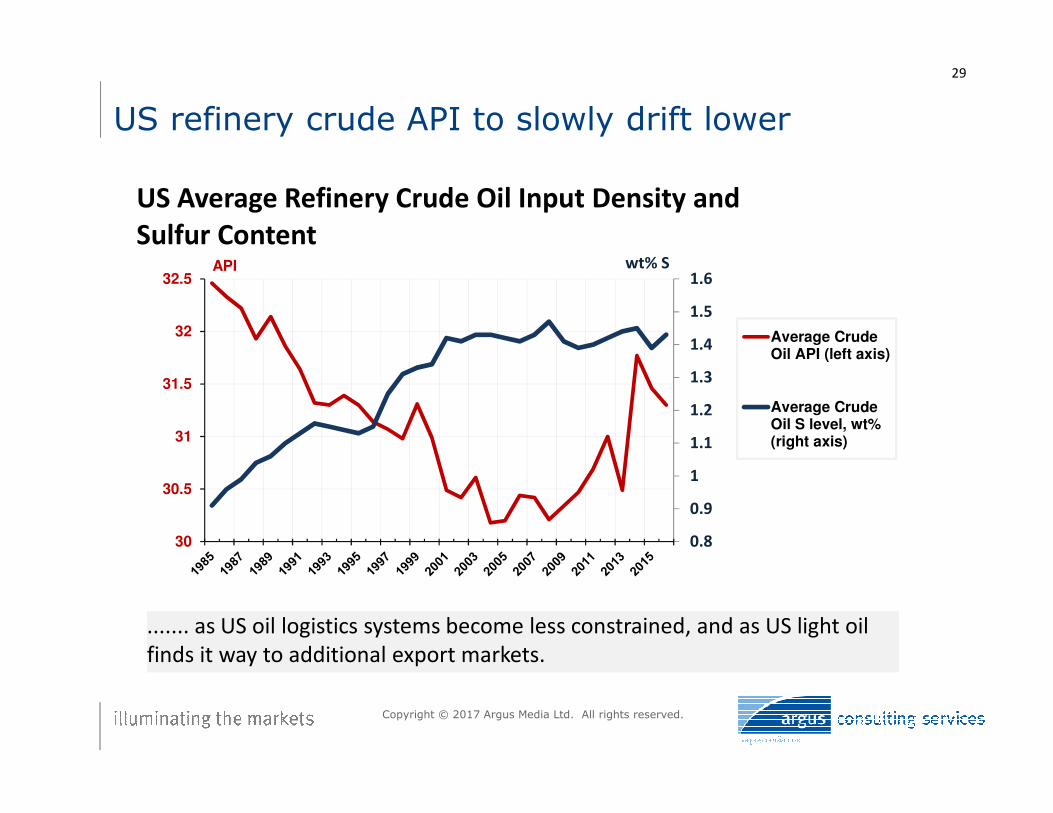
US refinery crude API to slowly drift lower
Copyright © 2017 Argus Media Ltd. All rights reserved.
....... as US oil logistics systems become less constrained, and as US light oil
finds it way to additional export markets.
0.8
0.9
1
1.1
1.2
1.3
1.4
1.5
1.6
30
30.5
31
31.5
32
32.5wt% SAPI
US Average Refinery Crude Oil Input Density and
Sulfur Content
Average CrudeOil API (left axis)
Average CrudeOil S level, wt%(right axis)

30
Conclusions
Copyright © 2017 Argus Media Ltd. All rights reserved.
� Oil Prices:
� Most Likely in shale band for multiple years
� Expect volatility
� Wild cards: Supply disruption, demand surprises, or OPEC successfully managing long-term production cuts
� MARPOL VI:
� Plan for multi-year widening of light-heavy spreads
� High-sulphur distillate will be an undesirable product
� ULSD distillate demand will increase
� ULSD prices will rise
� No significant preemptive conversion of desulfurization investment
� Wild cards: Long term L-H spread differentials (if they materialize, could incentivize major conversion investment), prolonged phase in for the regulations

31
Conclusions, continued
Copyright © 2017 Argus Media Ltd. All rights reserved.
� US Gasoline Demand
- Most likely that export demand growth rate will gradually shrink
- Most likely that US domestic demand growth shrinks and eventually disappears
- Wild cards: CAFE 54.5 disappears, RFS diminished, RFS increases
� US Distillate Demand
- 2016 growth in distillate exports was not enough to compensate for the loss in domestic demand
- Most likely scenario: Flat to slowly declining domestic + export demand, until MARPOL VI hits, then look for tight market to develop
- Wild Cards: Marpol timing delays, major jump in GDP growth rates in developing or developed countries

32
Conclusions, continued
Copyright © 2017 Argus Media Ltd. All rights reserved.
� Pipelines & Alberta Bitumen
- DAPL, KXL, Trans-Mount. twinning & Enbridge Line 3 all have new life
- Most likely years of lawsuits and hearing for some of these
- Additional Alberta bitumen will come into PADD 3 regardless (and a small additional amount into PADD 2)
- Although the game has changed, Alberta majors are in the game for the long run
- Wild cards: Successful law suits, major spills, technology breakthroughs

33
Conclusions, continued
Copyright © 2017 Argus Media Ltd. All rights reserved.
� RFS and CAFE Standards
- Most likely, RFS stays at current levels
- Most likely, RINS policy does not change
- Most likely, CAFE policy sees no significant change
- Wild cards: Near-term political-control shifts in DC, Trump administration policy shifts
� Border Taxes
- Most likely scenario: Minor, measured changes
- Trump administration appears to be listening to US industry
- Regardless, high level of uncertainty

Copyright © 2017 Argus Media Ltd. All rights reserved.

Stay Connected
@ArgusMedia Argus-media
+Argusmediaplus argusmediavideo
Copyright notice Copyright © 2017 Argus Media Ltd. All rights reserved. All intellectual property rights in this presentation and the information herein are the exclusive property of Argus and and/or its licensors and may only be used under licence from Argus. Without limiting the foregoing, by reading this presentation you agree that you will not copy or reproduce any part of its contents (including, but not limited to, single prices or any other individual items of data) in any form or for any purpose whatsoever without the prior written consent of Argus.
Trademark notice ARGUS, the ARGUS logo, ARGUS MEDIA, ARGUS DIRECT, ARGUS OPEN MARKETS, AOM, FMB, DEWITT, JIM JORDAN & ASSOCIATES, JJ&A, FUNDALYTICS, METAL-PAGES, METALPRICES.COM, Argus publication titles and Argus index names are trademarks of Argus Media group.
Disclaimer All data and other information presented (the “Data”) are provided on an “as is” basis. Argus makes no warranties, express or implied, as to the accuracy, adequacy, timeliness, or completeness of the Data or fitness for any particular purpose. Argus shall not be liable for any loss or damage arising from any party’s reliance on the Data and disclaims any and all liability related to or arising out of use of the Data to the full extent permissible by law.
Argus Consulting Services
Ed Arnold, Senior [email protected]
630 544 6492
Houston
www.argusmedia.com
http://blog.argusmedia.com