The Mortgage Crisis and Credit Crunch: From Housing...
21
The Mortgage Crisis and Credit Crunch: From Housing Losses to Balance Sheet Analysis to Diminished Economic Growth David Brat Randolph-Macon College Ashland, VA 23005 804-752-7353 [email protected] Sydney Jones Randolph-Macon College Ashland, VA 23005 Economics and Finance Tracks
Transcript of The Mortgage Crisis and Credit Crunch: From Housing...

The Mortgage Crisis and Credit Crunch:
From Housing Losses to Balance Sheet Analysis to Diminished Economic Growth
David Brat
Randolph-Macon College
Ashland, VA 23005
804-752-7353
Sydney Jones
Randolph-Macon College
Ashland, VA 23005
Economics and Finance Tracks
Abstract
The mortgage crisis makes headline news by the day. This paper was written in the summer of 2008, prior
to the Lehman credit shock. While not cutting edge any more, it is very useful to review the economic
story of that day as it is quite informative. TARP is not yet in the air. The broader economy is not yet
damaged. At this point in time, what do we see? At this point in time, the talking heads were talking about
Structured Investment Vehicles (SIVs) and off-balance sheet accounts. Every day another bank
announces $2 Billion dollars in losses written off the books. Then prices on these assets fall still further
and other banks are forced to reevaluate their balance sheets with these new lower prices in place. What
caused the mortgage crisis? What is the credit crisis? How has the crises impacted the broader economy?
By studying the past five year history, we can see that a lack of regulation, poor investment decisions,
major shocks to the economy, and historically low interest rates all played a part in the crisis. This paper
will show the links between the credit crisis, firm balance sheets, and the damage we can expect to the
macro economy. With a case study on Countrywide Financial Corporation‘s balance sheets, we can track
the firm‘s failure and see the credit crisis‘ major effect on firms. We can expect continued declines in the
GDP growth rates and the stock market until this credit environment is restored to health.

I. Introduction
The mortgage crisis makes headline news by the day. The talking heads refer to
Structured Investment Vehicles (SIVs) and Collateralized Debt Obligations (CDOs) and off-
balance sheet accounts. Every day another bank declares $2 Billion dollars in losses written off
the books. Then, it appears, that prices on these assets fall still further and other banks are forced
to reevaluate their balance sheets with these new lower prices in place. It all sounds bad. But
how bad is it? How does one put these events into perspective? How does the action of a single
bank affect the macro economy? That part is not in the news. That is the goal of this paper. We
will investigate a few major questions related to this crisis and attempt to place them in a single
economic narrative. First, we will ask what caused of the mortgage crisis and the credit crunch?
Second, we will investigate bank behavior at the micro level by investigating bank balance
sheets. Finally, we will measure the extent of this crisis at the national level and estimate the
impact on the macro economy. How large is this crisis? How many people will be affected by it?
How will it impact economic growth? We will answer these questions by following this ongoing
narrative and by using the economic tools provided by the discipline.
II. What caused the credit crisis?
According to many experts, initially there was a lack of regulation on banks between the
1980‘s and 1990‘s. For example, under the Basel II Act, ―banks are able to reduce their capital
requirements by packaging up assets, securitizing them and holding investment-grade rated
tranches ‗slices‘ of the securitization rather than the whole loans.‖1 In addition, there were also
five major shocks to the economy between 2000 and 2005: mini recession (2001-2003), 9/11
1 Beach, P, Heap, A, & Smith, D Risk Transparency in the Aftermath of the Credit Crisis. Atos Consulting

(2001), War on Terror (2001-present), Dot Com Bubble (1995-2001), Housing Bubble (2001-
2005). To recover from these shocks, the Federal Reserve printed more money and lowered the
federal funds rate 11 times between May 2000 at 6.5% to December 2001 at 1.75%. The increase
in money supply and the lower federal funds rate caused market interest rates to also decline in
turn. Banks began to use these lower interest rates to their advantage and start lending with
adjustable rates. Also, Firms began ―buying billions of dollars‘ worth of subprime loans from
nonblank mortgage lending firms.‖2 Thus, investors were buying subprime loans in the early
2000‘s, revealing that everyone had bought into this new type of financial product and invested
in these subprime loans.3
Not only did banks lend out high risk loans to gain profits, but they also had political
pressure to make homes more affordable to people. Regulation on lending loans was not as strict,
allowing banks to lend money to high risk borrowers. For the first time ever, borrowers were
able to borrow without making a down payment. But, one key variable that had been overlooked
made a grand appearance on the financial stage. Housing prices began to dip. People began to
2 Muolo, P., & Padilla, M. Chain of Blame.Hoboken: (John Wiley & Sons, Inc., 2008) 7.
3 Iacono, T. The Mortgage Crisis According To Alan Greenspan. Seekng Alpha, Retrieved July 2008, from
http://seekingalpha.com/article/57147-the-mortgage-crisis-according-to-alan-greenspan

speculate and become anxious about the housing market, causing prices to go down. For many
analysts, the fact that the Federal funds rate was set at 1% in 2003 showed that the rates stayed
too low for too long, igniting a housing bubble that began to burst in the summer of 2005. This
bubble was due to over-building of homes because, before 2005, the housing market was
booming with profits. In addition, many investors bought into mortgages they could not afford.
As seen in figure above, the Federal Funds Rate began to increase in 2005, causing interest rates
to also rise and because many of the the loans were adjustable, banks were able to raise interest
rates on those loans, causing mortgage payments to be unaffordable. 4
III. SIV Story
SIV‘s, or structured investment vehicles are a major story:
A pool of investment assets that attempts to profit from credit spreads between short-term debt
and long-term structured finance products such as asset-backed securities (ABS). Funding for SIVs comes
from the issuance of commercial paper that is continuously renewed or rolled over; the proceeds are then
invested in longer maturity assets that have less liquidity but pay higher yields. The SIV earns profits on
the spread between incoming cash flows (principal and interest payments on ABS) and the high-rated
commercial paper that it issues. SIV’s often employ great amounts of leverage to generate returns.
SIVs are less regulated than other investment pools, and are typically held off the balance sheet
by large financial institutions such as commercial banks and investment houses. They gained much
attention during the housing and subprime fallout of 2007; tens of billions in the value of off-balance
sheet SIVs were written down as investors fled from subprime mortgage related assets.
Many investors were caught off guard by the losses because little is publicly known about the
4 Unknown, (May 2008). Subprime Crisis Impact Timeline. Retrieved June 2008, from Wikipedia Web site:
http://en.wikipedia.org/wiki/Subprime_crisis_impact_timeline

specifics of SIVs, including such basics as what assets are held and what regulations determine their
actions. SIVs essentially allow their managing financial institutions to employ leverage in a way that the
parent company would be unable to due to capital requirement regulations. 5
The SIV‘s cause uncertainty in the true value of the mortgage debt. When housing prices
fall, the credit shrinks up because of the uncertainty, causing the falling in prices. The SIV‘s
began to fail in 2007.
IV. The Housing Bubble
The low Fed interest rates and lack of regulation allowed banks to make higher risk loans,
which made purchasing homes more attractive. Prices on homes began to sky rocket as demand
surged, but in 2005, the housing bubble burst. The graphs below reveal the major increase in
housing prices.
The graph above shows the housing bubble, as building costs are lower than housing prices.
5 Forbes, (2008). Structured Investment Vehicle- SIV. Retrieved July 2008, from Investopedia Web site:
http://www.investopedia.com/terms/s/structured-investment-vehicle.asp

The chart above reveals home price appreciation by state. Notice that the bubble affected
most states dramatically by 2006. Banks and other mortgage lenders noticed weakness in the
housing market. New houses sit unsold and foreclosures rise as people who bought homes with
adjustable-rate mortgages see sharp spikes in their monthly payments. Central bankers and other
watchdogs are caught by surprise. The question in many boardrooms became: What else is at
risk? (Washington Post, 06.16.08) Editing this paragraph in summer of 2009, it appears that this
was indeed the question.
V. The Housing Bubble Bursts and the Damage Begins
In 2006, prices are flat and home sales fall, causing a major build up in inventory. Home
construction also began to fall. By mid August, the U.S. Home construction Index was down by
over 40% compared to August of 2005. Major foreclosures are occurring as seen in the figure
below. By the fourth quarter of 2007, 2% of all mortgage borrowers were delinquent. This rate is
almost twice as much as the rate from the end of 2008.6 Yet very few are able to extrapolate
from this sector‘s damage to a full blown credit crisis.
6Bernanke, B. (May 05, 2008). Mortgage Delinquencies and Foreclosures. Board of Governor's of the Federal
Reserve System, June 2008, from http://www.federalreserve.gov/newsevents/speech/Bernanke20080505a.htm

VI. Balance Sheets: What a Credit Crisis looks like from the Inside
“At the top of the credit cycle, the income statement for a financial institution shows ‘the best of
times’ – but buried in the balance sheet is ‘the worst of times’ to come.‖ –Minyan Peter
According to The New York Times Dictionary of Money and Investment, a balance sheet
is ―A summary of a company‘s assets, liabilities, and net worth at a moment in time.‖ A bank‘s
balance sheet reveals all of its financial successes, or rather, its losses. The balance sheet tells the
story of the crisis from the inside, where banks are writing off billions of dollars by the quarter.
Where did it all go wrong?
In 2005, Countrywide Financial became the largest mortgage lender in the United States.7
As indicated by Paul Muolo and Mathew Padilla‘s book ―Chain of Blame,‖ the CEO of
Countrywide, Angelo Mozilo, made Countrywide dominate the mortgage market and wrote more
7 Julio Rotemberg, Subprime Meltdown: American Housing and Global Financial Turmoil (Harvard Business
School: 2008) 4.

subprime loans than any other firm. Countrywide even ranked as the fourth largest public firm by
market capitalization earning $19,588.1 in millions in market capitalization and $13,469.3 in
millions according to reports on 7/7/04, which are up from the results of 7/7/03 where
Countrywide has $9.469.3 in millions in market capitalization and $10,663.1 in millions in
revenues.8 So, what happened to Countrywide‘s success?
―By the second quarter of 2007, loan delinquencies were rising to 20 year highs.
Subprime borrowers were defaulting on their payments. Since 2002, subprime lending accounted
for 20% of new mortgages written in the US. In the past 5 years, home lenders originated $2.6
trillion in mortgages to people with bad credit. Home prices were falling to 5-year lows.
Countrywide wrote more subprime loans than anyone else, and became part of the story when
there were doubts about the ability for subprime borrowers to pay on mortgages backed by
homes that were now worth less.‖
―Countrywide‘s earnings were down by 1/3 to $400 million by the second quarter results
of 2007. Fifteen out of every 100 loans in the US were closed by Countrywide, which measures
the size of loans made by Countrywide. Mozilo, CEO of Countrywide, made comments in a
press conference in 2007; ―We are experiencing a huge price depression, one we have not seen
before-not since the Great Depression.‖ These comments caused damage to the stock market, as
people feared another crash and the Dow Jones Industrial Average decreased by 226 points.
Within a month, the average would fall by 1000 points. Kenneth Bruce wrote a research report
on Countrywide and predicted with enough ―financial pressure‖ it could go bankrupt. People
began to pull money out of Countrywide because of a fear of bankruptcy, even though
8 http://findarticles.com/p/articles/mi_m5072/is_29_27/ai_ni14864352
Countrywide had $190 billion in loans it could lend out. Countrywide was able to borrow this
money from other Wall Street firms.‖
―Because of the fear of bankruptcy, investors in Countrywide‘s stock had seen billions of
dollars in value disappear. Countrywide could go belly-up because of the mortgage market
meltdown- 20% of home borrowers were subprime borrowers and the market seized up- home
prices were falling and defaults were rising. Because of Bruce‘s comments about bankruptcy,
Countrywide was facing major damage, even though it had earned almost $2 billion the year
before. Countrywide‘s shares kept decreasing in value- Bank of America invested $2billion in
preferred stock that was convertible to common stock which paid a 7.25% dividend. But by
January 2008, Countrywide‘s shares were down to $8, causing Bank of America to also have
losses of well over $1 billion.‖9 On January 11, 2008, Bank of America bought Countrywide for
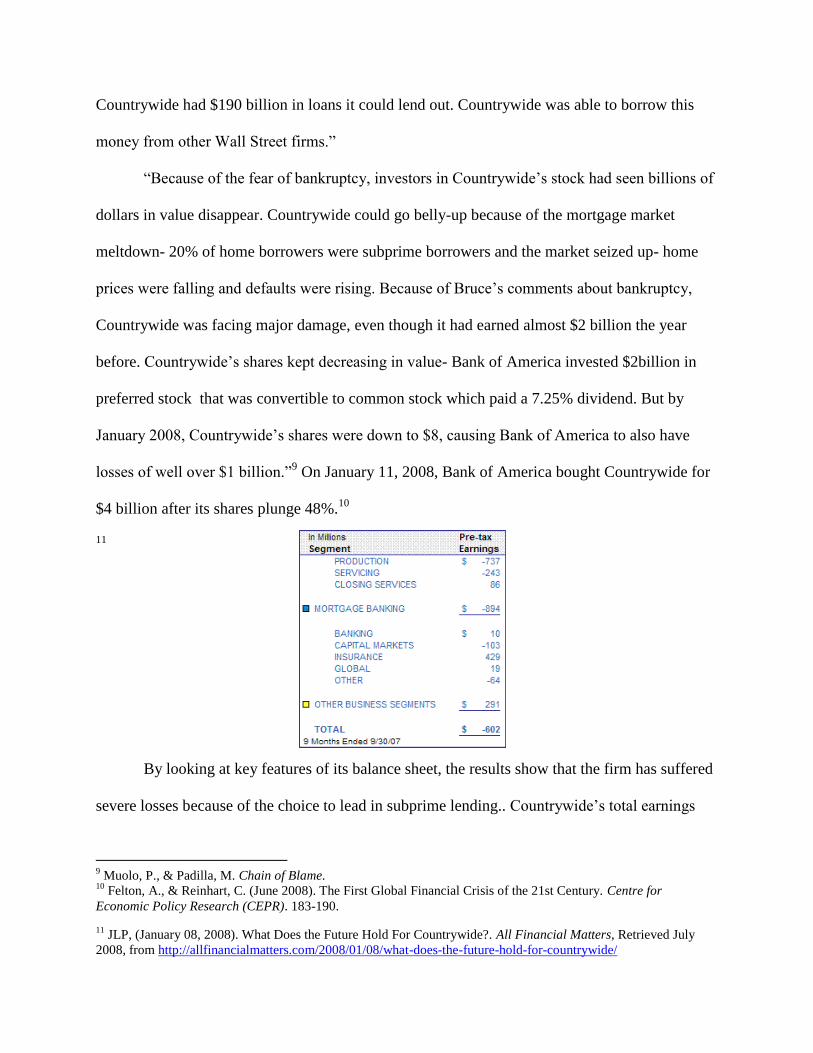
$4 billion after its shares plunge 48%.10
11
By looking at key features of its balance sheet, the results show that the firm has suffered
severe losses because of the choice to lead in subprime lending.. Countrywide‘s total earnings
9 Muolo, P., & Padilla, M. Chain of Blame.
10 Felton, A., & Reinhart, C. (June 2008). The First Global Financial Crisis of the 21st Century. Centre for
Economic Policy Research (CEPR). 183-190.
11 JLP, (January 08, 2008). What Does the Future Hold For Countrywide?. All Financial Matters, Retrieved July
2008, from http://allfinancialmatters.com/2008/01/08/what-does-the-future-hold-for-countrywide/

are negative, as shown in the chart above. Nearly 36% of Countrywide‘s subprime loans were
delinquent at the end of March 2007. The firm faced a liquidity crisis; 61% of its capitalization
($15 billion) evaporated in 2007 due to rising default rates.12
The stock price graph above is a one year chart for Countrywide Financial. It‘s stock
price has gone from over $45 per share to $5.47 (January 07 closing price) over the last year.
This chart shows Countrywide going bankrupt, as the value of its market shares are decreasing
drastically.13
Countrywide Financial had a press release from PRNewswire on April 29, 2008
about its first quarter results. The firm reported a net loss of $893 million. Essentially,
Countrywide collapsed because the mortgage market continued to collapse and people could not
pay on their mortgages. No one would buy mortgages anymore and there was no money
available to make new mortgages, causing major losses. But, Countrywide is not the only firm
who experienced major losses.
VII. The Spillover of the Mortgage Crisis into the Credit Crisis: Bank Losses and Federal
Reserve Actions: A Brief Timeline14
In 2006, we see the first mortgage company file for bankruptcy. On December 28, 2006,
Ownit Mortgage Solutions files for bankruptcy. 15
We begin the see the spillover of the mortgage
12
JLP, What Does the Future Hold For Countrywide?. 13
JLP, What Does the Future Hold For Countrywide?. 14
Felton, A., & Reinhart, C. The First Global Financial Crisis of the 21st Century. 15
Felton, A., & Reinhart, C. The First Global Financial Crisis of the 21st Century.
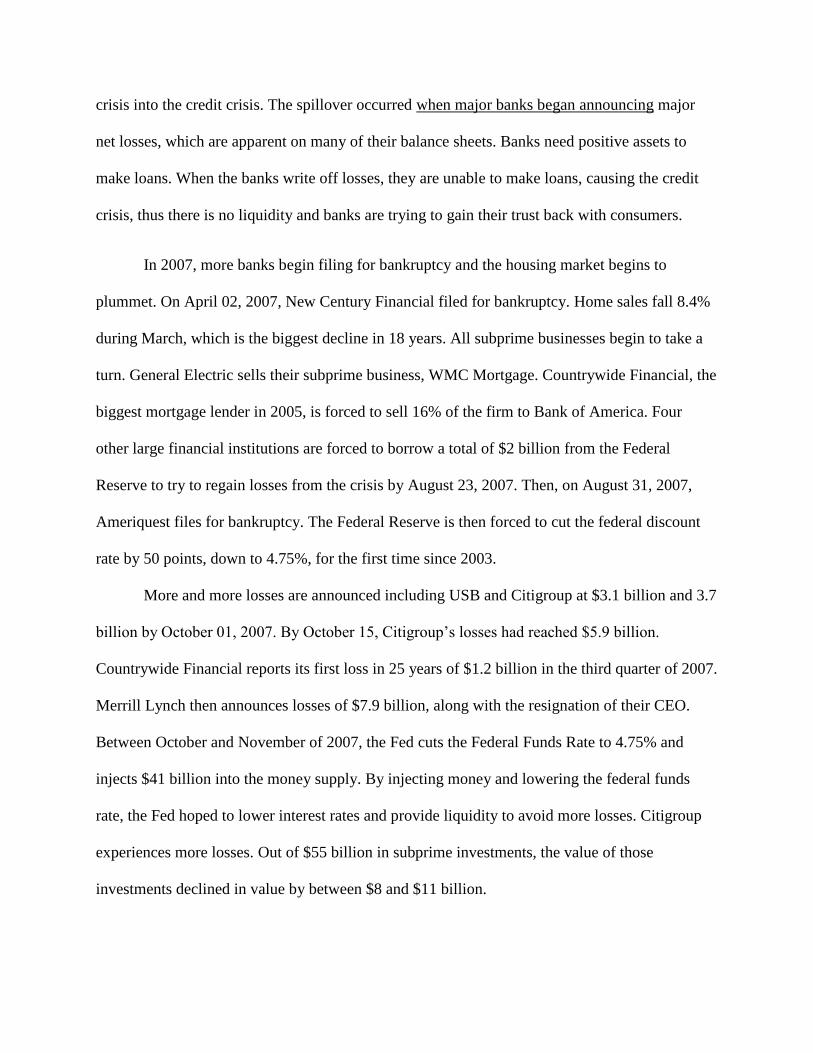
crisis into the credit crisis. The spillover occurred when major banks began announcing major
net losses, which are apparent on many of their balance sheets. Banks need positive assets to
make loans. When the banks write off losses, they are unable to make loans, causing the credit
crisis, thus there is no liquidity and banks are trying to gain their trust back with consumers.
In 2007, more banks begin filing for bankruptcy and the housing market begins to
plummet. On April 02, 2007, New Century Financial filed for bankruptcy. Home sales fall 8.4%
during March, which is the biggest decline in 18 years. All subprime businesses begin to take a
turn. General Electric sells their subprime business, WMC Mortgage. Countrywide Financial, the
biggest mortgage lender in 2005, is forced to sell 16% of the firm to Bank of America. Four
other large financial institutions are forced to borrow a total of $2 billion from the Federal
Reserve to try to regain losses from the crisis by August 23, 2007. Then, on August 31, 2007,
Ameriquest files for bankruptcy. The Federal Reserve is then forced to cut the federal discount
rate by 50 points, down to 4.75%, for the first time since 2003.
More and more losses are announced including USB and Citigroup at $3.1 billion and 3.7
billion by October 01, 2007. By October 15, Citigroup‘s losses had reached $5.9 billion.
Countrywide Financial reports its first loss in 25 years of $1.2 billion in the third quarter of 2007.
Merrill Lynch then announces losses of $7.9 billion, along with the resignation of their CEO.
Between October and November of 2007, the Fed cuts the Federal Funds Rate to 4.75% and
injects $41 billion into the money supply. By injecting money and lowering the federal funds
rate, the Fed hoped to lower interest rates and provide liquidity to avoid more losses. Citigroup
experiences more losses. Out of $55 billion in subprime investments, the value of those
investments declined in value by between $8 and $11 billion.
In November, Morgan Stanley announced a $3.7 billion dollar mortgage loss; Wachovia
announced another $1.7 billion loss; Bank of America announced a $3 billion loss in subprime
alone; and Freddie Mac announced a $2 billion loss. Again, the Federal Funds Rate was lowered
by another 25 base points down to 4.25% and made $20 billion available to commercial banks in
December 2007. In December, Washington Mutual‘s losses reached $1.6 billion and Citigroup
took $49 billion worth of SIV assets back on their balance sheets. Because Morgan Stanley‘s
subprime losses reached $9.4 billion, they were forced to sell 9.9% stake in the company. By
January 2008, Bear Stearns announced $1.9 billion in subprime losses. Merrill Lynch doubles
their subprime losses to $15 billion. Citigroup reports a $9 billion loss for the fourth quarter, not
including an $18 billion loss in the mortgage portfolio. By February 2008, ―AIG announces
fourth-quarter 2007 losses of $5.3 billion due to more than $11billion of losses on its credit-
default swap portfolio.
The investment firm, Carlyle Capital, defaults on $17 billion of debt. The fund is
leveraged more than 30:1 and invests mostly in agency-backed residential mortgage-backed
securities (RMBS).The investment bank Bear Stearns is acquired by JPMorgan Chase for $2 per
share. Bear Stearns stock had been trading at $60 the previous week before a run pushed
it to near insolvency. The Federal Reserve Bank of New York agrees to guarantee $30 billion of
Bear Stearns assets, mostly mortgage-related.
The Federal Reserve cuts the federal funds rate by 75 basis points to 2.25%.JPMorgan
Chase raises its bid for Bear Stearns to $10 per share and agrees to indemnify the Federal
Reserve Bank of New York against the first $1 billion of losses on the $30 billion that it
guaranteed. The IMF‘s Global Financial unit estimates that the total credit losses will be $1
trillion. Citigroup announces another $12 billion of losses related to subprime mortgages,
leveraged loans, exposure to monoline insurers, auction-rate securities and consumer credit. By
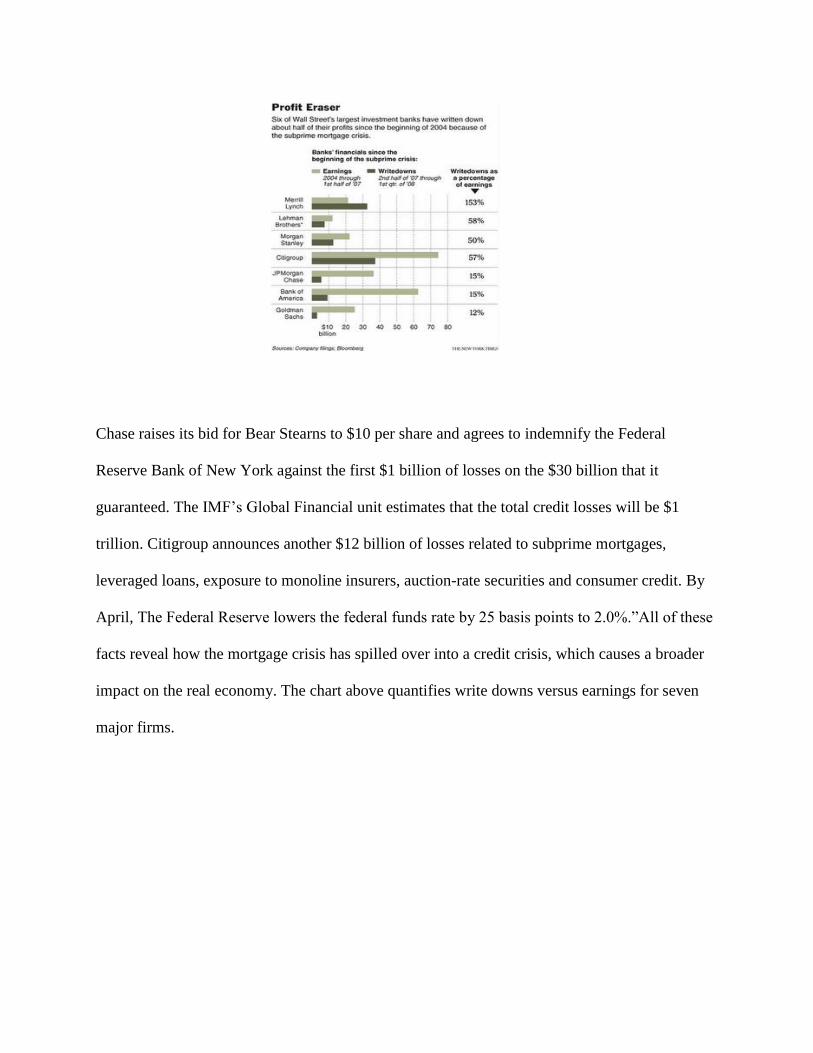
April, The Federal Reserve lowers the federal funds rate by 25 basis points to 2.0%.‖All of these
facts reveal how the mortgage crisis has spilled over into a credit crisis, which causes a broader
impact on the real economy. The chart above quantifies write downs versus earnings for seven
major firms.
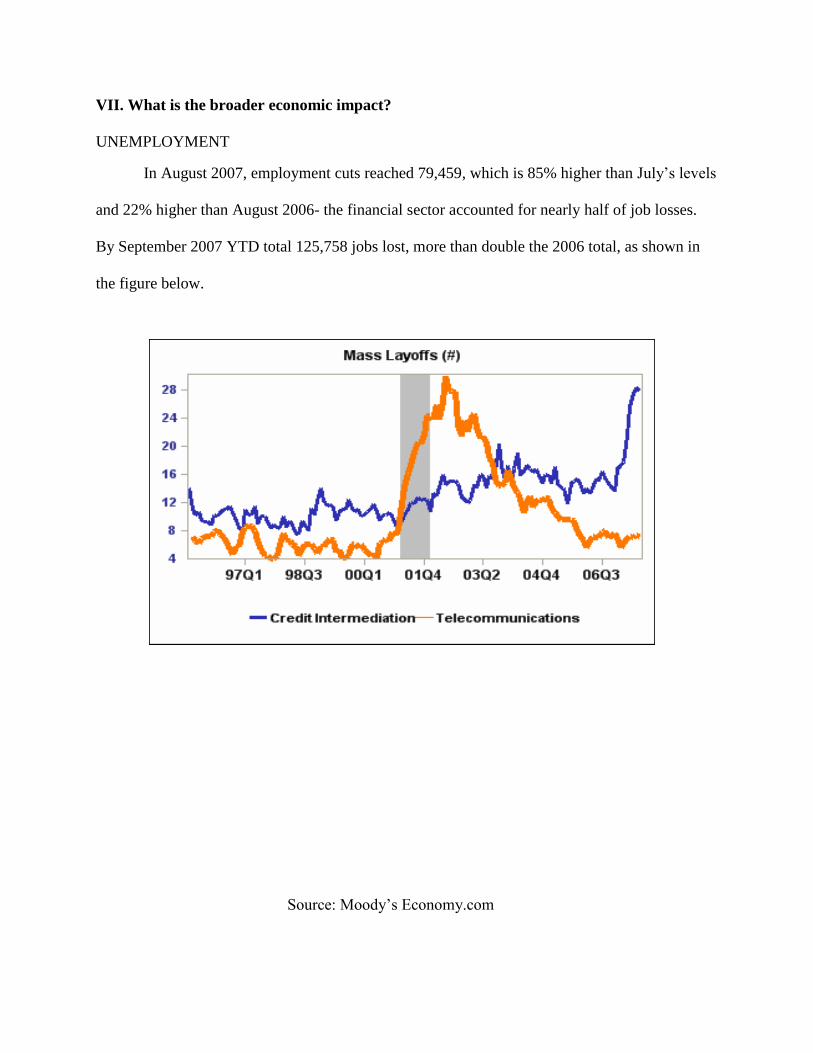
VII. What is the broader economic impact?
UNEMPLOYMENT
In August 2007, employment cuts reached 79,459, which is 85% higher than July‘s levels
and 22% higher than August 2006- the financial sector accounted for nearly half of job losses.
By September 2007 YTD total 125,758 jobs lost, more than double the 2006 total, as shown in
the figure below.
Source: Moody‘s Economy.com

The next figure also shows the unemployment effects of the credit crisis. Many parts of
the country show increases in unemployment rates and mortgage delinquencies. ―The data
suggest that increases in unemployment rates account for at least some of the recent increases in
mortgage delinquencies.‖ 16
STOCK MARKET LOSS
According to the S&P 500, as of September 2007, the financial service sector became
largest sector moving ahead of both technology and energy - it increased from a weight of
roughly 5% in 1980 to nearly 22% currently. ―As interest rates reflect the cost of credit, falling
interest rates have led to an increase in the demand for credit as it has become cheaper to borrow,
which fueled the growth of the financial sector.‖17
Refer to Figure 1 which shows the growth of
the financial sector.
16
Bernanke, B. (May 05, 2008). Mortgage Delinquencies and Foreclosures. 17
Puplava, C. (September 05, 2007). Will Financials Be to This Bull Market and Economy. Financial Sense Wrap-
Up, Retrieved June 2008, from http://www.financialsense.com/Market/cpuplava/2007/0905.html
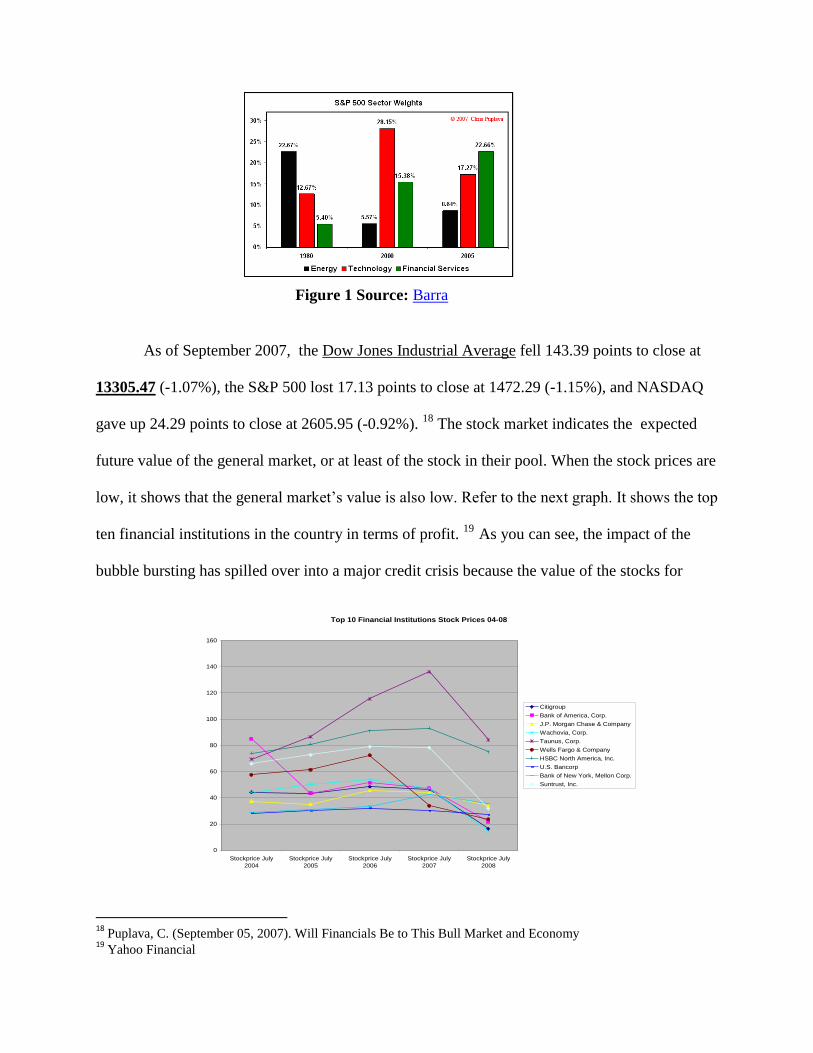
Figure 1 Source: Barra
As of September 2007, the Dow Jones Industrial Average fell 143.39 points to close at
13305.47 (-1.07%), the S&P 500 lost 17.13 points to close at 1472.29 (-1.15%), and NASDAQ
gave up 24.29 points to close at 2605.95 (-0.92%). 18
The stock market indicates the expected
future value of the general market, or at least of the stock in their pool. When the stock prices are
low, it shows that the general market‘s value is also low. Refer to the next graph. It shows the top
ten financial institutions in the country in terms of profit. 19
As you can see, the impact of the
bubble bursting has spilled over into a major credit crisis because the value of the stocks for
18
Puplava, C. (September 05, 2007). Will Financials Be to This Bull Market and Economy 19
Yahoo Financial
Top 10 Financial Institutions Stock Prices 04-08
0
20
40
60
80
100
120
140
160
Stockprice July
2004
Stockprice July
2005
Stockprice July
2006
Stockprice July
2007
Stockprice July
2008
Citigroup
Bank of America, Corp.
J.P. Morgan Chase & Company
Wachovia, Corp.
Taunus, Corp.
Wells Fargo & Company
HSBC North America, Inc.
U.S. Bancorp
Bank of New York, Mellon Corp.
Suntrust, Inc.
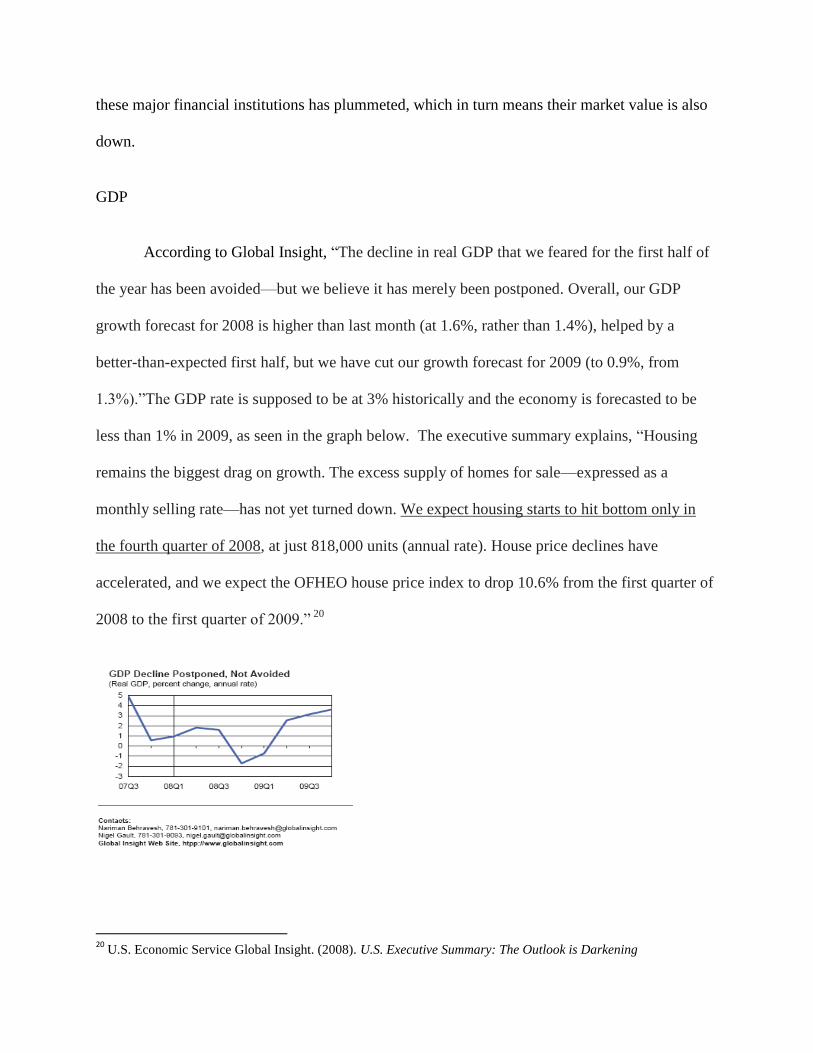
these major financial institutions has plummeted, which in turn means their market value is also
down.
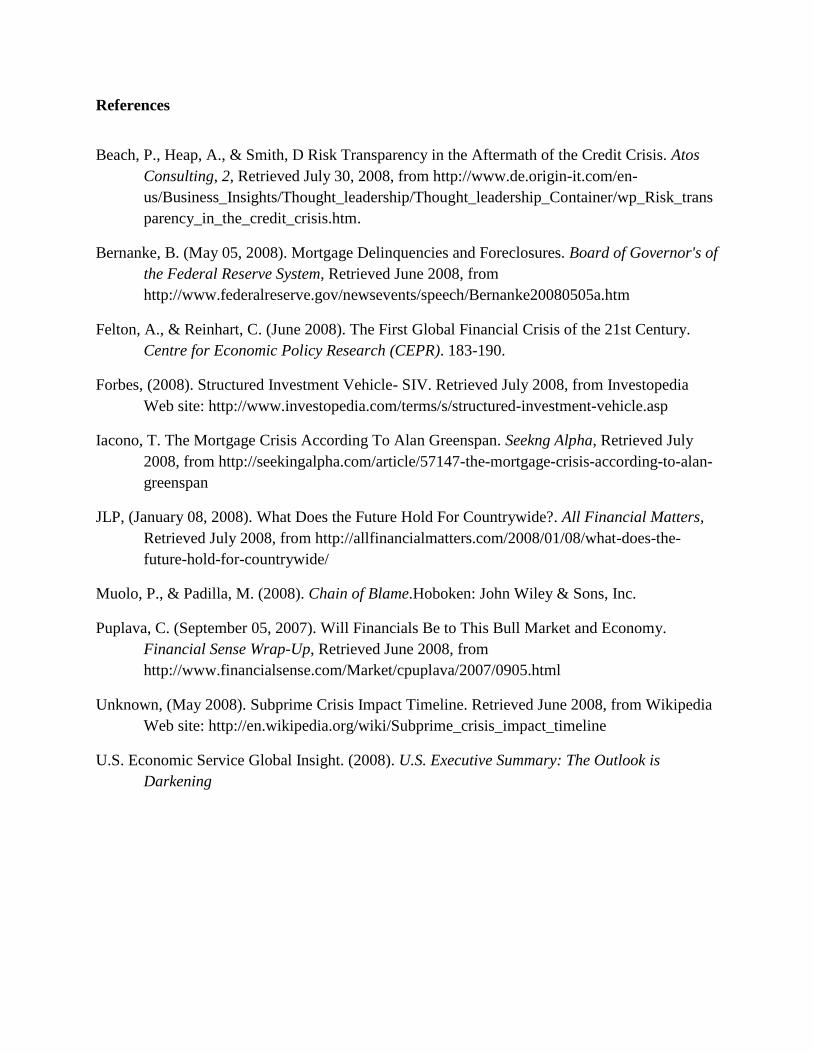
GDP
According to Global Insight, ―The decline in real GDP that we feared for the first half of
the year has been avoided—but we believe it has merely been postponed. Overall, our GDP
growth forecast for 2008 is higher than last month (at 1.6%, rather than 1.4%), helped by a
better-than-expected first half, but we have cut our growth forecast for 2009 (to 0.9%, from
1.3%).‖The GDP rate is supposed to be at 3% historically and the economy is forecasted to be
less than 1% in 2009, as seen in the graph below. The executive summary explains, ―Housing
remains the biggest drag on growth. The excess supply of homes for sale—expressed as a
monthly selling rate—has not yet turned down. We expect housing starts to hit bottom only in
the fourth quarter of 2008, at just 818,000 units (annual rate). House price declines have
accelerated, and we expect the OFHEO house price index to drop 10.6% from the first quarter of
2008 to the first quarter of 2009.‖ 20
20
U.S. Economic Service Global Insight. (2008). U.S. Executive Summary: The Outlook is Darkening

The Executive Summary also explains that ―The Deflationary Impact of the
Housing/Subprime Crisis Will Linger Through Next Year: Despite early evidence that the worst
of the housing-related credit crunch may be behind us, financial markets and the economy are
not out of the woods yet. Home prices and housing activity continue to fall. Housing starts and
residential construction are unlikely to hit bottom until the end of this year or early next year.
Similarly, home prices will probably keep falling through early 2009. The harsh reality that
banks are being hit with a double whammy—a stock market that is in bear territory and
mortgage-backed securities whose value keeps plummeting—is making the hunt for new capital
that much tougher. In other words, the financial sector continues to struggle, and credit remains
tight.‖21
VIII. Conclusion and Future Work
Initially, this was going to be a paper investigating the ethics of the financial crisis.
Unfortunately, at this time, (August 2008) very few authors have written on the subject and there
was not enough source material to pursue a summer research project in this area. Revising this
paper for submission in August of 2009, it appears that both the economic forecasters and the
ethics forecasters were asleep at the wheel.
Knowing that ethics has to be based on a factual foundation, we instead decided to trace
the evolution of the mortgage crisis into what was to become a major credit crisis. We have
shown some of the major causes of the crisis. We linked the crisis to the micro foundations of
bank balance sheets and we took a closer look at Country Wide to see what transpired in a
typical firm which speculated in a highly leveraged sector. We then started to enter some ethical
21
U.S. Economic Service Global Insight. (2008).

territory by trying to assess the damage done to the broader economy by the innovative mortgage
products and the new taste for risk and leverage the market seemed willing to absorb. The major
forecasting houses have done their best to assess the damage to GDP, employment and the stock
markets. In hindsight, the forecasters missed the mark by plenty. The Dow was still at 13,000
and no one knew the pain ahead. At the time of this writing, ethics was in the air, but by the
summer of 2009, it is very interesting that the ethics have faded from conversation and now
politics is in the air. The talk is all about government intervention and regulation. It will be very
interesting to see how we assess this crisis when we can look back with solid data and when
hopefully the Dow is back to at least 12,000. We would like to be optimistic and hope that an
ethical assessment would be forthcoming in the future but the winds are not blowing in that
direction at the moment. We will do our best to follow the story and deliver an ethical
assessment at next year‘s Informs.
References
Beach, P., Heap, A., & Smith, D Risk Transparency in the Aftermath of the Credit Crisis. Atos
Consulting, 2, Retrieved July 30, 2008, from http://www.de.origin-it.com/en-
us/Business_Insights/Thought_leadership/Thought_leadership_Container/wp_Risk_trans
parency_in_the_credit_crisis.htm.
Bernanke, B. (May 05, 2008). Mortgage Delinquencies and Foreclosures. Board of Governor's of
the Federal Reserve System, Retrieved June 2008, from
http://www.federalreserve.gov/newsevents/speech/Bernanke20080505a.htm
Felton, A., & Reinhart, C. (June 2008). The First Global Financial Crisis of the 21st Century.
Centre for Economic Policy Research (CEPR). 183-190.
Forbes, (2008). Structured Investment Vehicle- SIV. Retrieved July 2008, from Investopedia
Web site: http://www.investopedia.com/terms/s/structured-investment-vehicle.asp
Iacono, T. The Mortgage Crisis According To Alan Greenspan. Seekng Alpha, Retrieved July
2008, from http://seekingalpha.com/article/57147-the-mortgage-crisis-according-to-alan-
greenspan
JLP, (January 08, 2008). What Does the Future Hold For Countrywide?. All Financial Matters,
Retrieved July 2008, from http://allfinancialmatters.com/2008/01/08/what-does-the-
future-hold-for-countrywide/
Muolo, P., & Padilla, M. (2008). Chain of Blame.Hoboken: John Wiley & Sons, Inc.
Puplava, C. (September 05, 2007). Will Financials Be to This Bull Market and Economy.
Financial Sense Wrap-Up, Retrieved June 2008, from
http://www.financialsense.com/Market/cpuplava/2007/0905.html
Unknown, (May 2008). Subprime Crisis Impact Timeline. Retrieved June 2008, from Wikipedia
Web site: http://en.wikipedia.org/wiki/Subprime_crisis_impact_timeline
U.S. Economic Service Global Insight. (2008). U.S. Executive Summary: The Outlook is
Darkening