
The Molecular Spectrum of Hydrogen and Its...
24
JOURNAL OF MOLECULAR SPECTROSCOPY 2, 494-517 (19%) The Molecular Spectrum of Hydrogen and Its Isotopes* G. H. DIEKE The Johns Hopkins University, Baltimore, Maryland The spectra of all six known isotopic species of molecular hydrogen, HP , DH, Ds , TH, TD, TZ have been obtained with high dispersion under several excitation conditions. This has led to a complete wavelength table of these spectra containing about 100,000 different lines. The principal band systems have been found in all six spectra and a comparison of the isotopes has resulted in the clarification of many previously doubtful points. A complete table of all known Hz-levels is included. The hydrogen molecule has the distinction of being the simplest of all possible molecules that show the typical molecular properties. It is true that H2+ with only one electron is even simpler, but the molecular ion has no known spectrum and therefore there is practically no detailed empirical knowledge of its proper- ties. The situation is much more favorable for the neutral hydrogen molecule. It forms a quantum mechanical system, the structure of which is simple enough so that all its fundamental properties can be calculated with any desired ap- proximation. On the other hand there is considerable complexity, so that it is not always simple to see whether a particular approximation is sufficient to represent adequately the desired properties. For this reason it is important to be able to compare the calculated properties with the empirical data which are most abundantly obtained from the analysis of its spectrum. It is fortunate that the data obtained from the molecular hydrogen spectrum are richer than for any other molecular spectrum. With most molecules only a few electronic levels can be studied with sufficient detail. In the molecular hy- drogen spectrum there is a great variety of electronic levels each one with its superimposed vibrational and rotational structures. The particular conditions in the hydrogen spectrum bring out also clearly the various possible interactions the interpretation of which is usually far from easy in other molecules. Additional reasons could be brought forward why a study of the structure of the hydrogen molecule and its spectrum is of more than usual importance. The hydrogen molecule contains all the essential features of the more complicated * Work carried out with support of the U. S. Atomic Energy Commission. 494
Transcript of The Molecular Spectrum of Hydrogen and Its...

JOURNAL OF MOLECULAR SPECTROSCOPY 2, 494-517 (19%)
The Molecular Spectrum of Hydrogen and Its Isotopes*
G. H. DIEKE
The Johns Hopkins University, Baltimore, Maryland
The spectra of all six known isotopic species of molecular hydrogen, HP , DH, Ds , TH, TD, TZ have been obtained with high dispersion under several excitation conditions. This has led to a complete wavelength table of these spectra containing about 100,000 different lines. The principal band systems have been found in all six spectra and a comparison of the isotopes has resulted in the clarification of many previously doubtful points. A complete table of all known Hz-levels is included.
The hydrogen molecule has the distinction of being the simplest of all possible molecules that show the typical molecular properties. It is true that H2+ with only one electron is even simpler, but the molecular ion has no known spectrum and therefore there is practically no detailed empirical knowledge of its proper- ties.
The situation is much more favorable for the neutral hydrogen molecule. It forms a quantum mechanical system, the structure of which is simple enough so that all its fundamental properties can be calculated with any desired ap- proximation. On the other hand there is considerable complexity, so that it is not always simple to see whether a particular approximation is sufficient to represent adequately the desired properties. For this reason it is important to be able to compare the calculated properties with the empirical data which are
most abundantly obtained from the analysis of its spectrum. It is fortunate that the data obtained from the molecular hydrogen spectrum
are richer than for any other molecular spectrum. With most molecules only a few electronic levels can be studied with sufficient detail. In the molecular hy- drogen spectrum there is a great variety of electronic levels each one with its superimposed vibrational and rotational structures. The particular conditions in the hydrogen spectrum bring out also clearly the various possible interactions
the interpretation of which is usually far from easy in other molecules.
Additional reasons could be brought forward why a study of the structure of
the hydrogen molecule and its spectrum is of more than usual importance. The
hydrogen molecule contains all the essential features of the more complicated
* Work carried out with support of the U. S. Atomic Energy Commission.
494

SPECTRUM OF HYDROGEN 195
molecules which are distinguished from atoms by the presence of vibrational and rotational mot,ion in addition to electronic motion. Interactions between the three types of motion, often obscured in the heavier molecules, can be studied without undue ~or~~plications in the hydrogen molecule for two reasons. In the first place, the possibility of comparing the empirical states with theoretical ones calculated on the basis of the principles of quantum mechanics removes any doubts about the interpretation of the states. In the second place the inter- actions are usually much more prominent for the hydrogen molecule than for the heavier ones and therefore more easily re~ogllized. The situation became even more favorable when the isotope deut’erium was discovered in 1930 aud shortly afterward it was possible to study the molecules DH and D’L in addition to HZ . This virtually tripled the available empirical data. It provided an opportunity, in cases where the interpretation of t,he Hz spectrum presented difficulties, to obtain further informat.ion from the spectra of the other isotopic species.
From all these considerations it was decided in this laboratory in the early thirties that considerable effort was justified to deepen the study of the hydrogen molecule. Work carried out at Johns Hopkins University resulted in a wavelength table of the DH and Dz spect,ra and the cornp~~risoll of the three molecules great,ly clarified the interpretation of t,he results and lead to more accurate values of the molecular constants (1).
A further powerful stimulus was received when after the war the radioactive isotope tritium became ava,ilable in sufficient quantities so that the spect,ra of three additio~~al isotopic species TH, TD, and Tz could be obtained. An explora- tory study of these spectra at the Argonne Laboratory during the summer of 1918 with the collaboration of Dr. F. Tomkins proved so promising that it seemed advisable to broaden the study of the spectrum of the hydrogen molecule to include all six known isotopic species Hz , DIS, D? , TH, TD, and Tz and obtain their spe&a with as great completeness and accuracy ax possible so that, t.hrrc would be a secure basis for a detailed theoretical analysis of the molecule.
This program, support,ed by the Atomic Energy Commission has been carried out at Johns Hopkins University since 19% It proved a task of considerable magnitude ;bs the following di~cussio~l will show. I’rogress has been as rapid as the available means permitted. Several phases of the program are now completed or nearing completion. Some results have been published (2), ot,hers will appear in the near future.
The present account, is intended as a general introdu~t,ion to the more spe- cialized papers and to answer the many inquiries about the progress of the work. It is planned to publish eventually a monograph containing all wavelength tables with classification and other data.
The work on the present program is concerned primarily with the spectrum between 30OOh and 3 microns. The most, recent info~ation on the spectrum in

496 DIEKE
the vacuum ultraviolet can be obtained from the papers of Jeppesen, Tanaka, and Namioka (3) for Hz , of Jeppesen and Wada ((f) for DH and Jeppesen (5) for Dz . The far ultraviolet spectra from which the information about the nor- mal state of the molecule is derived of the isotopic species TH, TD, and T2 have not been obtained so far. As the structure of the normal state is very regular probably no signi~cant additional infornlation can be secured from the far ultra- violet spectra containing tritium. Obtaining these spectra would mean sacrificing a vacuum spectrograph as contamination with tritium probably would ruin the spectrograph for other work. The excited states which are involved in the ultra- violet spectra can be obtained with much greater accuracy from the visible spec- trum.
PRODUCTION AND RECORDING OF THE SPECTRUM
Any gas discharge in pure hydrogen will produce the molecular spectrum of hydrogen in emission. The atomic spectrum can never be completely suppressed but its intensity can be greatly reduced by silvering the walls of the discharge tube lightly in order to render them good catalyzers for the recombination of the atoms formed by the discharge. The particular design of discharge tube was largely dictated by the necessity of obtaining the spectrum with great intensity so that also the weak lines can be recorded. We used extensively two types of discharge tubes. Both of t,hem were made entirely of quartz which made it pos- sible to use high power levels without fear of breakage. Many of our tubes have been operated for hundreds of hours without any noticeable deterioration.
The first type was a tube developed during the early stages of the work (6’). It consisted of a horizontal tube of about &mm internal diameter viewed end on with large metal electrodes in side tubes (nickel in the final version, aluminum, iron, and tantalum in earlier attempts). The whole discharge tube was immersed in a tank of running water for effective cooling. Currents of 1.5 A could be passed through the tubes supplied by a 6500- or 13,0~-volt lo-kw transfo~er.
With this tube the spectrum could be obtained with the lines everywhere dense. This means that the lines are so close together that longer exposures will not produce more lines but will only make the stronger lines flow together. Exposure times from 30 minutes to 48 hours were required for this, depending on the spec- tral region.
While this kind of tube works in general very satisfactorily it has certain draw- backs. The electrodes take up large quantities of hydrogen and this makes it di~cult to keep the pressure consent. The electrodes must be outgassed initially by a rather long drawn out procedure. Nevertheless under certain discharge con- ditions they are liable to give off considerable amounts of impurities notably CO and possibly other compounds containing carbon. This takes place, for instance, if through gas cleanup the hydrogen pressure becomes too low and consequently

SPECTRUM OF HYUROGEK 497
the electrodes become very hot. Under such circumstances the color of the dis-
charge changes abruptly to bluish white and the Hz spectrum is completely re- placed by the spectrum of CO, Cz and hydrocarbons. When t,he Hz pressure is increased again, these impurit,ies may be completely reabsorbed by the electrodes
so that a pure Hz spectrum will again reappear. These shortScomings wzre felt particularly for TS where, because of smaller
quantities of gas available, and because of limitations on the kinds of mnnipu-
lntions that could be perforn~ed because of its radi~~ti~~it,y, t,he tube could not
he conditioned as carefully as for Hz and Dt . In order to avoid the objectionable
features an electrodeless tube (7) was developed with which most of t,he later
experiments were made. This was a simple cylil~drica,l tube of 8-mm ext,ernal diameter, which fitted
in a microwave cavity and was excited by a X50-MC microwave generator. It
was easy t’o outgas this t’ube completely which was important for Tz because traces of wat,er vapor remaining in the tube walls could later dilute the Tz gas
with ordinary hydrogen. The imensity of the discharge in this tube was as strong as that of t’he first tube even though only a 100-watt generator was used while the output of a lo-kw transformer was needed to run the larger tube.
Hydrogen gas was supplied in t,he earlier stages by passing it through a heated
paltadium tube. This is quite satisfactory with Hz and produces a very pure gas. It is less satisfactory for D2 and T, as some Ii2 remains in t,he palladium and mixes wit*h t#he rarer isotopes. It cannot be driven out satisfactorily because t,hose parts of the palladi~lm tube sealed into glass cannot be heatSed su~cie~~tly. Much better
results are obtained (7) by supplying hydrogen in the form of IJH, , UDs , or UT, , respectively. This has the advantage that by adjusting t’he temperature suimbly any desired gas pressure can be obtained in n sealed off t,ube. More- over t,hc ~~ral~iunl will a,ct as an efficient gett’er for the removal of all ilnpurit,ies.
For this reason uranium hydride was used in all the later stages. Other types of discharges such as hollow cathode discharges or tubes cooled
by liquid nitrogen were used occasionally when circumstances demanded this. It. had been observed many years ago (8) t,hnt the inLensity distributiol~ in the
molecular hydrogen spectrum is very sensit’ive to the discharge conditions and that, the intensity changes can very profitably be used for the classification of t,he lines.
The paran~eters that can be changed most easily are pressure and temperature, and in the beginning systematic experiments were made to ascertain how a change in t’hese quantities and in other discharge parameters would affect the intensity distribut,io~l. The chief influences are as follows. At low pressures the excit,ation of the spectrum is chiefly by electron l~ombardment. This produces a distribution over the excited stat’es which is very far from an equilibrium distribution. There is :I great excess in vibrational energy and a deficit in rotational energy. At the

498 DIEKE
low pressures there is no opportunity to modify the distribution toward equilib- rium as the molecules radiate before they have an opportunity to exchange energy by collisions. The intensity distribution therefore reflects the original distribution.
As the gas pressure is increased, collisions among the excited molecules take place before radiation and the distribution is changed toward an equilibrium distribution. We have an extreme of this when traces of hydrogen are added to about 200 mm of helium (9). The collisions with the helium atoms do not destroy the excited states of the hydrogen molecule but produce an equilibrium of trans- lational, rotational and vibrational motion. This means that almost all excited vibrational states, i.e., states for which v + 0, disappear and we have a great simplification of the spectrum. High gas pressure favors the triplets while the singlets are enhanced at very low pressures.
In order to be able to make use of this type of intensity changes for the classi- fication of the spectrum we have endeavored to obtain all the spectra under at least three conditions. These are (1) low pressure and low temperature which was obtained by immersing the discharge tube in liquid nitrogen at rather small discharge currents; (2) a normal discharge, i.e., a discharge in hydrogen at about 1 mm pressure where the electrical resistance of the tube is a minimum and there- fore large currents can be used without producing an excessive amount of heat; (3) a discharge in about 200 mm of helium with traces of hydrogen which gives thermal equilibrium of the excited states.
The spectrographs with which the spectra were obtained are as follows. From 3000A to 5000A the second order of a 21-ft grating with 30,000 lines per inch in a Paschen mounting with a dispersion of O.BA/mm. From 5000A to 9000A the first order of the same spectrograph, dispersion 1.25A/mm. From 9000 A to 12,OOOA first order of a 21-ft Wadsworth spectrograph with a dispersion of 5A/mm. 1~ to 3~ with a large photoelectric Ebert mounting spectrograph (10).
The dispersion and resolving power in all parts of the spectrum are larger than hitherto employed for the Hz spectrum. The instruments just mentioned are those on which the plates and records were obtained that served for the wavelength measurements. For intensity measurements and other purposes also other spec- trographs were employed.
In general the resolution of the spectra was not determined by the resolving power of the spectrographs but by the actual line widths. This is particularly true for the last two of the standard discharge conditions. In the low pressure, low temperature discharge the lines are considerably sharper and for instance the pseudo doublet structure of the 2p311 state which is about 0.2 cm-’ is well re- solved under these conditions. This requires a resolving power of 100,000 in the visible.
The total spectrum between 3000A and 12,OOOA fits on 18 plates each 16 inches long. This means that under ideal conditions for the three standard discharge

SPECTRVM OF HYDROGEK 4’3’3
conditions and the six isotopic species ?24 plates are needed. Actually each re- gion must be obtained on a strong exposure for the weak lines and a weaker ex- posure for the strong lines which otherwise would be over-exposed. Moreover, in each exposure the lines near the edges of the plates are lost so that the expo- sure should be repeated with a staggered set of plates. These circumstances bring the minimum number of plates necessary to cover the spectra to well over 1200. Several times this number were actually taken. These numbers illustrate the task involved in obtaining the molecular spectra of hydrogen. The photography of the spectrum is now completed.
WAVELENGTH MEASUREMENTS
During the earlier parts of the work the plates were measured against iron standards in the conventional way. This was a slow process but measurements accumulated at a steady rate nevertheless due to the patience and perseverance of Mrs. D. Wittenberg who carried out the measurements from 1949 to 1954 and Mrs. A. T. Young who has been in charge of the measurements since 1954.
The results obtained suggested improvements in the measuring technique which gradually were tested and incorporated. These improvements increased the accuracy of the measurements and greatly reduced the labor necessary to achieve the desired results.
The standard iron spectrum used as comparison spectrum for wavelength measurements on all the earlier plates was obtained with the traditional I’fund art’. It has been known for a long time that the wavelengths of a number of iron lines are unreliable even in a Pfund arc. In our work it was difficult to avoid such lines as we needed as many lines as the iron spectrum could provide. It turned out, t,hat t,he uncertainties in the iron wavelengths were the greatest single cause that limited the accuracy of the wavelength measurements. For this reason all later exposures were made with the hollow cathode iron discharge as comparison source which is free from these defects (11). Unfortunately we have been some- what> handicapped by the fact t’hat accurate wavelengths for the hollow cathode discharge are known at the present time only for relatively few lines.
The int.roduction of semi-automatic methods of wavelength measurements (1%‘) reduced very considerably the time and labor necessary to carry out the measurements. These methods make it unnecessary to look through a comparator microscope, and the comparator setting is recorded automatically on IBM cards. These cards are fed into a calculator which produces directly the desired wave- lengths. All the later wavelength measurements have been carried out with these methods.
All lines except some very weak ones were measured at least on two plates often on four or five. The agreement between the different measurements shows t,hat, the wavelengths in the visible can he trusted to a few thousands of an

500 DIEKE
angstrom unit, which means to one or two hundredths of a wave number except for broad and confused lines. As the shorter wavelengths are measured with greater wavelength dispersion, the accuracy in wave numbers is about the same at 35308, 5000A, 10,OOOA and 2.5~. All grating measurements are liable to have small constant shifts of a few thousands of an Angstrom unit which cannot be avoided notwithstanding all precautions. When different series of measurements were averaged, corrections were applied for these shifts.
In order to overcome the uncertainties of these shifts recently interferometric measurements have been made, with which to obtain accurate standards. Strong exposures have been obtained for Hz up to 9500A while previous interferometric measurements stopped at 6527A. The interferometric plates contain all but the weakest lines. t Such measurements made earlier by F. Tomkins at the Argonne National Laboratory are available also for part of the Tz spectrum.
The lines on the plates with an excess of helium were usually considerably broader than in the other types of discharge and therefore were not included in the average except when these lines were observed only on such plates.
The program of wavelength measurements is now completed for the spectra of Dz , TH, and TZ and nearly completed for Hz . Considerable work has been done on the TD spectrum. For the DH spectrum there exists only a prewar table which does not come up to our present standards, so that new DH measurements will have to be made.
INTENSITY MEASUREMENTS
During the wavelength measurements intensities were usually estimated on a conventional scale from 0 to 10. Even these rough values are quite useful to estimate changes in the intensity distribution in different discharges, but of course cannot be used when quantitative data are required.
In order to have a more accurate picture of the intensity distribution, several sets of quantitative intensity measurements were made in Hz , Dz , and T=J . Photoelectric methods give the best results but require exceptional control of the discharge conditions, as the lines are measured successively, and the in- tensities have no meaning if the intensity distribution changes during a run which may last several hours. Pressure changes are usually responsible for the unsteadiness. Hydrogen in equilibrium with UHs at a constant temperature should guarantee constant gas pressure. If gas cleanup takes place in the dis- charge there may be a considerable time delay before the equilibrium is restored. After a great deal of experimentation satisfactory conditions for stability could be found.
t At the time of the proof (July 1958) several hundred interferometric HZ wavelengths have been measured with excellent accuracy between 6400 A and 9000 A by H. M. Cross- white and K. Erickson.

SPECTRUM OF HYDROGEN 501
Photographic intensity measurements, on the other hand, are not so sensitive
for changes in the discharge conditions as the intensity variations are averaged in the same way for all lines. However the intensities obtained from unsteady discharges never are of great value as the uncertain averages have no simple
theoretical meaning. For T, a procedure was followed by which the stronger lines were obtained
with photomultiplier tubes. These were then used as standards for photographic
measurements on plates obtained with identical discharge conditions. Improve- ments in the photoelectric technique later made the measurement even of weak lines easier with photoelectric than with photographic techniques.
After a great deal of preliminary work it was decided that the task of obtain- ing systematic quantitative intensities for virtually the whole spectrum under varied discharge conditions was probably not worth the effort. Therefore in the
lat,er stages quantitative intensity measurements were only carried out for se- lected bands in order to study definite problems of intensity distribution (13).
WAVELENGTH TABLES
In order to make effective use of the results obtained in this work it was neces-
sary t’o combine all the information for each line in one comprehensive wave- length table. This must include the averages of all the wavelength measurements,
wave numbers, intensities under the various discharge conditions, classification, information about Zeeman and Stark effect, etc. The large number of lines in- volved presented special problems which could be overcome with modern ma-
chine methods. In the beginning a handwritt#en table was prepared. As more data accumulated
this table had to be revised, which meant usually a complete recopying of the old table with the new information interpolated. This soon became too time
consuming. Moreover it is practically impossible t,o avoid the introduction of errors in the copying process. At the present estimate the whole table will con- tain more than 100,000 different lines. A reasonable estimate is that it takes about one minute to copy the information for one line. This means that it would take one person working a 40-hour week and doing nothing else 42 weeks, or the major part of a year merely to accomplish the copying.
The solution of this problem is to record all information belonging to one line on an IBM card. A machine then can print a complete table in very little time. This preliminary table is then used for all work. Corrections are noted in red to make them conspicuous. When sufficient new material is accumulated the cor- rections are incorporated on the cards and cards for new lines inserted. The ma- chine will print then a revised edition of the table. Such revised editions can be
obtained as often as is warranted by additional material, with the assurance that the copying process cannot introduce any errors.

502 DIEKE
The complete data with the latest revision are always available on the collec- tion of cards. Eventually these cards will be used for the preparation of the final published tables. The only difference between these and the preliminary tables is that a more elaborate printing machine will be used which wili produce tables satisfying also the required standards of appearance. These tables can then be reproduced by photo-offset methods so that nowhere in the whole process is there any possibility for the introduction of errors.
At the present time the preliminary printed table for De is completed. It con- tains more than 27,~ di~erent lines. The Hz-table is more than half completed, the others will be finished as time permits. There is a completed handwritten table for the TH and Tz spectra.
It would be appropriate to compare our tables with previous work existing in the literature. This can be done only for Hz as no previous tables exist for the isotopic species containing deuterium or tritium so that all the information for DH, Dz , TH, TD, and Tz is new.
COMPARISON WITH PREVIOUS WORK
For Hz there exist many previous tables, but we need consider here only the table by Gale, Monk, and Lee (14) and some later additions (15). The numerous earlier tables did not approach this table either in accuracy or completeness. Gale, Monk, and Lee’s table contains about 3060 lines in the wavelength range from 3395 to 89028. The bulk of the measurements are grating measurements with a dispersion of 2.6A/mm and with an estimated accuracy of O.Ol,A or better for most lines, between 0.01 and 0.03A for some. The discharge was at a low gas pressure estimated at somewhat above 0.1 mm with a discharge current of 50 mA. The intensity distribution corresponds to that of our low pressure discharge. Ninety-five lines were interferometric measurements with an estimated prob- able error of 0.001 to 0.003A.
There is in general good agreement between our wavelengths and those of Gale, Monk, and Lee. We found, however, the consistency between our own wavelengths obtained from different plates considerably better than between ours and those of Gale, Monk and Lee so that we did not include their values in our averages except their and other interferometric values which showed excellent agreement with our wavelengths.
Finkelnburg (16) covered the region from 3314A to 48608 with a more power- ful discharge and listed many weak lines not given by Gale, Monk, and Lee. He gave as his mean error f0.005A. We cannot find any correlation between most of these weak lines of Finkelnburg and our own and think it not impossible that they are chiefly due to impurities.
Poettker (17) extended the measurements to 10,700A with a dispersion of 9A/mm. He listed 70 lines beyond 89OOA but according to Gale, Monk, and Lee (ld), his wavelengths show a systematic shift of about 0.3A.

SPECTRUM OF HYDROGEN SOS
We believe that our measurements show considerably better accuracy than any of the values in the literature except for the intetierometric measurements of Gale, Monk, and Lee and some later interferometric values. Moreover our tables are considerably more caomplete. Compare for instance the total of 3130 lines in t,he most complete existing tables’ with the number of more than 27,000 in our completed D? table which number will be exceeded in the Hz table. We find our tables more complete in all regions of the spectrum but par- ticularly in t,he infrared. We have ext’ended t’he spectrum from its previous long wavelength limit at 10,700A to 12,OOOA for photographic recording and to 3 microns with photoconduct,ive recording. IJnder proper discharge conditions we have also ext,ended the spectrum at the short wavelength limit.
The question may be raised as to how nearly perfect our tables are. From what has been said before it is evident that no increase in the number of lines can be expected with longer exposures or more powerful discharges as the lines are everywhere dense now. Higher resolution cannot bring any substantial im- provement either because the width of the lines determines the resolution at- tained now and not the resolving power of the spectrograph. This does not mean, of course, that particular discharge conditions could not be found which would yield some new lines.
As far as the accuracy of the measurements is concerned a compromise had to be made between the highest possible accuracy and the possibility of having the work finished in a reasonable time. Careful large scale interferometric meas- urements on the low pressure discharge would undoubtedly yield somewhat more accurnt,e wavelengths but at the expense of much additional work. Our present, interferometric measurements explore this facet.
The preceding remarks apply chiefly to the spectra of the homologous mole- cules HZ , IlIz, and Tz. The spectra of the three mixed molecules cannot be obt’ained with the same completeness, as the spectrum of TH for instance can- not, he produced without the spectra of Tz and HO being present also. In the most favorable case the intensity ratios of the three spectra would be approximately as 2: 1: 1. Many faint TH lines may therefore he covered by Ts or Hz lines. By obtaining tbe spectrum at several T: H ratios and careful intensity nleasure-
merits many of such faint lines could be discovered and measured. It was not
1 We exclude the Finkelnburg table which contains 3367 lines between 3300 and 4860. For t,he reasons given above we believe that many of the weak lines contained in that table do not belong to HZ We find that in general Gale, Monk, and Lee’s measurements are more accurate than those of Finkelnburg. We believe that Finkelnburg’s criticism of Gale, Monk, and Lee’s procedure is unjustified. These authors used a low pressure low current discharge which has very much sharper lines than the discharge used by Finkelnburg. For this reason accurate interferometric measurements can be made. The evidence seems to indicate that some of our discharge conditions must have yielded even sharper lines’than were obtained by Gale, Monk, and Lee as we were able to resolve the triplet structure which they were not able to do even with the interferometer.
504 DIEKE
thought that this elaborate procedure would be warranted and therefore the spectra of the mixed molecules will not be known with the same completeness as those of the homologous molecules. Nevertheless it is expected that the total number of lines in the spectra of the six isotopic species will exceed l~,~O.
IMPURITIES
While the hydrogen gas used in the discharge tubes was completely free from impurities nevertheless in most types of discharges some impurity lines cannot be avoided. The reason for this is t,hat the discharge attacks the walls of the tube and the main lines of the spectra of the decomposition products are always present. When the tube is quartz a few of the atomic oxygen and silicon lines appear. Oxygen combines with the hydrogen and the OH bands are seen. These are very faint or absent in a weak discharge but become stronger when the power of the discharge is stepped up. The two chief silver lines at 3280 and 3381 always are present from the silver coating of the walls and, if glass is used for the tube walls, the yellow sodium doublet occurs. No other impurity lines besides those mentioned have been noticed in the electrodeless discharges. In the older tubes with nickel electrodes where under certain cir~umstall&es CO is evolved the
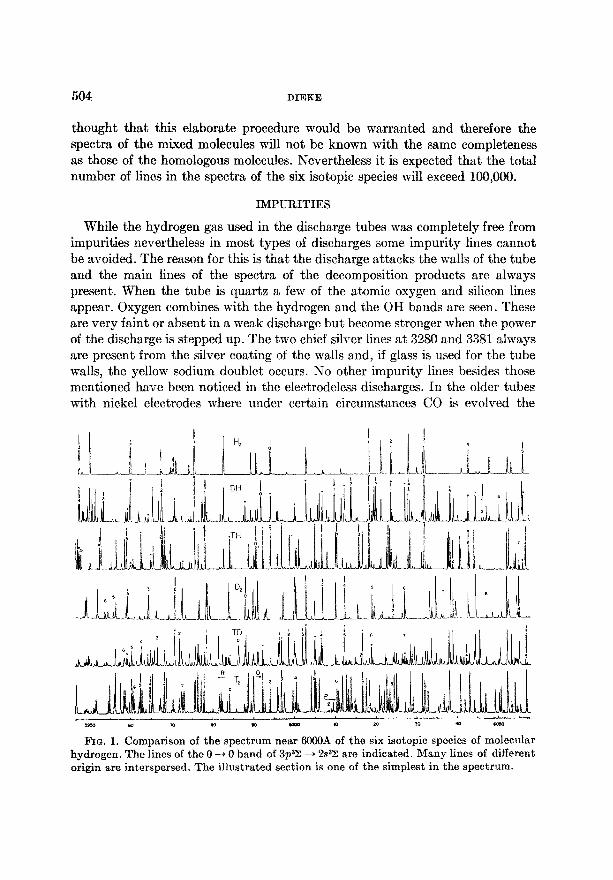
FIG. 1. Comparison of the spectrum near 6000A of the six isotopic species of molecnlar
hydrogen. The lines of the 0 -+ 0 band of 3p3Z + 2.532 are indicated. Many lines of different
origin are interspersed. The illustrated section is one of the simplest in the spectrum.

SPECTRUM OF HYDROGEN 505
bands of CT appeared in a tritium discharge and the OT bands were likewise photographed for the first time.
ZEEMAN EFFECTS
The spect.ra of IT2 and Dz have been photographed with the discharge in a magnetic field of about 37,000 gauss and the Zeemnn effect observed through- out the spectrum and similar observations, though less complete, have been made on the other isotopic species. Many lines show well resolved patterns, others appear only broadened as the individual components cannot be resolved while t8here are many lines which are not affected by the magnetic field (18). The Zeernnn effect is a valuable aid for the classification of the lines.
ANALYSIS
The struct.ure of the molecular hydrogen spectrum is not inlmedi~tely ap- parent. There are many lines and there are no easily discernible regularities. The reason for this is that because of the small moment of inertia the rotational structure is very open. Successive rotational lines may be separated by 100 wave numbers or more, and numerous lines belonging to other bands, perha.ps of quit,e different electrol~ic tra~~sitions are interspersed between them. Further- more because of interactions the sequence of rotational or vibrational IeveIs is not always regular. These circumstances have presented very serious obstacles to a satisfactory analysis of the molecular hydrogen spectrum. For IX2 t,he suc- cessful analysis of the spectrum is primarily due to Richardson and his coworkers3 although t,he first discovery of any regularities goes back to Fulcher (2%). The main regularities are now well established while there are still numerous bands, for which either the classification or t’he interpretation is uncertain, It is pnrticu- larly for such bands that the comparison with the other isotopic species is of gretlt help.
If the molecular spectra for the various isotopic species are compared, at first sight no similarity is apparent. The isotopic shifts for individual lines are so large and so different that a particular line may be placed into quite different surroundings. For this reason it has been found expedient to carry through the analysis of each spectrum independently of tha,t of any other spectrum. This also has the advantage that no pre-conceived idea as to what the structure should be can lead to spurious results. On the whole the individual bands can be more easily recognized for the heavier species particularly T, where the spacing of the rotational lines is only one third of what it is for IIs . This also has as con- sequence that at a given temperature there will be more rotational lines which help to outline a band more clearly.
2 Numerous papers since 1924. The results of Richardson’s work are given in a monograph (19). A few papers by Richardson have appeared since the publication of this monograph
(19).

,506
TABLE I
THE REGULAR LEYELS (TO n = 4) OF TEE Hz MOLECULE
Singlets
Cod@
n=l 18W
“,” ‘:“I? “‘r~::;
- - I - -
2 2s?z 2p’Z 2p’rI - - - __ ~ __ 3 3s’Z 3p’z: 3p’II 3d’L: 3dQ 3dlA - __- 4 4s’Z 4p’z: 4p’Il 4d’I: GG-- 4d’A 4f’;?: __- ~ - __ -
Triplets
- - - - -
4f’II 4f'A 4f’@
Cod@ PEG nb ?zZE ad ne at‘ =g nh wi e g Y u g g g u 94 21 u
~~___-- --
n=2 2s32 2pw 2p3n - - - - - - -
3 3s3z 3pQ 3p3II 3d3Z: 3dQ 3d3A _ _ _ _
4 4.m 4d3n- 4d3A 4f% 4f311 j 4f3d 4f”(a - --
5 Throughout our extensive tables it has been found convenient to adopt a code notation in order to avoid repeated printing of Greek symbols. This is indicated in Tables I and II. A capital letter is used for singlets, a lower case letter for triplets. The principal quantum number of the excited electron is also indicated. Thus 3D = 3dB, 4c = 4pQ. Letters at the end of the alphabet are used for states of unknown classification.
b Those underlined are empirically known in the Ha spectrum. e Continuous level.
The symmetry of the nuclei determines the well known intensity alternations in the rotational structure. Successive rotational lines have intensity ratios 3: 1 for Hz and Tz (apart from changes due to transition probabilities and Boltzmann factor) 1:2 for D2 and there are no al~rnations for the mixed molecules. This has been confirmed throughout.
The regular electronic levels of the hydrogen molecule have one of the two electrons in the normal state Isa while the second electron can be in any excited state. For the designation of the states it is therefore sufficient to in- dicate the state of this excited electron and give the term symbol for the result- ing state.” All possible regular levels up to n = 4 are indicated in Table I where those that actually have been observed are underlined. Many levels with n > 4 also are known empirically.
3 A fuller designation for 4dQ for instance would be 1s 4drrQ,. It is clear that every- thing that is left out can be inferred from the simplified symbol.

SPECTRUM OF HYDROGEN 507
The triplet separation is negligible so that the triplet lines also appear single. An exception is 2p311 where the triplet structure can be resolved under favorable circumstances as a close doublet (WI).
Besides these regular levels there are numerous additional levels which do no
fit into the regular scheme and t,herefore must have both electrons excited. They are highly irregular and so far the only one definitely understood (FE?) is (2p~)? ‘2. It is expected that the comparison of the various isotopic species will clarify the nature of the rest of the doubly excited level, but so far very little work could be done on this phase.
The classification of the Hz-spectrum proper is summarized up to 1034 in Richardson’s monograph (19) which deals extensively with the contributions of Richardson and his co-workers as well as the work of others. A few additional band systems of Hz have been found since (19, S?%?? g3). The work on the analysis of t,he spectra of the other isotopic species has all been carried out at The .Johns Hopkins University but is largely still unpublished.
Once the band systems have been analyzed the rotational and vibrat’ional constants of the various electronic states can be calculated. This has been done for many states according to a uniform procedure. In general the constants are bett.er for the heavier species because the formulas expressing the rotational and vibrational energies converge better for them. The elementary theory gives definite numerical relations between the constants of the different isotopic species. These relations are reasonably well satisfied for some states, not at all for others. In such cases interactions play a role and considerable light is shed on these interactions by a comparison of the isotopic species.
The results on the individual band systems will be published separately. Table II lists all empirically known energy levels of t,he Hz molecule. They are obtained entirely by the application of the combination principle with the follow- ing proviso. As there are no transitions between parahydrogen and orthohydro- gen levels, their relative position is determined with the help of the formula for the rot’ational energy. This is applied for instance to find the separation between K = 0 and K = 1 of 2p’Z(v = 0) a regular state for which the familiar simple expression for the rotational energy holds well. All other singlet levels can then be found to within the limits of the errors of measurement by adding empirical differences obtained from observed line pairs.
The ground level K = 0 of lsl&, is given zero energy. The other rotational and vibrational levels of the ground state are obtained from the far ultraviolet bands (S). The values given in t,he table are derived from those given by Jeppe- sen. They are the smoothed out values obtained from the raw measurements by fitting formulas to the empirical rotational differences.
With the known energies of the 1s ‘Z state those of 2pQ can be found from

TABLE IIA
THE KNOWN LEVELS OF IIf : REGULAR LEVELS”
1. Singlets
R o=o 1 2 3 4 5 .-
0 0 4 160.95 8 083.14 11 776.96 15 244.77 18 484.27 1 21s.4r i?‘$. 6.4 183.98 878.16 s4o.so 674.06 2 354.35 497.66 402.64 12 079.53 530.38 752.67 3 705.46 8%. 2.2 719.10 873.16 815.16 13 OfS.% 4 1 168.71 5 271.21 9 136.44 744.20 16 185.86 368.38 5 740.10 815.78 660.34 19 261.06 645.06 799. .JS 6 2 412.93 6 454.39 10 258.21 835.54 17 186.69 20 307.77 7 9 287.38 7 18Y.38 35s.41 14 432.37 806.80 888.96
1A = WI:
K
-
_. u=l 8 9
0 24 280.24 26 823.61 29 116.16
1 $68. $8 896.68 181.69
2 513.64 27 038.83 311.96
3 7&.@ $51.69 606.40
4 25 048.43 531.57 759.78 5 422.40 876.83 SO 072.27
6 862.82 28 280.96 439.63
7 $6 365.77 749.28 868.59
10 11 12
31 142.46 32 880.03 34 296.80 201.10 951.18 837.78 317.61 33 032.74 419.05 .J90.60 18% 27 633. $3 717.68 380.76 696.38 996.30 661.61 888. OY
32 323.44 905.93 35 111.54 696.76 S4 227.61 565.89
/I il
3A = 3s’z:
0 101 486.81
1 646.98
2 663.65
3 841.41 4 102 072.98
5 563.22
K v=o 1 2 3 4 5 6
0 90 136.e 91 61.9.80 1 234.31 550.72 2 $11.61 6e4.16 3 426.67 733.61 4 678. $6 878.04 5 765.31 92 056.30 6 986.06 W7.00 7 91 238.44 508.37 8 620.62 778. EiO
32 E96.28 34 041.33 96 266.00 96 434.M 830.56 075.81 287.57 466.34 900.76 148.14 562.20 628.63
93 005.43 243.55 448.72 621.46 24% 63 876.24 676.Lv4 744.37 314.34 540.23 734.09 896.34 616. $2 rs4.s4 921 .OS SY 076.6
37 682-g 612.66 672.58 762.10
2A = 2s’z:
-
--
-
II
6
21 498.23 68.2. $0 749.25 997.62
22 324.78 727.62
23 202.13 74.4.5l
2A = 2m
v=o
99 156.76 220.19 346.54 634.77 783.30
100 090.29 453.18 869.42
2 j 3 / 4 // n=o / 1 / 2
103 551.59 105 376.90 107 417.87 112 949.57 115 243.52 117 289.09 697.68 407.23 441.66 113 008.75 288.88 550.60 682.13 k 466.49 488.55 126.08 385.84 447.50 987.21 549.82 667.%3
’ 236.44
104 151.79 646.36 / 636.94 682.26
751.31 e!Y78.30 331.66
2B = 2fiB
a The levels in italics belong to orthohydrogen, those in ordinary type to parahydrogen. The total parity of the levels with A # 0 is indicated by a + or - for the lowest K.
508

SPECTRUM OF HYDROGEN 509
TABLE IIA (Singlets)-Continued
K
-__ K
I -
1
ZB = 2)‘2
Y=7 8 9 10
98 698.0 99 781.8 100 834.0 101 858.0 726.98 807.1 857.6 886.9 Y84.67 865.86 915.2 936.9 870.10 946.2 999.0 102 020.5
100 060.0 101 098.2 1lY.Y 187.7 132.9 256.6
- 11
102 862.3 103 812.0 104 Y51.3
876.7 840.0 774.1 923.1 891.3 821.0
103 000.5 975.7 891.0 102.2 104 083.2 986.8 222.1 194.0 105 094.0 362.4 38Y.6 lYO.9
- 12
‘u = 14 15
105 668.5 106 63i.3 677.8 554.5 Y15.9 697.1 786.6 665.0 879.1 Y51.2 989.6 857.6
106 099.0 969.0
~___ I_
107 SYY.9 397.6 439.8 504.9 586.0 696.8 818.3
108 199.3
220.0 260.6 321.5 4ro.2 510.3 621.1
2B = 2fkZ
-~
16 17 18
108 993.0 026.6 053.2 111.8 192.4
288.8 3Y2.1
19
109 Y62.4 so5.1 821.4 879.8 961.2
043.6 164.0
3B = 3fi’Z II
2c = 2pu
$J = 1 2 3 4 K
10 QY0.61112 360.52114 06Y.lY115 598.39 l- 521.41 396.47 110.35 639.06 + 622.82 488.lY 196.40 Y20.02 2 744.08 625.70 324.99 841.47 9Y4.16 808.60 495.36116 003.66 3 221.60113 035.60 606.25 514.93 305.Y5 956.YO 4
13
3B = 39’2
nb = o
08 435.66
602.61
v=” I 1 1 2 99 142.86101 QQ8.37103 619.91
144.03 449.60 620.79 264.37 563.61 729.04 267.84 667.00 730.46 446.46 736.2Y 891.51
451.97 741.20 887.97 684.73 962.08104 106.17 694.68 968.66 133.YO 980.33102 242.33 371.37 993.23
100 330.16 573.72 634.94 Y31. Yl 954.24 106 044.Y6
bvibratlonal quantum numbers uncertain.

2c = zpn n 3c = 3pll 30 = 3ae
Ii u=3 4 Y’O 1 2 K. o=o 1 ~-
l- 106 65ff.f6107 678.7 111 QZL69116 145.27117 %?9.86 0 11 804.63114 036.66 -4. 672.38 927.27 147.87 243.69 1 797.11 OSS.86 2 766.96 766.1 L13 041.20 257.89 345.38 2 819.78 038.36
7YJ.81 06i.70 .%=1.66 .%56.% 3 886.07 086.68 3 316.66 816.8 215.69 424.00 602.64 4 997.49 172.25
235.04 429.94 518.88 5 112 166.01 510.68 4 108 000.5 448.20 643.36 710.14 6 379.49 500.14
478.04 543.61 7 652.99 757.01 233.3 m4.40 914.65 955.60/ 8 684.18
I!
510 DZEKE
TABLE IIA (Singlets)-Co~~~~~e~
K
K
l- -l" 2 3
4
-
1
3D = 3dB 4D 3E = 3&U
v=2 3 v=o K u=o 1 2 3
16 156.81 l- 112 064.91114 164.13116 106.42117 878.96 096.66if7 ~@,86.~17 408.08 + Ib7.28 af6.96 &%,76 S%?.l8 140.36 865.75 383.59 2 1539.61 244.85 18Q,i% 365.fb 205.2s 911.65 446.99, 274.24 345.75 341.14118 019.29 297.38 979.71 559.98, 3 264.09 371.11 316.01 080.35 416.45iiS 098.46 780.03 465.04 434.49 487.05 181.50 565.33 955.20 4 441.12 644.96 486.72 246.0.4 751.06 288.68 695.70 669.65 666.92 249.58
5 671.10 767.09 701.73 968.g 876.54
6 968.21 os7.29 350.88 113 283.62
7 285.57 353.78 260.90 8 666.18 716.84 605.40
4E
o=o
117 581.25 582.64 696.97 702.18 87R.73 870.14
3F = 3d?h
1 K v=o
119 724.05 2- Ii% 617.96 + 528.75
769.61 3 735.56 863.35 RXL60
4 f13 ot0.39 0!%?.66 070.18
5 338.57 407.43
6 716.86
1
114 710.&4 713.42 906.55 916.60
116 168.62 173.56 462.26
816.17
2
116 773.20
955.16 968. $S(
tl7 183.52
-I- 4F
.-
--
-
u=o
117 826.76 928.32
118 063.35 19/t. 41
a@?. 84 523.8gc
*Uncertain,

SPECTRUM bF HYDROGEN
TABLE IIA-Continued
2. Triplets
511
2a = 2sB
K j n=o
0 i 95 226.00 1 293.67 2 425.50 3 623.44 4
~ 884.93
5 96 208.04 6 590.38 7 97 029.25
97 750.32 813.74 940.06
98 128.30 376.95 684. rg
99 047.64 464.76
LOO 138.60 102 394.73 198.86 451.90
318.89 565.81 497.73 735.49
733.92 959.52 101 0%. 7.4 103 236.36
370.86 563.61
-I ___- 104 521.63 106 521.22 108 394.05
576.78 572.55 4Q2.16 683.65 674.27 538.15 844.33 825.69 680.73
105 056.20 107 026.21 I
I 8 I 521.55 9 98 064.32
I / I
_ 2
/ 3 4 I 5 I 6
2a = 2s3L: 3a 3b = 3932
_ _
H i 8 v = ad 1 v=O 1
0 ‘112 021.48 114 290.21 106 831.61 108 894.31 1 110 184.36 111 784.59 082.71 347.66 884.73 944.36 2 199.72 461.71 990.60 109 044.09 3 372.94 361.88 107 148.24 192.74 4 607.42 856.66 366.79 389.34 5 115 134.10 614.77 632.46 6 461.80 920. s5 920.42 7 837.06 108 271.48 110 251.14 8 j 666.08 621. SO
3b = 3fiG 4b
K v=3 4 6 0 1
2
110 821.59
868.52 962.06
111 101.53
586.01 514.04 784.15
112 094.47
442.87
112 610.76
654.68 742.22 872.77
113 045.36
258.73 511.46 821.62
114 264.32 296.58 380.09
507.52 688.58
115 731.42 117 773.29 066.87 849.14 139.80
111 751.92 801.64 908.43
116 070.76 286.32
117 895.50 948.62
118 054.46
210.98
d Possibly spurious.

512 DIEKE
TABLE IIA (Triplets)-Continued
K
l-
+ 2
3
4
o=o
96 091.32
091.32 212.11 212.06 392.10 392.01 629.95 629. YY 924.01
923.67 96 272.09
271.61 672.22
K u=3
l- 118 262.63 + 254.61
2 353.03 367.43
3 602.66 508.97
4 700.01
5 944.16
-
6
7
l I 2
97 430.14 99 646.91
430.10 646.88
545.17 756.28
646.24 r66.68 716.62 919.48
716.78 919.97 943.16 100 135.04
943.49 166.78
98 223.30 401.66
223.52 402.56
554.76 716.85 666.01 718.09 936.40 401 078.81
935.57
36 = 3pll
-
-- 11
11
-
3
01 744.94 744.94
848.88
89.42 02 004.12
004.70 208.92 210.16
462.16 462.98
v=o
11 904.09 904.57
12 021.86 023.22 197.36 199.91 429.22 433.09 716.66 720.88
13 054.81
060.96
4 I 5 I 6 90 128.14 121 888.26 128 634.98 ‘26 069.49
233.04 977.78 619.18 148.39
364.39 1.22 110.79 744.19
550.73 909.51
266.64
1
‘4 144.33 143.97 256.09
264.44 422.67 416.14
642.70 616.46 914.67
15 236.34
4c
2
16 269.16
260.11 365.16 367.80 623.08 527.83 731.65 738.62
989.38 997.79
17 294.22
302.09
17 666.90 555.76
672.68 672.09 846.82 845.10
L8 076.65 079.11 360.69 353.74 696.79 684.62 082.91
19 766.64
876.28
041.29
259.23
628.66

SPECTRUM OF HYDROGEN 513
TABLE IIA (Triplets)-Continued
K
l-
2 3 4 5
0=2 3 4
lti 849.41 183 811.60 186 664.64
954.30 910.75 748.22
110.62 068.68 887.84
316.96 253.84 072.06
6Yl. 94 496.38 299.62
- 5 6 7
l.??Y 382.24 128 996.08 130 496.91
470.43 129.08
602.00
SC 66 I/
3d = 3d32
- ~ K V=O 1 2 0 /K V=O 1 2
1 120 131.94122 327.64124 39Y.63121 616.93’ 0 111 948.18114 035.99115 934.57
133.05 343.64 1 9Y6.23 033.41 944.14 2 248.49 438.91 633.26 2 976.23 060.56 970.00
266.30 3 046.32 130.02 061.69
3 421.80 604.lY 806.37 4 166.96 246.94 167.12
438.59 5 340.44 413.43 328.09
4 650.89 821.98 034.41 6 628.94
5 933.96 i23 090.82 316.96 7 903.08
3d = 3d32 4d 3e = 3dQ
-
K a=3 P=O 1 2 K a=0 1 2 -___ _____
0 117 658.34117 616.61119 765.91121 761.42 l- 112 216.42114 329.78116 295.29
1 676.91 66Y.41 716.06 Y20.26 + 303.30 418. Y6 331.82
2 721.10 569.32 716.37 726.56 2 290.67 408.61 377.61
3 799.lY 622.39 YYO.79 Y81.06 460.60 568.99 468.89
4 915.52 735.79 879.46 883.61 3 414.57 533.93 502.97
5 118 073.04 916.84120 040.91 032.66 663.33 763.76 663.79
6 272.67 4 691.33 YOY. 32 672.93
890.64 999.84 881.06
5 821.43 929.20 887.68 176.66 278.76 il7 149.32
6 103.62 196.2Y 147.01 601.33
7 434.34 449.70 8 Y94.31
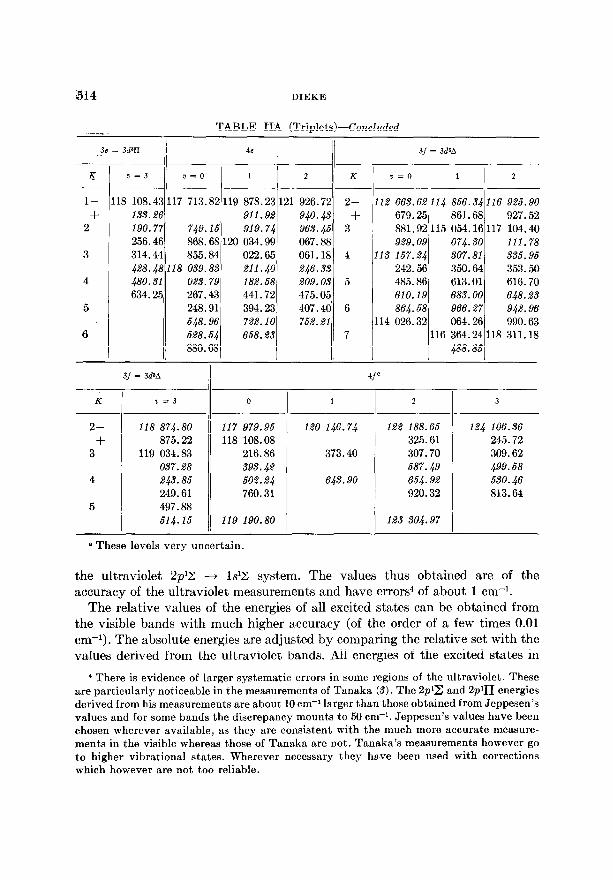
314 DIEKE
.__..~ TABLE HA (Triplet&-Concluded
3e = 3a3n 4c 3J = 3dzA
Ig u=3 v=o 1 u=o 1 2
l- 118 108.43117 713.82119 878.23 112 663.62114 866.34116 985.90
+ 133.96 911.92 679.25 861.68 927.52 2 190.77 749.16 919.74 881.92 115 054.16 117 104.40
256.46 868.68 120 034.99 929.09 074.30 111.78 3 314.44 855.84 022.65 113 157.24 307.81 335.96
428.48 118 039.83 211.40 242.56 350.64 353.50 4 480.31 02s. 79 182.58 485.86 613.01 616.70
634.25 267.43 441.72 610.19 683.00 648.23 5 248.91 394.23 864.68 966.27 942.96
548.96 722.10 114 026.32 064.26 990.63 6 528.54 658.23 116 364.24 118 311.18
880.68 488.85
3/ = 3&A 4Je
K ?I=3 0
2- 118 874.80 117 979.96 + 875.22 118 108.08
3 119 034.83 216.86 037.28 399.42
4 24s. 85 502.24 249.61 760.31
5 497.88 514.15 119 190.80
1
120 146.74
373.40
643.90
122 188.65 124 106.36 325.61 245.72 307.70 309.62 587.49 499.68 654.92 650.46 920.32 813.64
123 304.97
3
B These levels very uncertain.
the ultraviolet 2~9 + lslZ system. The values thus obtained are of the accuracy of the ultraviolet measurements and have errors4 of about 1 cm-l.
The relative values of the energies of all excited states can be obtained from the visible bands with much higher accuracy (of the order of a few times 0.01 cm-l). The absolute energies are adjusted by comparing the relative set with the values derived from the ultraviolet bands. All energies of the excited states in
4 There is evidence of larger systematic errors in some regions of the ultraviolet. These are particularly noticeable in the measurements of Tanaka (3). The 2prZ and 2p’n energies derived from his measurements are about 10 cm-l larger than those obtained from Jeppesen’s values and for some bands the discrepancy mounts to 50 cm+. Jeppesen’s values have been chosen wherever available, as they are consistent with the much more accurate measure- ments in the visible whereas those of Tanaka are not. Tanaka’s measurements however go to higher vibrational states. Wherever necessary they have been used with corrections which however are not too reliable.

SPECTRUM OF HYDROGEN 515
TABLE IIB
THE KNOWN LEVELS OF HI : LEVELS WITH BOTH ELECTRONS Excrr~u~
- -- ~-
K u=o 1 ? 3 4 __I__~ I-___IIi_ __~-
0 103 830.54 104 622.61 105 958.16 ,106 705.07 108 090.56 1 84s. 88 759. SS 985.29 YS6.19 lf4.l.j 2 895.00 772.20 106 034.53 768.46 161.59 3 781.97 820.98 r14..% 851.66 %.2.6~$
t / 858.84 883.67 g6.6.04 i 224.94 366.20 108 916.53 025.08
Ei 3'Kob 3'KI 3'Kz 'LO ‘L, ‘Uo “u,
_ --
0 111 620.81 113 853.40 113 250.24 116 907.41 113 385.50 1 / 6.J.S. 27 87i.Sd ii6 0RS.65 $69.69 925.86 &O.Sl 1115 569.68 2 635.73 912.31 039.33 308.60 462.58 598.77 3 Y5i. 92 978.54 080.60 SYO..& i [email protected] 645. QR 4 1 837.27 a.%$.@ 143.54 j 654.45
j / j / Y64.52
K j ‘M% ‘NO
1 1
‘X1 IQ0 ‘Ql ’ u 4'R _ - --
0 1 117 606.66 1 115 091.84 117 073.43 114 520.53 117 325.58 1 YO6.27 168.70 098.45 lli 379.13 112 118.15 558.16 376.40
2 ! 724.89 / 199.34 148.38 539.020 271.12~ 628.18 446.26 3 760.98 1 3008.01 aa4.03 Y3i . St?@ &6. IF 777.41 560. Y3 4 828.26 5
442.26 1 332.37 776.25~ 996.91 698. $1 521.58
a The levels in italics belong to orthohydrogen, those in ordinary type to parahydrogen. b The significance of the levels from here on is not clear except that they must have both
electrons excited. The notation is that given by Richardson and Davidson. The subscript is intended to indicate the vibrational quantum number but is not necessarily indentieal with it. These levels (all singlets) are empirically well established (except where indicated). There are others (including some triplets) for which the empirical evidence is less certain and which have been omitted. It is not impossible as suggested by S. P. Cunningham that these levels are the higher vibrational states of the strongly interacting levels 2.4 = 2s’~ and 2K = (2pu)* 12.
E Possibly spurious.
Table II given to two decimals should have a relative accuracy of a few times
0.01 cm-l, while their position with respect to the ground state is uncertain to a few cm-‘.
This applies to the singlets. The relative position of all triplets can be ob- tained in the same way through differences obtained from the visible and infra-

516 DIEKE
red bands. The latter are necessary to establish the relative position of 2s~ and states combining with it and 2p311 and states going down to it. The sys- tem 3dJZ --$ 3p38 near 2.2 microns for instance furnishes a connecting link between the two sets. The relative position of singlets and triplets can best be obtained through extrapolation to the limit of Rydberg series, and has therefore the uncertainty that such limits have.
The levels listed in the table are firmly established except for uncertainties in some cases for the highest rotational and vibrational quantum numbers. Some levels given in the preceding literature have not been confirmed as real with our more complete data and are omitted. It is expected that the full use of the new measurements will result in a slight improvement in accuracy and will extend many levels to higher rotational and vibrational quantum numbers. For the 2a0 and 2c0 states for instance the rotational levels are known now to K = 19.
Similar tables are available though in some cases as yet less complete for the other five isotopic species.
ACKNOWLEDGMENTS
A task of this magnitude would not have been possible without the cooperation of many persons. The work on the molecules containing tritium was initiated at the Argonne Na- tional Laboratory in collaboration with Dr. F. Tomkins. Dr. S. Cunningham, Dr. F. T. Byrne, and Dr. D. Dimock participated in the experimental work carried out at The Johns Hopkins University. The task of wavelength measurements was performed by Mrs. D. Wittenberg and Mrs. A. T. Young. We are greatly indebted to the Argonne National Lab- oratory and the Los Alamos Scientific Laboratory for making tritium available to us in particular to Dr. F. Tomkins and Dr. E. Robinson whose help was invaluable in the prep- aration of the tritium discharge tubes. Finally this work would not have been possible without the active support of the Division of Research of the U. S. Atomic Energy Com-
mission.
RECEIVED: April 5, 1958
REFERENCES
1. G. H. DIEKE AND R. W. BLUE, Phys. Rev. 46, 395 (1934); 47, 261 (1935); G. H. DIEKE, Phys. Rev. 48. 606 609 (1935) ; 48, 610 (1935) ; 76, 50 (1949);
G. H. DIEKE AND M. LEWIS, Phys. Rev. 62,100 (1937). Also unpublished data. 2. G. H. DIEKE AND F. S. TOMKINS, Phys. Rev. 76, 283 (1949); 82, 796 (1951); J. Phys. 16,
393 (1954). d. C. R. JEPPESEN, Phys. Rev. 44, 165 (1933); 64, 68 (1938);
T. TANAKA, Sci. Papers, Inst. Phys. Chem. Research Tokyo 43,49 (1944); T. NAMIOKA, Science of Ligb{ Japan 2, 73 (1953).
4. C. R. JEPPESEN, Phys. Rev. 46, 480 (1934); J. FUJIOKA AND T. WADA, Sci. Papers Inst. Phys. Chem. Research Tokyo 27, 210 (1935).
6. C. R. J~~PPESEN, Phys. Rev. 49, 797 (1936). 6. G. H. D~EKE AND R. W. BLUE, Phys. Rev. 46,395 (1934).

SPECTRUM OF HYDROGEN 517
7. G. H. DIEKE AND S. P. CUNNINGHAM, .J. Opt. Sot. Anl. 42, 187 (1952). 8. T. R. MERTON AND S. BARRAT, Trans. Roy. Sot. A202,369 (1922).
9. See N. D. SMITH, Phys. Rev. 49, 345 (1936), J. Opt. Sot. Am. 28, 40 (1938). 10. W. FASTIE, H. M. CROSSWHITE, AND P. GLOERSEN, J. Opt. Sot. Am. 48, 106 (1958);
S. P. S. PORTO AND G. H. DIEKE, J. Opt. Sot. ilm. 46, 447 (1955); I’. Gloersen, dissertation, Johns Hopkins University, 1956 (to be published).
If. H. M. CROSSWHITE, G. H. DIEKE, AND C. SALMON LEGAGNEUR, J. Opt. Sot. Am. 46, 270
(1955) ; It. W. STANLEY AND G. H. DIEKE, J. Opt. Sot. Am. 46, 280 (1955); H. M. Crosswhite and G. H. Dieke, in “American Institute of Physics Handbook,”
Section 7g. McGraw Hill, New York, 1957. 12. G. H. DIEKE, D. DIMOCK AND H. M. CROSSWHITE, J. Opt. Sot. Am. 46,456 (1956). IS. See D. Dimock, dissertation, Johns Hopkins University, 1957 (to be published). 14. H. G. GALE, G. S. MONK, AND K. 0. LEE, Astrophys. J. 67,89 (1928). 15. K. A. KENT, Astrophys. J. 84, 585 (1936);
N. A. KENT AND R. G. LACOUNT, Astrophys. J. 86, 311 (1937); Phys. Rev. 61, 241 (1937); L. S. COMBSS, R. H. FRY, AIXD N. A. KENT, Phys. Rev. 66, 678 (1939); E. W. FOSTER AND 0. RICHARDSON, Proc. Roy. Sot. A189, 149 (1947).
16. W. FINKELNBURG, Z. Physik. 63, 27 (1928). f7. A. H. POETTHER, Phys. Rev. 30, 418 (1927). 18. G. H. DIEKE, S. P. CUNXINGHA~I, AND F. T. BYRNE, Phys. Rev. 92,81 (1953). 19. 0. W. RICHARDSOS, “Molecular Hydrogen and Its Spectrum.” Yale Univ. Press, New
Haven, 1934. 0. W. RICHARDSON, PTOC. Roy. Sot. A162, 503 (1935); A160, 487 (1937); A164, 316 (1938);
0. W. RICHaRDSON AIXD T. B. RYMER, Proc. Roy. Sot. Al47, 24, 251, 272 (1934). 20. G. 6. FULCHER, Physik. Z. 13, 1137 (1912); Astrophys. 1. 37, 60 (1913). 21. IX. W. FOSTER AND 0. W. RICHARDSON, Proc. Roy. Sot. A189, 175 (1947). 22. G. H. DIEKE, Phys. Rev. 60, 797 (1936); 76, 50 (1949). 25. G. H. DIEKE, Phys. Rev. 64,439 (1938). Also unpublished data.