The Mississippi River Sediment and QW Data Information Network
33
U.S. Department of the Interior U.S. Geological Survey The The Mississippi River Mississippi River Sediment and QW Data Information Sediment and QW Data Information Network Network Phil Turnipseed, PE Phil Turnipseed, PE for John R. Gray for John R. Gray Office of Surface Water Office of Surface Water Reston, VA 20192 Reston, VA 20192 Interagency Mississippi Valley Division Meeting Interagency Mississippi Valley Division Meeting Memphis, Tennessee Memphis, Tennessee November 17, 2009 November 17, 2009
-
Upload
perry-hendricks -
Category
Documents
-
view
36 -
download
0
description
The Mississippi River Sediment and QW Data Information Network. Phil Turnipseed, PE for John R. Gray Office of Surface Water Reston, VA 20192. Interagency Mississippi Valley Division Meeting Memphis, Tennessee November 17, 2009. - PowerPoint PPT Presentation
Transcript of The Mississippi River Sediment and QW Data Information Network

U.S. Department of the InteriorU.S. Geological Survey
The The Mississippi River Mississippi River
Sediment and QW Data Information Sediment and QW Data Information NetworkNetwork
Phil Turnipseed, PEPhil Turnipseed, PE
for John R. Grayfor John R. Gray
Office of Surface WaterOffice of Surface Water
Reston, VA 20192Reston, VA 20192
Interagency Mississippi Valley Division MeetingInteragency Mississippi Valley Division Meeting
Memphis, TennesseeMemphis, Tennessee
November 17, 2009November 17, 2009
U.S. Department of the InteriorU.S. Geological Survey
The The Mississippi River Mississippi River
Sediment and QW Data Information Sediment and QW Data Information NetworkNetwork
USGS Coordination team:
John R. Gray – Team Leader
Charles Demas
Andrew Ziegler
Arthur Horowitz
Dale Blevins
USASC Coordination team:
Chuck Shadie – Team Leader

National Monitoring Network (NMN)National Monitoring Network (NMN)Current design approved by ACWI on Current design approved by ACWI on
April 5, 2006; endorsed by Corps, April 5, 2006; endorsed by Corps, EPA, USGS, NOAA (NOS &NWS), EPA, USGS, NOAA (NOS &NWS), TVA, USDA (NRCS & USFS),TVA, USDA (NRCS & USFS),
DOI (BLM, NPS, OSM, USFWS), many DOI (BLM, NPS, OSM, USFWS), many regional and state orgsregional and state orgs
352 HUC 6 Accounting units352 HUC 6 Accounting units
(about 130 in MS basin)(about 130 in MS basin)
2,262 HUC 8 Cataloging units2,262 HUC 8 Cataloging units
WQ issues:WQ issues:
DO, nutrient enrichment, toxics, DO, nutrient enrichment, toxics, sedimentationsedimentation, harmful algal blooms, , harmful algal blooms, habitat degradation, invasive species, habitat degradation, invasive species, and pathogens (indicator bact.)and pathogens (indicator bact.)
Pilots studies report completedPilots studies report completed
Advisory Committee on Water Information http://acwi.gov/monitoring/network/

Problem Annual loss of 25 - 40 mi2 of LA coastal wetlands due
in part to
Anthropogenic disturbance; Sea level rise; Subsidence; “Sediment Starvation”;
Sediment-bound nutrients contribute to Gulf of Mexico Hypoxic Zone (since 1985 has ranged in size from 100 mi2 to 8,500 mi2).
Recent studies contend that about 50% of transport loss is attributable to Missouri River dams and reservoirs;

Gulf of MexicoHypoxic Zone
Gulf of Mexico Hypoxic Zone

Annual Sediment Loads in MS River BasinAnnual Sediment Loads in MS River Basin
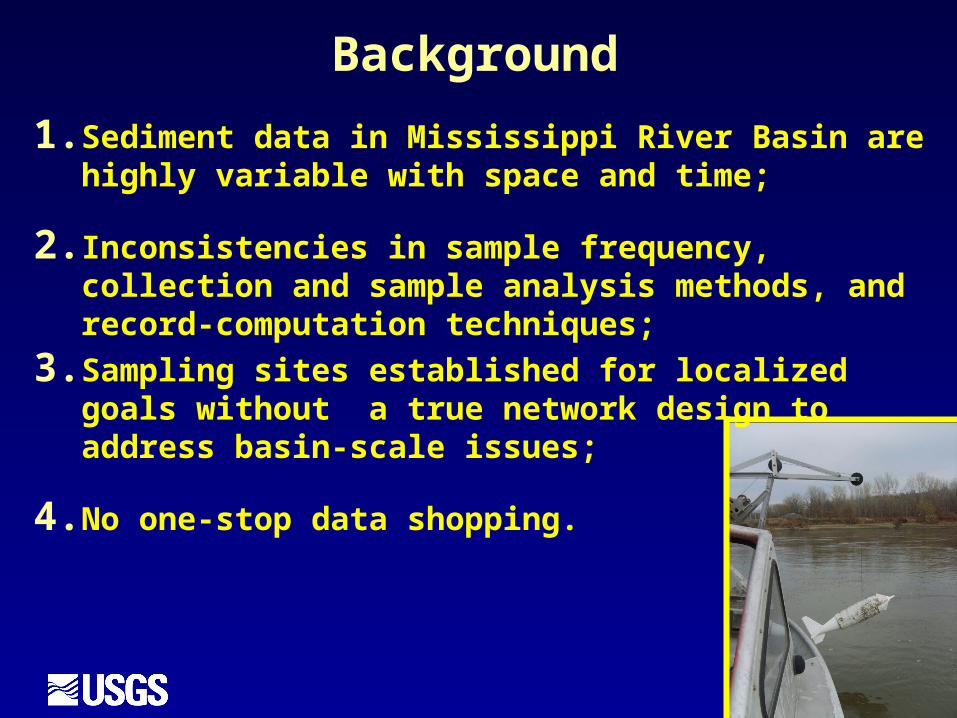
Background
1. Sediment data in Mississippi River Basin are highly variable with space and time;
2. Inconsistencies in sample frequency, collection and sample analysis methods, and record-computation techniques;
3. Sampling sites established for localized goals without a true network design to address basin-scale issues;
4. No one-stop data shopping.

Objectives
Develop and implement a long-term Develop and implement a long-term sediment- and solid-phase chemistry sediment- and solid-phase chemistry monitoring network based on monitoring network based on Network Design and State-of-Art Network Design and State-of-Art TechnologiesTechnologies Evaluate historical sediment-flux data; Evaluate historical sediment-flux data;
compute (or recompute where needed);compute (or recompute where needed); Network Design = Appropriate sites Network Design = Appropriate sites
(spatial, temporal) and consistent (spatial, temporal) and consistent instruments, data-collection and instruments, data-collection and computation methods.computation methods.
Ultimately identify trends in sediment Ultimately identify trends in sediment and solid-phase chemistry loadsand solid-phase chemistry loads

Overviews of:
Data Availability Data Collection Instruments and
Methods Load Computation Schemes New Capabilities that may
Revolutionize Acquisition of Fluvial-Sediment and QW Data

The Mississippi River Basin

Periods of Sediment Sample Collection on the Lower Missouri River
1879 1889 1899 1909 1919 1929 1939 1949 1959 1969 1979 1989 1999 2009
St. Charles/Howard Bend
Hermann
Boonville
Waverly
Kansas City
St. Joseph/Leavenworth
Nebraska City/Plattsmouth
Omaha
Sioux City
Yankton ~ 50 sample-days/yr
~25 sample-days/yr
~ 81+ sample-days/yr
~46 sample days/yr
~ 61 sample-days/yr
~ 61 sample days/yr
~91 sample-days/yr
~91 sample-days/yr
Surface samples only
Surface samples only
~308 sample days/yr
~216 sample days/yr
~163 sample days/yr
~210 sample days/yr
12 to 15 USGS samples/yr
~15 USGS NASQAN samples/yr
~15 USGS NASQAN samples/yr
Surface samples only
No SamplesSamples collected by USACE
Samples collected by USGS
Samples collected by others

Availability of suspended sediment loadsPeriods of Suspended-Sediment Load Calculations on the Lower Missouri River
1879 1889 1899 1909 1919 1929 1939 1949 1959 1969 1979 1989 1999 2009
St. Charles/Howard Bend
Hermann
Boonville
Waverly
Kansas City
St. Joseph/Leavenworth
Nebraska City/Plattsmouth
Omaha
Sioux City
Yankton ~ 50 sample days/yr
~25 sample days/yr
~ 81+ sample days/yr
~46 sample days/yr
~ 61 sample days/yr
~ 61 sample days/yr
~91 sample days/yr
~91 sample-days/yr
Surface samples only
Surface samples only
~308 sample days/yr
~216 sample days/yr
~163 sample days/yr
~210 sample days/yr
12 to 15 USGS samples/yr
~15 USGS NASQAN samples/yr
~15 USGS NASQAN samples/yr
Surface samples only
No Samples Loads calculated by USACE Loads calculated by USGS
Sed Loads @ 2 sites

USGS Daily Sediment Stations by Year 1940-2000
0
100
200
300
400
1940
1942
1944
1946
1948
1950
1952
1954
1956
1958
1960
1962
1964
1966
1968
1970
1972
1974
1976
1978
1980
1982
1984
1986
1988
1990
1992
1994
1996
1998
2000
Water Year
Nu
mb
er o
f Sta
tions
Estimated from Glysson, 1989
Estimated from graphic, originunknownLew, 1998; Lew, 2000, written commun.
1
2
1 Glysson, G.D., 1989, 100 Years of Sedimentation Study by the USGS, in, Proceedings of the International Symposium, Sediment Transport Modeling, Sam S.Y . Wang, ed.: American Society of Civil Engineers, New Orleans, August 14-18, 1989, pp. 260-2652 Lew, Melvin, 1998, Operation of Hydrologic Data-Collection Stations by the U.S. Geological Survey in 1997: U.S. Geological Survey Open-File Report 97-832, p.14. These data have been multiplied by a coefficient of 0.657 based on the relation between the red and tan bars for the period 1985-1993 in an attempt to render Lew's data comparable to the blue and red bars. Data depicted by the blue bars were dervied from the National Water Information System or its predessesor. Data depicted by the red bars, of unknown origin, also appear to be approximately derived from the National Water Information System. Almost half of the sediment stations operated in 2000 are in Puerto Rico.
(J ohn R. Gray and Roger K. Chang, USGS, OSW, October 2000)

Overviews of:
Data Availability Data Collection Instruments and
Methods Load Computation Schemes New Capabilities that may
Revolutionize Acquisition of Fluvial-Sediment and QW Data

Data-Collection MethodsData-Collection Methods
Used 1939 - 1954Used 1939 - 1954
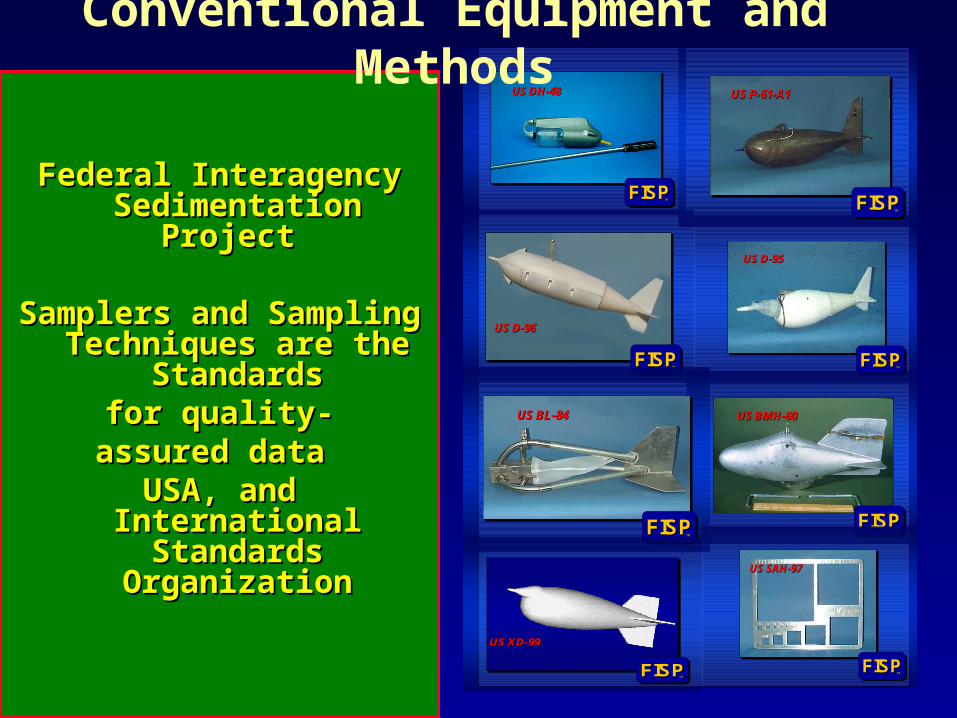
Federal Interagency Federal Interagency Sedimentation Project Sedimentation Project
Samplers and Sampling Samplers and Sampling Techniques are the Techniques are the
StandardsStandardsfor quality-for quality-
assured data assured data USA, and International USA, and International Standards OrganizationStandards Organization
FISPFISPFISPTMTM
US DUS D--9696
FISPFISPFISPTMTM
US DHUS DH--4848
US DUS D--9595
FISPFISPFISPTMTM
US PUS P--6161--A1A1
FISPFISPFISPTMTM
FISPFISPFISPTMTM
US BMHUS BMH--6060US BLUS BL--8484
FISPFISPFISPTMTM
US SAHUS SAH--9797
FISPFISPFISPTMTMFISPFISPFISP
TMTM
US XD-99US XDUS XD--9999
Conventional Equipment and Methods

Overviews of:
Data Availability Data Collection Instruments and
Methods Load Computation Schemes New Capabilities that may
Revolutionize Acquisition of Fluvial-Sediment and QW Data

Computational MethodsComputational Methods
1.1. Porterfield (1972) – Traditional “daily record” Porterfield (1972) – Traditional “daily record” computation method – concentration time computation method – concentration time seriesseries
2.2. ““Simple” transport curvesSimple” transport curves
3.3. Multi-parameter stochastic models – Estimator, Multi-parameter stochastic models – Estimator, Loadest, othersLoadest, others
4.4. Continuous measurement would be best to use Continuous measurement would be best to use along with defined uncertainty.along with defined uncertainty.
Overviews of:Overviews of:
Data AvailabilityData Availability Data Collection Instruments and Data Collection Instruments and
MethodsMethods Load Computation SchemesLoad Computation Schemes New Capabilities that may New Capabilities that may
Revolutionize Acquisition of Revolutionize Acquisition of Fluvial-Sediment and QW DataFluvial-Sediment and QW Data
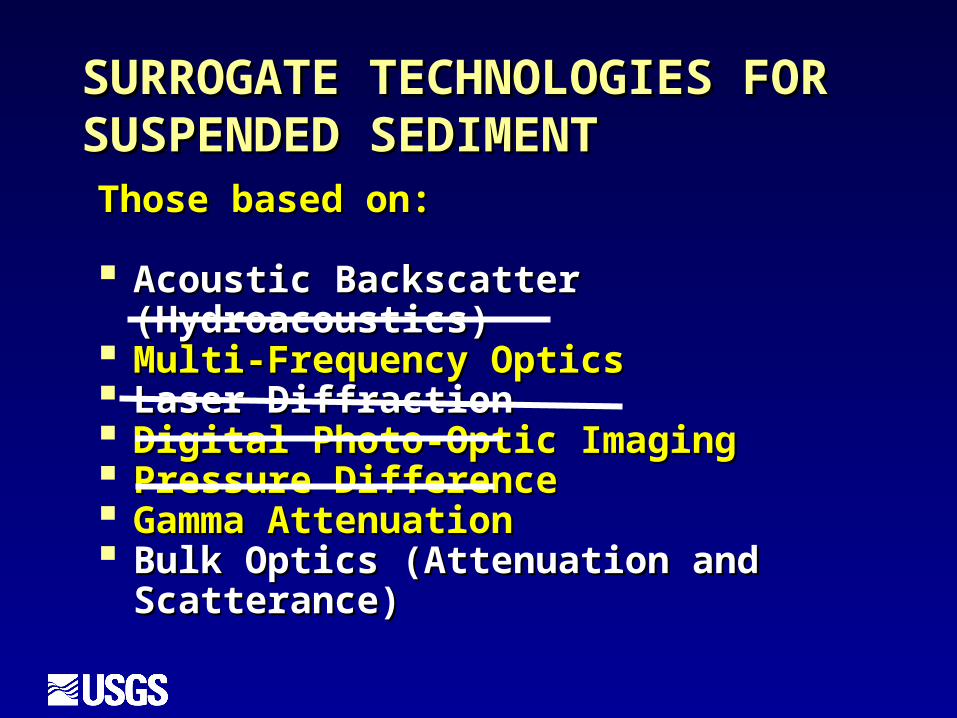
SURROGATE TECHNOLOGIES SURROGATE TECHNOLOGIES FOR SUSPENDED SEDIMENTFOR SUSPENDED SEDIMENTThose based on:Those based on:
Acoustic Backscatter (Hydroacoustics)Acoustic Backscatter (Hydroacoustics) Multi-Frequency OpticsMulti-Frequency Optics Laser DiffractionLaser Diffraction Digital Photo-Optic ImagingDigital Photo-Optic Imaging Pressure Difference Pressure Difference Gamma AttenuationGamma Attenuation Bulk Optics (Attenuation and Scatterance)Bulk Optics (Attenuation and Scatterance)
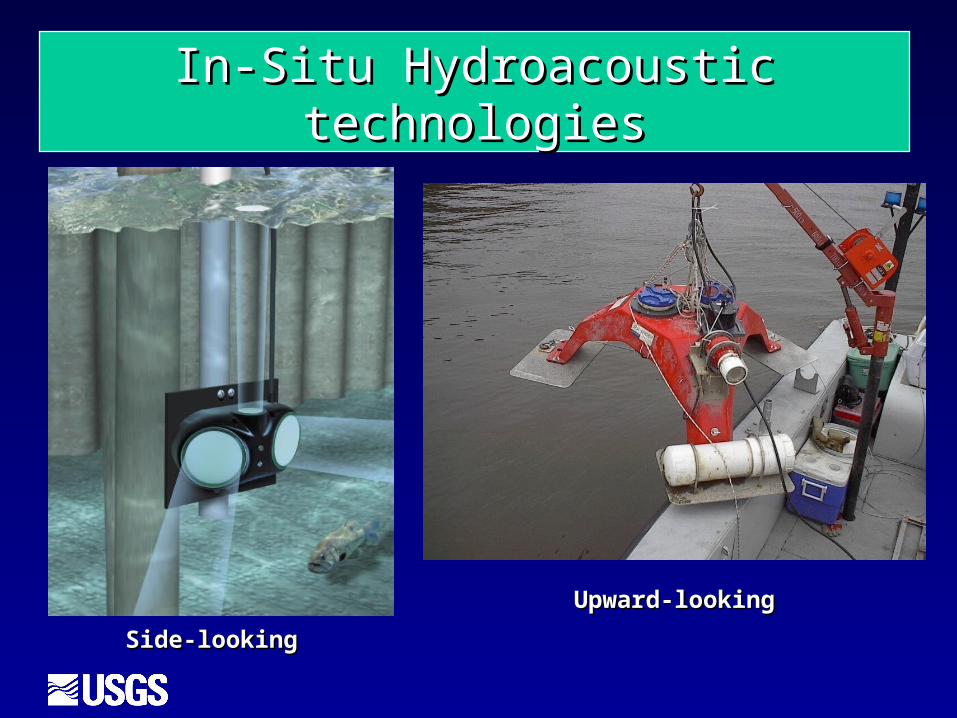
In-Situ Hydroacoustic technologiesIn-Situ Hydroacoustic technologies
Side-lookingSide-looking
Upward-lookingUpward-looking
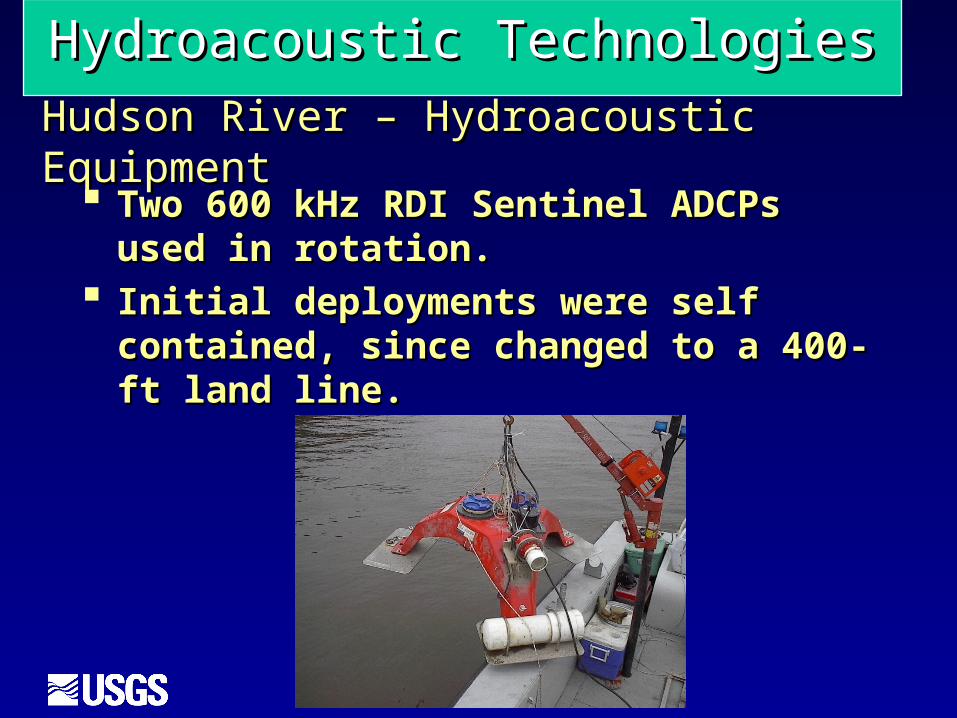
Hudson River – Hydroacoustic EquipmentHudson River – Hydroacoustic Equipment Two 600 kHz RDI Sentinel ADCPs used in Two 600 kHz RDI Sentinel ADCPs used in
rotation.rotation. Initial deployments were self contained, Initial deployments were self contained,
since changed to a 400-ft land line.since changed to a 400-ft land line.
Hydroacoustic TechnologiesHydroacoustic Technologies

Hudson River -- CalibrationHudson River -- Calibration

Hudson River Cross-Section AdjustmentsHudson River Cross-Section Adjustments
Cross Sectional Cross Sectional Adjustment:Adjustment: ““Box-coefficient” based Box-coefficient” based
on ADCP cross-sectional on ADCP cross-sectional estimates of Suspended estimates of Suspended Sediment ConcentrationSediment Concentration
PROFILE AVERAGE SUSPENDED SEDIMENT-CONCENTRATION BASED ON UPWARD-
LOOKING ADCP MEASUREMENTS,IN MILLIGRAMS PER LITER
0 10 20 30 40 50 60
CROSS
-SEC
TION
AL
AVE
RAGE
SUSP
ENDED
-SE
DIM
ENT
CON
CEN
TRATI
ON
BASE
D O
NBOAT-
MOUN
TED A
DCP
MEA
SURE
MEN
TS,
IN M
ILLI
GRA
MS
PER
LITE
R
0
10
20
30
40
50
60
70
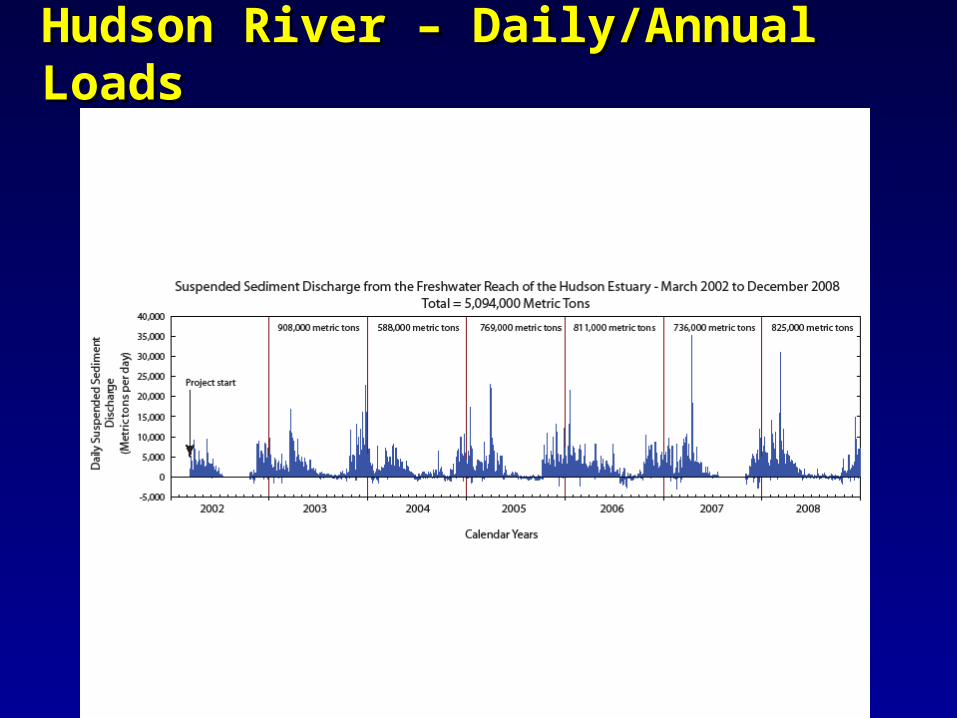
Hudson River – Daily/Annual LoadsHudson River – Daily/Annual Loads

LASER DiffractionDeployed in-situ in blueWater, Estuaries, Rivers Additionally,USGS has project withManufacturer to developstreamlined laser scattering device(Gray, 2002)
Laser TechnologiesLaser Technologies

Isokinetic withdrawal LISST-SLIsokinetic withdrawal LISST-SL
• Active control, pump-assisted isokinetic withdrawal• Pitot tube velocity sensor• 2-Wire communication• Optional internal battery• Low drag permits low weight.
Cooperative Research and Development Projectamong Sequoia, Sci., Inc.,USGS, FISP

Colorado River Colorado River at Grand Canyonat Grand Canyon
Laser, acoustic, and opticalLaser, acoustic, and opticaltechnologies arrayedtechnologies arrayed

0
1000
2000
3000
4000
5000
6000
7000
8000
September 18 - 24, 2004
Silt
and
cla
y co
ncen
tratio
n (m
g/L)
Colorado River near mile 30
EZQ acousticsConventional samples (EWIs and pumps)
Silt and Clay Silt and Clay concentration concentration in mg/Lin mg/L
From David Topping, USGSFrom David Topping, USGS

SummarySummary
Evaluate historical sediment-flux data, and recompute Evaluate historical sediment-flux data, and recompute as needed: as needed:
- Started in Lower Missouri River (Omaha District and - Started in Lower Missouri River (Omaha District and USGS Kansas City Office (Blevins/Heimann)USGS Kansas City Office (Blevins/Heimann)
- Loads computational scheme evaluation- Loads computational scheme evaluation
Implement a long-term sediment- and solid-phase Implement a long-term sediment- and solid-phase chemistry monitoring network based on Network Design chemistry monitoring network based on Network Design and State-of-Art Technologies:and State-of-Art Technologies:
– – Turbidity protocol available – hydroacoustics soon?Turbidity protocol available – hydroacoustics soon?

SummarySummary
Identify trends in sediment and solid-phase chemistry Identify trends in sediment and solid-phase chemistry loads -- Needs:loads -- Needs:
– – Comparable, quality-assured dataComparable, quality-assured data
– – Comparative data (traditional, surrogate, modeled)Comparative data (traditional, surrogate, modeled)
Make these data available from a online single portal: Make these data available from a online single portal:
– – Presumably tractable policy issues on Furnished DataPresumably tractable policy issues on Furnished Data

Proposal for the network will be Proposal for the network will be presented at the nextpresented at the next
HQ Interagency Coordination meeting on HQ Interagency Coordination meeting on February 2, 2010February 2, 2010
in in Reston, VirginiaReston, Virginia