The Middle Class Consensus 5 - William Easterly · PDF fileThe Middle Class Consensus and...
31
The Middle Class Consensus and Economic Development Abstract: Modern political economy stresses “society’s polarization” as a determinant of development outcomes. Among the most common sources of social polarization are class divisions and ethnic divisions. A middle class consensus is defined as a high share of income for the middle class and a low degree of ethnic divisons. A middle class consensus distinguishes development successes from failures. The paper links the existence of a middle class consensus to exogenous country characteristics like resource endowments, along the lines of the provocative thesis of Engerman and Sokoloff 1997 that tropical commodity exporters are more unequal than other societies. This hypothesis is confirmed with cross-country data. This paper exploits this association using resource endowments as instruments for inequality. A higher share of income for the middle class and lower ethnic divisions are empirically associated with higher income and higher growth. These associations are robust to a number of alternative controls. A middle class consensus is also associated with more education, better health, better infrastructure, better economic policies, less political instability, less civil war and ethnic minorities at risk, more social “modernization” and more democracy. William Easterly 1 World Bank July 2001
Transcript of The Middle Class Consensus 5 - William Easterly · PDF fileThe Middle Class Consensus and...

The Middle Class Consensus and Economic Development
Abstract: Modern political economy stresses “society’s polarization” as a determinant of development outcomes. Among the most common sources of social polarization are class
divisions and ethnic divisions. A middle class consensus is defined as a high share of income for the middle class and a low degree of ethnic divisons. A middle class consensus distinguishes
development successes from failures. The paper links the existence of a middle class consensus to exogenous country characteristics like resource endowments, along the lines of the provocative thesis of Engerman and Sokoloff 1997 that tropical commodity exporters are more unequal than
other societies. This hypothesis is confirmed with cross-country data. This paper exploits this association using resource endowments as instruments for inequality. A higher share of income
for the middle class and lower ethnic divisions are empirically associated with higher income and higher growth. These associations are robust to a number of alternative controls. A middle class
consensus is also associated with more education, better health, better infrastructure, better economic policies, less political instability, less civil war and ethnic minorities at risk, more
social “modernization” and more democracy.
William Easterly1
World Bank
July 2001
2
“Thus it is manifest that the best political community is formed by citizens of the middle class, and that those states are likely to be well-administered, in which the middle class is large .. where the middle class is
large, there are least likely to be factions and dissension.” Aristotle 306 BC (quoted in Decornez 1998)
“So strong is this propensity of mankind to fall into mutual animosities, that where no substantial occasion
presents itself, the most frivolous and fanciful distinctions have been sufficient to kindle their unfriendly passions and excite their most violent conflicts. But the most common and durable source of factions has
been the various and unequal distribution of property.” (James Madison 1787, Federalist Papers No. 10)
“Many of the world's problems stem from the fact that it has 5,000 ethnic groups but only 190 countries.”2
(Rodger Doyle, Scientific American, September 1998) I. Literature review and discussion
Many explanations of the cross-country differences in economic growth and development
only lead to further questions. If differences in saving rates explain cross-country income
differences (Mankiw, Romer, and Weil 1992), then why do some societies save more than others?
If national policies explain much of the differences in growth rates across countries (Barro and
Sala-I-Martin 1995, Easterly and Levine 1997), then why do some nations have worse
government policies than others? The dissatisfaction with explanations of cross-country
development differences by endogenous variables has led to a recent search in the literature for
more fundamental characteristics of nations that determine development outcomes.
This paper puts forward the existence of a middle class consensus as a critical
determinant of development differences. A middle class consensus is defined as a national
situation where there are neither strong class differences nor ethnic differences. The paper links
the existence of a middle class consensus to exogenous country characteristics like resource
endowments and ethnolinguistic diversity. Two recent strands of the literature motivate this
paper: first, the literature on resource endowments, inequality, and growth, and second, the
literature on ethnic diversity and growth.
Economic historians have pointed out the importance of a middle class for economic
development. Landes 1998 says the “ideal growth and development society” would have “a

3
relatively large middle class” (pp. 217-18). He cites “the great English middle class” as a reason
for England’s being first at industrialization (p. 221).
Adelman and Morris 1967 noted that “in the economic development of Western Europe,
the middle classes were a driving force”. Moreover, they presciently said that “it is clear from
many country studies that the growth of a robust middle class remains of crucial importance in
contemporary low-income nations.”3
Political economy explanations of development outcomes usually focus on “society’s
polarization and degree of social conflict” (Alesina 1994, p. 38). Societies that are polarized tend
to focus on redistribution between polarized factions that alternate in power; societies that are not
polarized are able to reach a consensus on public goods and overall economic development.
Casual observation and previous literature suggests that among the most common polarizing
forces are differences between classes and differences between ethnic groups.
A large theoretical literature also links a small middle class – or other measures of
inequality -- to low growth and low human capital accumulation. Galor and Zeira 1993 postulate
that the poor are liquidity-constrained from accumulating human capital; higher inequality
implies a greater share of the population will be liquidity constrained and thus the society
accumulates less human capital. Alesina and Rodrik 1994 and Persson and Tabellini 1994 link
high inequality to low growth through the poor majority imposing a tax on the rich. Perotti 1996
did not find evidence for this mechanism but links the effect of inequality on growth to the effect
through human capital and through political instability.
A number of empirical cross-country studies find high inequality linked to poor growth
outcomes (see in addition to others mentioned above Clarke 1995 and Deininger and Squire 1998,
the latter using land inequality).4
The first strand of the literature relevant to this paper is captured well by papers by
Engerman and Sokoloff 1997 and 2000 , which directly inspired the present paper. Engerman and
Sokoloff link tropical commodity factor endowments in Latin American countries to high
4
inequality and parasitic politically powerful elites, which in turn led to low growth and low levels
of public goods like mass education. The elite was reluctant to invest in mass education for fear
that they would be displaced from power (Bourguignon and Verdier 2000 described a similar
mechanism in a theoretical paper). In contrast, the non-tropical land in North America lent itself
to family farms, which implied greater equality and greater investment in public goods.5
The second strand of the literature links ethnic divisions to poor growth and public good
outcomes. While violence directed at or by ethnic groups is well-known, the more subtle
economic effects of ethnic conflict have only recently attracted attention in the economics
literature. The mechanism could be similar to that in the previous paragraph – an ethnically
distinct group in power is reluctant to invest in public services for the other ethnic groups for fear
that the other ethnic groups will be enabled to displace the first group from power. Easterly and
Levine 1997 find that Africa’s high linguistic diversity helps explain the continent’s poor
policies, including low public goods, and poor economic growth. Alesina, Baqir, and Easterly
1999a find that more ethnically diverse US cities and counties devote less resources to public
goods than more ethnically homogeneous cities and counties. Goldin and Katz 1999 find lower
public support for higher education in states with more religious - ethnic heterogeneity. Goldin
and Katz 1997 likewise find lower high school graduation rates in states that had higher religious-
ethnic diversity. Miguel 1999 likewise finds lower primary school funding in more ethnically
diverse districts in Kenya. Mauro 1995 and La Porta, Lopez de Silanes, Shleifer and Vishny 1998
find that ethnic diversity predicts poor quality of government services. Alesina, Baqir, and
Easterly 1999b find a link from ethnic diversity to bloated government payrolls in US cities.
Rodrik 1999 noted that ethnically divided nations react more adversely to external terms of trade
shocks. Svensson 1998 finds that more foreign aid proceeds are diverted into corruption in more
ethnically diverse places. Mauro 1995 and Annett 1999 finds that linguistic or religious diversity
leads to greater political instability, which Annett finds in turn leads to higher government
consumption.. Knack and Keefer 1997 find that ethnic homogeneity raises “social capital” or

5
“trust,” which in turn is associated with faster growth and higher output per worker. Adelman and
Morris 1967 also noted that “cultural and ethnic heterogeneity tend to hamper the early stages of
nation-building and growth.”6
This paper brings together these two strands of the literature. I call a situation of relative
equality and ethnic homogeneity a “middle class consensus.” I argue that this middle class
consensus facilitates higher levels of income and growth, as well as higher levels of public goods.
Like Engerman and Sokoloff 1997 and 2000, I link the existence of a middle class consensus to
initial factor endowments, mainly a tropical endowment that lent itself to production of primary
commodities, but I test their hypothesis with cross-country data.7 I find that a middle class
consensus provides a remarkably parsimonious explanation of development outcomes.
The middle class consensus also may affect the likelihood that a country is democratic.
One might think that a rich elite would in fact have an incentive to suppress democracy.
Democratic voting would result in higher mass education than the oligarchic elite would choose
on its own, because the elite fear that a more educated majority will displace them from power.
Similarly, in an ethnically diverse society, the most powerful ethnic group may want to suppress
democratic rights of the other groups because they are threatened by the human capital
accumulation those groups would vote for themselves. A large and homogeneous middle class
would not have anything to lose in a democracy and so would be more likely to grant universal
suffrage.8 We will test this prediction in the empirical section.
So far, I have been referring to human capital as one of the main social choices, broadly
construed to include education and health outcomes. The same predictions would go through if
we were discussing publicly provided infrastructure capital, so I will also test various
infrastructure measures in the empirical section.
We should also expect that consensual societies will favor growth of future production
over redistribution of existing resources. Societies lacking a middle class consensus will see the
economic/political/ethnic elite underinvest in human and infrastructure capital because they fear

6
empowering the opposition. We also may see more political instability as the elite is sometimes
successfully – but often temporarily -- displaced from its access to the spoils of power.
II. Empirical testing on commodity endowment, middle class consensus, and development
In this section, I test some of the propositions advanced by the previous literature and by
the story in this paper. The previous literature and this model suggests that the middle class share
and ethnic diversity are fundamental determinants of incentives to invest in the future, and so
would determine many of the right-hand side variables in growth or income regressions. I will
run parsimonious regressions of growth, income, human capital accumulation, and infrastructure
on ethnic diversity and inequality. Given the auxiliary predictions for democracy and political
instability, I will also relate those variables to the middle class consensus. Table 1 reports
summary statistics on the variables in the paper. The data on inequality are the broadest possible
sample from Deininger and Squire 1996. The ethnolinguistic fractionalization, which varies from
0 to 100, is from Easterly and Levine 1997.

7
Table 1: Statistics on variables used in this paper Variable Mean
Median Maximum
Minimum Std. Dev.
Obser- vations
Cabinet changes per year 60-88 0.39 0.36 1.07 0.00 0.22 168 Civil liberty, 1998 3.57 4.00 7.00 1.00 1.79 190 Constitutional changes per year 60-88 0.10 0.10 0.36 0.00 0.09 168 Dummy for non-oil commodity exporting
0.22 0.00 1.00 0.00 0.42 175
Dummy for oil exporting 0.09 0.00 1.00 0.00 0.28 175 Dummy for Tropical Location 0.50 0.00 1.00 0.00 0.50 229 Ethnic diversity,1960 41.47 42.00 93.00 0.00 29.79 113 Faults per phone line 67.60 47.50 350.00 2.00 74.23 62 GDP Per capita 60 2247 1316 9895 257 2186 124 GDP Per capita 90 5825 3780 22660 400 5719 152 Growth Per Capita 1950-92 (Summers-Heston), average of available data
0.02 0.02 0.07 -0.08 0.02 146
Immunization DPT (%) 74.76 82.00 100.00 13.00 21.66 145 Immunization Polio (%) 75.68 83.00 100.00 13.00 21.85 145 Infant mortality 1990 86.45 89.00 194.00 3.00 56.36 141 Infants, low birth weight,1990 11.95 10.00 50.00 4.00 6.53 111 Life expectancy 1997 66.37 69.80 79.99 37.51 10.23 194 Black market premium 1997 0.704 0.04 46.6 -0.89 4.517 142 Log inflation 1960-98 0.15 0.08 1.42 0.03 0.21 136 M2 to GDP 1997 43.90 35.12 206.25 6.09 32.63 140 Middle class share (share of quintiles 2-4), average 60-96
46.71 48.04 57.70 30.00 7.11 103
Percent of population with access to clean water 1990
68.32 72.00 100.00 12.00 24.34 104
Percent of population with access to sanitation 1990
56.75 56.00 100.00 1.00 33.35 120
Percent of roads paved 1990 45.55 42.00 100.00 0.00 31.61 191 Political rights,1998 3.47 3.00 7.00 1.00 2.24 190 PPP Trade Share in GDP 1997 35.69 25.72 290.71 3.37 37.89 133 Primary enrollment, 1990 0.86 1.00 1.00 0.15 0.22 120 Real exchange rate overvaluation (100=PPP) 1960-98
117.16
107.45 381.94 50.47 41.55 104
Revolutions and coups per year, 60-88 0.19 0.07 1.00 0.00 0.24 168 Secondary enrollment, 1990 0.49 0.44 1.00 0.03 0.31 118 Share of agriculture in GDP, 1990 20.4 17.5 65.5 0.3 15.8 162 Share of pop. in minorities at risk, 1990 0.28 0.17 1.00 0.01 0.27 111 Share of time at civil war 60-89 0.07 0.00 0.80 0.00 0.15 135 Telephones per capita, 1994 82.36 63.03 293.83 8.27 67.75 189 Tertiary enrollment, 1990 0.12 0.07 0.58 0.00 0.12 123 Urbanization ratio, 1990 51.0 49.7 100 5.2 24.0 197 For sources see Easterly and Yu 1999. A. Tropical endowments, commodity exporting, and inequality
I first test the hypothesis of Engerman and Sokoloff 1997 and 2000 that a tropical
endowment leads to commodity production, and that commodity production is associated with
8
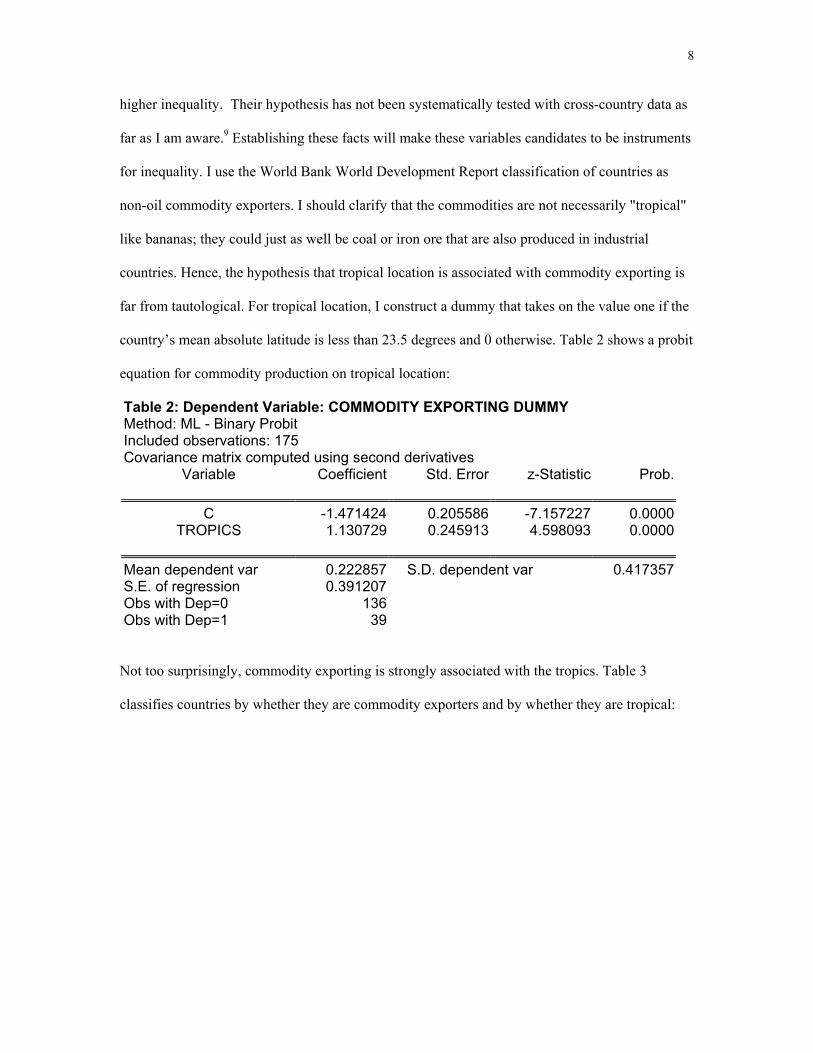
higher inequality. Their hypothesis has not been systematically tested with cross-country data as
far as I am aware.9 Establishing these facts will make these variables candidates to be instruments
for inequality. I use the World Bank World Development Report classification of countries as
non-oil commodity exporters. I should clarify that the commodities are not necessarily "tropical"
like bananas; they could just as well be coal or iron ore that are also produced in industrial
countries. Hence, the hypothesis that tropical location is associated with commodity exporting is
far from tautological. For tropical location, I construct a dummy that takes on the value one if the
country’s mean absolute latitude is less than 23.5 degrees and 0 otherwise. Table 2 shows a probit
equation for commodity production on tropical location:
Table 2: Dependent Variable: COMMODITY EXPORTING DUMMY Method: ML - Binary Probit Included observations: 175 Covariance matrix computed using second derivatives
Variable Coefficient Std. Error z-Statistic Prob.
C -1.471424 0.205586 -7.157227 0.0000 TROPICS 1.130729 0.245913 4.598093 0.0000
Mean dependent var 0.222857 S.D. dependent var 0.417357 S.E. of regression 0.391207 Obs with Dep=0 136 Obs with Dep=1 39
Not too surprisingly, commodity exporting is strongly associated with the tropics. Table 3
classifies countries by whether they are commodity exporters and by whether they are tropical:

9
Table 3: Commodity Exporting and Tropical Location # Countries Tropical Non-tropical Total
Commodity exporter 33 6 39
Non-commodity exporter
58 78 136
Total 91 84 175
Percent of row totals
Commodity exporter 36% 7%
Non-commodity exporter
64% 93%
Percent of column totals
Commodity exporter 85% 15%
Non-commodity exporter
43% 57%
The vast majority (85%) of commodity exporting nations are in the tropics. Tropical nations are 5
times more likely to be commodity exporters than temperate nations.
The next step is to see whether being commodity exporting is associated with higher
inequality, as hypothesized by Engerman and Sokoloff. Here is a simple regression of the share of
the middle three income quintiles on the commodity exporting dummy (in light of the foregoing
regression, TROPICS is an instrument for COMMOD) and a dummy for oil exporting nations:

10
Table 4: Dependent Variable: MIDDLE CLASS INCOME SHARE Method: Two-Stage Least Squares Included observations: 102 White Heteroskedasticity-Consistent Standard Errors & Covariance Instrument list: C TROPICS DUMMY, OIL DUMMY
Variable Coefficient Std. Error t-Statistic Prob.
C 51.63167 1.058569 48.77496 0.0000
COMMODITY DUMMY -19.62242 4.996424 -3.927293 0.0002 OIL DUMMY -10.88073 3.315207 -3.282066 0.0014
S.E. of regression 9.308190 Mean dependent var 46.75934 F-statistic 9.590131 S.D. dependent var 7.121557 Prob(F-statistic) 0.000156
Confirming the Engerman-Sokoloff hypothesis, commodity production (including oil production)
is associated with a lower share of income of the middle quintiles. The effect of commodity
exporting is enormous, equal to nearly 3 standard deviations of the middle income share. Going
from being a commodity exporter to being a non-commodity exporter explains two-thirds of the
entire range of the middle class share variable, which only varies between 30 and 58 percent. Oil
production also moves the middle income share by a sizeable amount, more than one standard
deviation.
B. The middle class consensus and per capita income and growth
I now have potential instruments for the middle income share to use in a regression of
income or growth on the middle income share and the ethnic fractionalization index. Of course,
these instruments must not only be correlated with the instrumented variables, they also must be
uncorrelated with the error term. TROPICS, for example, must enter the income equation only
through its effect on the middle income share. This is a strong assumption, which I will test
below.
I first use 1990 per capita income as the most general measure of economic development.
I adopt a very parsimonious specification that features only the middle class share (suitably

11
instrumented) and ethnic heterogeneity. We can think of this as a reduced form, where all the
variables that usually appear in income or growth regressions are endogenous outcomes of the
middle class consensus (many of them will indeed be dependent variables below).
I estimate the system of the inequality equation and the income equation jointly using
three stage least squares (Table 5). As always, there are benefits and costs from using a system
estimator. The benefit is that a system estimator is more efficient than a single equation estimator.
It also gives a more accurate estimate of the standard errors when we control for a possible
association of the error term in the middle class share equation and that in the per capita GDP
equation. The disadvantage of the system estimator is that any specification error in one equation
will be propagated to the other equation. I will attempt to deal with this problem in the
robustness checks.
Table 5: Estimation Method: Three-Stage Least Squares Instruments: Ethnic Fractionalization, Oil Dummy, Tropics Dummy, Constant
Coefficient Std. Error
t-Statistic Prob.
C(1) 50.8239 1.7441 29.14 0.000 C(2) -18.7833 5.3571 -3.51 0.001 C(3) -8.0868 3.6927 -2.19 0.030 C(4) 2.3079 1.4033 1.64 0.102 C(5) 0.1402 0.0292 4.80 0.000 C(6) -0.0098 0.0035 -2.81 0.006 Equation: Middle Class Share =C(1)+C(2)*COMMODITY DUMMY +C(3)*OIL DUMMY Observations: 83 Equation: LOG(GDP Per Capita 90)=C(4)+C(5)*Middle Class Share +C(6)*Ethnic Fractionalization Observations: 81
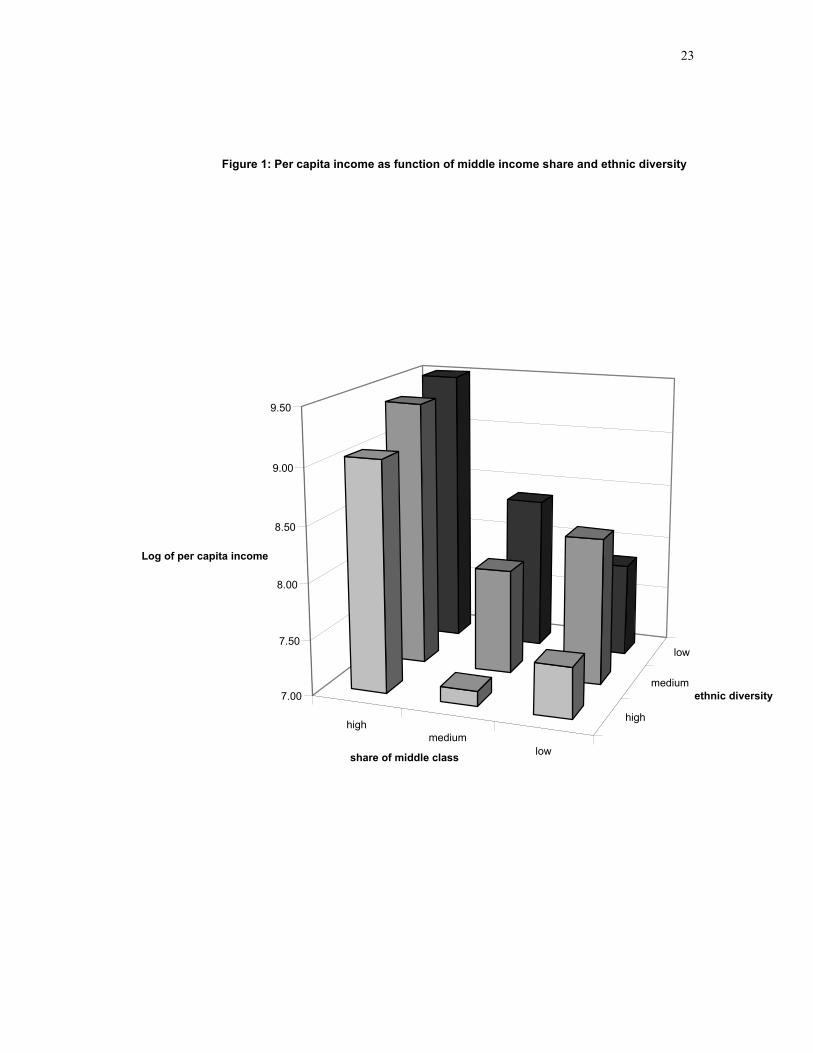
Per capita income is strongly influenced by the middle class share and by ethnic fractionalization.
A one standard deviation increase in the middle class share (7 percentage points) is associated
with an enormous movement of 1.2 standard deviations in log per capita income (equivalent to an
income increase by a factor of 3.4). The effect of ethnic diversity is not as strong but still
important: a one standard deviation increase in ethnic diversity lowers log income by one quarter

12
of a standard deviation.10 Figure 1 shows the fall in log income as one moves from high to low
terciles of the middle class share, as well as the fall in income from low to high terciles of ethnic
diversity.
It is also of interest to do a minimalist growth regression, using only the middle class
income share and ethnic fractionalization. The exercise is once again how much can be explained
by the middle class consensus hypothesis. Once again I use a system estimator:
Table 6: System estimation for Per Capita Growth as Dependent Variable
Estimation Method: Three-Stage Least Squares Instruments: Ethnic Fractionalization, Oil Dummy,
Tropics Dummy, Constant
Coefficient Std. Error t-Statistic Prob. C(1) 51.0619 1.7443 29.27 0.000 C(2) -19.1717 5.2902 -3.62 0.000 C(3) -9.1976 3.7984 -2.42 0.017 C(4) -0.0314 0.0238 -1.32 0.189 C(5) 0.0012 0.0005 2.51 0.013 C(6) -0.0001 0.0001 -2.48 0.014
Equation: Middle Class Share =C(1)+C(2)*COMMODITY DUMMY +C(3)*OIL
DUMMY Observations: 80
Equation: Per Capita Growth (1950-92)=C(4)+C(5)*Middle Class Share +C(6)*Ethnic
Fractionalization
Observations: 80 A one standard deviation increase in the middle class income share is associated with a
growth increase of .42 standard deviations, equivalent to one additional percentage point of per
capita growth. A movement from the minimum middle class income share to the maximum in
the sample is associated with an enormous increase in growth -- 3.8 percentage points.
A one standard deviation increase in ethnic fractionalization is associated with a growth
decrease of .21 standard deviations, equivalent to half of a percentage point of growth. A
movement from the minimum ethnic fractionalization to the maximum is associated with a fall in
growth of 1.5 percentage points.

13
Figure 2 shows the fall in the per capita growth rate as one goes from high to low middle
class share, and from low to high ethnic diversity. The highest growth rate is with a high middle
income share and low ethnic diversity; growth miracles Japan and Korea are in this group. The
lowest growth is with a low middle income share and high ethnic diversity. Guatemala, Sierra
Leone, and Zambia are examples of countries that fall in the low middle class share, high ethnic
diversity part of the sample.
How robust are these result to other exogenous factors that have been mentioned in the
literature? Bloom and Sachs (1998) and Sachs and Warner (1997) argue that being landlocked is
a geographic disadvantage for development. When I introduce a landlocked dummy as an
exogenous variable into either the income or growth regressions (and add it as an instrument in
this and the following system regressions), it is insignificant and the middle class share and ethnic
fractionalization remain significant.
These authors also argue that tropical location is a development disadvantage. I agree
with this thesis, but provide a structural explanation for why it matters -- through the effect on
inequality. I introduce the tropics dummy directly into the income or growth equation controlling
for middle class share and ethnic fractionalization. Although the tropics dummy weakens the
significance of the ethnic fractionalization variable in the income equation and of the middle class
share in the growth equation, the tropics dummy itself is not significant in either equation. Still,
insignificance does not prove the coefficient is zero, and the dependence of my results on the
exclusion restriction on the tropics dummy should be kept in mind. I may be overstating the role
of the middle class share if the "true" equation does contain a direct effect for the tropics dummy.
Another possibility is that commodity-exporting is directly detrimental to growth because
it sets off a frenzy of rent-seeking, overindebtedness, and under-investment in human capital
(Manzano and Rigobón 2000, Gylfason 2000, Lane and Tornell 1999, Sachs and Warner 1995). I
also try introducing the commodity exporting dummy directly into the income and growth
equations. In the income equation, it leaves the significance of middle class share and ethnic

14
fractionalization unchanged, while commodity-exporting is itself insignificant in these equations.
In the growth equation, the significance of the middle class share is weakened, but commodity
exporting itself remains insignificant.
Although the original Engermann-Sokoloff hypothesis was about inequality driven by
economies of scale in cash crops for export, I test whether inequality is robust to the choice of
structure of production rather than the structure of exports as the determining variable. I
construct data on the share of agriculture and mining value added in GDP by country, averaged
over 1960-98. I estimate the system of equations substituting this variable for the commodity-
exporting and oil-exporting dummies, and find that a high share of agriculture and mining indeed
predicts a low share for the middle class. Although ethnic fractionalization becomes insignificant
in the second equation for income, the share of the middle class is still a significant causal
determinant of both income and growth in this system.
Some of my illustrative examples were about land inequality. Does land inequality also
have a negative effect on income and growth like income inequality? It turns out that land
inequality is not as well explained by the commodity and oil exporting dummies, but it does seem
to be directly related to the tropics dummy. Instrumenting with tropics (and the other exogenous
characteristics), higher land inequality significantly reduces both income and growth in three-
stage least squares regressions identical to those above except substituting the land Gini
coefficient for the middle class share. The source of the land Gini data is Deininger and Olinto
2000, where I average over all available years for each country.
Another robustness check I pursue is to apply the hypothesis to a completely different
dataset -- the dataset of US counties in 1990 studied by Alesina, Baqir, and Easterly 1999. I am
unable to instrument with a tropical dummy for inequality in US counties, so I just describe the
results of an OLS regression as a stylized fact. More unequal (measured by a higher ratio of mean
to median income, as in Alesina et al.) and more ethnically diverse US counties have lower
average per capita incomes compared to more homogeneous and equal counties, controlling for

15
whether the county is urban or rural. Although not causal, these results are consistent with the
middle class consensus hypothesis as applied to intraregional variation in the US.
As a final robustness check, I investigate whether ethnic fractionalization enters in a
quadratic fashion, as some authors have suggested (Collier 1999, Collier and Hoeffler 1998).
This possibility might also be suggested by some non-monotonicity in Figures 1 and 2. I find
some evidence for a quadratic effect for the income regression, with a positive sign on the linear
term and a negative term on the quadratic term for ethnic fractionalization. The turning point is at
Ethnic Fractionalization = 28 on a scale of 0 to 100, so for most of the range of the variable, the
relationship is still negative. I find no evidence for a quadratic effect in the growth regression.
To summarize, the result that per capita income and growth depends positively on middle
class share and negatively on ethnic fractionalization is robust to instrumenting for endogeneity,
alternative control variables, and choice of datasets. I regard this result as the key result of the
paper, subject to the usual caveats about adequacy of the instruments, suggesting that the middle
class consensus is a deep fundamental determining development outcomes.
III. The middle class consensus and other development outcomes
A. The middle class consensus and human and infrastructure capital accumulation
I now look directly at whether the middle class share and ethnic fractionalization are
related to human capital accumulation and other public goods. Table 7 shows the results from
system estimations – of the exact same form as for income and growth -- for different dependent
variables, showing only the coefficients for each dependent variable on the middle class share and
ethnic fractionalization. These can be thought of as joint reduced form equations with the income
and growth equations. I will test later how controlling for per capita income (which is difficult to
do because of its endogeneity) affects these results.
Starting first with the education variables, we see that the middle class share has a weak
association with primary enrollment, and a strong association with secondary and tertiary
enrollment. Ethnic diversity does not have much of an association with tertiary enrollment, but is

16
related to primary and secondary enrollment. To get an idea of the magnitude of these effects, a
one standard deviation increase in ethnic diversity lowers secondary enrollment by .26 standard
deviations, while a one standard deviation decrease in the middle income share lowers secondary
enrollment by .93 standard deviations.
On health, the middle income share affects all the indicators: life expectancy, infant
mortality, low birth weight of infants, percent of children immunized against
Table 7: Results of 3SLS regressions of human capital and infrastructure related variables on share of the middle class and ethnic diversity
Dependent variable: RHS variable Coefficient T-statistic #observations
Education: Primary enrollment Middle class share 0.0075 1.42 76
Ethnic diversity -0.0021 -3.05 Secondary enrollment Middle class share 0.0402 5.15 76
Ethnic diversity -0.0027 -2.91 Tertiary enrollment Middle class share 0.0170 4.51 79 Ethnic diversity -0.0005 -0.95 Health: Life expectancy Middle class share 1.0794 4.18 83
Ethnic diversity -0.1353 -4.56 Infant mortality Middle class share -5.1633 -4.08 77
Ethnic diversity 0.4551 2.69 Infants, low birth weight Middle class share -0.3825 -2.55 72 Ethnic diversity 0.0755 3.81 Immunization DPT (%) Middle class share 1.7796 3.04 80 Ethnic diversity -0.1048 -1.55 Immunization Polio (%) Middle class share 1.5629 2.78 80 Ethnic diversity -0.1518 -2.32 Infrastructure: Percent of roads paved Middle class share 4.2969 5.52 81 Ethnic diversity -0.1099 -1.16 Access to clean water (%) Middle class share -0.4882 -0.25 51 Ethnic diversity -0.3446 -3.62 Access to sanitation (%) Middle class share 2.5587 2.54 77
Ethnic diversity -0.2989 -2.50 Log(telephones per capita) Middle class share 0.1206 4.81 82
Ethnic diversity -0.0078 -2.60 Faults per phone line Middle class share 0.6374 0.26 35
Ethnic diversity 1.3833 3.65

17
Notes: each equation contains a constant (not shown) and is part of a system with one other equation, which gives the middle class share as a function of a commodity-exporting dummy and oil-exporting dummy (both of which are generally significant and similar to the results in Tables 5
and 6). Instruments for the whole system are the oil dummy, tropical location, and ethnic diversity.
DPT, and percent of children immunized against polio. Ethnic diversity also significantly affects
virtually all the indicators, with the expected sign: higher ethnic diversity leads to worse health
outcomes and lower levels of publicly provided health services.11 A one standard deviation
increase in middle class share lowers infant mortality by .73 standard deviations, while a one
standard deviation fall in ethnic diversity lowers infant mortality by .25 standard deviations.
On infrastructure, the results are less uniform. The middle class income share does not
affect access to clean water or faults per telephone line, but increases percent of roads paved,
access to sanitation, and telephones. Ethnic diversity does not affect percent of roads paved, but
it lowers access to clean water, access to sanitation, telephones, and increases telephone faults per
line. A one standard deviation increase in the middle class share raises access to sanitation by .53
standard deviations, while a one standard deviation fall in ethnic diversity raises access to
sanitation by .27 standard deviations.
There is some variation as to which kind of polarization – by class or by ethnic group –
matters for the different indicators. Overall, however, these results are supportive of the
hypothesis that a middle class consensus -- measured by share of the middle class and ethnic
homogeneity -- is associated with higher levels of human and infrastructure capital accumulation.
B. Economic policies and the middle class consensus
The existence of a middle class consensus also affects the choice of economic policies.
Societies with a middle class consensus will choose policies to promote growth, while societies
polarized by class and ethnic group will opt for redistributive policies. The following table shows
the effect of the middle class share and ethnic diversity on four key policy indicators – the black
market premium, real overvaluation, financial depth, and trade openness.
18
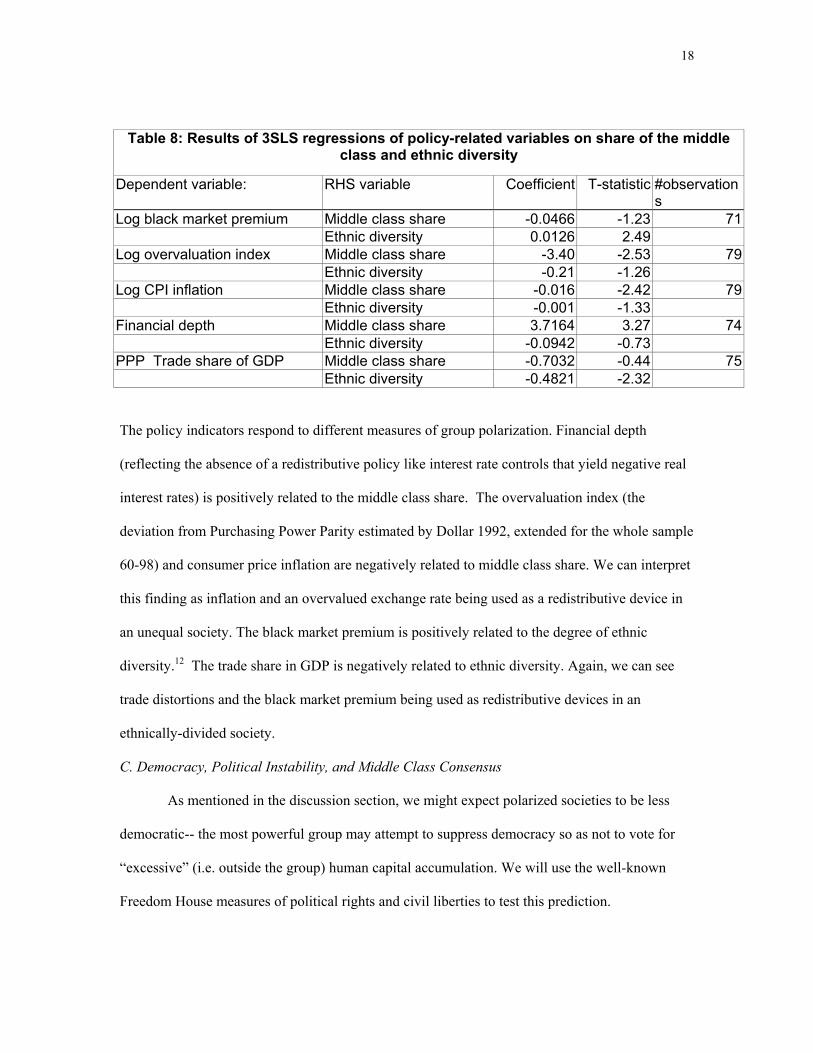
Table 8: Results of 3SLS regressions of policy-related variables on share of the middle class and ethnic diversity
Dependent variable: RHS variable Coefficient T-statistic #observations
Log black market premium Middle class share -0.0466 -1.23 71 Ethnic diversity 0.0126 2.49
Log overvaluation index Middle class share -3.40 -2.53 79 Ethnic diversity -0.21 -1.26 Log CPI inflation Middle class share -0.016 -2.42 79 Ethnic diversity -0.001 -1.33 Financial depth Middle class share 3.7164 3.27 74
Ethnic diversity -0.0942 -0.73 PPP Trade share of GDP Middle class share -0.7032 -0.44 75 Ethnic diversity -0.4821 -2.32
The policy indicators respond to different measures of group polarization. Financial depth
(reflecting the absence of a redistributive policy like interest rate controls that yield negative real
interest rates) is positively related to the middle class share. The overvaluation index (the
deviation from Purchasing Power Parity estimated by Dollar 1992, extended for the whole sample
60-98) and consumer price inflation are negatively related to middle class share. We can interpret
this finding as inflation and an overvalued exchange rate being used as a redistributive device in
an unequal society. The black market premium is positively related to the degree of ethnic
diversity.12 The trade share in GDP is negatively related to ethnic diversity. Again, we can see
trade distortions and the black market premium being used as redistributive devices in an
ethnically-divided society.
C. Democracy, Political Instability, and Middle Class Consensus
As mentioned in the discussion section, we might expect polarized societies to be less
democratic-- the most powerful group may attempt to suppress democracy so as not to vote for
“excessive” (i.e. outside the group) human capital accumulation. We will use the well-known
Freedom House measures of political rights and civil liberties to test this prediction.

19
We might expect that societies that opt for redistributive policies would also have more
unstable governments, as different factions fight for the spoils of power. This could show up most
overtly as civil war, or less violently as revolutions, coups, constitutional changes, and cabinet
changes.
Struggles over redistribution may also put minority groups at risk of economic or
political discrimination, or even violent oppression. This type of political instability is captured
well by the “Minorities at Risk” measure of Gurr (1993), which measures the percent of the
population belonging to minorities at risk.
Table 9 shows the results of system estimation with democracy and political instability
variables as the dependent variable in the second equation (the first equation as always
determines the middle class share endogenously as a function of commodity-exporting and oil-
exporting, instrumenting for commodity exporting with tropical location). Suppression of civil
liberties decreases with middle class share, but is not related to ethnic diversity. The measure of
suppression of political rights increases with ethnic diversity and decreases with the share of the
middle class. A middle class consensus is good for democracy. A one standard deviation increase
in the middle class share raises political rights by .57 standard deviations, while a one standard
decrease in ethnic diversity raises political rights by .21 standard deviations.
As far as political instability, one or the other polarization measure is statistically
significant for civil war, revolutions and coups, constitutional changes, and minorities at risk,
while cabinet changes do not appear to be related to these polarization measures. More ethnic
diversity is associated with more time in civil war, greater share of the population belonging to
minorities at risk, and more constitutional changes, while a greater share for the middle class is
associated with fewer revolutions and coups and fewer constitutional changes.13

20
Table 9: Results of 3SLS regressions of democracy and political instability variables on share of the middle class and ethnic diversity
Dependent variable: RHS variable Coefficient T-statistic #observations
Political rights (1-7 where 1 is most free)
Middle class share -0.1577 -2.77 82
Ethnic diversity 0.0146 2.02 Civil liberties (1-7 where 1 is most free)
Middle class share -0.1359 -3.14 82
Ethnic diversity 0.0069 1.22 Percent of period in civil war Middle class share -0.0072 -1.40 76
Ethnic diversity 0.0014 2.02 Revolutions and coups per year
Middle class share -0.0153 -2.01 82
Ethnic diversity 0.0009 0.96 Constitutional changes per year
Middle class share -0.0065 -3.00 82
Ethnic diversity 0.0007 2.51 Cabinet changes per year Middle class share 0.0115 1.57 82
Ethnic diversity 0.0001 0.08 Minorities at Risk (% of population)
Middle class share -0.009 -1.02 60
Ethnic diversity 0.003 2.50
D. “Modernization” indicators and the middle class consensus
We can also examine the effect of the middle class consensus on other indicators of a
society’s development or “modernization.” More developed societies move away from
agriculture towards industry and services (see Kongsamut, Rebelo, and Xie 1997 for a recent
treatment). In Table 10, I use the share of agriculture in GDP as the dependent variable in the
second equation of the 3SLS system. I find that societies with a larger middle class and more
ethnolinguistic homogeneity have smaller agriculture shares.
Another indicator of “modernization” is the share of the population that lives in cities. In
Table 10, I show the coefficients of the urbanization ratio regressed in the 3SLS system on the
middle class share and ethnolinguistic heterogeneity. A larger and more homogenous middle
class is associated with more urbanization. A one standard deviation increase in the middle class
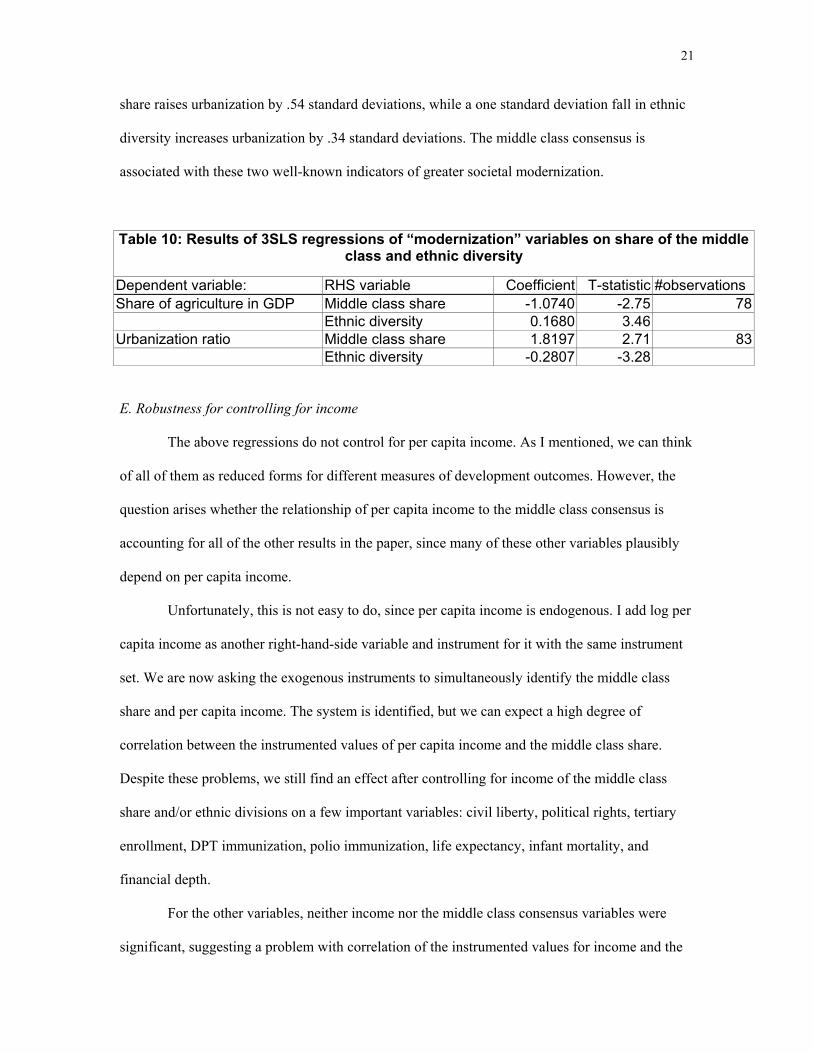
21
share raises urbanization by .54 standard deviations, while a one standard deviation fall in ethnic
diversity increases urbanization by .34 standard deviations. The middle class consensus is
associated with these two well-known indicators of greater societal modernization.
Table 10: Results of 3SLS regressions of “modernization” variables on share of the middle class and ethnic diversity
Dependent variable: RHS variable Coefficient T-statistic #observations Share of agriculture in GDP Middle class share -1.0740 -2.75 78 Ethnic diversity 0.1680 3.46 Urbanization ratio Middle class share 1.8197 2.71 83 Ethnic diversity -0.2807 -3.28
E. Robustness for controlling for income
The above regressions do not control for per capita income. As I mentioned, we can think
of all of them as reduced forms for different measures of development outcomes. However, the
question arises whether the relationship of per capita income to the middle class consensus is
accounting for all of the other results in the paper, since many of these other variables plausibly
depend on per capita income.
Unfortunately, this is not easy to do, since per capita income is endogenous. I add log per
capita income as another right-hand-side variable and instrument for it with the same instrument
set. We are now asking the exogenous instruments to simultaneously identify the middle class
share and per capita income. The system is identified, but we can expect a high degree of
correlation between the instrumented values of per capita income and the middle class share.
Despite these problems, we still find an effect after controlling for income of the middle class
share and/or ethnic divisions on a few important variables: civil liberty, political rights, tertiary
enrollment, DPT immunization, polio immunization, life expectancy, infant mortality, and
financial depth.
For the other variables, neither income nor the middle class consensus variables were
significant, suggesting a problem with correlation of the instrumented values for income and the

22
middle class share. For these variables, we need to qualify the conclusion that the middle class
consensus is directly determining these outcomes, as it may be working through per capita
income. The regressions remain valid expressions of the reduced form relation between the
middle class consensus and the development outcomes.
V. Conclusions
Countries with a middle class consensus have a higher level of income and growth. We
can see why relatively homogenous middle-class societies have more income and growth, they
have more human capital and infrastructure accumulation, they have better national economic
policies, more democracy, less political instability, more “modern” sectoral structure, and more
urbanization.
Readers of previous papers on difficulties created by ethnic heterogeneity often ask what
policy implications follow. Surely we do not want to give intellectual comfort to those who
engage in “ethnic cleansing.” However, the result on the poor development outcomes associated
with ethnic heterogeneity only says that, on average, politicians exploit ethnic divisions to the
detriment of growth. It remains a choice for individual politicians whether they seek to divide and
conquer, or to promote interethnic consensus. Easterly 2000 also suggests that good institutions
eliminate the adverse effects of ethnic conflict, although again good institutions are less likely a
priori with high ethnic diversity.
The results in this paper are consistent with stories in which elite-dominated societies will
accumulate less human and infrastructure capital for the majority because of the fear of
empowering groups outside the elite’s own class or ethnic group. I relate the degree of middle
class consensus to tropical endowments which led to commodity-exporting (as in the Engermann-
Sokoloff hypothesis) and to ethnolinguistic fragmentation. This paper's argument suggests that
rich societies are rich, not because of superior culture as Landes 1998 would argue, but more
because of accidental geographic and demographic make-up as argued by Diamond 1997.
23
highmedium
low
high
medium
low
7.00
7.50
8.00
8.50
9.00
9.50
Log of per capita income
share of middle class
ethnic diversity
Figure 1: Per capita income as function of middle income share and ethnic diversity

24
highmedium
low
high
medium
low
0.0%
0.5%
1.0%
1.5%
2.0%
2.5%
3.0%
3.5%
4.0%
Per capita growth 1950-92
middle income share
ethnic diversity
Figure 2: Growth as function of middle income share and ethnic diversity

25
Bibliography
Acemoglu Daron and James A. Robinson, 1998, “Why Did the West Extend the Franchise? Democracy, Inequality and Growth in Historical Perspective,” Acemoglu web site at MIT, December 1998
Adelman, Irma and Cynthia Taft Morris, Society, politics, and economic development: a quantitative approach, Johns Hopkins Press, Baltimore, 1967.
Ake, Claude. Democracy and Development in Africa. The Brookings Institution: Washington DC, 1996.
Alesina, Alberto, “Political Models of Macroeconomic Policy and Fiscal Reforms,” in Stephan Haggard and Steven Webb, eds. Voting for Reform: Democracy, Political Liberalization, and Economic Adjustment, (New York, NY: Oxford Univ. Press, 1994).
Alesina, Alberto, Reza Baqir, and William Easterly, “Public Goods and Ethnic Divisions,” Quarterly Journal of Economics, November, 1999a.
Alesina, Alberto, Reza Baqir, and William Easterly, “Redistributive government employment,” Journal of Urban Economics, forthcoming, 1999b
Alesina, Alberto and Eliana La Ferrara, “Participation in heterogeneous communities,” NBER Working Paper 7155, June 1999.
Alesina, Alberto and Dani Rodrik, 1994, “Distributive politics and economic growth,” Quarterly Journal of Economics 108: 465-90.
Annett, Anthony. “Ethnic and religious division, political instability, and government consumption,” IMF mimeo, March 1999.
Bales, Kevin. Disposable people: new slavery in the global economy. (Berkeley: University of California Press), 1999
Barro R. J. (2000). “Inequality and Growth in a Panel of Countries,” Journal of
Economic Growth, 5, 5-32.
Barro, Robert and Xavier Sala-I-Martin, Economic Growth, McGraw-Hill, 1995.
Barro R. J. (1996). “Democracy and Growth,” Journal of Economic Growth 1, 1-28.
Bénabou, Roland. “Heterogeneity, stratification, and growth: macroeconomic implications of community and school finance,” AMERICAN ECONOMIC REVIEW 86, No. 3:584-609, June 1996.
Benabou, Roland. “Workings of a city: location, education, and production,” QUARTERLY JOURNAL OF ECONOMICS 108:619-52 August 1993
Berge, Kersti and Adrian Wood, "Exporting Manufactures: Human Resources, Natural Resources, and Trade Policy", Journal of Development Studies v34, n1 (October 1997): 35-59

26
Bhaduri, Amit. “A study in agricultural backwardness under semi-feudalism,” Economic Journal Vol. 83, No. 329, March 1973, pp. 120-137.
Birdsall, Nancy, David Ross, and Richard Sabot, “Inequality and growth reconsidered,” World Bank mimeo, February 1994.
Birdsall, Nancy and Juan Luis Londoño, Asset inequality matters: an assessment of the World Bank's approach to poverty reduction. AMERICAN ECONOMIC REVIEW, PAPERS AND PROCEEDINGS 87, No. 2:32-37, May 1997
Bloom, David E. and Jeffrey D. Sachs. “Geography, Demography, and Economic Growth in Africa”, Brookings Papers on Economic Activity 1998:2
Bourguignon, François and Thierry Verdier, Oligarchy, democracy, inequality and
growth, Journal Of Development Economics (62)2 (2000) pp. 285-313
.Bourguignon François. "Croissance, distribution et ressources humaines: Comparaison internationale et specificites regionales." Revue d'Economie du Developpement v0, n4 (December 1993): 3-35
Bourguignon François and C. Morrison, "Income Distribution, Development and Foreign Trade: A Cross-sectional Analysis", European Economic Review v34, n6 (September 1990): 1113-32
Bruno, Michael, Martin Ravallion, and Lyn Squire, “Equity and growth in developing countries: old and new perspectives on the issues, World Bank Policy Research Working Paper 1563, January 1996.
Case, Anne and Lawrence Katz. “The Company You Keep: The Effects of Family and Neighborhood on Disadvantaged Youths,” NBER Working Paper 3705, May 1991.
Casella, Alessandra and James E. Rauch. “Anonymous Market and Group Ties in International Trade,” NBER Working Paper No. W6186, September 1997
Clarke, George. “More evidence on income distribution and growth,” Journal of Development Economics Vol. 47, 1995, 403-427.
Collier, Paul, “Nigeria: Economic Policy Reforms for Growth and Poverty Reduction,” Oxford, mimeo, 1995.
Collier, Paul. “Ethnicity, politics, and economic performance,” mimeo 1999.
Collier, Paul and Anke Hoeffler, “On economic causes of civil war,” Oxford Economic Papers 50 (1998), 563-573.
Cutler, David M. Edward L. Glaeser, and Jacob L. Vigdor The Rise and Decline of the American Ghetto, Journal of Political Economy, Volume 107, Number 3, June 1999, 455-506

27
Decornez, Shubhasree Seshanna. “An empirical analysis of the American middle class (1968-1992),” Ph.D. Dissertation, Vanderbilt University, August 1998.
Deininger, Klaus and Lyn Squire, “New ways of looking at old issues: inequality and growth,” JournalofDevelopmentEconomics;57(2), December 1998, pages 259-87
Deininger, Klaus and Lyn Squire, “A New Data Set Measuring Income Inequality,” World Bank Economic Review;10(3), September 1996, pages 565-91.
Diamond, Jared. Guns, germs, and steel.
Durlauf, Steven, “A Theory of Persistent Income Inequality,” Journal of Economic Growth, Volume 1, No. 1, 75-94
Easterly, William and Ross Levine, “Africa’s Growth Tragedy: Policies and Ethnic Divisions,” Quarterly Journal of Economics, November 1997.
Easterly, William and Hairong Yu, “Global Development Network Growth Database,” http://www.worldbank.org/html/prdmg/grthweb/GDNdata.htm, November 1999. Easterly,William.” Can institutions resolve ethnic conflict?” Economic Development and Cultural Change, forthcoming, 2000.
Engerman, Stanley and Kenneth Sokoloff, 1997, “Factor Endowments, Institutions, and Differential Paths of Growth Among New World Economies: A View from Economic Historians of the United States,” in Stephen Haber, ed. How Latin America Fell Behind, Stanford University Press (Stanford CA).
Filmer, Deon, and Lant Pritchett, “Child mortality and public spending on health : how much does money matter?”, World Bank Policy research working paper 1864, December 1997.
Forbes, Kristin. “A Reassessment of the Relationship Between Inequality and Growth”, forthcoming American Economic Review, 2000.
Galor, Oded and Joseph Zeira, “Income distribution and macroeconomics,” Review of Economic Studies 60: 35-52.
Goldin, Claudia and Lawrence Katz, “The shaping of higher education: the formative years in the United States, 1890 to 1940”, Journal of Economic Perspectives, Winter 1999, Volume 13, No 1, 37-62.
Goldin, Claudia and Lawrence Katz, “Why the United States led in education: lessons from secondary school expansion, 1910 to 1940,” NBER Working Paper 6144, August 1997.
Grabowski, Richard. “Economic development and feudalism.” Journal of Developing Areas 25 (January 1991), 179-196.
Gradstein M. and M. Justman (1995), A Political Interpretation of the Kuznets Curve, Mimeo.

28
Greenberg, Stanley. Race and State in Capitalist Development: Comparative Perspectives. Yale University Press. 1980.
Gurr, Ted Robert. Minorities at risk : a global view of ethnopolitical conflicts with contributions by Barbara Harff, Monty G. Marshall, James R. Scarritt. Washington, D.C. : United States Institute of Peace Press, 1993
Gylfason, Thorvaldur. "Natural resources, education, and economic development," Center for Economic Policy Research Working Paper No. 2594, October 2000.
Harrison, Bennett and Barry Bluestone. The great u-turn : corporate restructuring and the polarizing of America New York : Basic Books, 1988
Inter-American Development Bank, Economic and Social Progress in Latin America: Facing up to inequality in Latin America, 1998-1999 report. Jovanovic, Boyan. “Growth Theory.” NBER Working Paper 7468, January 2000.
Knack, Stephen, and Philip Keefer, “Institutions and Economic Performance: Cross-Country Tests Using Alternative Institutional Measures,” Economics and Politics, VII (1995), 207-227.
Kongsamut, Piyabha, Sergio Rebelo, and Danyang Xie. “Beyond Balanced Growth,” NBER Working Paper No. 6159, September 1997
Knack, Stephen, and Philip Keefer, “Does Social Capital Have an Economic Payoff? A Cross-country Investigation,” Quarterly Journal of Economics, Vol. CXII, Issue 4, November 1997, 1251-1288
Kreml, William P. America’s Middle Class: From Subsidy to Abandonment. Carolina Academic Press: Durham NC, 1997.
Lal, Deepak. Unintended consequences : the impact of factor endowments, culture, and politics on long run economic performance. Cambridge, Mass. : MIT Press, 1998
Landes, David. 1998. The Wealth and Poverty of Nations. Norton (New York NY).
La Porta, Rafael, Florencio Lopez-de-Silanes, Andrei Shleifer, and Robert Vishny, “The quality of government,” NATIONAL BUREAU OF ECONOMIC RESEARCH WORKING PAPER SERIES 6727, September 1998
Peter Laslett, The World We Have Lost, MacMillan
Mankiw, N. Gregory, David Romer, and David Weil, “A Contribution to the Empirics of Economic Growth,” Quarterly Journal of Economics 101 (May): 407-437.
Manzano, Osman and Roberto Rigobón. "Resource Curse or Debt Overhang?", paper presented at MIT Energy Lab conference, November 2000.
Miguel, Ted. “Ethnic diversity and school funding in Kenya.” Mimeo, Harvard University, November 1999

29
Milanovic, Branko. “Explaining the increase in inequality during transition,” Economics of Transition, Volume 7 (2) 1999, 299-341.
Moore, Barrington Jr., The Social Origins of Dictatorship and Democracy. Boston: Beacon Press, 1966
Perotti, Roberto (1996), “Growth, Income Distribution, and Democracy: What the data say,” Journal of Economic Growth.
Persson, Torsten and Guido Tabellini (1994), “Is inequality harmful for growth?”, American Economic Review 84: 600-621.
Psacharopoulos, George and Harry Anthony Patrinos, eds. Indigenous people and poverty in Latin America : an empirical analysis Brookfield, USA : Avebury, 1996
Donald Rothchild, “An Interactive Model for State-Ethnic Relations,” in Francis Deng and William Zartman, eds., Conflict Resolution in Africa, Brookings, 1991, pp. 190-215.
Sachs, Jeffrey and Andrew Warner, 1997, “Fundamental sources of long-run growth,” American Economic Review Papers and Proceedings, May, Vol 87 No 2, 184-188.
Sachs, Jeffrey and Andrew Warner, 1995. "Natural resource abundance and economic growth," NBER Working Paper 5398.
Scarritt, James R., “Communal conflict and contention for power in Africa South of the Sahara”, in Ted Robert Gurr, ed. Minorities at Risk: A Global View of Ethnopolitical Conflicts, (Washington, DC: United States Institute of Peace Press, 1993). pp. 252 - 289
Sen, Amartya. Development as Freedom. (New York: Knopf). 1999.
Sidanius, Jim and Felicia Pratto. Social Dominance: An Intergroup Theory of Social Hierarchy and Oppression. (Cambridge UK: Cambridge University Press), 1999.
Soyinka, Wole. The Open Sore of a Continent: a Personal Narrative of the Nigerian Crisis (New York: Oxford, 1996).
Svensson, Jakob. “Foreign aid and rent-seeking,” World Bank, Development Economics Research Group, Policy research working paper 1880. [1998]
Tornell, Aaron and Philip Lane. “The Voracity Effect.” American Economic Review, March 1999
Thorner, Alice. “Semi-Feudalism or Capitalism? Contemporary Debate on Classes and Modes of Production in India,” Economic and Political Weekly, in 3 parts, December 4, 11, and 18, 1982; Vol XVII, No. 49: 1961-1968, No. 50: 1993-1999, No. 51: 2061-2066.
Tilkidjiev, Nikolai. Editor. The Middle Class as a Precondition of a Sustainable Society. Association for Middle Class Development: Sofia. 1998.
Young, Alwyn. “Invention and Bounded Learning by Doing,” Journal of Political Economy, Vol. 101, No. 3. (Jun., 1993), pp. 443-472.

30
Wallace, Claire and Christian Haerpfer, “Some characteristics of the new middle class in central and eastern Europe: a 10 nation study,” Institute for Advanced Studies, Vienna, Sociological Series No. 30, July 1998.

31
Endnotes 1 Views expressed here are not necessarily of the views of the World Bank or its member governments. I am grateful for comments by Thorsten Beck, Stan Engermann, Karla Hoff, Aart Kraay, Ross Levine, Branko Milanovic, Guy Pfeffermann, Maurice Schiff, and Ken Sokoloff and from participants in seminars at Georgetown University and at the Inequality Workshop at the World Bank. 2 I am indebted for this quote to Miguel 1999 3 p. 30, Adelman and Morris 1967. 4 Forbes 2000 challenges these findings by using a GMM estimator that removes country effects and focuses on short-term intertemporal variation (across 5-year periods). A recent paper by Barro 2000 also uses panel methods to dispute the effect of inequality on growth, and argues that it only holds for the poorest countries. However, since the argument of this paper and many of those listed are on inequality as a long-run source of polarization and underdevelopment, Forbes’ and Barro’s findings are not at the relevant frequency. Moreover, Deininger and Olinto 2000 find that even in Forbes’ econometric methodology land inequality has a causal negative effect on growth. 5 Another author who emphasizes the importance of factor endowments is Lal 1998. 6 p. 41, Adelman and Morris 1967. 7 Berge and Wood 1997 relate primary commodity exporting to an abundance of natural resources relative to skill, which may be another mechanism by which they are related to inequality. Bourguignon and Morrison 1990 directly relate inequality to mineral exporting and land concentration in agricultural exports. Bourguignon 1993 uses mineral exporting as an instrument in a regression of growth on inequality. 8 This may be related to the famous thesis of Barrington Moore (1966) that (to simplify a little) when the commercial bourgeoisie (read middle class for our purposes) is strong, democracy emerges, whereas when landowners are dominant, dictatorship emerges. An alternative hypothesis for the motivation of extending the franchise is that the rich elite fears revolution (Acemoglu and Robinson 1998). Gradstein and Justman 1995 have voting determined by a minimum level of income, hence the franchise expands as income grows. 9 After completing a previous draft, I became aware of the 1998-99 report of the InterAmerican Development Bank (1999), which graphically shows correlations between commodity exports and income inequality and between latitude and income inequality. The advantage of my approach compared to theirs is that I make the endogenous variable (commodity exporting) respond to the exogenous variable (tropical location). 10 Easterly and Levine 1997 also found an effect of ethnic diversity, measured the same way, on income. 11 Filmer and Pritchett 1997 also found that higher ethnic diversity increases infant mortality. 12 Easterly and Levine 1997 also found an effect of ethnic diversity on the black market premium. 13 Annett 1999 also finds higher political instability with more ethnic diversity. Collier and Hoeffler 1998 also find a relationship between ethnic diversity and civil war but find it to be of an inverted U-shape – I use here a different measure of civil war (Sivard 1993) than theirs.