The Michael Price Student Investment...
57
TheMichaelPriceStudentInvestmentFund The Michael Price Student Investment Fund The Leonard N. Stern School of Business – New York University Annual Report August 31, 2011
Transcript of The Michael Price Student Investment...

The Michael Price Student Investment Fund
The Michael Price Student Investment Fund The Leonard N. Stern School of Business – New York University
Annual Report August 31, 2011
The Michael Price Student Investment Fund
1
NYU Stern’s Michael Price Student Investment Fund A Family of Funds Managed by
NYU Stern School of Business MBA Students
What is the Michael Price Student Investment Fund?
With over $1.75 million currently under management, the Michael Price Student Investment Fund (“MPSIF” or “the Funds”) is a family of funds managed directly by NYU Stern MBA students. The Funds, part of the overall NYU endowment, were established in 1999 through a generous gift from Michael Price, Managing Partner, MFP Investors, LLC and former Chairman of Franklin Mutual Series Funds.
What is unique about MPSIF?
The Michael Price Student Investment Fund provides Stern MBA students with hands on experience managing real Funds with significant assets. In addition, the Funds are required to pay an annual 5% dividend to the University Of Oklahoma Price School Of Business, Mr. Price’s undergraduate alma mater. This dividend assists students with their tuition and living expenses so they can attend summer classes at Stern. Additionally, MPSIF maintains a transparent record of our performance and classroom activities.
What is the portfolio composition?
For diversification purposes, MPSIF is divided into three equity Funds ‐ Growth, Value and Small Cap ‐ and one Fixed Income Fund. While each sub‐Fund has its own performance benchmark (Russell 1000 Growth Index, Russell 1000 Value Index, Russell 2000 and the Vanguard Total Bond Index, respectively), MPSIF’s primary goal is to deliver overall positive returns.
What role do Stern MBA students play in managing the Funds?
Students must go through a competitive process to become a portfolio manager or analyst with the Funds, which is the basis of Stern’s “Managing Investment Funds” course. Stern MBAs must apply to this course, and demand has always exceeded available spots. About 40 students enroll each year and are then responsible for all Fund activities—screening and evaluating stocks, preparing and presenting pitches for buy and sell recommendations and strategizing on broader portfolio issues as they relate to sectors allocation. For the Fixed Income Fund the primary role of analysts is to make tactical allocation recommendations and decisions based on market outlook and economic analyses among various product sectors.

The Michael Price Student Investment Fund
2
Executive Committee – Fall 2011
President David Umbro Co‐Portfolio Managers, Fixed Income Fund Sven Karlsson and Tom Libretto Co‐Portfolio Managers, Growth Fund Pamela Kaufman and Sarosh Nentin Co‐Portfolio Managers, Small Cap Fund Chris Hemmelgarn and Sven Karlsson Co‐Portfolio Managers, Value Fund Nicholas Wells and Greg McSweeney Faculty Advisor Professor Richard Levich
Executive Committee – Spring 2011 President Damian Karas
Co‐Portfolio Managers, Fixed Income Fund Mirette Kouchouk and Henry Chen
Co‐Portfolio Managers, Growth Fund Ling (Henry) Chen and Dennis Snopkowski
Co‐Portfolio Managers, Small Cap Fund Henry Chen and Justin Matthews
Co‐Portfolio Managers, Value Fund Patrick Fruzzetti and Robert Wynn
Faculty Advisor Professor Richard Levich
Internal Leadership – Fall 2011 Vice President, External Affairs Marguerite Pressley and Gopi Unnithan Vice President, Economic Strategy Laura Figlina and Sok Ung Vice President, Portfolio Analytics Brian Malkerson and Chris Hemmelgarn Vice President, Sector Strategy Amit Raybardhan Vice President, Annual Report Raymond Strecker Vice President, Marketing Swati Malik
Management Advisory Council David Dineen, Senior Portfolio Manager, Pinnacle Associates Nomi Ghez, Co‐founder of Circle Financial Group, retired Partner and Managing Director, Goldman Sachs Randall Haase, Portfolio Manager, Baron Fifth Avenue Growth Fund Monica Issar, Managing Director and Senior Advisor, JP Morgan Chase Christopher Long, Macro Portfolio Manager, Tudor Investment Corporation Richard Saperstein, Senior Portfolio Manager, Treasury Partners Ex Officio Members Rosemarie Loffredo, Vice President and Treasurer, New York University Tina Surh, Chief Investment Officer, New York University
Board of Advisors Dean Peter Henry, Stern School of Business, New York University Duane R. Stock, Professor of Finance, Price College of Business, University of Oklahoma Michael F. Price, Benefactor Martin Gruber, Professor of Finance, Stern School of Business Richard Levich, Professor of Finance, Stern School of Business Arthur Zeikel, Adjunct Professor of Finance, Stern School of Business
Resource Faculty Aswath Damodaran, Professor of Finance, Stern School of Business Martin Gruber, Professor of Finance, Stern School of Business Edward Kerschner, Adjunct Professor of Finance, Stern School of Business Fred Renwick, Emeritus Professor of Finance, Stern School of Business Matthew Richardson, Professor of Finance, Stern School of Business

The Michael Price Student Investment Fund
3
TABLE OF CONTENTS LETTER FROM THE FACULTY ADVISOR …………………………………………………………………...…………. 4
LETTER FROM THE PRESIDENT …………………………………………………………….……….…….……………. 5
THE MICHAEL PRICE STUDENT INVESTMENT FUND ………………………………….………….……………… 6 REVIEW OF OPERATIONS ……………………………………………………………………………….……………………………. 6
BENCHMARK INDEX DESCRIPTION ………………………………………………………………………………………………. 11
ASSET ALLOCATION …………………………………………………………………………………………………………………… 12
FUND TURNOVER ………………………………………………………………….…………………………………………………… 13
MACROECONOMIC AND MARKET REVIEW ……………………………………………………………...………………………. 13
THE GROWTH FUND …………………………………………………………………………………………………...... 17 MESSAGE FROM THE PORTFOLIO MANAGERS …………………………………………………………………………………. 17
DISCUSSION OF PERFORMANCE …………………………………………………………………………………………………….. 18
ASSET ALLOCATION ………………………………………………………………………………………………………………….. 21
HOLDINGS PROFILE …………………………………………………………………………………………………………................ 22
INVESTMENT STYLE AND STRATEGY …………………………………………………………………………………………….. 23
THE VALUE FUND …………………………………………………………………………………………………………. 24 MESSAGE FROM THE PORTFOLIO MANAGERS ………………………………………………………………………………… 24
DISCUSSION OF PERFORMANCE …………………………………………………………………………………………................ 25
ASSET ALLOCATION …………………………………………………………………………………………………………………… 27
HOLDINGS PROFILE …………………………………………………………………………………………………………………….. 28
INVESTMENT STYLE AND STRATEGY …………………………………………………………………………………………….. 29
THE SMALL CAP FUND ………………………………………………………………………………………………….. 30 MESSAGE FROM THE PORTFOLIO MANAGERS …………………………………………………………………………………. 30
DISCUSSION OF PERFORMANCE …………………………………………………………………………………………................ 33
ASSET ALLOCATION ………………………………………………………………………………………………………………….. 35
HOLDINGS PROFILE …………………………………………………………………………………………………………………… 36
INVESTMENT STYLE AND STRATEGY ……………………………………………………………………………………………. 37
THE FIXED INCOME FUND …………………………………………………………………………………………….. 38 MESSAGE FROM THE PORTFOLIO MANAGERS ……………………………………………………………………………….. 38
DISCUSSION OF PERFORMANCE ……………………………………………………………………………………………………. 40
ASSET ALLOCATION ………………………………………………………………………………………………………………….. 41
INVESTMENT STYLE AND STRATEGY ……………………………………………………………………………………............... 42
FUND MANAGEMENT ………………………………………………………………………………………………… 43 THE EXECUTIVE COMMITTEE ……………………………………………………………………………………………………… 43
THE GROWTH FUND ………………………………………………………………………………………………………………….. 45
THE VALUE FUND …………………………………………………………………………………………………………………….. 47
THE SMALL CAP FUND ……………………………………………………………………………………………………………….. 49
THE FIXED INCOME FUND …………………………………………………………………………………………………………… 51
FINANCIAL STATEMENTS ……………………………………………………………………………………………….. 52
The Michael Price Student Investment Fund
4
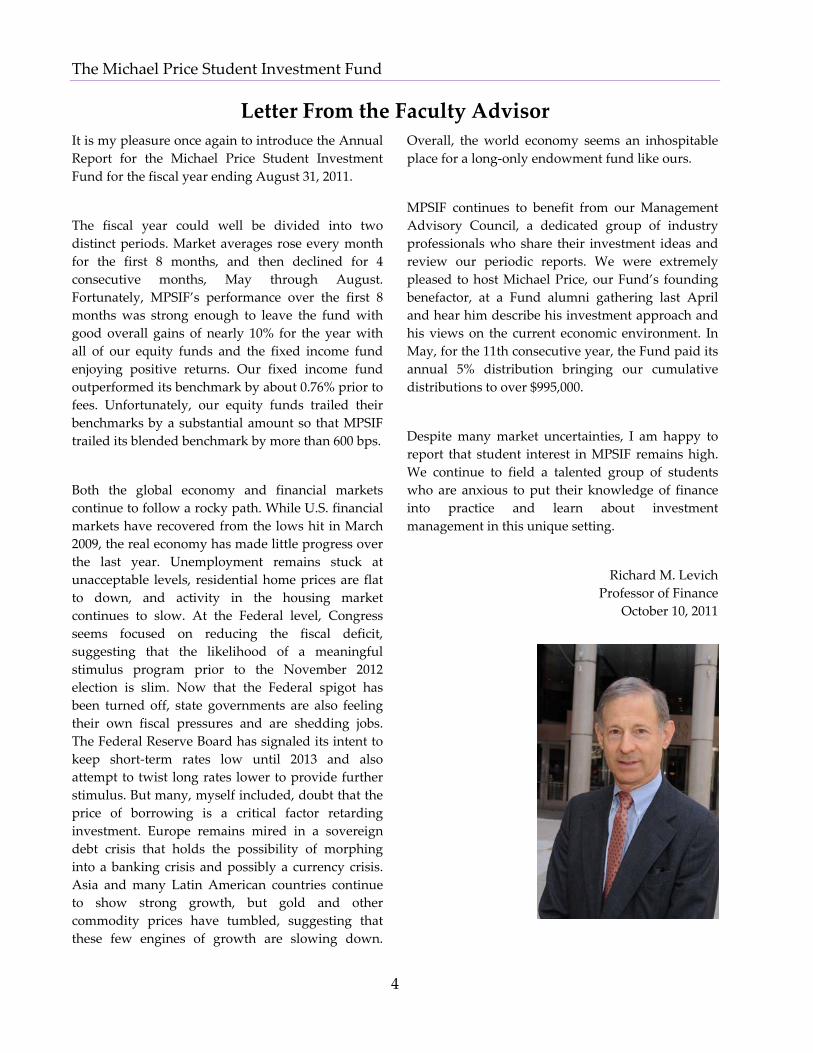
Letter From the Faculty Advisor It is my pleasure once again to introduce the Annual Report for the Michael Price Student Investment Fund for the fiscal year ending August 31, 2011.
The fiscal year could well be divided into two distinct periods. Market averages rose every month for the first 8 months, and then declined for 4 consecutive months, May through August. Fortunately, MPSIF’s performance over the first 8 months was strong enough to leave the fund with good overall gains of nearly 10% for the year with all of our equity funds and the fixed income fund enjoying positive returns. Our fixed income fund outperformed its benchmark by about 0.76% prior to fees. Unfortunately, our equity funds trailed their benchmarks by a substantial amount so that MPSIF trailed its blended benchmark by more than 600 bps.
Both the global economy and financial markets continue to follow a rocky path. While U.S. financial markets have recovered from the lows hit in March 2009, the real economy has made little progress over the last year. Unemployment remains stuck at unacceptable levels, residential home prices are flat to down, and activity in the housing market continues to slow. At the Federal level, Congress seems focused on reducing the fiscal deficit, suggesting that the likelihood of a meaningful stimulus program prior to the November 2012 election is slim. Now that the Federal spigot has been turned off, state governments are also feeling their own fiscal pressures and are shedding jobs. The Federal Reserve Board has signaled its intent to keep short‐term rates low until 2013 and also attempt to twist long rates lower to provide further stimulus. But many, myself included, doubt that the price of borrowing is a critical factor retarding investment. Europe remains mired in a sovereign debt crisis that holds the possibility of morphing into a banking crisis and possibly a currency crisis. Asia and many Latin American countries continue to show strong growth, but gold and other commodity prices have tumbled, suggesting that these few engines of growth are slowing down.
Overall, the world economy seems an inhospitable place for a long‐only endowment fund like ours.
MPSIF continues to benefit from our Management Advisory Council, a dedicated group of industry professionals who share their investment ideas and review our periodic reports. We were extremely pleased to host Michael Price, our Fund’s founding benefactor, at a Fund alumni gathering last April and hear him describe his investment approach and his views on the current economic environment. In May, for the 11th consecutive year, the Fund paid its annual 5% distribution bringing our cumulative distributions to over $995,000.
Despite many market uncertainties, I am happy to report that student interest in MPSIF remains high. We continue to field a talented group of students who are anxious to put their knowledge of finance into practice and learn about investment management in this unique setting.
Richard M. Levich Professor of Finance
October 10, 2011

The Michael Price Student Investment Fund
5
Letter From the President The fiscal year ending August 31, 2011 proved to be a period of great uncertainty for investment managers. While the market averages moved predominantly higher over the first half of the year, the lingering presence of macroeconomic issues reared their ugly heads as we approached the close. Washington’s disappointing approach towards reaching an agreement on the debt ceiling, Standard & Poor’s US credit downgrade, and increasing concern over Europe’s ability to deal with its excessive debts sent fear into the markets over the possibility of a double‐dip recession. As the confluence of negative events came to a head, the markets became overwhelmed. We witnessed a significant decline in equity prices along with extreme levels of volatility, evident as the Dow Industrials either rose or fell by at least 400 points four days in a row, a historical first. For both professional money managers and students alike, this environment has proven to be quite challenging. As we move forward, the current environment will provide an ideal training ground for our class to focus on identifying attractive long‐term investment opportunities while navigating the noisy waters of the markets. Despite the market’s volatile turn at the end of the fiscal year, our funds enjoyed positive returns. Overall the Fund gained 10.61% for the year, trailing our blended benchmark by 623bps net of fees (and 555bps gross of fees) due to underperformance across our equity strategies. While we are not happy with the underperformance among the equity funds, we take solace in our absolute performance of 12.94%, 12.71%, and 10.67% in our Growth, Small Cap, and Value funds, respectively. As we move forward, we will continue to focus on allocating capital effectively while adjusting for macroeconomic risks. The Fund has made it a priority to have students focus on the most critical elements to our investment recommendations. The Economic Outlook and Sector Strategy teams have narrowed the scope of their coverage, focusing on the most significant events and providing actionable recommendations
for our portfolio positioning. Specifically, in our funds, we are asking students to provide more concise pitches while providing the same level of detail in their fundamental research. In addition to helping students focus on the most critical drivers of future investment performance, fund managers will listen to a greater number of pitches, providing a larger spectrum of risk/reward opportunities in our security selection process. As highlighted in our semi‐annual report letter, the transfer of MPSIF assets to BNY Mellon is nearly complete. The new service will reduce our brokerage fees as well as result in administrative time savings. We look forward to the increased flexibility that the Fund will attain through the use of BNY Mellon’s platform. In closing, I thank Michael Price for his generosity and continued commitment to our Fund. The students in our class greatly appreciated the opportunity to listen to Mr. Price’s investing insights when he visited Stern during the spring semester. Since inception in 2000, MPSIF has not only allowed Stern students to gain practical training in investment management, but has also enabled nearly 100 students from the University of Oklahoma to attend summer courses at Stern. Finally, I wish to thank our Faculty Advisor, Professor Richard Levich, whose continued guidance makes MPSIF an unparalleled learning experience.
David Umbro MPSIF President October 14, 2011

The Michael Price Student Investment Fund
6
The Michael Price Student Investment Fund Review of Operations
The Michael Price Student Investment Fund is divided into four autonomous sub‐funds: the Fixed Income Fund, the Growth Fund, the Small Cap Fund and the Value Fund. The Fund managers employ a well‐defined, disciplined investment and diversification strategy.
We continued to work towards achieving the goals set by preceding Executive Committees while continuously striving to set new and better goals for the current year. Our progress and strategic objectives for the fiscal year were as follows:
Adjust our pitching structure to allow for more concise investment recommendations, requiring the same deep level of due diligence while increasing the number of actionable ideas presented in the funds
Provide more focused sector and economic analysis to help make timely actionable investment recommendations
Continue to invite successful investors as guest speakers to stimulate the learning process
Migrate our Merrill Lynch brokerage accounts to BNY‐Mellon
We started the semester with a “Pitching 101” session in which experienced second semester analysts presented stock pitches in front of the entire class. Three analysts, one from each equity fund, pitched a stock as a way to demonstrate (especially to students in their first semester in MPSIF) the various elements of a pitch and the types of questions that typically arise during a presentation. Jeremiah Driansky presented Teva Pharmaceutical Industries, a stock that he had originally pitched for the Growth Fund during the Spring of 2011. Sven Karlsson presented Sunoco, a new recommendation for the Value Fund. Finally, David Umbro pitched Midas Inc., a company that had appreciated considerably since the Small Cap Fund’s investment in March 2011 and continued to show tremendous earnings potential.
In addition, we had the privilege of hosting a number of speakers who are veterans of institutional investing. Having an opportunity to learn from experienced market professionals, and engage them with questions is an important feature of MPSIF.
On September 20, we were privileged to have Ted Tabasso, Managing Director at Deutsche Bank, as a guest speaker. Mr. Tabasso spoke to us regarding secular growth investment ideas in today’s highly volatile market.
On October 20, we welcomed David Dineen, Vice President and Senior Portfolio Manager of Pinnacle Associates, and Chris Long, Macro Portfolio Manager for Global Fixed Income at Tudor Investment Corporation. Mr. Dineen highlighted his risk adjusted target price methodology and Mr. Long gave his views on the macro environment that impacts all of our portfolios.
We are scheduled to have presentations from Randy Haase, Portfolio Manager of the Baron Fifth Avenue Growth Fund, Monica Issar, Chief Investment Advisor of the Endowments and Foundations at JP Morgan Chase, and Richard Saperstein, Principal at Treasury Partners later in the semester. We are excited to hear from these three seasoned investors as they discuss the current state of the markets and the optimal investment strategies to apply.
We scheduled economic and sector analysis presentations at the beginning of the semester so that the sub‐funds were better able to leverage the views to generate stock ideas. The scope of the presentations has been narrowed to allow for more in depth research and actionable investment recommendations. Given ongoing uncertainty and elevated risk across the globe, sector and economic analysis are now more important than ever before.
Assets Under Management & Cumulative Distributions
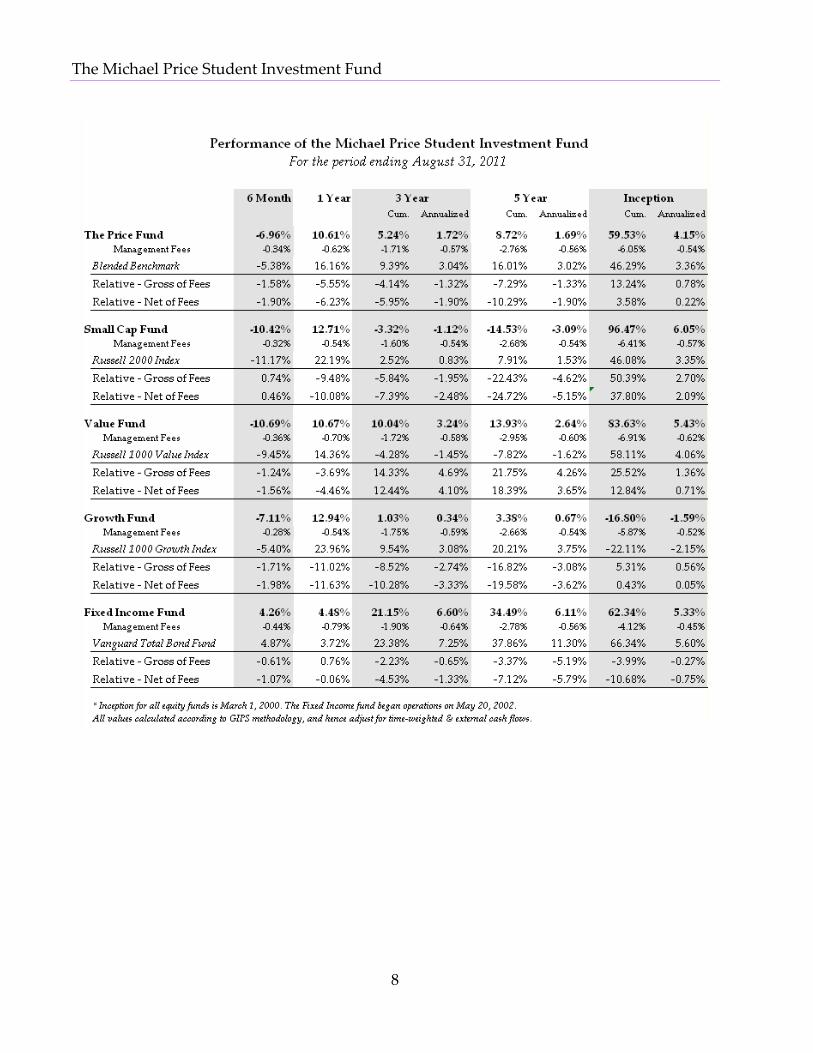
The Funds were initially endowed with $1.8 million as we began operations on March 1, 2000. As of August 31, 2011, our assets under management stand at $1.55 million, which represents a cumulative return of 59.53%% (gross), taking into

The Michael Price Student Investment Fund
7
account distributions of over $995,000 to the Michael Price School at the University of Oklahoma. On an annualized basis since inception, the MPSIF funds have returned 4.15% gross of fees and 3.36% net of
management and administrative fees allowing us to cover our annual 5% distribution requirement although leading to a reduction of our asset base.
The Michael Price Student Investment Fund
8

The Michael Price Student Investment Fund
9
As of August 31, 2011, MPSIF had approximately 28.9% in cash holdings, up from its 12.3% level at February 28, 2011. The percentage of cash holdings increased as the summer volatility caused many positions to hit their stop loss limits a risk management tool we employ over the summer recess. With the resumption of normal class sessions cash holdings are expected to decrease as new pitches are presented and approved. Generally, due to inactivity during the summer and winter breaks, the Fund accumulates excessive amounts of cash which cannot be readily reallocated to new investment ideas. The portfolio managers try to identify buying opportunities in broad‐based market and sector ETFs to employ the cash positions and own the market until new securities are pitched. This past summer, while some portfolio managers invested in ETFs, others decided to hold their cash positions, believing that the downturn was more widespread and not specific to a sector so holding cash was more prudent. We will continue to explore new opportunities to effectively invest the remaining cash in the summer and winter recess periods.

The Michael Price Student Investment Fund
10
The overall Fund returned ‐6.96% in the last six months of the fiscal year and 10.61% over the entire fiscal year. This compares to ‐5.38% and 16.16% for the benchmark over the same periods. With respect to the individual funds, performance was varied. The Small Cap Fund outperformed the benchmark on a six‐month basis by 0.74% gross of fees and 0.46% net of fees. For the fiscal year, the Small Cap Fund underperformed the benchmark by 9.48% gross of fees. The Value Fund underperformed the benchmark by 1.24% gross of fees over 6 months and 1.56% over the fiscal year. The Growth Fund
underperformed the benchmark by 1.53% gross of fees for 6 months and 3.69% over the fiscal year. The Fixed Income Fund underperformed the benchmark 0.61% gross of fees for six months but outperformed by 0.76% gross of fees for the fiscal year.
Since inception, MPSIF has earned a cumulative return of 59.53%, outpacing the blended benchmark by 13.24% or 0.78% on an annualized basis prior to fees. Net of fees, the fund has beat the benchmark by 3.58% since inception or 0.22% annualized.

The Michael Price Student Investment Fund
11
Benchmark Index Description
The purpose of benchmarking is to track the Funds’ performance relative to the index that most closely resembles the investment mandate of each portfolio. It is important to note that while the Funds are measured against the market, our more critical and overarching goal is to provide an absolute rate of return that exceeds our annual distribution mandate to the University of Oklahoma plus the rate of inflation in a given year. Therefore, although we consider the aforementioned indices our benchmark, we are keenly focused on risk management in the construction of each sub‐Fund.
Each of the four sub‐Funds, Fixed Income, Growth, Small Cap, and Value, are benchmarked to a leading index in order to measure relative performance. The benchmarks are as follows:
Fixed Income: Vanguard Total Bond Index Fund
Growth: Russell 1000 Growth Index Small Cap: Russell 2000 Index Value: Russell 1000 Value Index
Vanguard Total Bond Index Fund measures the performance of fixed income securities. The benchmark has the following characteristics:
Invests in U.S. Treasury, Investment‐grade corporate, mortgage‐backed, asset‐backed securities
Seeks to track the performance of the Barclays Capital Aggregate Bond Index
Broadly diversifies exposure to investment‐grade U.S. bond market
Passively manages using index sampling Intermediate‐duration portfolio and Provides moderate current income with
high credit quality
The Russell 1000® Growth Index measures the performance of those Russell 1000 companies with higher price‐to‐book ratios and higher forecasted growth values.
The Russell 2000® Index measures the performance of the 2,000 smallest companies in the Russell 3000 Index, representing approximately 10% of the total market capitalization of the Russell 3000 Index.
The Russell 1000® Value Index measures the performance of those Russell 1000 companies with lower price‐to‐book ratios and lower forecasted growth values.

The Michael Price Student Investment Fund
12
Asset Allocation The following charts show our total asset allocation by asset class and our composite equity sector allocation. The Executive Committee does not utilize any top‐down approach to set a target allocation. In May 2010, the Executive Committee voted to reduce our allocation to Fixed Income and Value, transferring those funds to Growth and Small Cap.
As indicated in the Asset Allocation chart, cash holdings increased from 12.3% in the prior reporting period to 28.9%. Equities decreased from 72.0% to 51.7% while Fixed Income increased from 15.7% to 19.4%. This mainly shows the effect of the summer volatility that caused many positions to hit their stop loss limits. The increase in allocation to fixed income is mainly due to losses in the equity funds.

The Michael Price Student Investment Fund
13
Fund Turnover
Portfolio Turnover for the Six Months Ending February 28, 2011
Fixed Income Fund
Growth Fund
Small Cap Fund
Value Fund
Total Purchases 0 570,870 118,696 510,144Total Sales 0 434,332 87,402 489,269Minimum (Sales, Purchases) 0 434,332 87,402 489,269
Average Invested Assets 275,835 393,088 329,938 408,042
Turnover 0% 110% 26% 120%
Portfolio Turnover for the Six Months Ending August 31, 2011
Fixed Income Fund
Growth Fund
Small Cap Fund
Value Fund
Total Purchases 31,093 229,988 442,954 413,828Total Sales 14,153 564,847 344,517 505,106Minimum (Sales, Purchases) 14,153 229,988 344,517 413,828
Average Invested Assets 293,865 340,933 469,110 404,379
Turnover 5% 67% 73% 102%
** Turnover is calculated as the minimum of (sales during the period, purchases during the period) divided by the average invested assets for the period on a monthly basis. Average invested assets does include beginning of period assets in the calculation. As we are considering invested assets, these values exclude cash holdings.
** Turnover is calculated as the minimum of (sales during the period, purchases during the period) divided by the average invested assets for the period on a monthly basis. Average invested assets does include beginning of period assets in the calculation. As we are considering invested assets, these values exclude cash holdings.
Macroeconomic and Market Review
After three years of economic pain, many economists thought 2011 would finally bring what everyone had been hoping for: more jobs and a self‐sustaining recovery. However, with US economic growth still at a crawl and unemployment at a somber 9.1%, the Fed has embarked on further monetary stimulus to keep the economy afloat. A soft housing market and the US fiscal outlook—the annual budget deficit increased to $1.3 trillion in 2011, the second highest on record—are the biggest factors weighing on the US economy and markets.
Operation Twist to the rescue. In the US, GDP grew at an annual rate of 1.3% in 2Q 2011, increasing from 0.4% in the previous quarter, and is forecast to
grow approximately 2% for the year. In pursuit of higher growth and lower unemployment, the Fed announced Operation Twist in September, reviving a policy from the 1960s.
The current version of the policy will involve selling $400 billion in short‐term Treasuries in exchange for the same amount of longer‐term bonds, starting in October and ending in June 2012, in a bid to push down long‐term borrowing costs on everything from mortgages to business loans—this should give consumers and companies an additional incentive to borrow and spend money. However, because the policy’s effectiveness in the 1960s was debatable, many economists contend that it is unlikely to give
The Michael Price Student Investment Fund
14
much of a boost to GDP growth in this reincarnation.
To further stimulate the economy, President Barack Obama also proposed a $447 billion American Jobs Act which includes $245 billion in short‐term payroll and investment spending tax cuts, $105 billion in infrastructure spending and $35 billion in aid to local governments to prevent layoffs of teachers, policemen and firefighters. Economists believe that the US economy would get a boost of up to 2% under the plan; however, it was blocked in the Senate on October 11 by a vote of 50‐49.
EU sovereign debt crisis continues to impede growth. Global GDP is forecast to grow 4% in 2011, with advanced economies increasing by 1.6% and emerging economies increasing 6.4%. According to consensus, a double‐dip developed market or global recession is not likely, but there are high near‐term risks around debt‐troubled Europe. For example, NYU Stern professor Nouriel Roubini maintains his Dr. Doom moniker by predicting a 60% chance of a developed market recession in the next 12 months.
Growth in the developed markets has been below average for three quarters and is expected to remain sluggish going into 2012. The biggest drag on the developed markets is the EU due to the ongoing sovereign debt crisis in Europe’s periphery nations, combined with the recent escalation in funding pressures.
It has been two years since Greece set the crisis in motion by announcing it had underestimated its budget deficit, while austerity has plunged Greece deeper into recession and provoked civil unrest that threatens political stability. Failure to curb the pain has led to Portugal and Ireland requiring bailouts, and markets are now targeting larger debt‐strapped nations such as Italy. Investors are concerned that if the crisis is allowed to fester, the world economy could face a repeat of the chaos that followed the 2008 collapse of Lehman Brothers.
A revamped strategy, announced in October but still yet to be made public, to combat the debt crisis currently includes writing down Greek bonds by as much as 50%, establishing a backstop for banks and
multiplying the strength of the $611 billion European Financial Stability Facility.
Emerging markets driving growth. China’s economy is estimated to have grown 9.3% in 3Q 2011 for its ninth straight quarter of expansion above 9%, indicating that the nation remains the main engine of global growth while the EU grapples with the sovereign debt crisis and the US recovery falters. While elevated inflation, currently at 6.1%, remains a concern, especially with five interest rate increases in the past year to tame inflation, China’s biggest risk over the next 12 months is a global downturn or recession.
More than two‐thirds of global growth will be derived from emerging economies over the next few years. Aside from China, 44 other Asian countries are pegged for more than 7% economic growth in 2011 and 2012.
Extreme stock volatility is the new norm. After a difficult and volatile summer for financial markets, the current investment environment could be best described as one of extremes. After being down 12.6% YTD through the first week of October, the S&P 500 Index is now down only 2.6% YTD (as of October 14) after the largest weekly gain since July 2009, amid optimism over corporate earnings and steps by European leaders to support the region’s banks. Stocks have languished from its April peak due to the tepid growth in the US and the persistent EU debt woes.
However, companies have done a lot better than their share prices. In 1H 2011, profits for the companies in the S&P 500 grew nearly 16% y/y. Profit will climb 17% in 3Q 2011 and rise 18% for all of 2011, according to analyst estimates. Corporate profit growth has been far stronger than economic growth because of globalization, technology and cost‐cutting. The S&P 500 is currently trading at an 11.1x forward P/E ratio, well below its decade average of 16.4x, creating compelling valuations and attractive buying opportunities at this time.
The MSCI Emerging Markets Index is down 18.8% YTD (as of October 14) following a 23% plunge in 3Q 2011 as markets have been pricing in the possibility that emerging market growth would be
The Michael Price Student Investment Fund
15
derailed by the bearish fundamentals of the developed world. Global turmoil and instability: This year has been characterized by social and political turmoil and instability throughout the world: the Arab uprising and revolts; the recent riots in England as well as the earlier protests there against pension cuts and higher tuition fees; the Israeli middle class protesting high housing prices and the squeeze from high inflation; Chilean students concerned about education and jobs; the vandalism of the expensive cars of “fat cats” in Germany; Greeks demonstrating against fiscal austerity; India’s movement against corruption; the deadly riots in China’s globally integrated eastern provinces in reaction to corruption, inequality and illegal land seizures; and now the “Occupy Wall Street” movement in New York and across the U.S. While these protests don’t have a single unified theme, they express the concerns of the working and middle classes about their economic future, challenges in accessing economic opportunity and the concentration of power among economic, financial and political elites. These protests have the potential to become more severe and cause disruptive social and political instability that eventually would harm long‐term economic growth and welfare if government action to address inequality in developed and emerging economies is not undertaken. Sector Initiative: The uncertainty created by the debate on the US debt ceiling and the European sovereign debt crises continues to fuel significant volatility in the equity market. Investors fled to the relative safety of defensive sectors, including Utilities and Consumer Staples. For the remainder of 2011 and moving into 2012, we see investor behavior being heavily influenced by the steps which will be taken to resolve the Greek debt crises and the spill‐over effect of sovereign debt concerns into other members of Euro zone. Also weighing upon investors concerns, key economic indicators provide a mixed outlook on the overall health of the US economy and are inconclusive in the potential of new recession versus resuming the path to recovery.
Stock recommendations: Within global equities, we favor the emerging markets and the US, where we expect most of the world’s incremental growth to occur, and away from Europe and Japan, where we expect greater long‐term challenges. Within US equities, we favor large‐cap stocks at the capitalization level and growth stocks at the style level, based largely on favorable relative valuation readings. We also favor multinational and US companies that rely on exports to emerging market regions to boost their bottom lines. Machinery, technology and food companies, in particular, realize a considerable share of their income in higher‐growth areas abroad. Our sector team recommends overweighting the Technology, Consumer Staples and Utilities sectors. We recommend underweighting Telecom Services, Materials, Consumer Discretionary and Financials. Our outlook on Healthcare and Industrials sectors is neutral. Consumer Staples: The sector has benefited from consumers trading down during recessionary periods as well as increasing sales in emerging market economies. In the volatile market environment, this sector is a defensive play. – Overweight Consumer Discretionary: The sector has outperformed the S&P500 for the year to date based on significant restructuring actions and expansion into emerging economies. Although consumers have shown a willingness to bear the burden of rising commodity prices, cost inflation will continue to be a significant factor for the sector. – Marketweight
Materials: The sector has underperformed the market year to date. Weakened economic outlook across the globe have caused commodity prices to come under pressure, we expect this sector to underperform. – Underweight

The Michael Price Student Investment Fund
16
Energy: The sector has also recently outperformed the market. Oil and gas futures point to generally higher prices over the next 12 to 24 months, although much of the demand in this sector is based in Asia, where growth rates are at risk of significant decline. The uncertainty in Europe also adds to the risk profile of the energy sector. – Underperform Utilities: The sector has outperformed the market year to date. The sector has benefitted from its defensive nature over the past year, and yields have declined as investors flocked to safety. We believe money will stay in this sector continued economic uncertainty have spooked investors from riskier assets and higher returns. – Overweight Health Care: The sector has slightly outperformed the market this year. However, the legislative uncertainty has continued to be an overhang on the sector. ‐ Marketweight Industrial: The sector has underperformed the market so far this year. As the prices of basic materials have been rising all year, many companies are facing eroding margins since they have a difficult time passing on their cost. The sector is trading at a slight discount to the market, and this trend is likely to continue until clear signs of economic recovery reappear. – Underweight Telecom Services: The sector has a very high dividend yield and therefore, has attracted a lot of investors over the last year. As a result, the sector is trading at higher multiples than S&P500, which is unusual. However, we believe that the sector is seeing intense competition and also lacks the growth
potential because of high penetration rate in U.S. – Underweight Technology: The sector has many positive fundamentals to support its outperformance to the broader market. Corporate PC refresh cycle, growing trend of mobile and cloud computing and strong balance sheet with large amount of cash for buybacks and dividends make the sector attractive. – Overweight Financials: The worst hit sector so far and still there are no signs of recovery. Loan demand in U.S. has been sluggish and will persist because of high unemployment and growing concern about economic slowdown will. Additionally, the tighter regulations on capital have also negatively impacted the sector. Lastly, lower long term yields have pushed the net interest margins down for the banks. – Underweight

The Michael Price Student Investment Fund
17
The Growth Fund Message from the Portfolio Managers
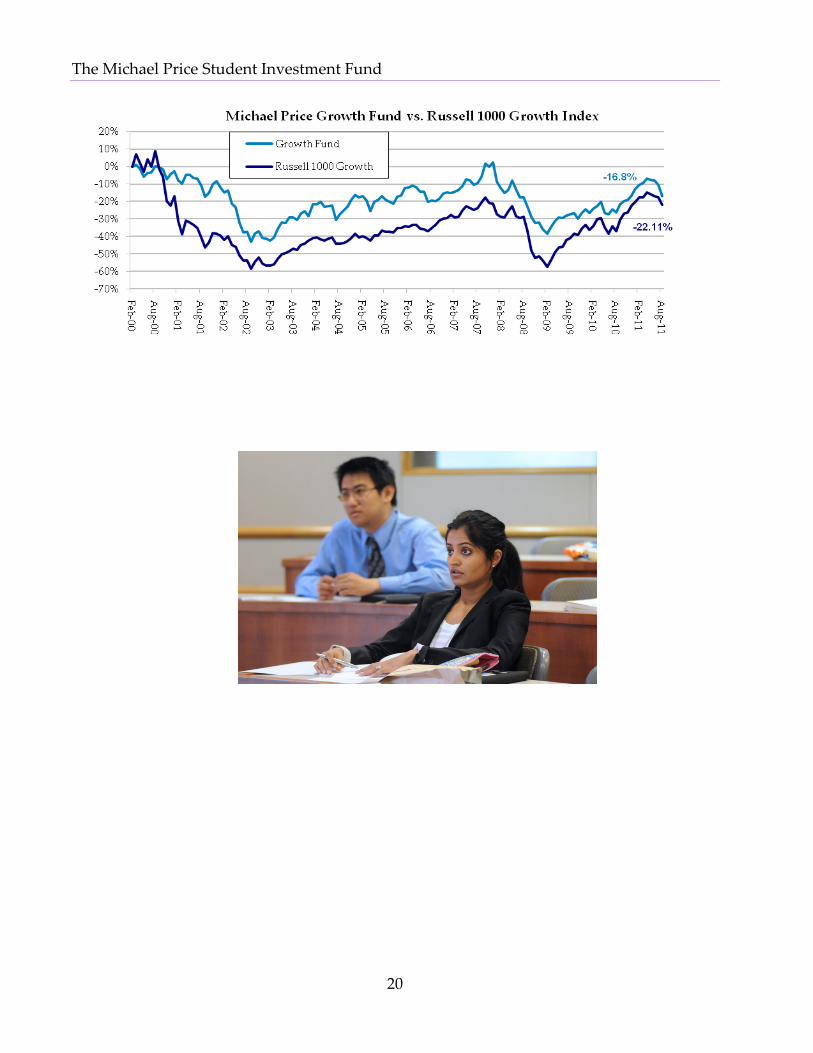
For the six months ending August 31, 2011, the Growth Fund (“the Fund”) had an absolute return of ‐7.11%. The benchmark, the Russell 1000 Growth Index, generated a return of ‐5.40% over the same time period. For the twelve months ending August 31, 2011, the Fund returned 12.94% while the benchmark generated a return of 23.96%. While we are disappointed to have underperformed our benchmark by 171 bps over the 6‐month period ending August 31, 2011, we recognize that the under‐performance occurred solely during July and August, when our analysts are engaged in summer internships and unable to actively trade their positions. For the four months March—June 2011, the Fund actually outperformed the benchmark. Underperformance in July and August by 187 bps and 157 bps, respectively, was due to volatility in the broader markets and stop‐losses that were triggered near the market lows in August. The period March—August 2011 proved to be a difficult time for growth stocks. While the Russell 1000 Growth Index saw gains of 0.12% and 3.35% in March and April, respectively, approximately 1% losses from May through July and a 5.3% loss in August were challenging. Entering summer 2011, analysts were asked to revisit stop‐loss prices and target prices. The decision to apply tighter stop‐losses was also influenced by the general macro overhang and market uncertainty. Over the summer, we saw a resurgence of the Eurozone debt crisis, signals for a slowing global economy, and political brinksmanship in Washington, D.C., as a default on U.S. debt and debt‐ceiling issues were brought to the forefront. On August 5, Standard & Poor’s announced a formal downgrade of U.S. Treasuries from their AAA status to AA+, calling into question the concept of a risk‐free rate and the foundations on which valuation is predicated To put market volatility in August in context, from August 5—11, average daily swings in the indices
exceeded 4%. From August 5—30, average daily movements in the S&P500 were 2.5%. With this level of volatility, it was no surprise that we stopped‐out of ten positions, especially with our 40% portfolio weighting in the high‐beta tech sector. With such market uncertainty and such negative market sentiment, we decided it best to hold proceeds from stopped‐out positions in cash. We re‐entered the academic year in September with just three equity holdings: Amazon, Apple, and Teva. As of September 1, equities represented 17.3% of the portfolio vs. 82.7% in cash. In comparison our holdings on June 1 were 94% equities vs. 6% cash. As the fund moves forward, we are cautiously redeploying cash into the equity markets. Analysts are re‐assessing positions that were stopped out during a volatile August, and are being asked to revisit each investment thesis. As of October 20, 2011, we had re‐entered six of the ten positions that stopped out, namely BE Aerospace, Cliffs Natural Resources, EMC Corp, Eastman Chemical, Hologic Inc., and JB Hunt. The fund expects to enter new positions as well, though it has become increasingly difficult to identify growth stocks in the current market environment. The remaining funds that have not yet been deployed remain in cash. While we recognize that the cash position does not earn any meaningful return, we also believe it serves as a form of capital preservation during what we believe will be a bearish market.
Pamela Kaufman and Sarosh Nentin
Portfolio Managers, Growth Fund

The Michael Price Student Investment Fund
18
Discussion of Performance
Performance Overview
During the second half of fiscal year 2011, the Fund underperformed its benchmark, the Russell 1000 Growth Index, by 1.71% gross of management fees. The Growth fund earned a negative return of 7.11% while the Index returned a negative 5.40%. Over the entire fiscal year, the Growth Fund earned a respectable 12.94%, but unfortunately underperformed by roughly 11%. The Fund’s underperformance relative to its benchmark was partially the result of a large cash position after the turmoil over the summer 2010, which led to the Fund missing out on market appreciation in the fall.
On a longer‐term view, the last decade has not been very favorable for growth stocks. If we had invested $1,000 in Russell 1000 Growth in March 2000 at our Fund’s inception, our net holding would have been only $779 by August 2011. By comparison, a $1,000 investment in the Growth Fund would be valued at $783, slightly higher than the benchmark.
The Michael Price Student Investment Fund
19
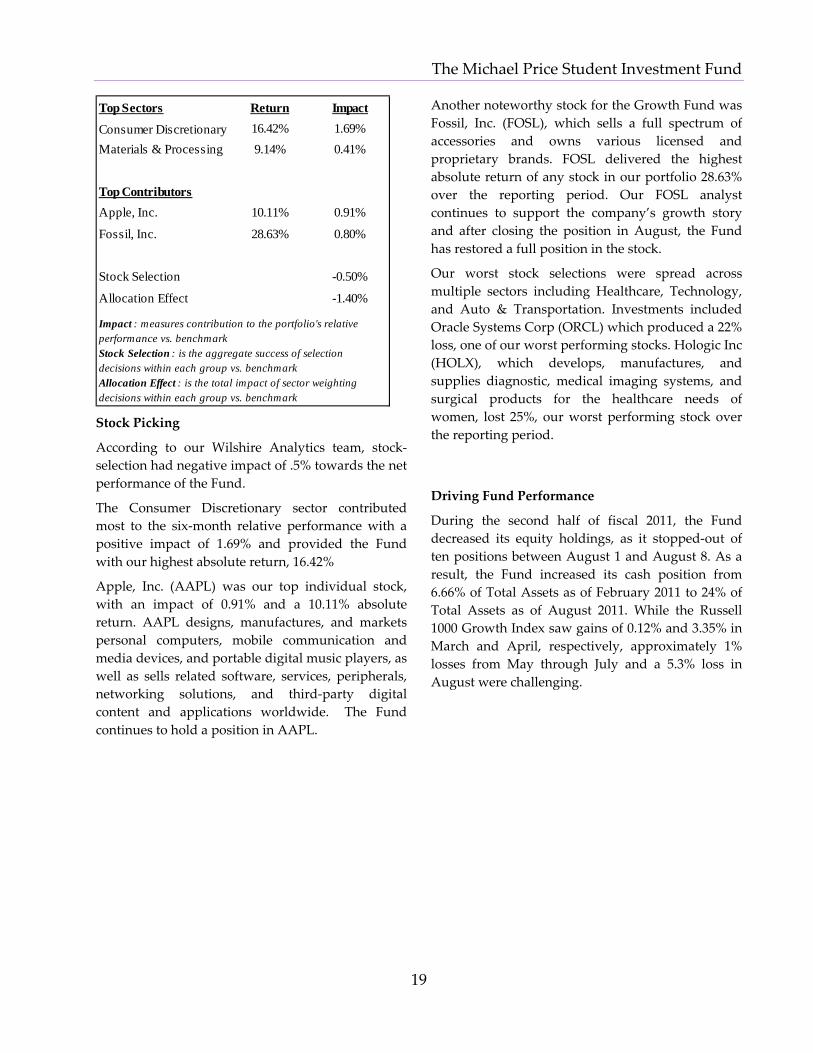
Top Sectors Return Impact
Consumer Discretionary 16.42% 1.69%Materials & Processing 9.14% 0.41%
Top ContributorsApple, Inc. 10.11% 0.91%
Fossil, Inc. 28.63% 0.80%
Stock Selection -0.50%
Allocation Effect -1.40%
Impact : measures contribution to the portfolio's relative performance vs. benchmarkStock Selection : is the aggregate success of selection decisions within each group vs. benchmarkAllocation Effect : is the total impact of sector weighting decisions within each group vs. benchmark Stock Picking
According to our Wilshire Analytics team, stock‐selection had negative impact of .5% towards the net performance of the Fund.
The Consumer Discretionary sector contributed most to the six‐month relative performance with a positive impact of 1.69% and provided the Fund with our highest absolute return, 16.42%
Apple, Inc. (AAPL) was our top individual stock, with an impact of 0.91% and a 10.11% absolute return. AAPL designs, manufactures, and markets personal computers, mobile communication and media devices, and portable digital music players, as well as sells related software, services, peripherals, networking solutions, and third‐party digital content and applications worldwide. The Fund continues to hold a position in AAPL.
Another noteworthy stock for the Growth Fund was Fossil, Inc. (FOSL), which sells a full spectrum of accessories and owns various licensed and proprietary brands. FOSL delivered the highest absolute return of any stock in our portfolio 28.63% over the reporting period. Our FOSL analyst continues to support the company’s growth story and after closing the position in August, the Fund has restored a full position in the stock.
Our worst stock selections were spread across multiple sectors including Healthcare, Technology, and Auto & Transportation. Investments included Oracle Systems Corp (ORCL) which produced a 22% loss, one of our worst performing stocks. Hologic Inc (HOLX), which develops, manufactures, and supplies diagnostic, medical imaging systems, and surgical products for the healthcare needs of women, lost 25%, our worst performing stock over the reporting period.
Driving Fund Performance
During the second half of fiscal 2011, the Fund decreased its equity holdings, as it stopped‐out of ten positions between August 1 and August 8. As a result, the Fund increased its cash position from 6.66% of Total Assets as of February 2011 to 24% of Total Assets as of August 2011. While the Russell 1000 Growth Index saw gains of 0.12% and 3.35% in March and April, respectively, approximately 1% losses from May through July and a 5.3% loss in August were challenging.
The Michael Price Student Investment Fund
20
The Michael Price Student Investment Fund
21
Asset Allocation
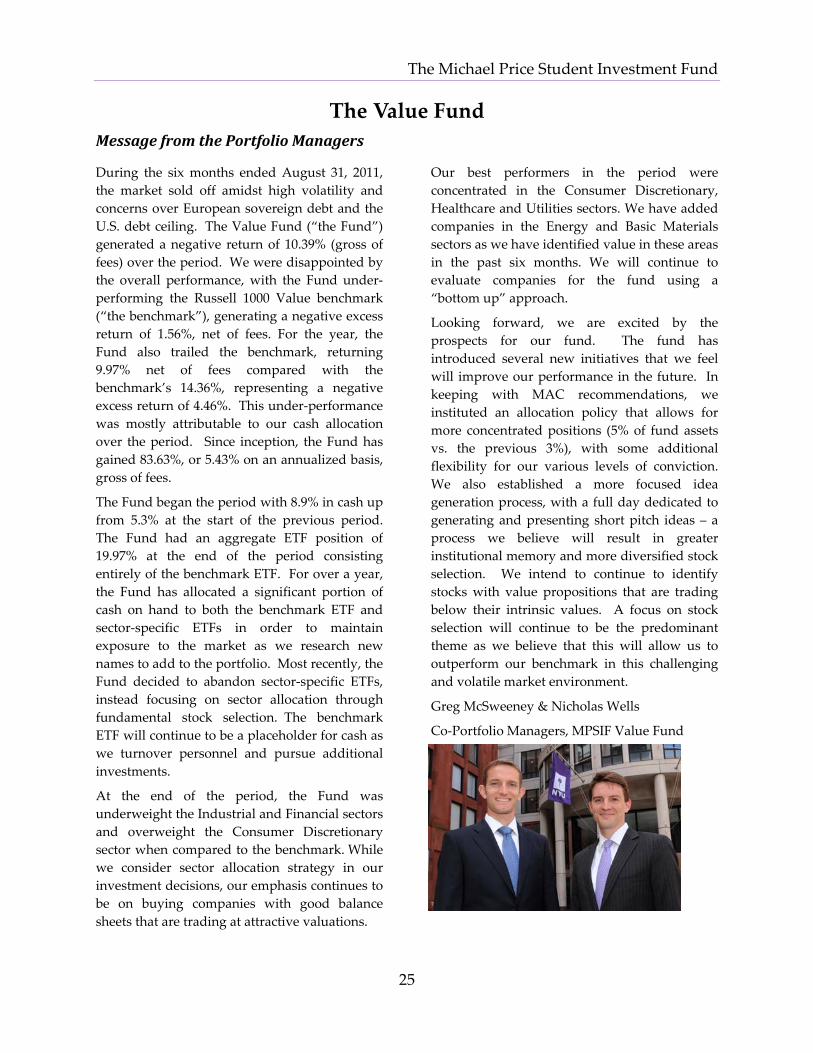
As the Fund focuses on bottom up stock‐picking and fundamental analysis, asset allocation is a secondary priority. Despite this, asset allocation had a negative impact in the second half of fiscal year 2011. According to our Wilshire Analytics team, asset allocation decisions hurt portfolio performance by negative 1.4%. The Fund’s commitment to bottom‐up stock selection is primarily pedagogical in nature. The Fund is a seminar style course in which students can use and combine skills garnered in their other classes in a professionally practicable manner. We believe the benefits derived from such a course are immeasurable. That said, it should be clearly understood that as the central principle of modern portfolio theory, asset allocation, should not be ignored by the Fund. On an informal basis, the Fund routinely reviews the industry allocation of its holdings and encourages analysts to explore underweight industries. As of August 28, 2011, the sectors with the most significant weight in the Growth Fund are:
• Information Technology held a 28.2% asset allocation, the largest sector in the Fund, and slightly overweight compared to the Russell 1000 Growth, which has a 26.0% weight in IT. • Consumer Discretionary captured a 15.2% share in the Fund, and slightly underweight compared to the Russell 1000 Growth, which has 16.8% weight in Consumer Discretionary. • Product Durables accounted for a 13.6% allocation in the Fund, almost slightly overweight the 9.7% allocation for Product Durables in the Russell 1000 Growth. Over the past six months we have continued to focus on a blended approach of identifying promising sectors which could prove to be resilient amid the aftermath of the recession and implemented a bottom‐up process for selecting best of breed in these areas. A bottom‐up strategy alone could be insufficient in the current market. As of August 28, 2011, the fund held positions in five ETFs: Energy SPDR (XLE), iShares DJ Industrials SPDR (IYJ), Materials Select SPDR (XLB), Technology Select SPDR (XLK), and iShares Russell 1000 Growth (IWF).

The Michael Price Student Investment Fund
22
Holdings Profile Growth Portfolio as of August 31, 2011
Company Name Ticker SectorShares
HeldClosing
PricePosition
Value % of AssetsApple, Inc. AAPL Information Technology 84 384.83 $32,326 7.63%Amazon AMZN Information Technology 108 215.23 $23,245 5.49%Teva Pharmaceutical Industries Ltd (ADR) TEVA Health Care 435 41.36 $17,992 4.25%
Direct Equity Holdings $73,562 17.37%Total Equity Holdings $73,562 17.37%Cash as of August 31, 2011 $349,859 82.63%Total Assets $423,421 100.00%
Growth Portfolio as of February 28, 2011
Company Name Ticker SectorShares
HeldClosing
PricePosition
Value % of AssetsApple, Inc. AAPL Information Technology 84 353.21 $29,670 6.30%Baidu Com Inc. BIDU Information Technology 94 121.16 $11,389 2.42%EMC Corp. EMC Information Technology 1096 27.21 $29,822 6.33%Eastman Chem Co. EMN Materials 254 93.41 $23,726 5.04%First Solar Inc. FSLR Energy 131 147.39 $19,308 4.10%Fortinet Inc. FTNT Information Technology 667 40.84 $27,240 5.78%Fossil Inc. FOSL Consumer Discretionary 290 76.74 $22,255 4.72%Itron Inc. ITRI Energy 340 56.71 $19,281 4.09%Kansas City Southern KSU Industrials 435 53.84 $23,420 4.97%Mindray Medical International MR Health Care 670 27.08 $18,144 3.85%Qualcomm Inc. QCOM Information Technology 266 59.58 $15,848 3.36%Royal Caribbean Cruise RCL Consumer Discretionary 470 43.79 $20,581 4.37%Syngenta AG SYT Materials 350 67.32 $23,562 5.00%Energy Select Sector SPDR XLE Energy 750 78.54 $58,905 12.50%iShares DJ Industrial SPDR IYJ Industrials 520 69.93 $36,364 7.72%Materials Select Sector SPDR XLB Materials 535 39.46 $21,111 4.48%
Technology Select Sector SPDR XLK Information Technology 750 26.56 $19,920 4.23%iShares Russell 1000 Index IWF Index ETF 325 60.66 $19,715 4.19%
Direct Equity Holdings $284,247 60.34%Total Equity Holdings $440,261 93.46%Cash as of February 28, 2011 $30,813 6.54%Total Assets $471,074 100.00%

The Michael Price Student Investment Fund
23
Investment Style and Strategy
Our goals: The goal of the Growth Fund is to identify and capitalize on investments that have significant growth potential. The companies we invest in may derive their growth from a unique business model or a strong competitive position in a rapidly growing industry. We believe that companies with these characteristics can achieve more than 15% annual EPS growth over the next five years and in turn experience substantial stock price appreciation. These growth opportunities can be uncovered by identifying companies that are pioneering a new product or service that will see significant future demand. Other companies may be altering pre‐established norms in a static industry and gaining significant market share. Additionally, these companies could be applying their business model to new regions or they could simply be a leader in an industry that is experiencing high levels of growth. Our analysts use comparable and intrinsic valuation techniques to determine if these growth opportunities are available at attractive prices.
Our objective: Our goal is to outperform the benchmark on a total return basis by investing in securities that provide superior returns on a risk/return basis through capital appreciation and dividends.
Investment Process: Our analysts look at a firm and ask: ʺWhat is the catalyst for growth?ʺ Then the analyst considers whether the company’s business model will succeed. A valuation analysis follows, which begins with balance sheet analysis as well as revenue and earnings trends. The analyst completes a fundamental analysis of the company and examines relative
valuations. The analyst then writes a research report and pitches the stock to the class. The class engages in a discussion to challenge the investment rationale. After this rigorous process, the group votes whether or not to add the security to the portfolio.
Sell Discipline: In 2006, the Fund added stop‐loss orders to provide more sell discipline. The stop‐loss price is determined by the analyst and is related to the stock’s volatility and downside risk. The Fund’s consensus model also helps determine stop‐loss orders. Additionally, the stop‐loss policy is regularly evaluated to ensure that these risk controls stay relevant. This includes actively reducing our exposure to a specific stock when our investment thesis no longer sees room for upside. Some of the factors that would change our investment thesis are:
The company growth rate deteriorates or its performance otherwise disappoints.
The price of the security attains our price target or otherwise appears relatively high to the analyst.
The company publishes negative earnings announcements that could affect the long‐term outlook and industry attractiveness.
Unfavorable changes in management.
Why Growth Stocks? Growth companies have above average earnings growth, which we believe will translate into above average price appreciation. Thus, we believe investing in growing companies that are not currently overpriced should lead to realization of potentially superior investment returns over the long term.

The Michael Price Student Investment Fund
24
The Michael Price Student Investment Fund
25
The Value Fund Message from the Portfolio Managers
During the six months ended August 31, 2011, the market sold off amidst high volatility and concerns over European sovereign debt and the U.S. debt ceiling. The Value Fund (“the Fund”) generated a negative return of 10.39% (gross of fees) over the period. We were disappointed by the overall performance, with the Fund under‐performing the Russell 1000 Value benchmark (“the benchmark”), generating a negative excess return of 1.56%, net of fees. For the year, the Fund also trailed the benchmark, returning 9.97% net of fees compared with the benchmark’s 14.36%, representing a negative excess return of 4.46%. This under‐performance was mostly attributable to our cash allocation over the period. Since inception, the Fund has gained 83.63%, or 5.43% on an annualized basis, gross of fees.
The Fund began the period with 8.9% in cash up from 5.3% at the start of the previous period. The Fund had an aggregate ETF position of 19.97% at the end of the period consisting entirely of the benchmark ETF. For over a year, the Fund has allocated a significant portion of cash on hand to both the benchmark ETF and sector‐specific ETFs in order to maintain exposure to the market as we research new names to add to the portfolio. Most recently, the Fund decided to abandon sector‐specific ETFs, instead focusing on sector allocation through fundamental stock selection. The benchmark ETF will continue to be a placeholder for cash as we turnover personnel and pursue additional investments.
At the end of the period, the Fund was underweight the Industrial and Financial sectors and overweight the Consumer Discretionary sector when compared to the benchmark. While we consider sector allocation strategy in our investment decisions, our emphasis continues to be on buying companies with good balance sheets that are trading at attractive valuations.
Our best performers in the period were concentrated in the Consumer Discretionary, Healthcare and Utilities sectors. We have added companies in the Energy and Basic Materials sectors as we have identified value in these areas in the past six months. We will continue to evaluate companies for the fund using a “bottom up” approach.
Looking forward, we are excited by the prospects for our fund. The fund has introduced several new initiatives that we feel will improve our performance in the future. In keeping with MAC recommendations, we instituted an allocation policy that allows for more concentrated positions (5% of fund assets vs. the previous 3%), with some additional flexibility for our various levels of conviction. We also established a more focused idea generation process, with a full day dedicated to generating and presenting short pitch ideas – a process we believe will result in greater institutional memory and more diversified stock selection. We intend to continue to identify stocks with value propositions that are trading below their intrinsic values. A focus on stock selection will continue to be the predominant theme as we believe that this will allow us to outperform our benchmark in this challenging and volatile market environment.
Greg McSweeney & Nicholas Wells
Co‐Portfolio Managers, MPSIF Value Fund
The Michael Price Student Investment Fund
26
Discussion of Performance
Over the past year, volatility continued to be an important factor in the market. Our six‐month return as of August 31, 2011 was ‐10.69%, underperforming the Russell 1000 Value Index benchmark by 1.56%, net of fees. During this period, the fund stopped out of 9 positions resulting in significant losses. Thanks, however, to a strong first half, the fund earned 10.67% over the full fiscal year. These returns far exceed our required 5% distribution, but fell short of our benchmark by 3.69% before fees.
In this volatile setting, the fund was able to capture gains in some of our sectors and individual positions. Our best performing sector, in relative and absolute terms, was Auto & Transportation, producing a return of 29.5% and leading the benchmark by 38.7%. This was mainly due to a very positive performance by Copa Holdings, which gained 36% over the last six months of the fiscal year.
Consumer staples also came in with a positive return of 9.6%, led by our successful investments in Wal‐Mart (WMT) and CVS Caremark Corp (CVS). Utilities was our third best performing sector, posting a return of 7% and outperforming the Utilities positions in the Russell 1000 Value by about 2%. Our holdings in Alpha Natural Resources helped achieve success for this sector with an individual return of 13%.
$600�
$800�
$1,000�
$1,200�
$1,400�
$1,600�
$1,800�
$2,000�
Aug 01�Aug 02�Aug 03�Aug 04�Aug 05�Aug 06�A ug 07�Aug 08�Aug 09�Aug 10�Aug 11�
$1,000 Invested with MPSIF Value�
Value Fund�
Russell 1000 Value�
The worst performing, sector in our portfolio, on an absolute basis, was Financial Services. This would not come as a surprise, given the overall pattern of the market over the summer. In this sector alone, we stopped out of 3 positions within the period: Ares Capital Corporation (ARCC), JP Morgan (JPM), and PartnerRe Ltd. (PRE). These three companies posted 6‐month returns of ‐11.2%, ‐16.7%, and ‐26.2%, respectively. Still, our overall performance was only 2.27% below that of the benchmark.

The Michael Price Student Investment Fund
27
In a relative sense, our worst performing sector was Health Care, with a positive of return of 3.5% return compared to 6.1% posted by the Russell 1000 Value Health Care sector.
Despite this rough six‐month period, our overall performance of the fund remains positive. Our twelve‐month performance stands at 10.67%,
falling a bit below that of our benchmark by 3.69%. In addition, we are proud to see that over the past three years our Fund has outperformed the benchmark by over four percentage points annually. This shows that we have been successful in protecting our investors’ interests during difficult market times.

The Michael Price Student Investment Fund
28
Asset Allocation
Value Fund analysts take a bottom‐up approach to stock selection. While we discuss sector weightings relative to the Russell 1000 Value benchmark, we do not make active sector bets. Instead, we look at all stocks within the range of our investment policy.
As a disclaimer, Wilshire has added and changed sector definitions to increase detail. As a result, comparisons with respect to sector allocations as of August 31 and February 28, 2011 are now difficult. Despite this, general conclusions can still be made.
Over the past six months, we significantly increased our positions in the Consumer Discretionary sector, partially attributed to our purchasing of Best Buy (BBY) shares.
Our positions in Consumer Staples have dropped from 18% of our equity portfolio to 3%, as we sold off shares Pepsico and Philip Morris, while only making additional investments in CVS Caremark. We have also trimmed our positions in Energy, as we dumped our stake in Alpha Natural Resources.
The Financial sector represented 20% of our equity portfolio in February, and has decreased to 15%. This is mainly due to our decision to sell our positions in Metlife Inc. and Partnerre Ltd.
Healthcare is the last sector in which we experienced significant change in asset allocation. Our holdings in that sector grew with the addition of Johnson and Johnson and Sanofi Aventis.
We have also made a shift from investing in individual sector indexes (Consumer Staples, Energy, Financials, Healthcare, Industrials, Materials, and Telecommunications) to a single, Russell 1000 Value Fund index. This move made broad and modest changes in terms of asset allocation.
Also, six months prior to August 31, we experienced a large amount of positions stopping out due to general poor performance in the market. As a result, we were put in a position of excess cash, for which as of August 31, made up 19% of total assets, compared to 0.45% in February 28. We decided to keep a larger portion of assets in cash until volatility in the market subsided.

The Michael Price Student Investment Fund
29
Holdings Profile

The Michael Price Student Investment Fund
30
Investment Style and Strategy
Fund Objective: Outperform the benchmark on a total return basis by investing in securities that provide superior returns on a risk/return basis through capital appreciation and dividends.
Benchmark: Russell 1000 Value Index
Fund Strategy: The Value Fund utilizes a bottom‐up fundamental approach. Our analysts go through a rigorous screening process to select deep value positions. The team pursues this strategy by investing primarily in large capitalization companies with consistent year‐over‐year earnings that are trading at a discount relative to their peer group. We estimate the value of our securities primarily through an intrinsic value methodology. Additionally, we examine each security’s valuation relative to its peer group. For the purposes of this analysis, we utilize many of the following metrics: price‐to‐earnings, price‐to‐book, dividend yield, and various free‐cash‐flow ratios. There is, however, no specific country or region quota. Analysts discuss the Fund’s overall sector allocation compared to our benchmark to monitor our exposure, though we do not intentionally make sector bets. The Fund seeks
absolute returns in order to fulfill our distribution requirements and monitors our performance against the Russell 1000 Value index.
Why Value Stocks? Value stocks are stocks that tend to be out of favor. A value stock is one that is underpriced by the market for reasons that may have nothing to do with the business itself. They are undervalued relative to their comparables on various metrics used to value comparable companies. Stocks that are undervalued on metrics compared to the index may not be Value stocks because sectors trade differently. Historical trading multiples are often a good indicator of whether a sector has a favorable perception.
Cash: The goal of the Fund is to be invested in the best value opportunities in the marketplace. To the extent we have non‐invested cash, we will search for opportunities to employ that capital that fits our strategy. We do not have a maximum cash balance and only utilize ETFs to reduce our cash exposure on a short‐term basis. These ETFs are focused in sectors that we are underweight and are sold off when investment ideas are added to the portfolio.
The Michael Price Student Investment Fund
31
The Small Cap Fund Message from the Portfolio Managers
In one key sense, fiscal year 2011 was a success for the Michael Price Small Cap Fund (the “Fund”) ‐‐ at 10.42%, returns exceeded the annual 5% disbursement requirement comfortably. To the extent that we operate as an endowment fund, we were able to add to principle and build for future success. However, in many other ways, 2011 was a disappointment. Our returns badly lagged the benchmark Russell 2000 Index (+22.19%) by ‐9.48% gross of fees. Under‐performance of this magnitude, particularly during a year that was broadly very good for equities, should cause any fund manager to question their investment strategy. We therefore spent much of the late Spring and Summer taking a deep look at the Fund’s structure and procedures and ultimately identified a number of key issues that contributed to under‐performance. Rather than dwelling on the contributions of individual holdings to overall returns (available on the following pages), we will use the rest of this letter to discuss some of the core flaws we identified and the changes made to the Fund’s approach going forward to try and rectify these issues. The large cash position held by the Fund during FY2011 was far and away the key reason performance lagged the benchmark. As of August 31, 2010, cash as a percentage of assets under management (“AUM”) was roughly 20%; this rose to over 30% by early 2011 . On a fully invested basis, the equity portion of the portfolio actually outperformed the benchmark by approximately 50bps, so the over‐allocation to cash was clearly a huge problem during the year. This does however indicate that on a risk‐adjusted basis we performed quite strongly. We identified this issue in early Spring 2011, and immediately reduced cash holdings to 15% of AUM by investing the excess in the benchmark index. Heading into the summer, the Fund decided to target a maximum 5% cash position and to aggressively re‐invest excess cash into the index going forward. This change alone had a
dramatically positive impact on performance in just the last three months of the year. As of May 2011, the end of our academic year, the Fund lagged the benchmark by nearly 20%; by the close of the fiscal year in August, under‐performance had been reduced to just 14%. Going forward, we plan to continue this policy and will hold assets not invested in individual securities in the benchmark rather than cash. However, It is incredibly challenging to generate alpha when holding a large position in the benchmark yet still paying transaction fees ‐‐ ideally assets would be invested in individual names rather than the broader benchmark. Thus we have focused on identifying the underlying reasons that historically led to large cash positions in lieu of specific equities. 1) Historically, we have to some extent treated cash as the result of a lack of attractive ideas or merely frictional delays during the semester resulting from fund structure. Though we strive to invest on a fundamental analysis basis, it is important to acknowledge that the allocation of assets to cash over equities is functionally a macro call. Therefore, we plan to continue the aforementioned new policy of aggressive reinvestment to address this issue. Long‐term cash holdings greater than 5% of AUM will need to be debated as any other investment decision and will now require a vote within the fund. 2) Due to the fact that the Fund officially meets only twice weekly and not at all during the summer, we have historically struggled to exit positions at optimal times, particularly in the case of holdings that exceed price targets. While stop‐losses allow us to get out of declining assets, selling high and buying into assets that have fallen to attractive levels is equally if not more important than cutting losses. This is all the more true during periods of extreme volatility such as what we experienced over the Summer. Rapidly investing cash raised from positions we stop out of will help resolve this issue
The Michael Price Student Investment Fund
32
to an extent, but we believed more changes were needed to address this challenge. Fund analysts are now required to provide an update when any holding they cover is within 2.5% of the price target. Additionally we have worked hard to pay close attention to holdings that experience large short‐term moves and conduct fund discussions and votes via email or conference call when these moves occur on non‐meeting days. This approach was critical to fund out‐performance during the highly volatile period in July/August. In the past we likely would have been whipsawed out of positions and failed to re‐invest capital; thus missing the rebound in markets. 3) The Fund has historically set all initial position sizes at $20,000. As of Spring 2011, this equated to roughly 4% of AUM. We believe that the Fund should be willing to make larger bets on securities in which we have the highest conviction and smaller bets on those with greater uncertainty. We now target an average initial position of 5% of AUM, with an upper bound of roughly 8% and a lower bound of 2%. We have also been willing to re‐up positions that have declined absent fundamental changes and trim holdings that have run up substantially, both of which we rarely did in the past. 4) We believe we may occasionally suffer from group‐think when voting on buying or selling decisions. While we still see great value in open discussion before a final decision, we now hold a secret ballot vote following all proposals and prior to discussion within the fund which is then followed by an open vote to make a final decision. Thus far, this appears to give individuals some added confidence to voice concerns about a proposal that the majority of the group may support. While this may not fully resolve this issue, it will hopefully contribute to the decision making process. 5) Many of our largest losses in recent history have come in international securities listed in the US. For a variety of reasons (lack of transparency in international reporting standards, lack of expertise in international markets, etc) we plan to focus on domestic companies with large international
operations to achieve exposure to markets outside of the United States. 6) Lastly, we have frequently struggled to find a sufficient number of attractive investments, thus leading to large positions in cash and the index and a relatively small number of individual holdings (we currently hold seven individual securities). While this is in many ways a consequence of the core structure of the fund (twice weekly meetings, 50% turnover of staff every six months, long periods of inactivity in the summer and winter, etc), that does excuse us from striving to overcome this issue. To that end we have made two key changes to the Fund. The first is designed to improve idea generation, which the fund has struggled with in our experience. At the outset of each semester, we hold a “3‐minute drill” where each analyst has three minutes to present three separate investment ideas. These pitches are intended to be rough outlines of the investment thesis and at the end of the exercise, each member of the Fund rates each pitch on a 1‐10 scale. This data is aggregated to produce the “best” ideas to help target the research of the Fund’s analyst team. In particular, we believe this will help jump‐start new and inexperienced members who might otherwise struggle to find ideas or waste time researching securities that more experienced members of the Fund could easily identify as dead ends. Second, to encourage more pitches and more diverse holdings, we will require only a single research report during the semester and have encouraged members to scale back the length of their pitches. The requirement of a full sell‐side style written report for every pitch is rare among asset managers and we believe this has discouraged analysts from presenting good ideas. In general, analysts should know the company they pitch well enough to convince the rest of the fund that it is a worthwhile investment. The rest of the fund is expected to bring a healthy skepticism to every proposal and to force the presenting analyst make a sufficent case for each idea. Not every company requires a 30‐40 minute presentation. By targeting 15 minutes plus Q&A for initial presentations, along with a follow up pitch if the Fund believes major questions/concerns were

The Michael Price Student Investment Fund
33
left unanswered, we believe we will see more pitches and more diverse idea generation that should translate to a broader base of individually equity holdings. As noted above, many of these changes appear to already be paying dividends. The Fund outperformed the benchmark for Q4 FY2011 and returns have continued to exceed those of the benchmark through the first month of FY2012. Long term, we are targeting approximately 15‐20 positions at an average size of 5% of AUM with the balance of assets in the index and a small cash position. We do not believe this target will necessarily be achieved during the current semester, but a commitment to this goal and the changes outlined above should contribute to alpha generation over the life of the Fund. Chris Hemmelgarn & Sven Karlsson Co‐Portfolio Managers, MPSIF Small Cap Fund

The Michael Price Student Investment Fund
34
Discussion of Performance For the period ending August 31, 2011:
6 Month 1 Year 3 Year 5 Year Inception Cum. Annualized Cum. Annualized Cum. Annualized
Small Cap Fund -10.42% 12.71% -3.32% -1.12% -14.53% -3.09% 96.47% 6.05% Management Fees -0.32% -0.54% -1.60% -0.54% -2.68% -0.54% -6.41% -0.57%
Russell 2000 Index -11.17% 22.19% 2.52% 0.83% 7.91% 1.53% 46.08% 3.35% Relative - Gross of Fees 0.74% -9.48% -5.84% -1.95% -22.43% -4.62% 50.39% 2.70% Relative - Net of Fees 0.46% -10.08% -7.39% -2.48% -24.72% -5.15% 37.80% 2.09% * Inception from March 1, 2000
Performance Overview
During the second half of fiscal year 2011, the Fund outperformed its benchmark, the Russell 2000 Index, by 0.74% gross of management fees. The Fund posted a negative return of -10.42% while the Index returned -11.17%. The Fund’s similar performance relative to its benchmark was partially the result the decision to reinvest all funds from positions stopped out over the summer into the benchmark index. Due to the unprecedented market volatility during the summer, much of the fund was invested in the index by the end of the fiscal year.
Stock Picking
The Financial Services (FS) sector contributed significantly to the six-month relative performance due to its 31% weight in the fund with an impact of -2.95%.
The top FS sector stock was National Retail Properties (NNN), an equity real estate investment trust. The firm acquires, owns, manages, and develops retail properties in the United States. It provides complete turn-key and built-to-suit development services including market analysis, site selection and acquisition, entitlements, permitting, and construction management. NNN delivered the second highest absolute return of any stock in our portfolio at 11.346% over the reporting period. Our NNN analyst determined the stock was fairly priced and closed the position after the fiscal year closed.
Another noteworthy stock for the Fund was Ancestry.com, Inc. (ACOM). It was our top individual stock, with an impact of 0.707% and a 16.02% absolute return. ACOM operates as an online family history resource for subscribers worldwide. The company’s subscribers use the proprietary online platform, digital historical record collection, and technology to research their family histories, build their family trees, collaborate with other subscribers, upload their own records, and publish and share their stories with their families. The Fund closed its position in ACOM in May 2011.
Our worst stock selections were spread across multiple sectors including Energy, Consumer Discretionary, and Healthcare. Investments included Hanger Orthopedic Group (HGR) which produced a -29% return, one of our worst performing stocks.

The Michael Price Student Investment Fund
35
Central European Distribution Corp (CEDC), a US alcoholic beverage producer and distributor, lost roughly 40%, our worst performing stock over the reporting period.
Driving Fund Performance
During the second half of fiscal 2011, the Fund decreased its equity holdings over the summer as
the increased instability of the market triggered stop losses set to protect the fund while the fund was unable to devote full attention to the holdings. As a result of a decision made at the beginning of the summer, the Fund increased its position in the benchmark index to 72% by August 31, 2011.
The Michael Price Student Investment Fund
36
Asset Allocation
As the Fund focuses on bottom up stock‐picking and fundamental analysis, asset allocation is a secondary consideration.
The Fund’s commitment to bottom‐up stock selection is primarily pedagogical in nature. The Fund is a seminar style course in which students can use and combine skills garnered in their other classes in a professionally practicable manner. We believe the benefits derived from such a course are immeasurable.
That said, it should be clearly understood that as the central principle of modern portfolio theory, asset allocation, should not be ignored by the Fund. On an informal basis, the Fund routinely reviews the industry allocation of its holdings and encourages analysts to explore underweight industries.
As of August 31, 2011, the sectors with the most significant weight in the Fund are:
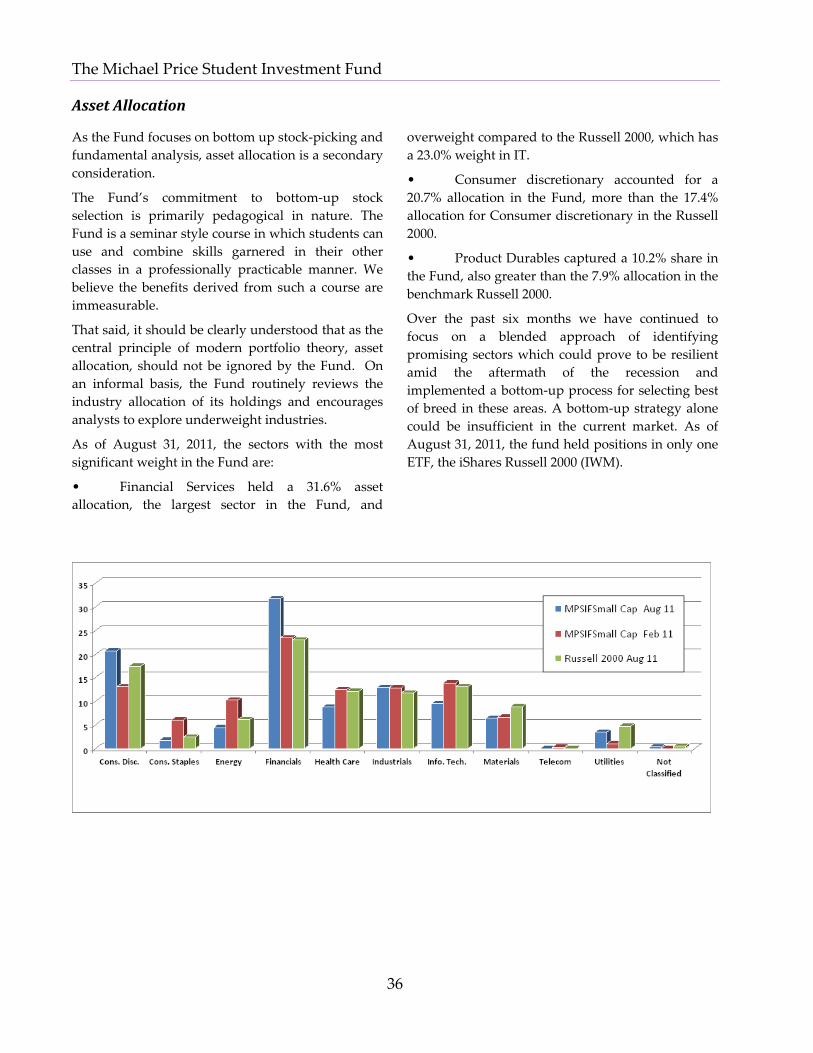
• Financial Services held a 31.6% asset allocation, the largest sector in the Fund, and
overweight compared to the Russell 2000, which has a 23.0% weight in IT.
• Consumer discretionary accounted for a 20.7% allocation in the Fund, more than the 17.4% allocation for Consumer discretionary in the Russell 2000.
• Product Durables captured a 10.2% share in the Fund, also greater than the 7.9% allocation in the benchmark Russell 2000.
Over the past six months we have continued to focus on a blended approach of identifying promising sectors which could prove to be resilient amid the aftermath of the recession and implemented a bottom‐up process for selecting best of breed in these areas. A bottom‐up strategy alone could be insufficient in the current market. As of August 31, 2011, the fund held positions in only one ETF, the iShares Russell 2000 (IWM).

The Michael Price Student Investment Fund
37
Holdings Profile
Small Cap Portfolio as of August 31, 2011
Company Name Ticker SectorShares
HeldClosing
PricePosition
Value% of
AssetsCabela's Incorporated CAB Consumer Discretionary 773 23.45 $18,127 4.10%Community Bank System, Inc. CBU Financials 556 25.03 $13,917 3.15%GSI Group, Inc. GSIG Information Technology 1,930 9.48 $18,296 4.14%Midas, Inc. MDS Consumer Discretionary 1,865 8.05 $15,013 3.40%National Retail Properties NNN Real Estate 983 27.26 $26,797 6.06%Portfolio Recovery Associates, Inc. PRAA Financials 292 73.13 $21,354 4.83%iShares Russell 2000 Index Fund IWM Not Classified 4,167 72.65 $302,733 68.50%
Direct Equity Holdings $113,504 25.68%Total Equity Holdings $416,236 94.18%Cash as of February 28, 2011 $25,729 5.82%Total Assets $441,965 100.00%
Small Cap Portfolio as of February 28, 2011
Company Name Ticker SectorShares
HeldClosing
PricePosition
Value% of
AssetsAeropostale, Inc ARO Consumer Discretionary 739 25.94 $19,170 3.69%Amerisafe, Inc. AMSF Financials 1079 19.96 $21,537 4.14%Chicago Bridge & Iron Co CBI Industrials 796 35.52 $28,274 5.44%Community Bank System, Inc. CBU Financials 556 25.16 $13,989 2.69%Energy Partners, Ltd EPL Energy 1793 16.37 $29,351 5.64%Hanger Orthopedic Group HGR Healthcare 1058 26.90 $28,460 5.47%Innophos Holdings, Inc. IPHS Materials 409 42.83 $17,517 3.37%Medifast, Inc. MED Consumer Discretionary 818 23.14 $18,929 3.64%National Retail Properties, Inc. NNN Financials 983 25.69 $25,253 4.85%RC2 Corporation RCRC Consumer Discretionary 586 21.71 $12,722 2.45%Skyworks Solutions, Inc. SWKS Information Technology 751 35.94 $26,991 5.19%iShares Russell 2000 Index IWM Not Classified 1559 82.27 $128,256 24.65%
Direct Equity Holdings $242,193 46.56%Total Equity Holdings $370,449 71.21%Cash as of February 28, 2011 $149,758 28.79%Total Assets $520,207 100.00%
The Michael Price Student Investment Fund
38
Investment Style and Strategy
Objectives: The objectives of the Small Cap Fund are to achieve total returns in excess of the Russell 2000 Index and to achieve an absolute return in excess of inflation in accordance with the Fund’s role as a part of a university endowment.
Style: The Small Cap Fund combines a bottom‐up approach for security selection and portfolio construction with consideration of the Fund’s current sector weightings for any new additions to the portfolio. The Fund invests primarily in domestic equities with market capitalization less than $2 billion and benchmarks its returns against the Russell 2000 Index. The portfolio does not have a value or growth bias or primarily utilize a top‐down investment methodology. Rather, individual company analysis is conducted in conjunction with economic and sector outlooks provided by the MPSIF economic team and evaluated in the context of the consensus economic opinion of the Fund. Various criteria may be reviewed to determine the attractiveness of an investment, including, but not limited to, the company’s earnings outlook, valuation, M&A activity, management team, and/or other specific catalysts or events.
Strategy: The Fund targets a relatively concentrated portfolio comprised of 10 to 25 investments. Depending on both market and security‐specific conditions, the turnover of the Fund may vary. Throughout the semester, Fund analysts provide both updates on existing positions and pitches for new investments. With regard to existing allocations, the analyst assigned to a particular stock provides updates to the Fund throughout the course of the semester. At that time, the entire Fund votes on the analyst’s recommended course of action. The possible actions are selling the position, holding the position, or accumulating more of the position, subject to portfolio size constraints. This semester, “half positions” have been eliminated as an equity purchase option.
New pitches are also presented to the Fund throughout the semester. During new investment
deliberations, the Fund analyzes investment fundamentals and weighs them against any potential macro or company‐specific risks. Furthermore, the analyst and the Fund review the expected timing of the investment as well as all upside price targets and downside stop‐losses. When considering a new investment, the Fund may vote for a full position (approximately $20,000), zero allocation, or wait and watch the position until there is a more attractive entry point. Additionally, while there are neither specific sector guidelines nor sector concentration limits, the Portfolio Managers continually monitor and assess the Fund’s sector weightings on an absolute basis and relative to the benchmark.
Rationale for Small Cap Stocks: Small cap stocks are defined by the Fund as stocks that have market capitalization of less than $2 billion. Based on historical data, they have proven to offer the greatest returns to investors over long‐term horizons. However, given their size, earnings volatility, and lack of analyst coverage, these stocks may be subject to greater price risk and may take longer to be recognized by the market.
Risk Management: As stated earlier, stop‐loss prices are implemented during the winter and summer breaks. The Fund employs a standard 15% stop‐loss policy at purchase (or update) price across all names, regardless of sector or industry, which is revised with every 20% price appreciation throughout the holding period. Considering the volatility of Small Cap stocks, it is very important to take action immediately against price movement and market sentiment. Every position is assigned to a particular analyst. In order to maintain continuity between semesters, stocks assigned to outgoing analysts are temporarily assigned to second‐semester analysts (over the recess periods) until new analysts join the Fund and the stock coverage is reassigned.
The Michael Price Student Investment Fund
39
The Fixed Income Fund Message from the Portfolio Managers We are generally pleased with the performance of the Fixed Income fund, which outperformed the benchmark on a 12‐month basis by 0.76% (4.48% vs. 3.72%). Unfortunately, during the most recent 6‐month period, gross of fees, the Fund underperformed the benchmark Vanguard Total Bond Fund, which gained 4.87%. This performance has been set in the context of one of the most unique periods ever observed for fixed income assets. The Fixed Income market in 2011 has seen unprecedented government intervention to stimulate the economy and avoid contagion in the markets. This pas summer was defined by three key events: 1. The end of QE2 and Operation Twist: The end of the the Fedʹs quantitative easing program proved to have less of an immediate impact than we anticipated. We expected the drop in demand to cause rates to rise and thus had underweighted our treasury position. Due to larger macro uncertainties the opposite happened, as investors continued to view US treasures as a safe‐haven. Fortunately, we had retained some treasury exposure on the near‐end of the curve (1‐3 years) and prevented some potential losses. 2. European Credit Crisis: Throughout the summer we have seen contagion from the European peripherals (Greece and Ireland) towards the larger core nations. First Portugal and Spain were impacted, later Italy, and even France saw CDS spreads widen dramatically. This contagion largely played out as the Fixed Income Fund expected and had planned for. Our underweight exposure to the Eurozone allowed us to benefit as our thesis was realized. 3. US Debt Ceiling Debate: Throughout discussions during the summer we felt confident that this event would cause the markets to quickly realize our thesis that US debt levels were
unsustainable. Increased fear that the US could default on its debt should increase rates and cause the fund to benefit from its underweight position. Unfortunately, the opposite happened. Fears that the US might default on its debt lead to a flight to safety ‐ pushing down US borrowing rates. This rather bizarre reaction from the markets (fleeing to the debt of an entity it feared would default) negatively impacted the fund over the short term. Going forward, we intend to return the portfolio to near its benchmark allocations and revisit our long‐term thesis. The unpredictable behavior in the credit markets through the recent volatility has challenged conventional wisdom. Therefore, we have initiated an in‐depth analysis of how to best invest around our long‐term macro‐views without taking on unintentional Credit, FX, Duration, or Sovereign exposure. We firmly believe that this comprehensive refresh will provide the most appropriate fund allocation in addition to a formidable learning experience for the fund. Furthermore, a clearer articulation of our thesis will allow us to react appropriately when events impact the fund adversely. We will not reallocate based on fear, and we will have faith in our larger long‐term macroeconomic thesis. Over the short‐term, markets will fluctuate in sometimes incomprehensible fashion. The courage to stick to our thesis, while not ignorantly anchoring to it, should serve us well in the long‐term. Looking forward, we see three key tail risks that could cause extreme dislocation in the markets over the mid‐term: 1. European Credit Crisis: While some progress has been made, the region continues to have significant structural problems and unsustainable sovereign debt levels. We believe that ultimately some sort of Euro‐bond will be

The Michael Price Student Investment Fund
40
issued that is guaranteed by the union as a whole. It is nearly inconceivable that the ECB would allow Italy to fail as the currency union would almost certainly break apart. However, if this does happen it is very difficult to predict the global implications due to the opacity of financial institutionsʹ balance sheets. 2. China: There has recently been some concern regarding incestuous lending practices in China. Local banks lending to local governments, using over‐valued and inflated real estate as collateral. It is very difficult to determine the extent of these anecdotal stories but the Fixed Income Fund remains focused on the issue. Clearly any disruption to the Chinese growth story would be a severe shock to global credit markets. Currently we do not view this risk to be imminent, as China is still in the early innings of a resource driven economic expansion. We do however expect the pace of Chinese growth to slow modestly in 2012. 3. Japan: Japan continues to have seemingly unsustainable levels of sovereign debt. However, this has been the case for many years and many courageous investors
have timed their bets against the island nation poorly. We remain focused on the problem. Any material rise in real long‐term borrowing costs would cause us to revisit the problem and re‐assess our potential exposure. We recognize the U.S. federal reserve has publicly affirmed its commitment to preventing a double‐dip scenario, but must also point out that it seems policy options have largely been exhausted. We do believe that these three events could individually or combined result in a significant shock to the global economy and induce a double dip. However, given the limited nature of our investment options it is very difficult to maintain our moderately bullish thesis while protecting ourselves from these events through individual security selection and the potential use of derivatives. As such, we feel it is best to stay the course, and not reallocate based on the fear of events with probabilities and implications that are difficult to estimate. Sincerely, Sven Karlsson & Tom Libretto MPSIF Fixed Income Fund Co‐Portfolio Managers
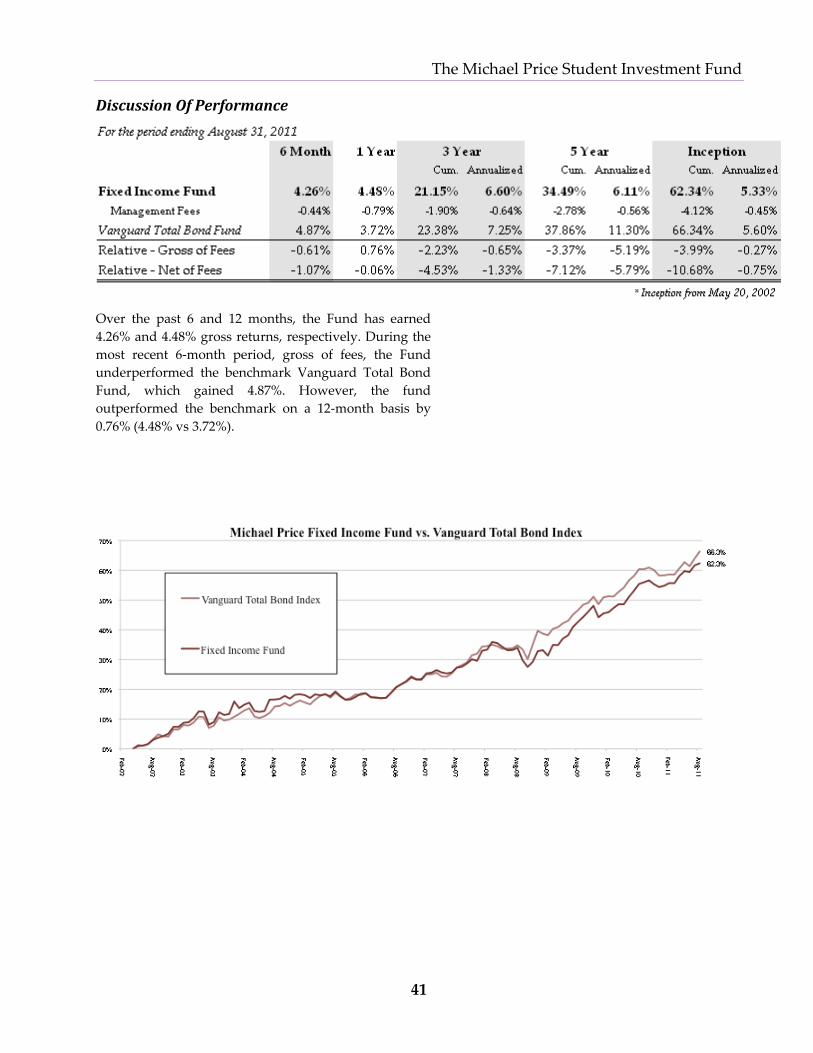
The Michael Price Student Investment Fund
41
Discussion Of Performance
Over the past 6 and 12 months, the Fund has earned 4.26% and 4.48% gross returns, respectively. During the most recent 6‐month period, gross of fees, the Fund underperformed the benchmark Vanguard Total Bond Fund, which gained 4.87%. However, the fund outperformed the benchmark on a 12‐month basis by 0.76% (4.48% vs 3.72%).

The Michael Price Student Investment Fund
42
Asset Allocation Each of the bond mutual funds in our portfolio achieves our goals as the investment vehicle for exposure to a particular sector. The largest positions are currently in Mortgage Backed Securities and Investment Grade bonds. As we go forward, we intend to continue making investments consistent with our view that
currently includes closely following our exposure to the MBS and emerging market sectors. Although our actual allocation in each fixed income product may differ from our intended sector percentages, we are prepared to take a more active investment approach.
Holdings Profile

The Michael Price Student Investment Fund
43
Investment Style & Strategy
The Fund seeks to outperform its benchmark, the Vanguard Total Bond Fund (VBMFX). The Fund implements its views through a top‐down allocation approach to the four main sub‐sectors of the US Fixed Income investment grade market, namely – US Treasuries, Corporate Bonds, Mortgage‐Backed/Asset‐Backed Securities and Foreign Investment Grade Bonds (Emerging Markets and Developed Markets). Due to its tax‐exempt status, the Fund does not invest in Municipal bonds. Also, the Fund does not engage in shorting, derivatives trading, or other non‐linear investment strategies. Currently, the Fund does not buy individual securities, due to the limited size of our trades and market spreads associated with buying individual securities. Instead the Fund invests in ETFs and other publicly traded funds to implement its sector allocation. However, given the current market opportunities, we are working on a strategy to incorporate individual securities that provide superior returns with limited risk.
Due to the Fund’s inability to take positions in specific bond issues (limited dollar resources, the need to maintain a diversified fixed income portfolio and the limitations of our trading account), we use the Vanguard Total Bond Fund as our benchmark, as opposed to the more widely used Barclays Capital Aggregate Bond Index. Instead, we make sector allocation decisions and invest through ETFs and established mutual funds. We incur management fees, and thus benchmark to an index whose performance is also adversely impacted by mutual fund management fees. We feel it most appropriate to benchmark to the bond mutual fund index with the least tracking error to the Barclays Capital Aggregate Bond Index, and thus chose the Vanguard Fund. Going forward, when the Fund gains the capability to choose individual bond issues, a shift of our benchmark will be considered.

The Michael Price Student Investment Fund
44
Fund Management The Executive Committee
Back Row: Professor Richard Levich, Greg McSweeny, Tom Libretto, Chris Hemmelgarn, Dave Umbro, Sven Karlson Front Row: Nick Wells, Pamela Kaufman, Sarosh Nentin
Professor Richard Levich – Faculty Advisor Richard Levich is Professor of Finance and International Business and Deputy Chairman of the Department of Finance at New York Universityʹs Leonard N. Stern School of Business. Previously, he served as Chairman of the International Business Program at Stern. He is also a Research Associate with the National Bureau of Economic Research and he is a founding editor of the Journal of International Financial Management and Accounting. Professor Levich has been a visiting faculty member at many distinguished universities in the United States and abroad. He has published more than fifty articles and is the author or editor of fifteen books on various topics dealing with international finance. In 1997, Professor Levich received a CDC Award for Excellence in Applied Portfolio Theory from the Caisse Des Dépôts Group, France. Professor Levich received his Ph.D. from the University of Chicago.

The Michael Price Student Investment Fund
45
David Umbro – President David Umbro, CFA earned a B.S. in Finance and Accounting from the Carroll School of Management at Boston College. Prior to Stern, he was the Director of Research at Fernwood Advisors, a family investment office in Boston. He spent the past summer as an Equity Research Associate at Fred Alger Management. Sarosh Nentin ‐ Co‐Portfolio Manager, Growth Fund Sarosh Nentin has a B.S. in Finance and Economics from Boston College. Prior to Stern, Sarosh worked as an Associate in the power group at Dexia Global Structured Finance, LLC. He spent the past summer in New York as an Equity Research Associate at Morgan Stanley. Pamela Kaufman ‐ Co‐Portfolio Manager, Growth Fund Pamela Kaufman worked as a financial analyst at Wolf Popper LLP, a securities class action litigation firm, prior to coming to Stern. At Stern, Pamela is pursuing specializations in Finance and Strategy. Pamela received a B.S. in Finance and International Business from NYU Stern in 2006 and is a CFA charter holder. Nick Wells ‐ Co‐Portfolio Manager, Value Fund Nick Wells has a B.A. in Management from Texas Tech University. Before Stern, he was a trading assistant/junior trader on the fixed income trading desk at Southwest Securities. He spent the summer working as an Equity Research associate at UBS, where he covered U.S. automakers and suppliers. Greg McSweeney ‐ Co‐Portfolio Manager, Value Fund Greg McSweeney has a B.A. in Economics from Dartmouth College. Before attending Stern, he was an Associate in Asset‐Backed Portfolio Management at the Royal Bank of Scotland. He spent his summer working as an Associate Global Investment Specialist at the J.P. Morgan Private Bank. Chris Hemmelgarn ‐ Co‐Portfolio Manager, Small Cap Fund and Co‐Portfolio Manager Chris Hemmelgarn has a B.S. in Foreign Service from Georgetown University. Prior to Stern, he worked as a Research Analyst at Shaker Investments LLC, a Cleveland, Ohio based hedge fund and as an Associate at Morgan Stanley. He spent the summer working in the Equity Research department at Barclays Capital and will be returning there after completing his MBA. Sven Karlsson ‐ Co‐Portfolio Manager, Small Cap Fund, Fixed Income Fund Sven Karlsson has a B.S. in Operations Research and Industrial Engineering from Cornell University. Prior to Stern, Sven worked at J.P. Morgan primarily in the Internal Mergers & Acquisitions group where he focused on acquiring new products and divesting non‐core assets. He spent the past summer working as a Research Analyst at Halcyon Asset Management valuing special situations equities and distressed debt. Tom Libretto ‐ Co‐Portfolio Manager, Fixed Income Fund Tom Libretto holds a B.B.A. in Finance from James Madison University and is a CFA Level III candidate. Prior to attending Stern, he was a Credit Analyst at Aladdin Credit Partners, an alternative asset management firm focused on distressed debt investing.

The Michael Price Student Investment Fund
46
The Growth Fund
Back Row:Varun Bahl, Yani Avni, Jeremiah Driansky Middle Row: Jian (Bob) Huang, Amit Raybardhan, Sumit Jain, Gopikrishan Unnithan Front Row: Pamela Kaufman, Sarosh Nentin, Tenzin Sonam, Swati Malik Pamela Kaufman worked as a financial analyst at Wolf Popper LLP, a securities class action litigation firm, prior to coming to Stern. At Stern, Pamela is pursuing specializations in Finance and Strategy. Pamela received a B.S. in Finance and International Business from NYU Stern in 2006 and is a CFA charter holder.
Sumit Jain earned a B.Tech in Computer Science and Engineering from Indian Institute of Technology (IIT) Bombay. Prior to Stern, Sumit worked in Alternative Investments division at Credit Suisse as Quantitative Developer, developing software and models for index tracking portfolio management team. He spent the past summer at Barclays Capital as equity research summer associate, working for Asia‐ex Japan Banks analyst.
Gopikrishan Unnithan has a B.A. in Physics and a B.S.E. in Computer Science & Engineering from the University of Pennsylvania. Prior to Stern he worked in the technology group at Eton Park Capital Management, a multi‐strategy hedge fund. Gopi has also completed all three levels of the CFA Program and is a CFA Charterholder.
Tenzin Sonam has a B.S. in Computer Engineering from Columbia University. Prior to Stern, he worked as a credit analyst at State Street Corporation. He spent the past summer as a Sales & Trading Summer Associate at Nomura Securities America within their Fixed Income division.

The Michael Price Student Investment Fund
47
Nicole Sparks has a B.A. in Economics from Bates College. Prior to Stern, Nicole worked as a Consultant at IBM and a Senior Client Associate at Greenwich Associates. She spent the past summer at Jefferies as an Equity Research Summer Associate. Swati Malik has a B.S. in Computer Science from University of Notre Dame. Prior to Stern, Swati worked as a consultant at Deloitte Consulting. She spent the past summer as an Investment Banking Associate in the Consumer Retail Group at Goldman Sachs. Jian (Bob) Huang has a Masters degree in Library and Information Science from SUNY Albany, a BS in Math and a BA in Physics from Cleveland State University. Prior to 2011, Jian worked as a branch manager in the Brooklyn Public Library. He spent the last summer at UBS Hong Kong working as a Summer Associate in the Healthcare sector and Product Management. Sarosh Nentin has a B.S. in Finance and Economics from Boston College. Prior to Stern, Sarosh worked as an Associate in the power group at Dexia Global Structured Finance, LLC. He spent the past summer in New York as an Equity Research Associate at Morgan Stanley.

The Michael Price Student Investment Fund
48
The Value Fund
Back Row: Michael Buckley, Zach Goldman, Tom Libretto Middle Row: Raymond Strecker, Greg McSweeney, Nick Wells Front Row: Mark Pursell, Laura Figlina, James Ulan, Anthony Chien, Marguerite Pressley Nick Wells has a B.A. in Management from Texas Tech University. Before Stern, he was a trading assistant/junior trader on the fixed income trading desk at Southwest Securities. He spent the summer working as an Equity Research associate at UBS, where he covered U.S. automakers and suppliers. Greg McSweeney has a B.A. in Economics from Dartmouth College. Before attending Stern, he was an Associate in Asset‐Backed Portfolio Management at the Royal Bank of Scotland. He spent his summer working as an Associate Global Investment Specialist at the J.P. Morgan Private Bank. Marguerite Pressley has a B.S. in Finance and a B.S. in Accounting from North Carolina State University. Prior to Stern, Marguerite worked as a Senior Analyst in the Special Situations Group at Goldman Sachs. She spent the past summer working as a Mergers and Acquisitions Senior Consultant at Deloitte Consulting LLC. Renzo Dancourt, CFA has a B.A. in Economics and a M.S. in Finance from Universidad del Pacifico in Lima, Peru. While studying the MBA part‐time at Stern, Renzo works at Deutsche Asset Management as part of a portfolio management team that runs a fixed income strategy for institutional clients.

The Michael Price Student Investment Fund
49
Michael Buckley has a B.A. in Economics from the College of the Holy Cross. Prior to Stern, Michael served as an intelligence officer in the United States Marine Corps, serving combat deployments in both Iraq and Afghanistan. He spent the past summer in New York as a Sales and Trading Summer Associate at Bank of America Merrill Lynch. Zach Goldman has a B.S in Finance from the University of Delaware. Prior to Stern, Zach worked in Private Banking, as an analyst for both Barclays Capital and Alliance Bernstein. He spent the past summer in Greenwich, CT as a Sales & Trading Summer Associate at Weeden & Co. Anthony Chien has B.A.s in Molecular & Cell Biology and Cognitive Science from the University of California, Berkeley. Prior to Stern, Anthony worked as a financial healthcare consultant for hospitals at Triage Consulting Group. He spent the past summer as an Equity Research Associate at Jefferies and Company, covering the Technology and Software Applications sector. Laura Figlina has a B.A. in Psychology from Boston University. Prior to Stern, Laura worked as an Associate Director at UBS Investment Bank and in Hedge Fund Capital Raising at Oakpoint Advisors. She spent the past summer at Credit Suisse as a Sales & Trading Summer Associate. Raymond Strecker has a B.A. in English and French from the University of Pennsylvania. Prior to Stern, Raymond worked as a credit analyst at the monoline bond guarantor CIFG. He spent the past summer as a Private Wealth Management Summer Associate at Goldman Sachs. Tom Libretto holds a B.B.A. in Finance from James Madison University and is a CFA Level III candidate. Prior to attending Stern, he was a Credit Analyst at Aladdin Credit Partners, an alternative asset management firm focused on distressed debt investing.

The Michael Price Student Investment Fund
50
The Small Cap Fund
Back Row: Sven Karlsson, Andrew Louloulis Anthony Pirraglia, Chris Hemmelgarn, Middle Row: Anthony Thai, Sok Ung, Brian Malkerson, David Umbro Front Row: Vinayak Morada, Can Bayson, Steve Harris, Anik Ghandi
Sven Karlsson has a B.S. in Operations Research and Industrial Engineering from Cornell University. Prior to Stern, Sven worked at J.P. Morgan primarily in the Internal Mergers & Acquisitions group where he focused on acquiring new products and divesting non‐core assets. He spent the past summer working as a Research Analyst at Halcyon Asset Management valuing special situations equities and distressed debt.
Chris Hemmelgarn has a B.S. in Foreign Service from Georgetown University. Prior to Stern, he worked as a Research Analyst at Shaker Investments LLC, a Cleveland, Ohio based hedge fund and as an Associate at Morgan Stanley. He spent the summer working in the Equity Research department at Barclays Capital and will be returning there after completing his MBA. David Umbro, CFA earned a B.S. in Finance and Accounting from the Carroll School of Management at Boston College. Prior to Stern, he was the Director of Research at Fernwood Advisors, a family investment office in Boston. He spent the past summer as an Equity Research Associate at Fred Alger Management. Can Baysan has a B.S. in Systems Engineering and Economics from the University of Virginia. Prior to Stern, Can worked for two years as a supply chain technology consultant at Kurt Salmon Associates and three years in the COO organization with the technology infrastructure group at Deutsche Bank. He spent the past summer in New York as a Sales and Trading Summer Associate at Bank of America Merrill Lynch.
The Michael Price Student Investment Fund
51
Andrew Loulousis has a B.S. in General Engineering from the University of Illinois in Urbana. Prior to Stern, Andrew worked as a Management Consultant at Accenture. He spent the past summer as an Investment Banking Associate in the Financial Institutions Group at Nomura Securities North America. Vinayak Morada has a B.ASc in Electrical Engineering from the University of British Columbia, Canada. Prior to Stern, Vin worked as a Program Manager at Microsoft Corporation. He spent the past summer in New York as a Sales & Trading Summer Associate at Bank of America Merrill Lynch. Sok Ung has a B.S. in Policy Analysis & Management from Cornell University. Previously, Sok worked at J.P. Morgan in a group that managed $15 billion of direct and primary private equity investments. He spent the past summer working as a Summer Associate for Leopard Capital, the first and largest private equity firm in Cambodia. Anthony Pirraglia has a B.S. in Accounting from Villanova University. Prior to Stern, Anthony worked within the restructuring and turnaround group at Huron Consulting Group. This summer, he interned at Deutsche Bank within the Healthcare investment banking and Leveraged Finance groups. Anthony Thai has a B.A. in Economics and Statistics from the University of Chicago. Prior to Stern, Anthony worked as an Economist at FTI Consulting, Inc. He spent the past summer in New York as a Finance Associate at Sabra Dipping Company, a PepsiCo‐Strauss Group joint venture. Stephen Harris graduated from Tufts University with a B.A. in Economics. Prior to Stern, Stephen was an Analyst in the Capital Markets group at commercial real estate advisory firm Cushman & Wakefield Sonnenblick Goldman. Stephen will be joining the Institutional Real Estate Banking group at Wells Fargo as a Summer Associate. Anik Gandhi has an A.B. in Economics from Dartmouth College. Prior to Stern, Anik was a Senior Analyst in the Performance Improvement Office at Energy Future Holdings. He spent the past summer interning in the Investment Banking Division at Goldman Sachs covering Natural Resources, where he will be returning after graduation.
Brian Malkerson holds a B.A. in Economics from Northwestern University. Prior to Stern, Brian worked at JH Whitney Capital Partners, a mid‐market private equity firm.
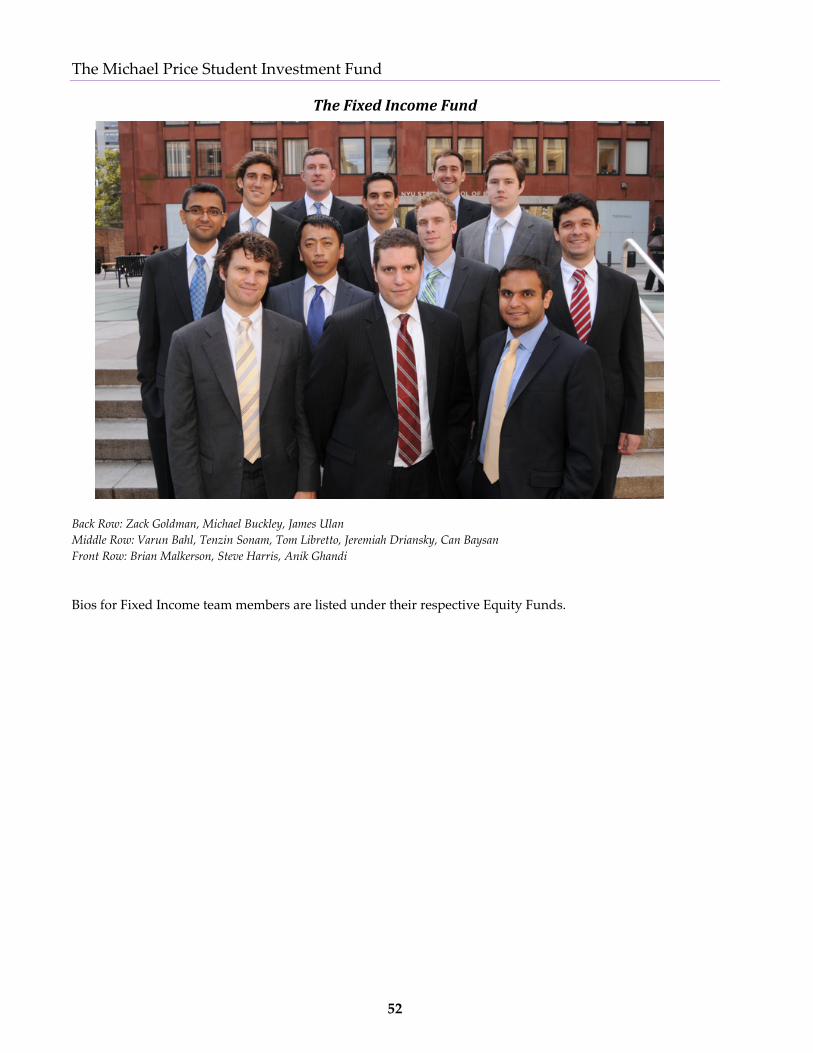
The Michael Price Student Investment Fund
52
The Fixed Income Fund
Back Row: Zack Goldman, Michael Buckley, James Ulan Middle Row: Varun Bahl, Tenzin Sonam, Tom Libretto, Jeremiah Driansky, Can Baysan Front Row: Brian Malkerson, Steve Harris, Anik Ghandi
Bios for Fixed Income team members are listed under their respective Equity Funds.

The Michael Price Student Investment Fund
53
Financial Statements

The Michael Price Student Investment Fund
54
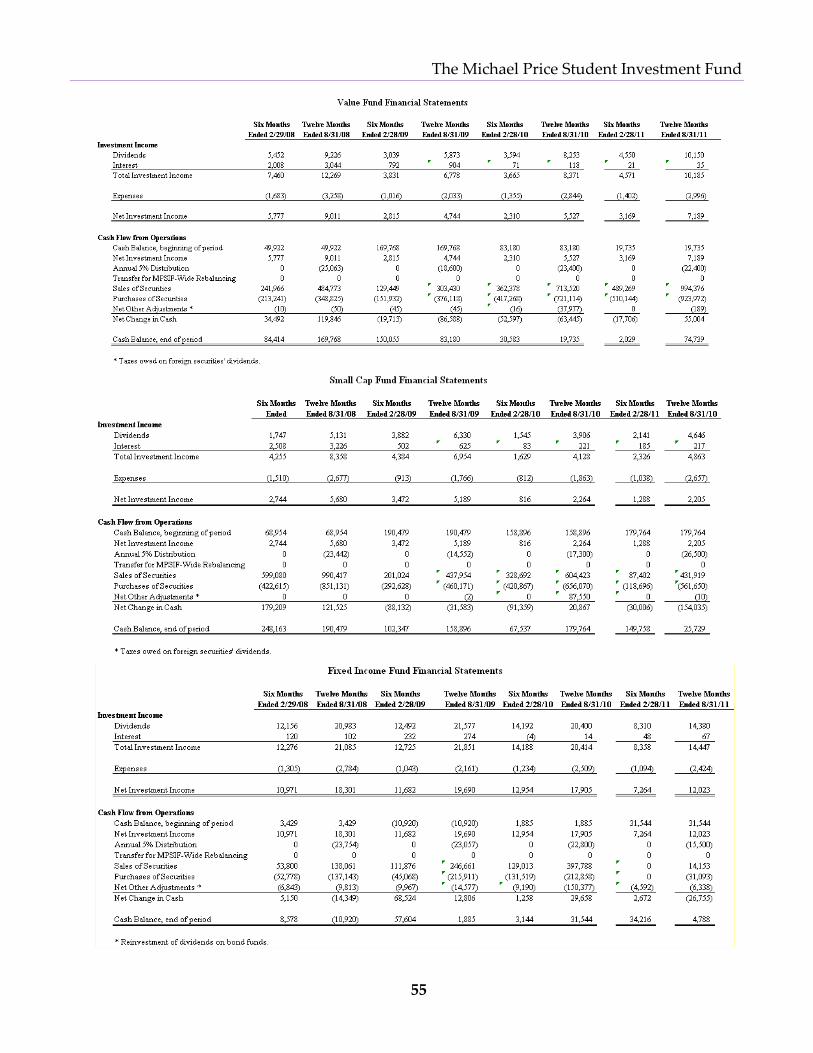
The Michael Price Student Investment Fund
55

THE MICHAEL PRICESTUDENT INVESTMENT FUND
44 WEST FOURTH STREETNEW YORK, N.Y. 10012
http://pages.stern.nyu.edu/[email protected]