THE METROPOLITAN CHALLENGE: The Case of São Paulo … metropolitan challenge... · 1993 and 2015,...
27
1 THE METROPOLITAN CHALLENGE: The Case of São Paulo Marcos Costa Lima 1 Antonio Jucaá 2 Abstract This article has three parts. The first part discusses key issues related to the Global Cit- ies today, noting that the world's urban population has exceeded the rural population in 2006, which represents major challenges to the economies, increasing demands and consumption from industry and services with serious effects on the environment. Meg- acities have also grown in number. It discusses also the tension between cities and poli- tics, reflecting on the harmful effects of neo-liberalism since 1980’s. The second chapter - Guide to reading the cities, identify the driving forces of urbanization. The third chap- ter is empirical and presents the case of São Paulo and its metropolitan region between 1993 and 2015, starting with brief notes on the Brazilian urbanization process and fo- cusing on aspects related to vulnerable populations, environmental dilemmas, and threats on functionality. It also consider aspects of industry, labor market, service sec- tors and more directly on social issues of this great metropolis. In conclusion, we find that the metropolitan area and the city of São Paulo undergo deep changes, losing space in its industry and becoming a major service center for the country. At the same times, it faces problems related to important issue as water, deforestation, the periodic flooding and growth of slums. Summarizing, the city and its metropolitan area are demanding a more rigorous and ambition urban planning capable to articulate the city with the vari- ous metropolitan areas in the state for its citizens’ well-being, although this planning has to come with a national wide counter-parts. Key-words: Urbanization; Megalopolis; driving forces; São Paulo city; metropolitan area of São Paulo; Economic-political, environmental, social policies issues. 1. Introduction Central Issues on Today World Cities The thinking on the contemporary city is not an easy task. It requires the articulation of several fields and issues, given the complexity of the phenomenon, which involving a broad historical understanding, to follow events, at times of slow and violent social changes in a long- term perspective. Rises and falls mark the whole history of western cities, as during the classical periods, later in feudal times, occurred with City States in the italic peninsula through the 1 Prof. of Political Science Department of UFPE, postdoctoral fellow at the University of Paris XIII and doctorate from Unicamp. He is currently a board member of the International Centre Celso Furtado and coordinates the Institute of Asian Studies, UFPE. 2
Transcript of THE METROPOLITAN CHALLENGE: The Case of São Paulo … metropolitan challenge... · 1993 and 2015,...

1
THE METROPOLITAN CHALLENGE:
The Case of São Paulo
Marcos Costa Lima1
Antonio Jucaá2
Abstract
This article has three parts. The first part discusses key issues related to the Global Cit-
ies today, noting that the world's urban population has exceeded the rural population in
2006, which represents major challenges to the economies, increasing demands and
consumption from industry and services with serious effects on the environment. Meg-
acities have also grown in number. It discusses also the tension between cities and poli-
tics, reflecting on the harmful effects of neo-liberalism since 1980’s. The second chapter
- Guide to reading the cities, identify the driving forces of urbanization. The third chap-
ter is empirical and presents the case of São Paulo and its metropolitan region between
1993 and 2015, starting with brief notes on the Brazilian urbanization process and fo-
cusing on aspects related to vulnerable populations, environmental dilemmas, and
threats on functionality. It also consider aspects of industry, labor market, service sec-
tors and more directly on social issues of this great metropolis. In conclusion, we find
that the metropolitan area and the city of São Paulo undergo deep changes, losing space
in its industry and becoming a major service center for the country. At the same times, it
faces problems related to important issue as water, deforestation, the periodic flooding
and growth of slums. Summarizing, the city and its metropolitan area are demanding a
more rigorous and ambition urban planning capable to articulate the city with the vari-
ous metropolitan areas in the state for its citizens’ well-being, although this planning
has to come with a national wide counter-parts.
Key-words: Urbanization; Megalopolis; driving forces; São Paulo city; metropolitan
area of São Paulo; Economic-political, environmental, social policies issues.
1. Introduction
Central Issues on Today World Cities
The thinking on the contemporary city is not an easy task. It requires the articulation of
several fields and issues, given the complexity of the phenomenon, which involving a broad
historical understanding, to follow events, at times of slow and violent social changes in a long-
term perspective. Rises and falls mark the whole history of western cities, as during the classical
periods, later in feudal times, occurred with City States in the italic peninsula through the
1 Prof. of Political Science Department of UFPE, postdoctoral fellow at the University of Paris XIII and doctorate from
Unicamp. He is currently a board member of the International Centre Celso Furtado and coordinates the Institute of Asian Studies, UFPE. 2
2
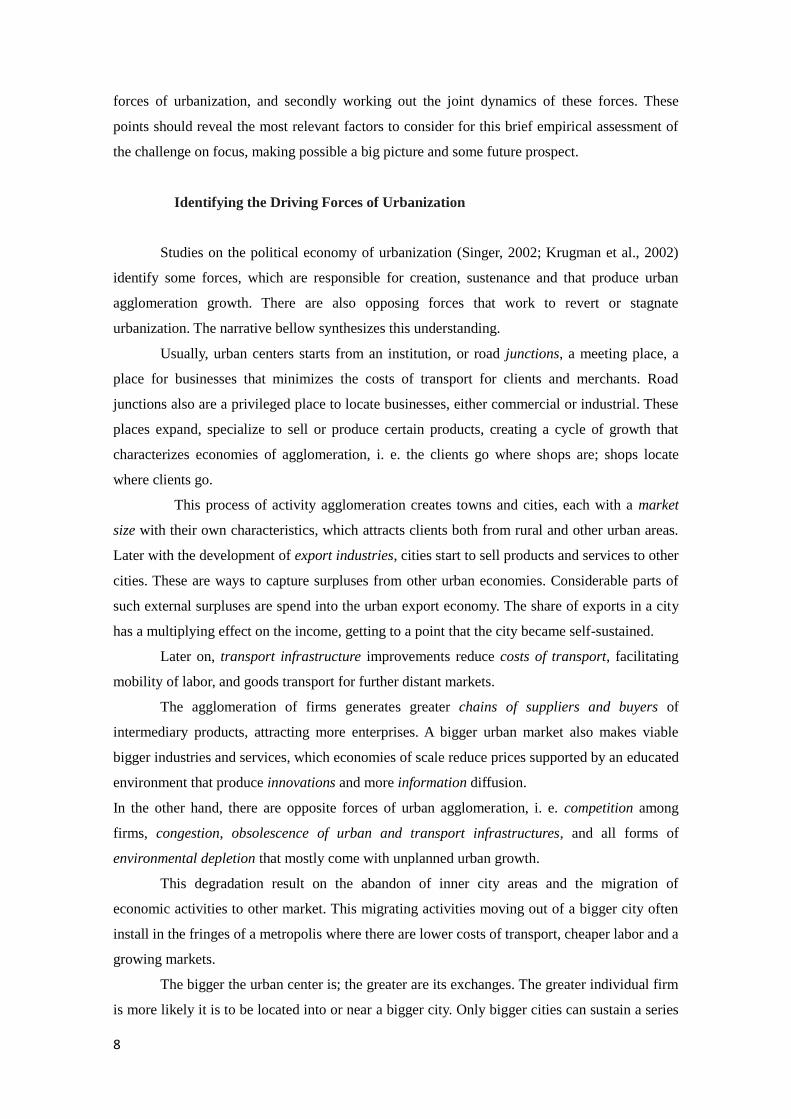
renascence, the same during the baroque period, and up to the industrial and revolutionary age.
Today, we have a speeding of political, technological, economic, social, cultural changes, and an
enormous increase of inputs taken from natures, triggering climate changes, together with the
urbanization of societies and intense globalization processes.
As stated by John Seixas3 "system-city, in various urban areas in the world, is rapidly
changing historical paradigm", making necessary a comprehensive understanding of those
transformations, taking into account the perplexities, paradoxes and unknowns that impact all
scholar that focus on the phenomenon..
Addressing these knowledge need, firstly it is necessary to consider the understanding
of the city as a social construct, i. e. a dynamic process of negotiation among social players.
Secondly, an understanding of the city as a spatial process, giving relevance to real empirical
analysis of urban phenomena, it is what gives specificity to the discourse on urban issues.
Finally, it is necessary to indorse and combine the urban theory with empirical evidences for the
social construct of genuine public policies.
Claiming that cities are essential for the social-economic and cultural development of
societies, however they are at a crossroad, since their contradictory dynamics creates dilemmas,
which often comes with lack of capacity to translate the urbanism into tangible and viable urban
programs4.
Even taking into account this "abstract city" vision, this paper considers that is essential
to establish a distinction between central cities - those geographically located in the north of the
planet, from outlying cities. This even regarding that in the very periphery of the capitalist
system, there are replicas of the North-South scheme.
In his book, Cities Rebels, the geographer David Harvey5 presents some substantive
thinking, taken as a guideline in this article. He involve us into the urban conflict sphere: "The
city is where all types and classes are mixed, although reluctant and conflicting way, to produce
a common life, though perpetually mutable and transient." Continuing his argument, Harvey
speaks of the difficulty of maintaining the urban utopia, suffering by recent waves of
privatization, spatial control, policing, surveillance and states inclined to capitalism's defenses,
which has generated strong political tensions in many urban quarters of the planet.
The struggle to appropriate the spaces and urban public goods with a view to a
common goal is ongoing, with successful examples throughout, but as the neoliberal policy
reduces the financing of public goods, also causes a reduction in the available common, forcing
3 Seixas, João (2013) A Cidade na Encruzilhada. Repensar a cidade a sua política. Porto: Edições Afrontamento
4 Guerra, Isabel, Prefácio. In: A Cidade na Encruzilhada. Repensar a cidade a sua política. Porto: Edições Afronta-
mento. 5 Harvey, David Cidades Rebeldes. Do direito à cidade à revolução urbana. São Paulo: Martins Fontes, p.134.

3
social groups to seek other ways to keep the common - education, for example (Harvey, p.145).
Also, creating an interesting and stimulating community everyday end up losing it to the
predatory practices of estate agents (op. cit. p.153).
An important part of the world population now lives in semiurbanized territory in
precarious areas, slums, ghettos, proto-urbanized or ruro-urbanized, and still are part of the city.
The very notion of city human product par excellence is inevitably complex and can not be in
any way simplistic, univocal, closed.
Based on World Urbanization Trends 20146 we have a global framework that imposes
some reflections and deserve, going forward, greater attention to the urban phenomenon. It has
been found that more people live in urban areas than in rural areas, with 54% of the world
population living in cities. In 1950 this percentage did not exceed 30% and for 2050 it is
estimated that 66% of the world population will be living in cities. It is therefore of rapid
growth (Chart 1)The most urbanized regions include North America - 82%, Latin America and
the Caribbean - 80% and Europe with 73%. Africa and Asia, respectively, are still largely rural,
with 40 and 48% living in urban areas. However, some regions are growing faster than others in
terms of urban life. For 2050, projections point to 56 and 64 percent of people who live in
cities, respectively.
Chart1 Rural population and the World Urban 1950/2050
Source ________________
As for the rural population, it grows much slowly since 1950. The world rural
population was estimated 3.4 billion people and will decline to 3.2 million in 2050. Africa and
Asia have almost 90% of the world's rural population. India has the largest rural population, or
857 million, followed by China 635 million.
6 UNU (2014), World Urbanization Prospects. The 2014 Revision. New York: United Nations

4
The growth of the world's urban population has grown very rapidly since 1950, 746
million to 3.9 billion in 2014. Asia, despite its low urbanization index, has 53% of the world's
urban population, followed by Europe - with 14% and Latin America and the Caribbean - 13%.
Almost half of urban residents in the world live in small towns with less than 500,000
inhabitants, which also shows how much can be done to give these towns a quality of life that
do prevent migration to large urban centers. While only 1/8 of these urban dwellers live in 28
megacities with more than 10 million inhabitants.
Tokyo is the largest urban agglomeration in the world where you live 38 million
people. New Delhi has 25 million residents. Shanghai has 23 million. The Mexico City, Mumbai
and Sao Paulo, each have 21 million inhabitants.
By 2013, projections indicate that the world will have 41 mega-cities with over 10
million inhabitants. The novelty is that decades ago the world's largest cities were in developed
countries, but now they are in the global South .Finally, the extent to which the world continues
to grow its urban population. The challenges of sustainable development will be concentrated in
cities, particularly in low-to middle-income countries, where the speed of urban is higher and
where key issues as demand of water, energy and services which, not all cities can offer .
Chart 2
Source: __________
As well says Isabel Guerra7, [ "Understanding the city as regards space as an element
in a constant process of social construction of collective order, it also understand the
contradictions that it contains and the ceaseless struggle between inequality and equity which
runs through modern society. The city does not reflect more than the contradictions that are
present in society: a society uneven matching an uneven city "].
7 Guerra Isabel (2013) op.cit p.15.

5
Once again, the theme of relational city emerges the importance of public regulation
and the question about the current political and institutional structures of governance,
regulation, leadership and action in cities.
For João Seixas8, one of the interrogations of his book is that one of the fundamental
problems of a city government is the poor consultation and participation of the people and their
interests. The promotion and programming of a "social cohesion urban" to guarantee the right to
the city would require new planning tools and forms of knowledge, open to the framework of
the various interests and trends, in a constant search for a compromise between the actors, as
opposed to programming and multiplication of predefined recipes. The city would therefore be a
collective and mobilizing project, broadening the horizons of living together, cemented in social
and political interactions that would feed a community, and not the result of unilateral policies.
Unfortunately, few governments are moving in this direction, of democratic expansion and
rights. In general, it is big business that has given the last word, under the cloak of invisibility
and connivance of government action.
City and Politics
It is recognized that the city governments arefacing severe fiscal crises, as expenses
rise revenues fall. In a context of city growth especially in central cities, requires for new
investments in infrastructure - waste treatment, transport, housing affordability, This happens
with the overloading and already loss-making municipal budgets and usually without much
governmental solidarity. However, we must acknowledge the crisis and the deep malaise of
territorial policies, first faced with difficulties in recognizing their legitimacy, that is, with the
acceptance of the foundations and the public action concerning urban planning. As happens in
other public policy areas, the neoliberal ideals also question the authority and legitimacy of the
state, city planning technical and instrumental, doubting of the tools, methods and procedures of
planning and urban management operations.
Every day it becomes more necessary to seek for another approach as the following,
that considers not only the issue of sustainability, but also effective and inclusive participation
of people (Chart 3).
Chart 3 . Sustainable Communities
8 Seixas, João (2013), op.cit. p.20

6
Source: The Egan Review, Office of the deputy Prime Minister, United Kingdom, 2004.
“From the point of view of urban space, large cities are attracting territories, not only
by the greater supply of labor - is in the services sector, industrial and trade - where are located
public institutions services in large number. As mentioned by journalist Jane Jacobs in his
classic The Death and Life of Great American Cities (1969), the diversity of urban conurbation
fabric of large cities is both its greatest asset, a source of innovation and creativity, but also a
source of inequalities and disparities that curtail their development and access to most of its
citizens to express urbanity that the city should offer” 9
. Looking at the case of peripheral and
Brazilian countries, Erminia Maricato10
rises an essential question when dealing with the
neoliberal process imposing deregulation and privatization of public services: "[... how to plan
and implement policies to address needs of most people in countries on the periphery of the
capitalism (system), who is not part of the private market". From Maricato’s point of view, the
globalization fell in a world that is still far from of a universal social rights stage regarding
health, education, social security, since much of the working class is living in informality. In the
same vein, these very unequal countries have an urban population which is excluded from the
right to the city and seeks access to housing through its own resources. This population often
look for fragile areas to settle as hill slopes next to waterways, or wetlands, which aggravates
the environmental conditions of cities and increase the risk of life, either by flooding or slope
slide. Addressing the issues of urban planning, it is not possible to avoid these excluded
populations problems as structural. It is worth reading this Maricato’s book specially the
passage where she asks What to do? That we do not have time to delve into here, but facing
9 Costa Lima, Marcos (2014), “Espaços e Territórios no Nordeste brasileiro: desafios e sinergias a partir das cidades
de porte médio”. 10
Maricato, Ermínia (2015), Para entendera Crise Urbana. São Paulo:Expressão Popular, p.68.

7
fundamental issues such as the cost of urban land, illegal and violent neighborhoods,
unsustainable areas, sanitation and public transport.
"The struggle for urban reform has at its core, the housing question, and urban
land, and the issue of segregation and exclusion of people from the right to the city. How do
we face these challenges when we know that, for example, in Rio de Janeiro, the value per
square meter of buildings had increased by over 180% in the last three years paying back
much over the real estate capital invested? When the laws are not enforced, and the City
General Plan is full of good intentions but unheeded, would we not know that the logic of
the city is for capital benefit and not for the welfare of the majority? 11
” (Maricato:68).
2. Metropolis Reading Guidelines
As pointed the last section, the urban population growth combined with continuous
urban sprawl constitute an aspect of the metropolitan challenge. In several emerging countries,
this becomes super urban agglomerations. Lack of services and environment depletion come
about, which require continuous long-term policy actions, often comes along with limited fiscal
budget to cope with increasing demands for investments and maintenance. Transfers of national
resources can partially respond to this budgetary constrain, but this help is innocuous in periods
of business crises, and people will continue to migrate to metropoles, since they offer more
income opportunities and higher wages.
The section tries to show that the metropolitan challenge concerns the political
economy of urbanization more or less implemented by national governments. The investments
in response to urbanization will multiply the motivations of people to migrate towards these
areas, and so firms will do.
In order to proceed, two terms deserve definition. The concept of metropolis, which
is here understood as urban agglomeration of closed interdependent cities. This is a classical
concept drawn from metropolitan planning in order to tackle common issues of merged and
close cities as transport, water supply and so on. The other term is the concept of urbanization
that is the increasing of urban population, and this can be linked to every think else that this
brings about. Obviously, there are difficulties to draw a line between urban and rural population,
since it is constantly changing, even when a law clearly defines urban boarders in a map. In
summa, the official place of residence shall settle this polemic, regarding urban or rural place of
work, and type of economic activity.
In face of the metropolitan challenges, the analysis requires a broad approach for a so
complex urban reality. This construct followed two steps; firstly identifying the general driving
11
Maricato, Ermínia (2015), op.cit, p.91
8
forces of urbanization, and secondly working out the joint dynamics of these forces. These
points should reveal the most relevant factors to consider for this brief empirical assessment of
the challenge on focus, making possible a big picture and some future prospect.
Identifying the Driving Forces of Urbanization
Studies on the political economy of urbanization (Singer, 2002; Krugman et al., 2002)
identify some forces, which are responsible for creation, sustenance and that produce urban
agglomeration growth. There are also opposing forces that work to revert or stagnate
urbanization. The narrative bellow synthesizes this understanding.
Usually, urban centers starts from an institution, or road junctions, a meeting place, a
place for businesses that minimizes the costs of transport for clients and merchants. Road
junctions also are a privileged place to locate businesses, either commercial or industrial. These
places expand, specialize to sell or produce certain products, creating a cycle of growth that
characterizes economies of agglomeration, i. e. the clients go where shops are; shops locate
where clients go.
This process of activity agglomeration creates towns and cities, each with a market
size with their own characteristics, which attracts clients both from rural and other urban areas.
Later with the development of export industries, cities start to sell products and services to other
cities. These are ways to capture surpluses from other urban economies. Considerable parts of
such external surpluses are spend into the urban export economy. The share of exports in a city
has a multiplying effect on the income, getting to a point that the city became self-sustained.
Later on, transport infrastructure improvements reduce costs of transport, facilitating
mobility of labor, and goods transport for further distant markets.
The agglomeration of firms generates greater chains of suppliers and buyers of
intermediary products, attracting more enterprises. A bigger urban market also makes viable
bigger industries and services, which economies of scale reduce prices supported by an educated
environment that produce innovations and more information diffusion.
In the other hand, there are opposite forces of urban agglomeration, i. e. competition among
firms, congestion, obsolescence of urban and transport infrastructures, and all forms of
environmental depletion that mostly come with unplanned urban growth.
This degradation result on the abandon of inner city areas and the migration of
economic activities to other market. This migrating activities moving out of a bigger city often
install in the fringes of a metropolis where there are lower costs of transport, cheaper labor and a
growing markets.
The bigger the urban center is; the greater are its exchanges. The greater individual firm
is more likely it is to be located into or near a bigger city. Only bigger cities can sustain a series
9
of production and professional specialties. Thus, in hierarchical networks of cities, size and
diversity exerts a centripetal force for investments and labor. They are like mountains or hills of
different heights in a plain, getting higher by continental forces.
As mentioned, there are cities that grow out their special attributes, for instance, because
they are seat of national governments or educational institutions. However, they produce
services that attract people and external surpluses, inclusive taxes.
Anyway, city growth is not an isolate process. This takes place into networks of cities,
including metropolises, submitted to periods of crises, and it is not quite spontaneous as only
result of market forces. These networks are the bases of national economies where public
policies plays a relevant role, concerning customs tariffs, transport and other infrastructure
building. In the urbanization process, states are major player in a series of ways, since they are
the main agent of infrastructure building (e.g. on transport and energy), and in the spatial
distribution of these investments. This will determine the profile of city sizes in a network. If
this distribution is too uneven, super concentration is more likely to happen with all its
problems. Trying to manage them later, without also tackling their causes, may aggravate them.
In this context, a more balanced growth of network of cities should drive the political
economy of urbanization, that should be performed by the state, which beside planning
infrastructure finance and allocation, can promote inter cities trade. The deliberate omission to
work on such policies just guided by immediate demand is quite irresponsible.
The Assessment of Urbanization Forces
The chosen working variables for this analysis are indicators of the driving forces of
urbanization identified in the previous section. First, the study assumes that the urban market
size engenders and thus encompasses companies’ connections, make possible information &
innovations and economies of scale. The work do not exam competition, but the last three forces
should surmount it. The presence of transport infrastructures indicates costs of transport.
Vulnerable population and sanitation data (on water supply, sewage services, drainage, solid
waste and emissions) serve as proxy of negative “externalities”.
The evolution of the Growth Domestic Product (GDP) is a proxy for Urban Market
Size. The evolution of urban added value in industries indicates urban income from industry,
and so it is an indicator of exports and endogenous consumption. Population growth and
distribution into the urban network is a proxy of trade among cities and migrations, thus
urbanization trends.
In summa, the evolution of urban GDP, the evolution of urban added value on
manufacture industry, urban population growth and distribution, including vulnerable people,
housing and sanitation data allow a first overall analysis of the metropolis on focus.

10
Towards a Future Comparative Study
The Chinese case of network growth of cities should be an interesting study, since
contrasting with Brazilian laissez faire; it suggests a comparative analysis of the role of the state
in urban and regional planning. Today, a network transport and communications are integrating
a series of special export zones along the Pacific coast, which full consequences are yet to come
(World Bank, 2014). The Beijing super agglomeration with 32 million people is not national
monocentric area and came into existence by similar forces, but the treatment it received for
decades was certainly not the same, so that there are now other super urban concentrations,
whose results could be examined in key aspects with this approach.
The Chinese population became mostly urban very recently, however representing
more than half a billion people. The recent Chinese economic growth is significantly high, as
high rates of growth reveals, but also showing continuity and stability. The Chinese state
strongly adopted policies of gross fixed capital formation in construction, a classical
countercyclical policy, but surpluses from exports and income distribution policies made this
possible. Thus, a key issue is the generation of surpluses into networks of urban economies.
3. The São Paulo Metropolitan Area and City Changing Times
Some Notes on Brazilian Urbanization Process
The urban over-concentration signals a lack of investment in urban and transport
infrastructure in Brazilian cities, especially in medium and small ones. In part, this explains the
profile of the Brazilian urban network that consists of a large number of small towns, a small
number of medium-sized cities, and a relatively large number of major cities. The Chart _ and _
serve as evidence for the above statement. Furthermore, the population of small cities is still
significant (about 44.2% of the Brazilian urban population), which together with medium-sized
cities makes the absolute majority. Moreover, this population concentration in main cities,
specially, into state capital and their metropolitan areas goes back to colonial times. The
implementation of colonial strategy of fragmentation and control developed autonomous
regional economies along the Brazilian coast, with few in land means of transport and
infrastructures, other than organized shipping and ports. After independence, the dismissing of
this fragmentation was slow, and remains incomplete, which is a burden for a more even growth
of cities in their national networks.

11
This process of over-concentration also occurred in Mexico City, and Buenos Aires.
In Brazil, this mainly happens in the São Paulo Metropolitan Area and, at a lower level, in the
Rio de Janeiro Metropolis.
Chart 4- Number of Cities by Population Size, Brazil 2014
Legend: 1- Less than 20,000 residents 2 - From 20 to 50,000 residents.
3- From 50 to 100 thousand resid. 4 - From 100 to 500,000 residents
5- 500,000 to 1 million residents 6 - More than 1 million residents
Source: IBGE estimates from the 2010 Census.
Chart 5 Percentage Urban Population, Brazil, 2014
Legend: 1- Less than 20,000 residents 2 - From 20 to 50,000 residents.
3- From 50 to 100 thousand resid. 4 - From 100 to 500,000 residents
5- 500,000 to 1 million residents 6 - More than 1 million residents
Source: IBGE estimates from the 2010 Census.
São Paulo and its Metropolitan Area

12
The City of São Paulo and, later, its metropolitan area had a gradual growth. In 1872,
when the first Brazilian demographic census was done, recorded only 31,385 inhabitants. The
production and export of coffee was the main product in the State .With the end of slavery, the
city began to receive European immigrants coming to replace this slave labor. This migratory
flow continued in the first two decades of the twentieth century, which kept the city high rate of
population growth. During this period, the city created the foundation for its industrial
development, with the transfer of capital generated in agricultural activity for the fledgling local
industries. The transformation of São Paulo in important industrial center occurred gradually,
but it was fully visible already in the 1920s the industrialization process in Brazil, centered in
São Paulo, benefited by the two World Wars, when the conflict obliged policies of Import
Substitution, favoring local production of consumer goods. By 1950, with a strong industrial
grow, the flow of migration Begin to be endogenous. More then 3 million people arrived
between 1950 and 198012
, a good deal from the northeast region.
From the second half of the 1970s, with productive deconcentration policies (abandoned
in 1990) and the export emphasis, other regions have gained importance in the national Gross
Domestic Product (GDP). Despite this fact, the share of each region in the period 1996-2006,
still reveal a clear predominance of the Southeast, with over 50% of the total GDP (IPEA, 2009,
p. 402). From the 1980s, there was a substantive amendment, whether as a result of both the
industrial decentralization process, in principle to the interior of the state, but also redirect part
of its industrial facilities to other parts of the country. The city then began to experience
negative migration balance. The conurbation has continued to grow as a whole, due to the
expansion of the city's outlying areas (including those located in protected areas and water
sources) and growth that is still observed in most of the municipalities in the metropolitan
region. São Paulo is the largest city in Brazil since the 60s, and today is the most powerful pole
of tertiary activities in the country with a population exceeding 11 million, distributed among
1,509 km2 of their municipality, which is divided into 31 boroughs and these, in 96 districts.
There stays the financial activities of a global nature, the headquarters of the largest national and
international banks, and their interactions with the real estate market; large multinational
interprises, giving the city the primacy of national metropolis transforming it into a global
metropolis. São Paulo is also the center of a metropolitan region (MRSP) of the same name,
which, with over 19 million inhabitants, occupies the 4th position in the ranking of the largest
urban agglomerations in the world. There are 39 municipalities, including the capital, 8.051km2
and a continuous urban area that in the east-west direction, has about 100 km long. A (MRSP)
consists of 38 municipalities that are grouped around the capital and are polarized by it,
occupying 3.24% of the total state territory, with an area of 8,051 km2, focusing, in 2010, about
12
.Prefeitura Municipal de São Paulo (2007), Histórico demográfico do Município de São Paulo.
Prefeitura.sp.gov.br
13
48% of the population of the entire state. (Pasternak and Lucia Bogus); (Ricardo Carlos Gaspar
(p.28).
From the industrial point of view, as observed by Caiado (2002), the match statistics
between 1985 and 1998, the metropolitan area goes from 26.8% to 25.0% in general industry
and 29.2% to 26, 0% in the manufacturing industry. There was a reduction in the share of
manufacturing textile products (27.5% to 21.2%). The furniture sector and other various
industries fell from (42.1% to 26.3%). In the category of intermediate goods, the highlights are
the pulp paper manufacturing (33.5% to 26.0%); manufacture of rubber and plastic products
(48.6% to 38.3%), basic metallurgy ( 18.8% to 8.4%), manufacture of metal products - except
machinery and equipment (51.0% to 36.9%) and among the divisions of capital goods and
durable consumer goods can be cited the equipment manufacturing divisions and equipment
(46.2% to 31.9%), machinery manufacturing, equipment and electrical material (49.9% to
39.6%). Manufacture of medical and hospital equipment, precision instruments, optical (47.8%
to 32.2%), Manufacturing and Vehicle Assembly (49.4% to 32.2%) and Electronic Material
Manufacture of machinery and Communications Equipaments (36, 6% to 30.7%). All this
means that, in a set of processed products, a real change in the structure of employment of
differents sectors of economic activity occurs in the MRSP, reducing industrial jobs, but driving
the growth of jobs in the tertiary (MONTALI , 2009).
In the next part of the work, we will present in more detail, indicators that we consider
essential to give a more approximate size of the city and the metropolitan region of São Paulo,
focusing on, especially, in the period covering 1993 to 2012. But in view of both the city and its
metropolitan area are directly linked to the economic dynamics of the state of São Paulo, we
will introduce information comparing this state with Brazil, to demonstrate the magnitude and
complexity of this urban concentration. For example, per capita income has grown in São Paulo
on average 30% more than the Brazilians in general. The evolution of income has been strongest
among the poorest families. In the last two decades, the state has universal access to education
for children 6-14 years. Has expanded access to education for children up to five years and for
young people aged 15 to 17 years - today, and more than 80% of these two public are attending
school. In 1993, 8% of adults 18 to 24 years old were enrolled in higher education, a figure that
rose to over 18% in 2012. The sewage has also been expanding rapidly and now reaches more
than 90% of the state's households. In the period, infant mortality decreased from 26.2 to 11.5
deaths per thousand live births. Life expectancy at birth from the state population increased 6.06
years, between 1993 and 2012, and 2.90 in the last ten years. In 2012, the indicator reached
75.35 years of age.
Vulnerable Population

14
The economic and social vulnerable population involve young women pregnancy,
and young men who commit crime, unemployed population an old age and infants with risk of
death and sickness. The poor urban environments contribute to this vulnerability.
Emerging economies already, present super concentrated cities, with great deficits of
services and urban infrastructures, which generate an enormous social claim for access and
minimum standards of education, housing, sanitation, and health services. The burden of these
problems became solely public, i. e. costs that the whole society has to pay, since the process of
their resolution is due to the state, while the gap between urban service provision and public
budgets tends to increase. Besides, the actual workers’ profile in industries indicate a greater
demanded for experts, many linked with maintenance, and independent merchants, contributing
for the development of a parallel informal economy.
The last clause above identifies a common feature of emerging economies. This
constitute a great number of unemployed workers, nonetheless usually working, bringing about
the so-called inferior circuit of these economies (Santos, 1979). This inferior circuit is inbuilt
into the superior formal circuit. Spatially, this inferior circuit operates, produces and occupies
large parts, or most part of cities in these countries, mostly suburban areas. This peripheral
urbanization is mainly responsible for the urban expansions with low density. This generates
higher costs of urbanization for people with lower income. The environmental result of this
dilemma may be a disaster. This is a present and future problem, about which the great
economic players and most scholars neglect.
The chart below shows the spatial concentration of jobs (in purple) in São Paulo
Metropolitan Area surrounded by vulnerable populations (increasing from yellow to red).
Environmental Dilemma
Although long known by some physicists as Kandel (2002), humanity is destroying
the biosphere, triggering climate changes. This was quite a threat to question societies versus
nature relationship that results in doubts about economic growth and, in general, about the
anthropocentrism. Recently major political and religious leaders accepted this now incontestable
fact.
In this context, the titanic forces of urbanization result in as nature main depleting
areas on a global scale, and increasing in a fast pace. Thus, Cities are key centers of depletion
and this trend appear in our model of analysis as negative “externalities”, but they really are
negative internalities.
Nonetheless, these negative “externalities” of economies of agglomeration concern:
a) impacts on the functionality of cities; and b) over the natural services (geo-physical-chemical

15
cycles). In the first case, it refers to social inequalities, besides the lack, congestion, and
obsolescence of services in cities, regarding infrastructures, city transport and sanitation (water,
sewage, drainage and wastes). In the second case, lack of vegetation, emissions, soil and water
pollution are the results.
Chart 6 Concentration of Jobs Opportunities and Vulnerable
Population in São Paulo Metropolitan Area, 2010
Source: São Paulo City General Plan, 2014.
The answer to congestion, built environment degradation and other negative
externalities has been projects of new town, garden cities, satellite cities and mega urban
projects, (sometimes new business areas), which generate new city centers, disrupting and
setting aside old city centers that have been object or urban renewal. However, these and other
ways to tackle the causes of metropolitan problems seem to transfer them further away. This is
worth examining, as a key part of the paper argument.
The Threat to Metropolitan Functionality
The São Paulo urban sprawl with about one hundred kilometer of continue urban
conurbation means an enormous impermeable land cover, which with lack of vegetation has a
series of regional environmental impacts, as lowing grown water reservoirs, creating urban
floods, besides causing a heat island effect together with emissions that affect regional and
global climate.

16
This urban sprawl has severe social and environmental consequences, caused by the
super concentration of activities in the São Paulo Metropolitan Area. Legal, irregular allotment
and scutters’ settlements run over natural reserves, and protected areas water reservoirs (Chart
_).
In the last decades, the urban land paving has triggered many floods, which has
worsen due to climate changes. IPCC reports the increase of rains in the Brazilian Southeastern
Region, that involves three states including the State of São Paulo, but the last years has been of
intense draught in São Paulo Metropolitan Area. Although, these reports also point for
disturbances on the regime of precipitations, with periods of longer draughts interposed with
periods of heavier rains. Together with deforestation, urban heat inland formation, lack of
vegetation, 24,66% into formal settlements of this Metropolitan Area (IBGE, 2010) and high
level of emissions happening there and elsewhere in other parts of the country and in the world,
are causes of these disturbances. All these disturb metropolitan functionality, and contributes to
create a building environment that cause many health problems.
Chart 7 Protected Metropolitan Areas (in green) versus Settlements of
Vulnerable Populations (increasing from yellow to red), 2014
Source: São Paulo City General Plan, 2014.
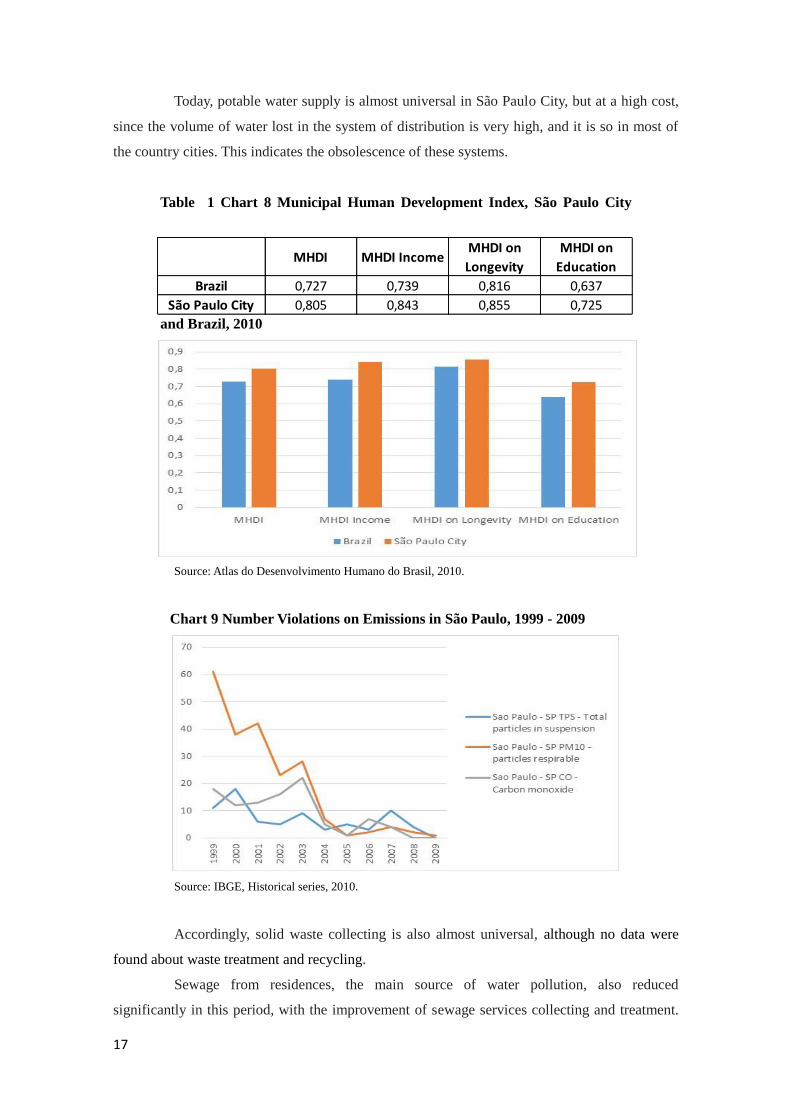
Examining the Municipal Human Development Index of São Paulo, the city presents
better standards in all components of this index, but presenting lower different on longevity,
which may suggest that the environmental conditions did not improve as much as the income
and education did (Table 1 and Chart 8).
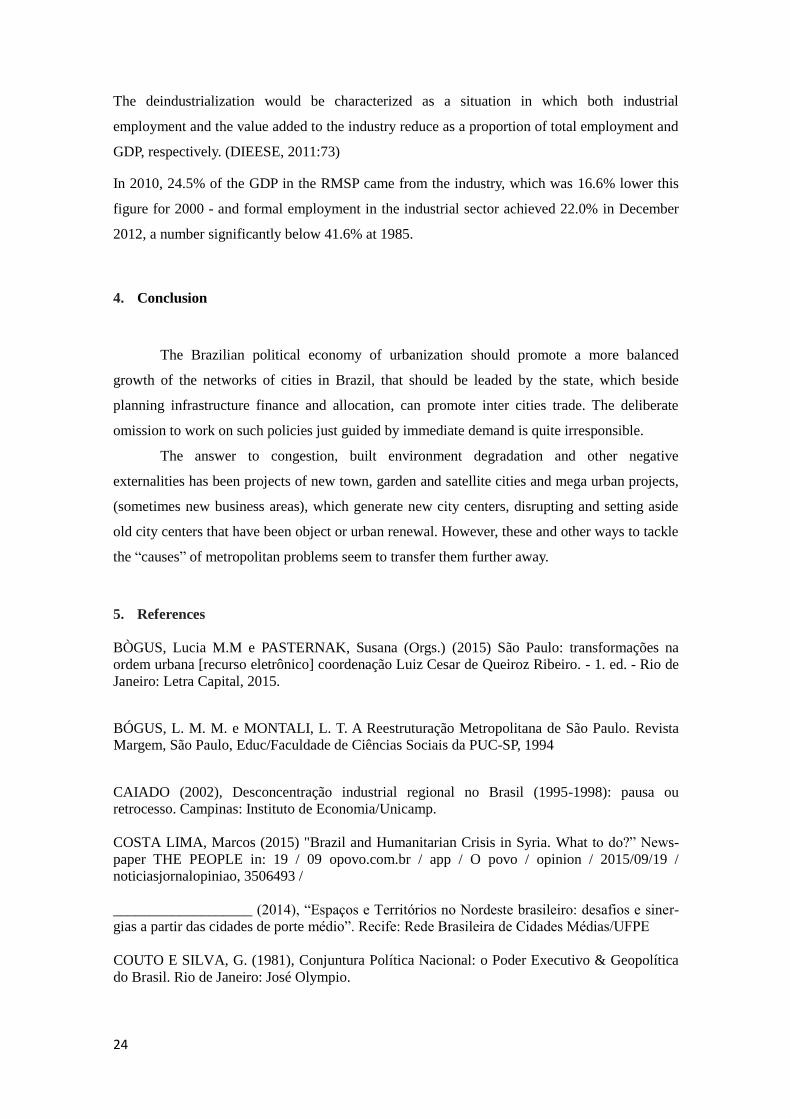
However, during last decade, violations number of the maximum acceptable levels of
emissions has dramatically reduced, as the Chart10 reveals.
17
Today, potable water supply is almost universal in São Paulo City, but at a high cost,
since the volume of water lost in the system of distribution is very high, and it is so in most of
the country cities. This indicates the obsolescence of these systems.
Table 1 Chart 8 Municipal Human Development Index, São Paulo City
and Brazil, 2010
Source: Atlas do Desenvolvimento Humano do Brasil, 2010.
Chart 9 Number Violations on Emissions in São Paulo, 1999 - 2009
Source: IBGE, Historical series, 2010.
Accordingly, solid waste collecting is also almost universal, although no data were
found about waste treatment and recycling.
Sewage from residences, the main source of water pollution, also reduced
significantly in this period, with the improvement of sewage services collecting and treatment.
MHDI MHDI IncomeMHDI on
Longevity
MHDI on
Education
Brazil 0,727 0,739 0,816 0,637
São Paulo City 0,805 0,843 0,855 0,725

18
Although, the official assessment on sewage services often do not show the real picture, which
is the worst aspect of sanitation. This is because, inadequately, the drainage system is now part
of the sewage collecting system. However, since the sewage of these pipes do not end up in
sewage treatment units, they just conduce these waters to cricks, canals, puddles and rivers. The
volume of treated sewage has increased but still far behind of the volume supplied and collected
(IBGE, 2016 & SNIS, 2016). Finally, among housing inadequacies, sewage is the most
prominent in the whole country with few exceptions.
Table 2 Housing Inadequacy with Sewage in São Paulo City and Metropolitan
Area, 2010
Territorial Unit
Total Dwellings
Inadequacy with
Sewage
Percentage of Housing
Inadequacies with
Sewage
São Paulo Metropolitan
Area 478.903 7,4%
São Paulo City 183.488 5,2% Source: Fundação João Pinheiro, 2016
The metropolitan economy in the first decade of this century
In the 2000s, there is a slight reduction in the share of the Metropolitan Region of São
Paulo – compared with the Brazilian and state GDP. Still, the MRSP continues to stand out in
the Brazilian economy. If it were a state, the region would be the largest Brazilian state, the
interior would be the second largest and third, being Rio de Janeiro. If it were a country, SPMR
would be among the 30 largest economies in the world.
The MRSP remains high concentration of the productive base of the state economy, it
accounts for 56.3% of Gross Domestic Product - state GDP in 2010 (FOUNDATION SEADE,
2013).
Table 3 Census in the MRSP, State of São Paulo and São Paulo Municipality –
2000 - 2010
Region Population Growth (%)
2000 2010
City of São Paulo 10.434.252 11.253.503 7,85
Metropolitan Region 17.878.703 19.683.975 10.09
State of São Paulo 37.032.403 41.262.199 11.42
Brasil 169.799.170 190.755.799 1.34

19
Source: SEADE Foundatio, 2015
The recent trajectory of the São Paulo metropolitan area reflects the choice of the most
technologically advanced company with greater value added coefficient of strengthening the
concentration of jobs and production in the South and Southeast of Brazil. We refer to
industries, capital intensive, electric and communications, material transport, chemical,
computer and paper, among others. For them, what counts is the proximity to consumer
markets, access to better infrastructure and the highest qualification of manpower, so the
preference is located on the outskirts of the state capital.
Chart 10 Distribution of Metropolitan GDP of São Paulo
Source :SEADE Foundation, 2015
This also serves to the service sector (such as educational and health complex) and the
wholesale trade. More traditional enterprises, labor-intensive - such as textiles, food and shoes -
run the other way, towards other regions of the state or to the country. Table nº4
Table 4 State of São Paulo and Metropolitan Areas – 2000/2010 (Share of Value Added%) Locality Added Value Added
Value GDP
Agriculture Industry Services
2000 2010 2000 2010 2000 2010 2000 2010 2000 2010
SP Metropolitan Area 2,4 1,5 52,4 46,8 59 60.8 56,1 55,6 57,3 56,3
Metropolitan Area of Cam-
pinas
3.1 1,6 8,2 9,6 7,1 7,1 7,4 7,7 6,3 7,9
Metropolitan Area of the
Paraiba Valley and North
Coast
1,8 2,4 9,7 8,0 5 5.8 6,4 5 6,5 4,9
Metropolitam Area of Santos 0,4 0,5 3,1 2,8 3,4 2,9 3,2 2,8 3,1 3,8

20
Total of Metropolitan Areas 7,6 5,9 73,5 67,2 74,4 74,6 73,2 71,2 73,2 72,9
Other Municipalities 92,4 94,1 26,5 32,8 25.6 25,4 26.8 28,8 26,8 27,1
Total 100 100 100 100 100 100 100 100 100 100
Source: Seade Foundation
Chart 11 Distribution of Value Added by Sub-sectors of Economic
Activities - State of São Paulo (in red) and Greater São Paulo (in blue) –
2010
Source: Seade Foundation
The chart above shows that the metropolitan region only exceeds the state in the
services sector.
The chart below shows that the distribution of the value added in the service sector is
79,6% in 2010, when the industrial sector is only 20,4%.
Chart 12
Distribution of Value Added by economic sectors of São Paulo in 2002-2010
Source: Seade Foundation

21
The geographer Milton Santos has woven an enlightening commentary on the
transformation of the functionality of São Paulo, to say: "Now São Paulo becomes the polar area
of Brazil, not mainly by the importance of their industry, but by being able to produce, collect,
classify information, themselves and others, and distribute and administrate them according to
their own interests. This is a new phenomenon in the geography and urbanization of Brazil".
(SANTOS, 2008, p. 59)
Contrary to the simplistic interpretations on the productive structure of the RMSP, we
understand that it has been further complicated in recent years. It is at the same time greatly
diverse and specialized. Diversified because includes virtually all productive chains. Most of its
competitiveness derives from this diversity. And it specialized in order to be Brazil's main
production center of a series of activities - including industrial. (Freire et AL. 2012 p.60)
Job market
The 1990’s is a watershed in the trajectories of the main indicators of the labor situation
in Brazil. After fifty years of gradual increase in wage labor and formal labor relations, there
was a drastic regression in the labor market, an increase of all forms of unemployment, growth
of vulnerable employment ties, falling real incomes and concentration of income (DIEESE,
2001, p. 11). The restructuring process involved also the growing precariousness of labor
relations, since the flexibility of production was accompanied by the outsourcing and
subcontracting of production and services resulting in the emergence of so-called modern
informal sectors (DEDECCA and BALTAR, 1997). Flexibility also caused, especially in the
Greater São Paulo, the contract of labor by companies without working paper or via third party
or as self-employed (DIEESE, 2001).
Chart 13 Estimates of the economically active population of the metropolitan region (in
thousand persons) - 1985-2012

22
Source: Seade Foundation
From the 1990s the generation of wealth is increasingly concentrated to the service
sector, composed of heterogeneous economic activities and with very different characteristics
when compared to the productive sector.
Industrial employment with registration or work paper, also marked by achievements of
the organization of workers in working conditions and remuneration, gradually lost ground to
autonomous occupations, temporary and / or precarious work contracts, usually linked to the
sector to provide services. (Rafael Soares Serrao, p.53)
Throughout the stages of its recent expansion, a set of processes caused changes in
employment structure in different sectors of economic activity in the RMSP, reducing industrial
jobs and, while driving, especially since the 1990s, the growth of jobs in the tertiary sector
(Dedecca, 1997).
In the next chart we can figure the impressive fall in unemployment in the Lula
government (2003-2011).
Chart 14 Overall unemployment rate of RMSP (%) - 1985-2012
Source: Seade Foundation
The employment in the service sector during the period was much higher than in
industry and commerce.
Chart 15 Employment by sector of Activity in RMSP (%) 1985-2012

23
Source: Seade Foundation
In the Table related to social-occupational categories at the Metropolitan Region of São
Paulo, call attention the growing number of higher categories, the decrease of workers in the
secondary occupation, but also the small number of workers in the agriculture sector.
Table 5 Socio-occupational Categories RMSP
Occupations 1980 1991 1992 2000 2001 2010
Leaders 1,25 1,82 2,16 1,37 2,79 1,79
Higher Education Professional 4,65 6,47 5,54 7,83 7,82 12,64
Small Employers 2,56 3,76 3,14 2,65 2,08 1,31
Higher Categories 8,46 12,05 10,84 11,85 12,69 15,74
Median Categories 36,36 40,45 32,03 28,15 29,97 28,51
Workers in the tertiary 15,13 15,86 15,19 19,34 18,75 19,01
Workers in the secondary 31,32 24,35 27,35 24.01 24.01 21,68
Workers in the tertiary non specialized 13,02 12,61 13,17 16,16 16,16 15,72
Popular Categories 59,47 52,82 55,71 59,51 58,92 56,46
Agricultural Occupations 0,81 1,03 0,87 0.51 0.51 0,61
Total 100 100 100 100 100 100
Source: Seade Foundation
Deindustrialization
24
The deindustrialization would be characterized as a situation in which both industrial
employment and the value added to the industry reduce as a proportion of total employment and
GDP, respectively. (DIEESE, 2011:73)
In 2010, 24.5% of the GDP in the RMSP came from the industry, which was 16.6% lower this
figure for 2000 - and formal employment in the industrial sector achieved 22.0% in December
2012, a number significantly below 41.6% at 1985.
4. Conclusion
The Brazilian political economy of urbanization should promote a more balanced
growth of the networks of cities in Brazil, that should be leaded by the state, which beside
planning infrastructure finance and allocation, can promote inter cities trade. The deliberate
omission to work on such policies just guided by immediate demand is quite irresponsible.
The answer to congestion, built environment degradation and other negative
externalities has been projects of new town, garden and satellite cities and mega urban projects,
(sometimes new business areas), which generate new city centers, disrupting and setting aside
old city centers that have been object or urban renewal. However, these and other ways to tackle
the “causes” of metropolitan problems seem to transfer them further away.
5. References
BÒGUS, Lucia M.M e PASTERNAK, Susana (Orgs.) (2015) São Paulo: transformações na
ordem urbana [recurso eletrônico] coordenação Luiz Cesar de Queiroz Ribeiro. - 1. ed. - Rio de
Janeiro: Letra Capital, 2015.
BÓGUS, L. M. M. e MONTALI, L. T. A Reestruturação Metropolitana de São Paulo. Revista
Margem, São Paulo, Educ/Faculdade de Ciências Sociais da PUC-SP, 1994
CAIADO (2002), Desconcentração industrial regional no Brasil (1995-1998): pausa ou
retrocesso. Campinas: Instituto de Economia/Unicamp.
COSTA LIMA, Marcos (2015) "Brazil and Humanitarian Crisis in Syria. What to do?” News-
paper THE PEOPLE in: 19 / 09 opovo.com.br / app / O povo / opinion / 2015/09/19 /
noticiasjornalopiniao, 3506493 /
___________________ (2014), “Espaços e Territórios no Nordeste brasileiro: desafios e siner-
gias a partir das cidades de porte médio”. Recife: Rede Brasileira de Cidades Médias/UFPE
COUTO E SILVA, G. (1981), Conjuntura Política Nacional: o Poder Executivo & Geopolítica
do Brasil. Rio de Janeiro: José Olympio.
25
DEDECCA, C. S. e BALTAR, P. E. Precariedade ocupacional e relações de trabalho no Brasil
nos anos 90. In: XXI CONGRESSO DA ASSOCIAÇÃO LATINO-AMERICANA DE
SOCIOLOGIA, São Paulo, 1997.
DIEESE. A situação do mercado no Brasil na primeira década dos anos 2000. São Paulo, 2012.
_______. Desindustrialização: conceito e a situação do Brasil. Nota Técnica Número 100, jun.
2011. Disponível em: http://www.dieese.org.br/notatecnica/2011/ notaTec100Desindustrializa-
cao.pdf.
FIX, M. (2007), São Paulo Cidade Global: fenômenos financeiros de uma miragem. São Paulo:
Bomtempo.
FREIRE, C. T.; ABDAL e BESSA V. “Conhecimento e Tecnologia: atividades industriais e de
serviços para uma São Paulo competitiva”. In: Comin, A. et Al (Orgs.): Metamorfoses paulista-
nas. Atlas geoeconômico da Cidade de São Paulo: SMDU/CE/BRAP/UNESP/Imprensa oficial
do estado de São Paulo, 2012 p.60.
FUNDAÇÂO SEADE
GASPAR, Ricardo Carlos; Aparício A.C P; Bessa, Vagner de C. (2015) “A Metrópole de São
Paulo: desenvolvimento econômico recente e configuração interna” In: BÒGUS, Lucia M.M e
PASTERNAK, Susana (Orgs.)(2015), São Paulo: transformações na ordem urbana [recurso
eletrônico] coordenação Luiz Cesar de Queiroz Ribeiro. - 1. ed. - Rio de Janeiro: Letra Capital,
2015 (p.28).
GLAESER, Edward (2011), The Triumph of the city. Nova York: Mac Milan, p.7.
GOVERNO DO ESTADO DE SÃO PAULO, Plano de Ação da Macro Metrópole Paulista – PAM
2013/2040, referência para o Plano de Desenvolvimento Urbano Integrado da Região
Metropolitana de São Paulo – PDUI, outubro de 2015.
GUERRA, Isabel, Prefácio. In: A Cidade na Encruzilhada. Repensar a cidade a sua política.
Porto: Edições Afrontamento.
HARVEY, David Cidades Rebeldes. Do direito à cidade à revolução urbana. São Paulo: Mar-
tins Fontes, p.134.
HOA, L. (1981), Reconstruire la China: trente ans d’urbanisme, 1949-1979. Paris: Moniteur.
IPEA, Brasil em Desenvolvimento: estado, Planejamento e Políticas Públicas. Brasília: Institu-
to de pesquisa Econômica Aplicada, 2009, p. 402).
IBGE, Censo, 2010
JUCÁ, A. (2013), Urbanização e Sustentabilidade: Conceitos, Modelos e Métodos. Berlin: No-
vas Edições Acadêmicas
KANDEL, R. (2002), Le Réchauffement Climatic. Paris: Presses Universitaires de France.
KRUGMAN et al. (2002), Economia Espacial. São Paulo: Futura.
26
MARICATO, Ermínia (2015), Para entendera Crise Urbana. São Paulo: Expressão Popular,
p.68.
___________________ (2013), “Cidades no Brasil: neodesenvolvimentismo ou crescimento
periférico. In: novo.fpabramo.org.br/sites/.../erminia-brasil_cidades-_paper_h._2012-_2013-
1.pdf
_____ (2010), “The statute of the Peripheral City”. In: Carvalho, Celso Santos e Rossbach, A-
naclaudia. (Org.). The city statute of Brazil: a commentary. 1 ed. São Paulo: Ministério das Ci-
dades e Aliança de Cidades.
MONTALI, Lilia e LIMA, Marcelo Tavares de (2015) “ Família, trabalho e renda: mudanças na
primeira década do século XXI”. In: BÒGUS, Lucia M.M e PASTERNAK, Susana (Orgs.)
(2015) São Paulo: transformações na ordem urbana [recurso eletrônico] coordenação Luiz
Cesar de Queiroz Ribeiro. - 1. ed. - Rio de Janeiro: Letra Capital, 2015, p. 158.
OSTROM, Elinor (1990), Governing the Commons: The evolution of Institutions for Collective
Action: Cambridge: Cambridge University Press.
PASTERNAK, Suzana; BÓGUS, Lúcia M.M. (2015), “Mudanças recentes na estruturação so-
cioespacial da Região Metropolitana de São Paulo”. In: BÒGUS, Lucia M.M e PASTERNAK,
Susana (Orgs.) (2015) São Paulo: transformações na ordem urbana [recurso eletrônico] coor-
denação Luiz Cesar de Queiroz Ribeiro. - 1. ed. - Rio de Janeiro: Letra Capital.
PREFEITURA MUNICIPAL DE SÃO PAULO (2007), Histórico Demográfico Do Município
De São Paulo. Prefeitura.Sp.Gov.Br
PREFEITURA MUNICIPAL DE SÃO PAULO, Plano Diretor de São Paulo – SP, 2014.
SANTOS, Milton (1979), O Espaço Dividido: os dois circuitos da economia urbana dos países
subdesenvolvidos. Rio de Janeiro: Francisco Alves Editora
_______________ (2008), A Urbanização Brasileira. São Paulo: Edusp.
SHERMAN, H. J. (1991), The Business Cycle. Oxford: Princeton University Press.
SEIXAS, João (2013) A Cidade na Encruzilhada. Repensar a cidade a sua política. Porto:
Edições Afrontamento
SERRÃO, Rafael Soares; Dias, João M P. (2015) “Metrópole de São Paulo na transição
econômica: estrutura produtiva e mercado de trabalho” In: BÒGUS, Lucia M.M e
PASTERNAK, Suzana (Orgs.) (2015) São Paulo: transformações na ordem urbana [recurso
eletrônico] coordenação Luiz Cesar de Queiroz Ribeiro. - 1. ed. - Rio de Janeiro: Letra Capital,
2015, p. 53.
SINGER, Paul (2002), Introdução à Economia solidária. São Paulo: contexto.
SINGER, Paul (2002), Economia Política da Urbanização São Paulo: editora Perseu Abramo
UNU (2014), World Urbanization Prospects. The 2014 Revision. New York: United Nations

27
WORLD BANK, 2015, Relatório do banco Mundial para 2015. Washington, DC 2015) São
Paulo: transformações na ordem urbana [recurso eletrônico] coordenação Luiz Cesar de Queiroz
Ribeiro. - 1. ed. - Rio de Janeiro: Letra Capital, 2015.