The methods for determining the CTOD at crack initiation
6
116 INŻYNIERIA MATERIAŁOWA MATERIALS ENGINEERING ROK XXXIX The methods for determining the CTOD at crack initiation Ihor Dzioba 1 , Piotr Furmańczyk 2* , Sebastian Lipiec 1 1 Department of Machine Design, Faculty of Mechatronics and Mechanical Engineering, Kielce University of Technology, Poland, 2 Department of Metal Science and Manufacturing Processes, Faculty of Mechatronics and Mechanical Engineering, Kielce University of Technology, Poland; *[email protected] The crack tip opening displacement (CTOD), just like J integral, is a parameter characterising the fracture toughness of materials. The CTOD values are typically determined at subcritical crack initiation, δ Ti , or at 0.2 mm subcritical crack extension, δ TC . The procedure for measuring δ TC is described in detail in ASTM 1820. Measuring δ Ti is far more complicated and requires specialised apparatus and trained operators. The aim of this study was to assess the ca- pability of different methods used for determining the value of δ Ti . The results from the experiments were compared with those from numerical calculations, obtaining good agreement between δ Ti data determined by the methods applied. The CTOD was measured on SENB (single-edge-notch-bend) specimens made of S355JR steel subjected to laboratory based heat treatment. The tests were performed at temperature in the range –80°C to 20°C, which allowed assessing the impact of reduced temperature on the δ Ti level. Key words: crack tip opening displacement, fracture toughness, S355JR steel. Inżynieria Materiałowa 3 (223) (2018) 116÷121 DOI 10.15199/28.2018.3.5 MATERIALS ENGINEERING 1. INTRODUCTION The process of subcritical crack growth under a monotonically in- creasing load in an elastic-plastic material comprises three stages — crack tip blunting, subcritical crack initiation and crack propaga- tion [1]. Determination the moment of initial subcritical crack in components (or specimens) under loading is problematic. A lot of attention has been devoted to predicting the critical value of fracture toughness in elastic-plastic materials in fracture mechanics tasks. A some of methods have been developed and standardized in rel- evant specifications, with the most popular being based on the criti- cal value of J-integral — J IC, or on the critical value of crack tip opening, δ TC [2]. These quantities define the fracture toughness of a material at a chosen point when the average value of subcritical crack growth is 0.2 mm. The fracture toughness at subcritical crack initiation can be de- termined by measuring the geometry of the blunted crack tip, as proposed by Shih [3] (Fig. 1). The blunting of a primary sharp crack tip proceeds until subcritical crack initiation, and the radius of the blunted crack is dependent on the strength and plastic properties of the material. The assumptions of Shih’s model can be used for calculation of the crack tip opening displacement at crack initiation by measuring the stretch zone width (SZW), ∆a SZWi : d Ti = 2∙∆a SZWi (1) The blunting crack tip at moment according to start subcrack are shown in Figure 1. The view presented the situation in a axis plane of single edge notched bend specimen (SENB) which loading was stopped at subcritical crack initiation moment. The photography was made by scanning electron microscope (SEM). Shih proposed the relationship for calculating the J-integral val- ue from the CTOD according to formula [3]: J = (σ Y /d n )∙δ T (2) where: d n – function dependent on the strength properties of the material and on the stress state ahead of the crack front [4], σ Y = 0.5(σ YS + σ UTS ), σ YS – yield stress, σ UTS – ultimate tensile strength, δ T – crack tip opening displacement. This paper reports the results of the study carried out to deter- mine the crack tip opening displacement at subcritical crack ini- tiation, δ Ti . Test temperature ranged from –80°C to 20°C to cover different properties of the test material. The using various experi- mental methods and FEM (finite element method) calculation let possibility compared the results. The value of CTOD at the start of subcritical crack, δ Ti , (and according value of J-integral, J i ) can be determined by the stretch zone width (∆a SZW ). This method was first proposed by Japanese researchers and then standardised [5]. European guidelines for the same method are set forth in ISO–12135:2016 [6] and ESIS (Eu- ropean Structural Integrity Society) and GKSS (GKSS-Forschung- szentrum, Geesthacht) recommendations [7, 8], with a requirement that the fracture surfaces should be examined in the scanning elec- tron microscope (SEM). Fig. 1. View of blunted crack tip at moment of subcrack start; SEM Rys. 1. Widok stępienia pęknięcia w chwili startu pęknięcia podkrytycz- nego; SEM
Transcript of The methods for determining the CTOD at crack initiation

116 INŻYNIERIA MATERIAŁOWA MATERIALS ENGINEERING ROK XXXIX
The methods for determining the CTOD at crack initiationIhor Dzioba1, Piotr Furmańczyk2*, Sebastian Lipiec1
1Department of Machine Design, Faculty of Mechatronics and Mechanical Engineering, Kielce University of Technology, Poland, 2Department of Metal Science and Manufacturing Processes, Faculty of Mechatronics and Mechanical Engineering,
Kielce University of Technology, Poland; *[email protected]
The crack tip opening displacement (CTOD), just like J integral, is a parameter characterising the fracture toughness of materials. The CTOD values are typically determined at subcritical crack initiation, δTi, or at 0.2 mm subcritical crack extension, δTC. The procedure for measuring δTC is described in detail in ASTM 1820. Measuring δTi is far more complicated and requires specialised apparatus and trained operators. The aim of this study was to assess the ca-pability of different methods used for determining the value of δTi. The results from the experiments were compared with those from numerical calculations, obtaining good agreement between δTi data determined by the methods applied. The CTOD was measured on SENB (single-edge-notch-bend) specimens made of S355JR steel subjected to laboratory based heat treatment. The tests were performed at temperature in the range –80°C to 20°C, which allowed assessing the impact of reduced temperature on the δTi level.
Key words: crack tip opening displacement, fracture toughness, S355JR steel.
Inżynieria Materiałowa 3 (223) (2018) 116÷121DOI 10.15199/28.2018.3.5
MATERIALS ENGINEERING
1. INTRODUCTION
The process of subcritical crack growth under a monotonically in-creasing load in an elastic-plastic material comprises three stages — crack tip blunting, subcritical crack initiation and crack propaga-tion [1]. Determination the moment of initial subcritical crack in components (or specimens) under loading is problematic. A lot of attention has been devoted to predicting the critical value of fracture toughness in elastic-plastic materials in fracture mechanics tasks. A some of methods have been developed and standardized in rel-evant specifications, with the most popular being based on the criti-cal value of J-integral — JIC, or on the critical value of crack tip opening, δTC [2]. These quantities define the fracture toughness of a material at a chosen point when the average value of subcritical crack growth is 0.2 mm.
The fracture toughness at subcritical crack initiation can be de-termined by measuring the geometry of the blunted crack tip, as proposed by Shih [3] (Fig. 1). The blunting of a primary sharp crack tip proceeds until subcritical crack initiation, and the radius of the blunted crack is dependent on the strength and plastic properties of the material. The assumptions of Shih’s model can be used for calculation of the crack tip opening displacement at crack initiation by measuring the stretch zone width (SZW), ∆aSZWi:
dTi = 2∙∆aSZWi (1)
The blunting crack tip at moment according to start subcrack are shown in Figure 1. The view presented the situation in a axis plane of single edge notched bend specimen (SENB) which loading was stopped at subcritical crack initiation moment. The photography was made by scanning electron microscope (SEM).
Shih proposed the relationship for calculating the J-integral val-ue from the CTOD according to formula [3]:
J = (σY/dn)∙δT (2)
where: dn – function dependent on the strength properties of the material and on the stress state ahead of the crack front [4], σY = 0.5(σYS + σUTS), σYS – yield stress, σUTS – ultimate tensile strength, δT – crack tip opening displacement.
This paper reports the results of the study carried out to deter-mine the crack tip opening displacement at subcritical crack ini-tiation, δTi. Test temperature ranged from –80°C to 20°C to cover different properties of the test material. The using various experi-mental methods and FEM (finite element method) calculation let possibility compared the results.
The value of CTOD at the start of subcritical crack, δTi, (and according value of J-integral, Ji) can be determined by the stretch zone width (∆aSZW). This method was first proposed by Japanese researchers and then standardised [5]. European guidelines for the same method are set forth in ISO–12135:2016 [6] and ESIS (Eu-ropean Structural Integrity Society) and GKSS (GKSS-Forschung-szentrum, Geesthacht) recommendations [7, 8], with a requirement that the fracture surfaces should be examined in the scanning elec-tron microscope (SEM).
Fig. 1. View of blunted crack tip at moment of subcrack start; SEM Rys. 1. Widok stępienia pęknięcia w chwili startu pęknięcia podkrytycz-nego; SEM

NR 3/2018 INŻYNIERIA MATERIAŁOWA MATERIALS ENGINEERING 117
2. MATERIAL AND METHODS
The test material was a S355JR (former 18G2A) steel wide used for weldable structural applications, such as tanks and pressure pipes [9]. Laboratory heat treatment were performed for uniform microstructure in tested specimen: heat and annealing at 950°C for 20 minutes and cooled in air and next annealing at 600°C for 150 hours and cooled in oil. This heat treatment regime provided the S355JR steel with ferritic microstructure containing coagulated car-bide particle (FC) (Fig. 2). A similar type of microstructure can be observed in heat affected zones of S355JR steel welded elements or in the components after long-term service under elevated tempera-ture [10÷12].
In order to determine the strength characteristics of S355JR of FC steel, the uniaxial tensile tests were performed on standard cy-lindrical specimens (d0 = 5 mm, L0 = 25 mm) [13]. The relation-ships of the true stress, σt = σn(1 + εn), as a function of logarithmic strains, εt = ln(1 + εn), were determined (Fig. 3). These relationships are required for material definition during modelling and numeri-cal calculations. The strength characteristics determined from σt–εt relationships are given in Table 1.
The crack tip opening displacement was measured on single edge notched bend specimens, SENB, (W = 24 mm, S = 96 mm, B = 12 mm, a0/W ≈ 0.55). Signals of force (F), crack opening at the specimen edge (uCOD) and deflection at the loading point (uF) were recorded during the loading process at current time. Based on the recorded signals, the critical values of the crack tip opening δTC and J integral — JIC were calculated according to ASTM E1820
procedures [2]. The values of crack tip opening displacement at subcritical crack initiation, δTi, were determined from the SENB fracture surfaces using the JOEL scanning electron microscope and the HIROX profilometer. During the FEM loading simulation and δTi calculation the magnitude of the specimen deflection, uFi, cor-responded to the value of the integral Ji.
3. NUMERICAL CALCULATIONS
The finite element program ABAQUS (version 6.12) [14] was used to simulate the loading process of tested SENB specimens. Because of the symmetry of the problem, the numerical model as-sumed a quarter SENB model (Fig. 4a). The crack opening tip was modelled as an arc of 0.012 mm radius. The specimen was divided into 12 layers in the through-thickness direction. In calculations, 8-node three-dimensional finite elements were used. The density of the finite elements was increased with decreasing distance to the crack tip.
An important aspect of numerical simulations is the proper defi-nition of the material model introduced into the program. True ten-sile curves need to be properly developed based on experimental data from tensile test. The elastic part of the material is defined by two quantities: Young’s modulus, E, and Poisson’s ratio, ν. The part with plastic hardening is described by pairs of true strain–stress points in range from the yield stress point to the ultimate strength point. For highly plastic materials, such as S355JR steel, the de-scription of the material beyond the strain corresponding to the ulti-mate strength on the tensile curve is problematic. In this calculation, the true stress–strain curve was interpolated to 3 mm/mm of strain, using a linear approximation of the last 150÷200 points from the curve.
In numerical calculations, displacement applied on the upper roller corresponded in value to the moment of subcritical crack ini-tiation. The CTOD was measured on SENB specimens at the points shown schematically in Figure 4b. The measurements were made with a step of 0.5 mm, from the specimen axis plane (layer 0) to a distance of 6 mm (to the side face of the modelled SENB speci-men). The FEM calculated CTOD values are given in Table 2. The data shows that almost the same level of CTOD is maintained in the centre of the specimen up to ~2.5 mm from its plane of sym-metry. A gradual decrease of the CTOD values were observed with decreasing distance to the side face of the specimen.
– Fig. 2. Ferrite microstructure of S355JR steel with coagulated car-bides; SEMRys. 2. Mikrostruktura ferrytyczna stali S355JR ze skoagulowanymi cząstkami węglików; SEM
Table 1. Mechanical properties of S355JR FC steel at various tem-peratureTabela 1. Właściwości wytrzymałościowe stali S355JR w różnej tempe-raturze
Mechanical propertiesTest temperature
+20°C –50°C –80°C
E, GPa 211 216 218
σLYS, MPaσUYS, MPa
380.26392.73
378.58379.98
420.80458.40
σUTS, MPa 588.45 626.29 626.32
n 4.92 4.37 4.15
v 0.3 0.3 0.3
Fig. 3. The graphs of true σt–εt relations of S355JR FC steel at test temperatureRys. 3. Wykresy rzeczywiste σt–εt stali S355JR w różnej temperaturze ba-dań
118 INŻYNIERIA MATERIAŁOWA MATERIALS ENGINEERING ROK XXXIX
a)
b)
a)
b)
Fig. 4. The FEM model of ¼ part SENB specimen (a) and scheme of CTOD, δT, measurement (b)Rys. 4. Model MES próbki SENB (a) oraz schemat pomiaru RWP, δT, (b)
Table 2. The FEM results of δTi measurement Tabela 2. Wyniki pomiarów wartości δTi na podstawie MES
T, °C
Distance from the axis plane, mm
0 0.5 1.0 1.5 2.5 3.5 4.5 5.5
δTi values, μm
+20°C 265 258 261 260 255 219 182 146
–50°C 96 98 102 100 95.6 82.9 71 46.7
–80°C 39 39 39 38.5 38.1 36.8 33 22
4. MEASUREMENTS OF THE STRETCH ZONE WIDTH To determine the critical values of fracture toughness characteristics at the moment of subcritical crack initiation, CTOD — δTi and J in-tegral — Ji, the measurement of the stretch zone width ∆aSZW should be performed. The measurement was made on fracture surface of tested SENB specimen used to determine the critical values of frac-ture toughness, δTC and JIC in accordance with ASTM E1820 [2].
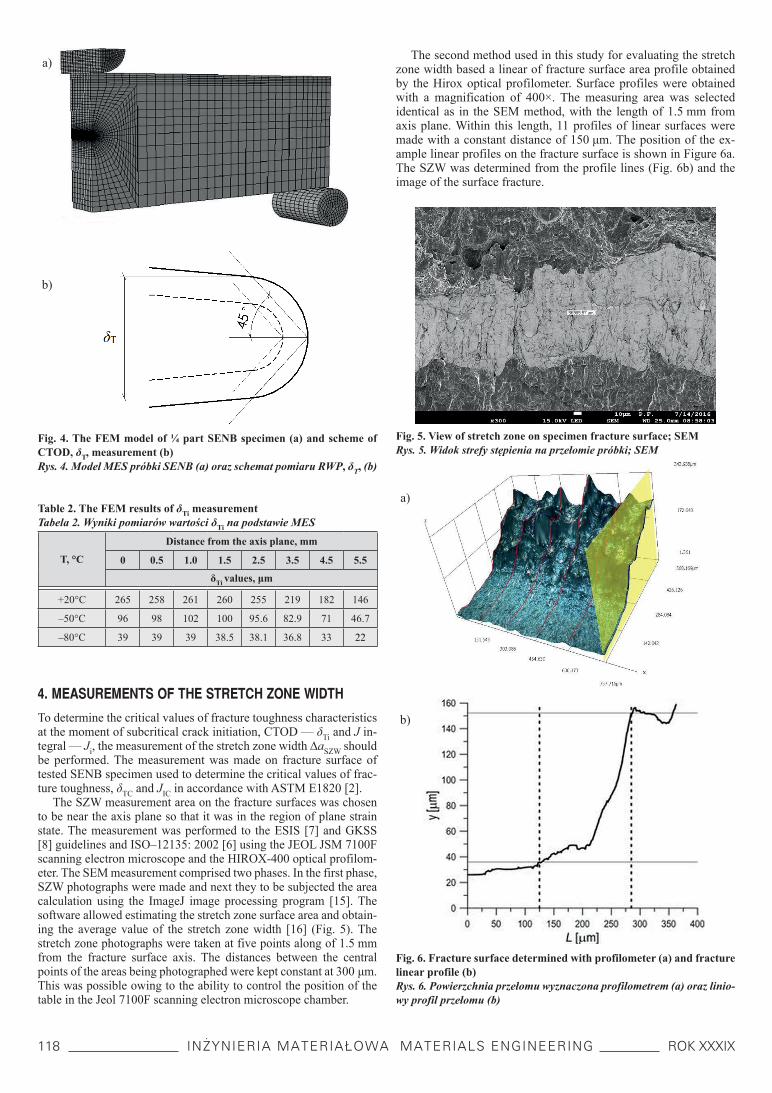
The SZW measurement area on the fracture surfaces was chosen to be near the axis plane so that it was in the region of plane strain state. The measurement was performed to the ESIS [7] and GKSS [8] guidelines and ISO–12135: 2002 [6] using the JEOL JSM 7100F scanning electron microscope and the HIROX-400 optical profilom-eter. The SEM measurement comprised two phases. In the first phase, SZW photographs were made and next they to be subjected the area calculation using the ImageJ image processing program [15]. The software allowed estimating the stretch zone surface area and obtain-ing the average value of the stretch zone width [16] (Fig. 5). The stretch zone photographs were taken at five points along of 1.5 mm from the fracture surface axis. The distances between the central points of the areas being photographed were kept constant at 300 μm. This was possible owing to the ability to control the position of the table in the Jeol 7100F scanning electron microscope chamber.
Fig. 5. View of stretch zone on specimen fracture surface; SEMRys. 5. Widok strefy stępienia na przełomie próbki; SEM
a)
b)
a)
b)
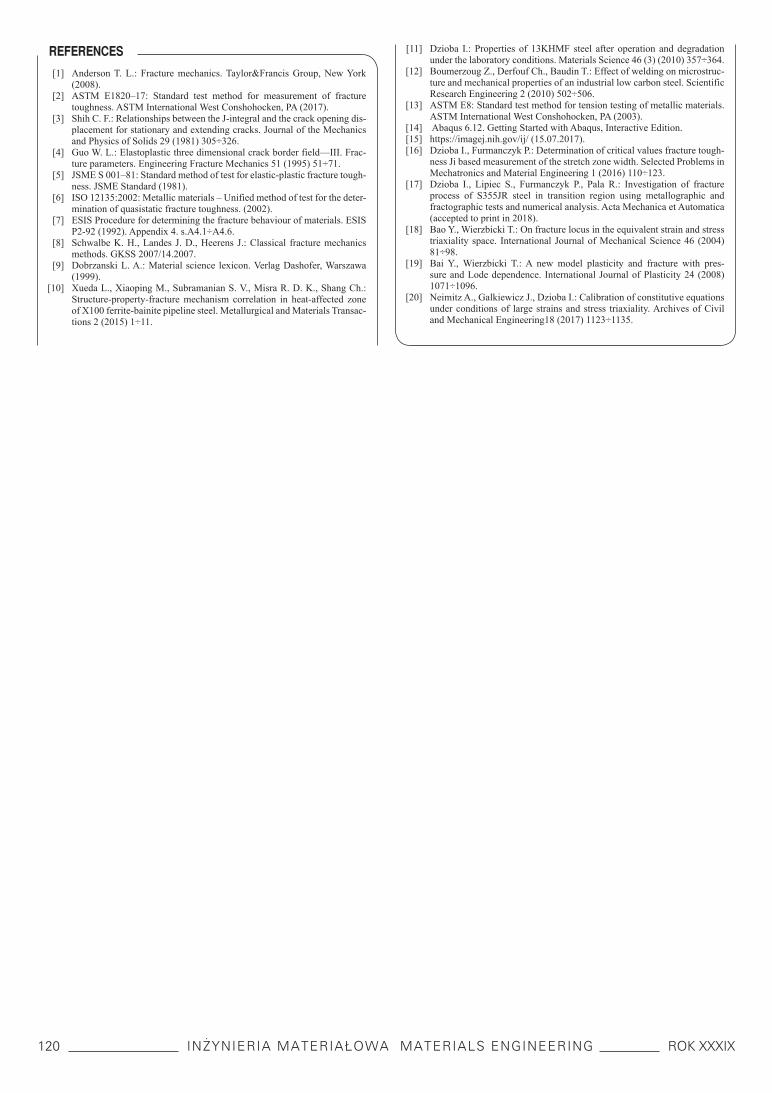
Fig. 6. Fracture surface determined with profilometer (a) and fracture linear profile (b)Rys. 6. Powierzchnia przełomu wyznaczona profilometrem (a) oraz linio-wy profil przełomu (b)
The second method used in this study for evaluating the stretch zone width based a linear of fracture surface area profile obtained by the Hirox optical profilometer. Surface profiles were obtained with a magnification of 400×. The measuring area was selected identical as in the SEM method, with the length of 1.5 mm from axis plane. Within this length, 11 profiles of linear surfaces were made with a constant distance of 150 μm. The position of the ex-ample linear profiles on the fracture surface is shown in Figure 6a. The SZW was determined from the profile lines (Fig. 6b) and the image of the surface fracture.
a)
a)
b)
b)

NR 3/2018 INŻYNIERIA MATERIAŁOWA MATERIALS ENGINEERING 119
The SZW measurement results for tested specimens based on SEM and Hirox equipment are presented in Table 3.
In the Figure 7 as example are shown the results of δTi obtained by SEM, Hirox measurements and FEM calculation in interval from axis plane to 1500 μm. The FEM calculated δTi values within this section of the specimen have almost constant levels. The results based on Hirox profilometer characteristics highest random of data. Average δTi value received by Hirox measurement and by FEM cal-culation are similar. Some lower δTi values obtained based on SEM photographs. These differences can explained some difficulties in fixing of accurate SZW dimensions. The scattered values of δTi ob-served in the methods based on SZW measurements result from the non-uniformity of the fracture surface microrelief due to the hetero-geneity of microstructure morphology, composed of layers of ferrite grains and ferrite grains with particles of coagulated pearlite, and the difficulty determining the boundaries of the stretch zone.
Unfortunately, these methods depend on the accuracy and expe-rience of the operator performing the measurements. The results ob-tained by FEM calculation are nearly stable data to the assumed ma-terial model. For all methods the δTi values decrease with increase distance from axis plane of specimen. With the lowering of the test temperature the δTi values decrease regardless of the method used.
5. SUMMARY
The fracture process in component of elastic-plastic material is complicated. In each of component before of crack tip at the same time are presented different stress states: plane strain, in central part; plane stress, in side; and mixed state. Participation of each states depends of material properties and size of components. Be-cause the results of CTOD received of measurements in central part of specimens will be higher than ones from further regions. A dif-ference between level of δTi depends of plasticity of material. The difference of δT values measured in central part and near side plane of specimen decrease with decreasing plasticity, and respectively decrease with temperature lowering [17].
The average critical values of CTOD obtained at different meth-ods using are listed in Table 4. You can sawn some random of pre-sented results. These differences are consequences of various pro-cedures using for assessed critical values of CTOD. Reasons about objective and subjective courses that impacts on δTi results during its assess by SEM and Hirox profilometer equipment’s are given in previous chapter. Nonetheless the methods based on testing SZW allows obtained the δTi values in concrete places along crack front. First subcrack initiate in the central part before of pre-crack of specimen, and respectively the δTi are highest among other received values along a crack front. Result of δTi directly according to Shih model (Fig. 1) obtained as single in axis plane. In next parallel plane the value of could be little different.
The ASTM E1820 procedure gives possible estimated CTOD value at 0.2 mm subcritical crack extension, δTC. According to the ASTM E1820 procedure δTC are determined basing on data of crack mouth displacement (uCOD), which represented some average value along specimen thickness. Therefore δTC value for high plastic ma-terial would be lower than data δTi obtained of measurement made in central part of specimen. The temperature decrease lead to ma-terial plasticity decreasing, when δTC value could be some higher than δTi.
The using FEM method and numerical simulation for δTi evalu-ate seems most promising. Due unified material using in model we eliminate data random occurring in SEM and Hirox profilometer measurement. The FEM allows obtain δTi in each points along a crack profile. However, the drawbacks of FEM methods of δTi calculation are some simplifications in modelling. First simplifica-tion — is modelling of crack front as straight line, when one has arc-shape profile. Second simplification concerns taking into ac-count influence of parameters Lode and three-dimensional stress state on material modelling [18÷20]. Consideration of this factors would allowed increased accuracy of obtained results.
ACKNOWLEDGEMENTS
The work was performed as part of research projects: 01.0.06.00/2.01.01.02.0020 MNSC.MKTK.16.004; 01.0.08.00/ 2.01.01.02.0021 MNSC.MKPK.16.002 and 01.0.08.00/ 2.01.01.01.0008 MNSP.MKPK.16.001.
Table 3. The δTi values determined by SEM and Hirox methods mea-surementsTabela 3. Wyniki pomiarów δTi wykonanych za pomocą mikroskopu (SEM) oraz profilometru (Hirox)
T
°CMeasurement
method’s
Distance from the axis plane, μm
0 300 600 900 1200 1500
δTi values, μm
+20°CSEM 285.58 231.54 205.12 209.60 201.42 190.24
HIROX 257.78 303.30 265.38 236.80 279.60 286.20
–50°CSEM 72.84 77.06 75.38 87.20 58.06 53.30
HIROX 121.32 89.08 101.40 117.50 90.04 112.78
–80°CSEM 25.06 24.60 14.36 26.92 19.12 20.42
HIROX 28.43 39.80 34.12 35.07 25.58 32.22
Fig. 7. The data of δTi values calculated by MES and measured by SEM, HIROX methods along front of the crack for testing tempera-ture +20°CRys. 7. Wartości δTi wyznaczane za pomocą MES, mierzone na mikro-skopie (SEM) oraz profilometrze (Hirox) wzdłuż frontu pęknięcia, tem-peratura +20°C
Table 4. The average critical values of δTi obtained according to the different test methods Tabela 4. Średnie wartości RWP δTi uzyskane przy wyznaczaniu różnymi metodami badawczymi
T °C
δTi, μm δTC, μm
Shih SEM_1.5 Hirox_1.5 MES_1.5 MES_6.0 ASTM_all
20°C 220 226.66 250.28 261 230.7 197
–50°C — 73.98 101.12 99.5 86.5 158
–80°C — 22.02 34.66 39 35.7 43
120 INŻYNIERIA MATERIAŁOWA MATERIALS ENGINEERING ROK XXXIX
REFERENCES
[1] Anderson T. L.: Fracture mechanics. Taylor&Francis Group, New York (2008).
[2] ASTM E1820–17: Standard test method for measurement of fracture toughness. ASTM International West Conshohocken, PA (2017).
[3] Shih C. F.: Relationships between the J-integral and the crack opening dis-placement for stationary and extending cracks. Journal of the Mechanics and Physics of Solids 29 (1981) 305÷326.
[4] Guo W. L.: Elastoplastic three dimensional crack border field—III. Frac-ture parameters. Engineering Fracture Mechanics 51 (1995) 51÷71.
[5] JSME S 001–81: Standard method of test for elastic-plastic fracture tough-ness. JSME Standard (1981).
[6] ISO 12135:2002: Metallic materials – Unified method of test for the deter-mination of quasistatic fracture toughness. (2002).
[7] ESIS Procedure for determining the fracture behaviour of materials. ESIS P2-92 (1992). Appendix 4. s.A4.1÷A4.6.
[8] Schwalbe K. H., Landes J. D., Heerens J.: Classical fracture mechanics methods. GKSS 2007/14.2007.
[9] Dobrzanski L. A.: Material science lexicon. Verlag Dashofer, Warszawa (1999).
[10] Xueda L., Xiaoping M., Subramanian S. V., Misra R. D. K., Shang Ch.: Structure-property-fracture mechanism correlation in heat-affected zone of X100 ferrite-bainite pipeline steel. Metallurgical and Materials Transac-tions 2 (2015) 1÷11.
[11] Dzioba I.: Properties of 13KHMF steel after operation and degradation under the laboratory conditions. Materials Science 46 (3) (2010) 357÷364.
[12] Boumerzoug Z., Derfouf Ch., Baudin T.: Effect of welding on microstruc-ture and mechanical properties of an industrial low carbon steel. Scientific Research Engineering 2 (2010) 502÷506.
[13] ASTM E8: Standard test method for tension testing of metallic materials. ASTM International West Conshohocken, PA (2003).
[14] Abaqus 6.12. Getting Started with Abaqus, Interactive Edition.[15] https://imagej.nih.gov/ij/ (15.07.2017).[16] Dzioba I., Furmanczyk P.: Determination of critical values fracture tough-
ness Ji based measurement of the stretch zone width. Selected Problems in Mechatronics and Material Engineering 1 (2016) 110÷123.
[17] Dzioba I., Lipiec S., Furmanczyk P., Pala R.: Investigation of fracture process of S355JR steel in transition region using metallographic and fractographic tests and numerical analysis. Acta Mechanica et Automatica (accepted to print in 2018).
[18] Bao Y., Wierzbicki T.: On fracture locus in the equivalent strain and stress triaxiality space. International Journal of Mechanical Science 46 (2004) 81÷98.
[19] Bai Y., Wierzbicki T.: A new model plasticity and fracture with pres-sure and Lode dependence. International Journal of Plasticity 24 (2008) 1071÷1096.
[20] Neimitz A., Galkiewicz J., Dzioba I.: Calibration of constitutive equations under conditions of large strains and stress triaxiality. Archives of Civil and Mechanical Engineering18 (2017) 1123÷1135.
NR 3/2018 INŻYNIERIA MATERIAŁOWA MATERIALS ENGINEERING 121
Metody wyznaczania rozwarcia wierzchołka CTOD podczas inicjacji pęknięcia
Ihor Dzioba1, Piotr Furmańczyk2*, Sebastian Lipiec1 1Politechnika Świętokrzyska w Kielcach, Wydział Mechatroniki i Budowy Maszyn, Katedra Podstaw Konstrukcji Maszyn, Kielce, Polska,
2Politechnika Świętokrzyska w Kielcach, Wydział Mechatroniki i Budowy Maszyn, Katedra Metaloznawstwa i Technologii Materiałowych, Kielce, Polska; *[email protected]
Inżynieria Materiałowa 3 (223) (2018) 116÷121DOI 10.15199/28.2018.3.5
MATERIALS ENGINEERING
Słowa kluczowe: rozwarcie wierzchołka pęknięcia, charakterystyki odporności na pękanie, stal S355JR.
1. CEL BADAŃ
Rozwarcie wierzchołka pęknięcia, podobnie jak całka J, charakte-ryzuje odporność materiału na pękanie. Wartości rozwarcia pęknię-cia wyznacza się podczas inicjacji pęknięcia podkrytycznego, δTi, lub po osiągnięciu przez pęknięcie podkrytyczne przyrostu 0.2 mm, δTC. Procedura wyznaczania δTC jest szczegółowo opisana w nor-mie ASTM 1820. Wyznaczanie wartości δTi jest bardziej skompli-kowane, wymaga specjalistycznego sprzętu i wykwalifikowanego personelu. W artykule przedstawiono kilka metod wyznaczania δTi. Wartości uzyskane za pomocą metod eksperymentalnych po-równano z rezultatami obliczeń numerycznych. Uzyskano dobrą zgodność wyników δTi wyznaczanych za pomocą różnych metod. Rozwarcie wierzchołka pęknięcia wyznaczano na próbkach SENB (single-edge-notched-bend) wykonanych ze stali S355JR poddanej laboratoryjnej obróbce cieplnej. Badania przeprowadzono w zakre-sie temperatury od –80°C do 20°C, co pozwoliło określić wpływ niskiej temperatury na δTi.
2. MATERIAŁ I METODYKA BADAŃ
Materiał do badań stanowiła stal gatunku S355JR (18G2A) poddana laboratoryjnej obróbce cieplnej: normalizowaniu (wygrzewanie w temperaturze 950°C przez 20 minut i chłodzenie na powietrzu), oraz w drugim etapie obróbki wygrzewaniu w temperaturze 600°C przez 150 godzin i chłodzeniu w oleju. W wyniku zastosowanej ob-róbki cieplnej uzyskano w stali S355JR mikrostrukturę ferrytu ze skoagulowanymi cząstkami węglików (FC). Podobny typ mikro-struktury można zaobserwować w strefie wpływu ciepła w spawa-nych elementach ze stali S355JR oraz w elementach po długotrwa-łej eksploatacji w podwyższonej temperaturze. W celu wyznaczenia charakterystyk wytrzymałościowych stali S355JR z mikrostrukturą typu FC przeprowadzono jednoosiową próbę rozciągania na stan-dardowych cylindrycznych próbkach. Rozwarcie wierzchołka pęk-nięcia (RWP) wyznaczano, wykonując badania próbek trójpunk-towo zginanych, SENB, o wymiarach: W = 24 mm, S = 96 mm, B = 12 mm, a0/W ≈ 0.55. Wartości rozwarcia wierzchołka w mo-mencie inicjacji pęknięcia podkrytycznego zostały wyznaczone na
podstawie badań przełomów próbek SENB wykonanych za pomocą skaningowego mikroskopu elektronowego JOEL oraz profilometru HIROX. Wykonano ponadto symulacje obciążenia metodą elemen-tów skończonych (MES), zadając wielkość ugięcia próbki uFi, która odpowiadała wartości całki Ji.
3. WYNIKI I ICH DYSKUSJA
Średnie wartości rozwarcia wierzchołka pękniecia δTi dla odcinka pomiarowego 1500 μm uzyskane z zastosowaniem różnych metod badawczych zamieszczono w tabeli 3. Zbliżone poziomy wartości RWP w momencie inicjacji pęknięcia podkrytycznego otrzymano w wyniku obliczeń numerycznych oraz za pomocą pomiarów na profilometrze Hirox, nieco mniejsze wartości RWP — za pomocą pomiarów szerokości strefy stępienia.
4. PODSUMOWANIE
W artykule przedstawiono wyniki badań przeprowadzonych w celu wyznaczenia wartości rozwarcia wierzchołka pęknięcia początko-wego w chwili inicjacji pęknięcia podkrytycznego δTi. Wyniki uzy-skane według różnych metod badawczych wskazują, że wartość RWP zmienia się wzdłuż frontu szczeliny. Maksymalne wartości występują w środkowej części próbki, gdzie występuje dominacja płaskiego stanu odkształcenia. Wraz ze zbliżaniem się do bocznej powierzchni próbki wartości RWP stopniowo zmniejszają się.
Podczas wyznaczania wartości δTi za pomocą metod pomia-rowych obserwowano rozrzuty danych. Jest to spowodowane niejednorodnością mikrostruktury badanej stali, składającej się z pasmowo ułożonych ziaren ferrytu i ziaren ferrytu z cząstkami skoagulowanego perlitu.
Średnie wartości δTi wyznaczone na pomiarowym odcinku 1500 μm od płaszczyzny symetrii przełomu zmniejszają się wraz ze spadkiem temperatury badań. Jest to tendencja właściwa dla charakterystyk odporności na pękanie w zakresie przejścia krucho--plastycznego.