The Method of Design Sine Grating based on Suboptimal PWM · The Method of Design Sine Grating...
7
Send Orders for Reprints to [email protected] The Open Cybernetics & Systemics Journal, 2014, 8, 171-177 171 1874-110X/14 2014 Bentham Open Open Access The Method of Design Sine Grating based on Suboptimal PWM Qiao Fu 1,2,* 1 College of Computer Science and Technology Harbin Engineering University, Harbin, China, 150001; 2 College of Computer and Information Engineering Heilongjiang University of Science and Technology, Harbin China, 150022 Abstract: In the structured light 3 d optical measurement field, the sinusoidal grating design is one of the research focuses. The traditional focus methods of generating sine pattern is not widely accepted because of many well known defects. While another traditional binary pattern generated from Ronchi grating needs defocusing processing, its application has also been a certain limit because of its projected pattern contrast ratio is not high.In this paper, we have proposed a designing sine grating method with the spatial modulation theory based on Suboptimal PWM in electronic engineering. Compared with Ronchi grating, this method of generating pattern has a better fringe contrast, and more simple defocusing requirements, so this method has a good practical economic value. Keywords: 3d profile measurement, PWM, sine grating, the fourier transform. 1. INTRODUCTION Non-contact optical three-dimensional contour measurement technology [1] is widely used in CAD/CAM, reverse engineering, rapid prototyping and virtual reality, etc. Its main research methods are moire profilometry, phase measuring profilometry, Fourier transform profilometry and spatial phase detection, etc. The outline of the measuring methods need to project sinusoidal pattern to the surface of the object to be tested, and there are two ways of generating sine pattern [2], one is the traditional focusing method of generating sine patterns (FSP) [3], namely, the projector directly projects out the sinusoidal fringe pattern. Although this approach has been widely used at present, there are some obvious defects of FSP: 1. The projector nonlinear gamma problem. 2. the camera and the projector must be precisely syn- chronized. 3. the camera exposure time demands Although the TI [4] (Texas Instruments) can solve the above problems, its high equipment cost prevents its wide application; the other one is DBP(defocusing binary pat- terns),namely the method of getting sinusoidal pattern by defocusing the binary pattern. It doesn't have a projector’s nonlinear gamma problem, does not need complex devices to generate sinusoidal pattern, and he no synchronization problems and the demanding of exposure time between FSP cameras and projectors does not exist. With the help of general commercial projector, DBP can project sinusoidal pattern, but its key to success is to design a good binary pattern [5] to make the fringe contrast best. At present, the common adoption of DBP is Ronchi grating method [6], but it has the problem of pattern projected to the measured object as it has a low contrast, and the problem of requiring high defocusing degree. This paper first presents the principle and method of Pulse Width Modulation (PWM). Further we put forward one design method of sine grating by using sub-optimal space width modulation, then compare the pattern‘s fre- quency spectrum and filtering performance between this method and the traditional Ronchi grating and finally indicate this design is better than Ronchi grating both on grating fringe contrast and defocusing requirement. 2. DESIGN OF SINE GRATING Sampling control theory has an important conclusion: equal narrow impulses with different shapes have basically the same effect when they are added on to the inertial link. PWM control technology [7] is based on the theory of the conclusion, and we have designed two kinds of sinusoidal grating methods based on the above PWM control technol- ogy. Designing sine grating based on space suboptimal width modulation is shown in Fig. (1), namely using high frequency triangle wave as the carrier, and the modulation wave is g( x ) = M [sin( wx ) + 1 4 sin( f c wx )] (In the formula, M is the carrier amplitude normaliza- tion’s modulation depth, f c is the injection of harmonic, and it is used to eliminate the low times harmonics), the modula- tion wave’s cycle is X, and divide one cycle into 2N inter- vals, interval Numbers are 0,1, 2,,2 N 1 . The point of intersection between each interval and x axis is:
Transcript of The Method of Design Sine Grating based on Suboptimal PWM · The Method of Design Sine Grating...

Send Orders for Reprints to [email protected]
The Open Cybernetics & Systemics Journal, 2014, 8, 171-177 171
1874-110X/14 2014 Bentham Open
Open Access
The Method of Design Sine Grating based on Suboptimal PWM
Qiao Fu1,2,*
1College of Computer Science and Technology Harbin Engineering University, Harbin, China, 150001;
2College of
Computer and Information Engineering Heilongjiang University of Science and Technology, Harbin China, 150022
Abstract: In the structured light 3 d optical measurement field, the sinusoidal grating design is one of the research
focuses. The traditional focus methods of generating sine pattern is not widely accepted because of many well known
defects. While another traditional binary pattern generated from Ronchi grating needs defocusing processing, its
application has also been a certain limit because of its projected pattern contrast ratio is not high.In this paper, we have
proposed a designing sine grating method with the spatial modulation theory based on Suboptimal PWM in electronic
engineering. Compared with Ronchi grating, this method of generating pattern has a better fringe contrast, and more
simple defocusing requirements, so this method has a good practical economic value.
Keywords: 3d profile measurement, PWM, sine grating, the fourier transform.
1. INTRODUCTION
Non-contact optical three-dimensional contour
measurement technology [1] is widely used in CAD/CAM,
reverse engineering, rapid prototyping and virtual reality,
etc. Its main research methods are moire profilometry, phase
measuring profilometry, Fourier transform profilometry and
spatial phase detection, etc. The outline of the measuring
methods need to project sinusoidal pattern to the surface of
the object to be tested, and there are two ways of generating
sine pattern [2], one is the traditional focusing method of
generating sine patterns (FSP) [3], namely, the projector
directly projects out the sinusoidal fringe pattern. Although
this approach has been widely used at present, there are some obvious defects of FSP:
1. The projector nonlinear gamma problem.
2. the camera and the projector must be precisely syn-chronized.
3. the camera exposure time demands
Although the TI [4] (Texas Instruments) can solve the
above problems, its high equipment cost prevents its wide
application; the other one is DBP(defocusing binary pat-
terns),namely the method of getting sinusoidal pattern by
defocusing the binary pattern. It doesn't have a projector’s
nonlinear gamma problem, does not need complex devices to
generate sinusoidal pattern, and he no synchronization
problems and the demanding of exposure time between FSP
cameras and projectors does not exist. With the help of
general commercial projector, DBP can project sinusoidal
pattern, but its key to success is to design a good binary
pattern [5] to make the fringe contrast best. At present, the common adoption of DBP is Ronchi grating method [6], but it has the problem of pattern projected to the measured object as it has a low contrast, and the problem of requiring high defocusing degree.
This paper first presents the principle and method of Pulse Width Modulation (PWM). Further we put forward one design method of sine grating by using sub-optimal space width modulation, then compare the pattern‘s fre-quency spectrum and filtering performance between this method and the traditional Ronchi grating and finally indicate this design is better than Ronchi grating both on grating fringe contrast and defocusing requirement.
2. DESIGN OF SINE GRATING
Sampling control theory has an important conclusion: equal narrow impulses with different shapes have basically the same effect when they are added on to the inertial link. PWM control technology [7] is based on the theory of the conclusion, and we have designed two kinds of sinusoidal grating methods based on the above PWM control technol-ogy.
Designing sine grating based on space suboptimal width modulation is shown in Fig. (1), namely using high frequency triangle wave as the carrier, and the modulation wave is
g(x) = M [sin(wx)+
1
4sin( f
cwx)]
(In the formula, M is the carrier amplitude normaliza-
tion’s modulation depth, fc is the injection of harmonic, and
it is used to eliminate the low times harmonics), the modula-
tion wave’s cycle is X, and divide one cycle into 2N inter-
vals, interval Numbers are 0,1,2, ,2N 1 . The point of
intersection between each interval and x axis is:

172 The Open Cybernetics & Systemics Journal, 2014, Volume 8 Qiao Fu
NNxxxxx212210
,,……£¬£¬£¬ , and the 0 j 2N 1 interval
can be expressed as: [x
j, x
j+1] , and sets the frequency of the
triangular wave carrier N , the carrier period is
X = 2 / (N ) 。
The j-th(we may assume that j is even) pulse width is:
a-The modulation wave g(x) b-Sampling waveform c-carrier wave d-PWM wave
j=
X
4{1 M [sin( x
j)+
1
4sin( f
cx
j)]} (1)
The (j+1)th pulse-width interval is:
j+1=X
4{1+ M [sin(w x
j+1))+
1
4( fcw x
j+1)]} (2)
In each cycle of the triangular wave, there is a low-
amplitude pulse width X
ne, and a high-amplitude pulse
width X
po,
X
ine=
2i, X
ipo=
X
2+
2i+1 2i(i is a positive integer be-
tween interval [0, N-1]).
In the spatial axis, the starting point is ir , the ending
point is ie and waveform duration can be expressed as:
r
i= i X + X
ine ; e
i= r
i+ X
ipo
With the help of the above formula of ir and
ie . When,
X = 2 , N=17, M=1 and fc=17. We can design the grating pattern as shown in Fig. (2).
3. THE PARAMETERS DESIGNS OF THE GRATING AND SPECTRUM ANALYSIS
The grating pattern must defocus to obtain sinusoidal pattern with continuous variation of gray level, namely binary grating pattern through a circular aperture of defocused imaging projection optical system.
The optical transfer function of projection system is:
H ( fx, f
y) =J1(2 f
x
2+ f
y
2 / 2 f0)
fx
2+ f
y
2 / 2 f0
(3)
In the formula, J
1 is a first order Bessel function, and
is the degree of defocusing.
As a result, the sine grating spectrum after filtering is:
ab
c
_x
_x
d
x1 x3 xj xN-3 xN-1
X/2
…… ……x0
Fig. (1). ------ As the switch time, ----- As the Sampling time.

The Method of Design Sine Grating based on Suboptimal PWM The Open Cybernetics & Systemics Journal, 2014, Volume 8 173
Y ( f
x, f
y) = G
r( f
x, f
y)H ( f
x, f
y) (4)
In the above formula, Gr( f
x ,fy) are kinds of grating
spectrum components, and Y ( f
x, f
y) is the pattern of the
spectrum after filtering. The defocusing operation is similar
to pass the binary pattern through a gaussian low-pass filter,
and filtering the sinusoidal fringe is y(x) .
The filtering grating stripe )(xy is related to the modulation wave
g(x) = M [sin(wx)+1
4sin( f
cwx)] .
Whether the grating’s design in two indicatorsis good or not, , one is that low harmonics of the binary stripe before filtering occupy small proportion, the other one is that the light and shade contrast of filtering stripes must be high.
The former indicator can be described as
Dif =
Gi
i=2
10
G1
, in
the formula, Gi represent the amplitude of binary stripes in
the i-th frequency component, and G1 is the fundamental
component; the latter indicator can be described as
K =y
maxy
min
ymax
+ ymin
, ymax, y
min are the maximum and the mini-
mum of the filtering stripe‘s amplitude respectively.
Both indicators are related to the three parameters
M , N , f
c of the modulation wave, Where M is the modula-
tion depth, N is the carrier ratio, and f
c is the number of
harmonics injected.
First of all, we do analysis of the carrier ratio N, the
larger the N means the larger the number of single cycles
needed to characterize the fringe, and the more resource in-
tensive. So we limit the odd N within 29. After changing the
parameter M and f
c and after many simulations, we can get
a three-dimensional surface wave of Dif as shown in Fig. (3).
When N is between 15-29, Dif can be a smaller value, taken
together, we set N to 17. When N is 17, we can obtain three-
dimensional surface map Dif and K as shown in Figs. (4-6)
by changing the value M, and value f
c.
In Fig. (4), we can draw that f
c has a larger influence on
Dif, Dif values were approximated with cyclical changes (the
period is about 37) in the value of f
c, and M makes Dif
change little; Fig. (5) is a front view of fc, It can be found
that Dif varies generally not more than 0.02 with the value of
M under a particular f
c. In a single cycle, we can point out
several frequencies corresponding to the small Dif, for ex-
ample, Dif is not more than 0.02. Average corresponds to the
maximum value when f
c can be 15, 17, 23, 33 and 35.
Namely, the proportion of low-order harmonics of the fun-
damental wave does not exceed 0.02 times the fundamental
Space CoordinateSuboptimal PW
100 200 300 400 500 600
20
40
60
80
100
Fig. (2). Suboptimal PWM Pattern.
0
20
40
60
80
100
05
1015
2025
300
0.5
1
fcN
Dif
0.1
0.2
0.3
0.4
0.5
0.6
0.7
Fig. (3). Dif relationship diagram based on N and fc.

174 The Open Cybernetics & Systemics Journal, 2014, Volume 8 Qiao Fu
0 20 40 60 80 100
0.5
1
1.50
0.05
0.1
0.15
0.2
fcM
Dif
0.02
0.04
0.06
0.08
0.1
0.12
0.14
Fig. (4). Dif relationship diagram based on M and fc.
0 20 40 60 80 1000
0.02
0.04
0.06
0.08
0.1
0.12
0.14
0.16
fc
Dif
0.02
0.04
0.06
0.08
0.1
0.12
0.14
Fig. (5). Dif relationship diagram based on fc
0 20 40 60 80 1000.5
1
1.50.2
0.3
0.4
0.5
0.6
0.7
0.8
0.9
1
fcM
K
0.3
0.4
0.5
0.6
0.7
0.8
0.9
1
Fig. (6). K relationship diagram based on M and fc.
The Method of Design Sine Grating based on Suboptimal PWM The Open Cybernetics & Systemics Journal, 2014, Volume 8 175
Table 1. Dif’s relationship with M and fc.
fc
M 0.7 0.75 0.8 0.85 0.9 0.95 1.0 1.05 1.1 1.15 1.2
15 0.0092 0.0114 0.0132 0.0131 0.0118 0.0145 0.0084 0.0061 0.0111 0.0183 0.0231
17 0.0110 0.0106 0.0132 0.0065 0.0061 0.0055 0.0034 0.0070 0.0116 0.0213 0.0264
23 0.0107 0.0079 0.0088 0.0110 0.0102 0.0109 0.0087 0.0115 0.0125 0.0121 0.0149
33 0.0159 0.0115 0.0115 0.0119 0.0155 0.0115 0.0106 0.0092 0.0069 0.0088 0.0061
35 0.0088 0.0021 0.0034 0.0077 0.0153 0.0252 0.0315 0.0404 0.0435 0.0532 0.0594
Table 2. K’s relationship with M and fc.
fc
M 0.7 0.75 0.8 0.85 0.9 0.95 1.0 1.05 1.1 1.15 1.2
15 0.6034 0.6463 0.6993 0.7432 0.7773 0.8225 0.8753 0.8946 0.9247 0.9498 0.9776
17 0.6049 0.6500 0.6898 0.7373 0.7578 0.8079 0.8541 0.8860 0.9295 0.9724 1.0000
23 0.6131 0.6583 0.6833 0.7122 0.7594 0.8082 0.8532 0.9043 0.9289 0.9549 0.9776
33 0.4559 0.4559 0.5086 0.5560 0.5822 0.6084 0.6500 0.6607 0.7027 0.7553 0.7578
35 0.7553 0.8019 0.8541 0.9050 0.9422 0.9851 1.0000 1.0000 1.0000 1.0000 1.0000
0 2 4 6 8 10 12 14 16 18 200
0.10.20.30.40.50.60.70.80.9
1
Frequency-coordinateSuboptimal PWM
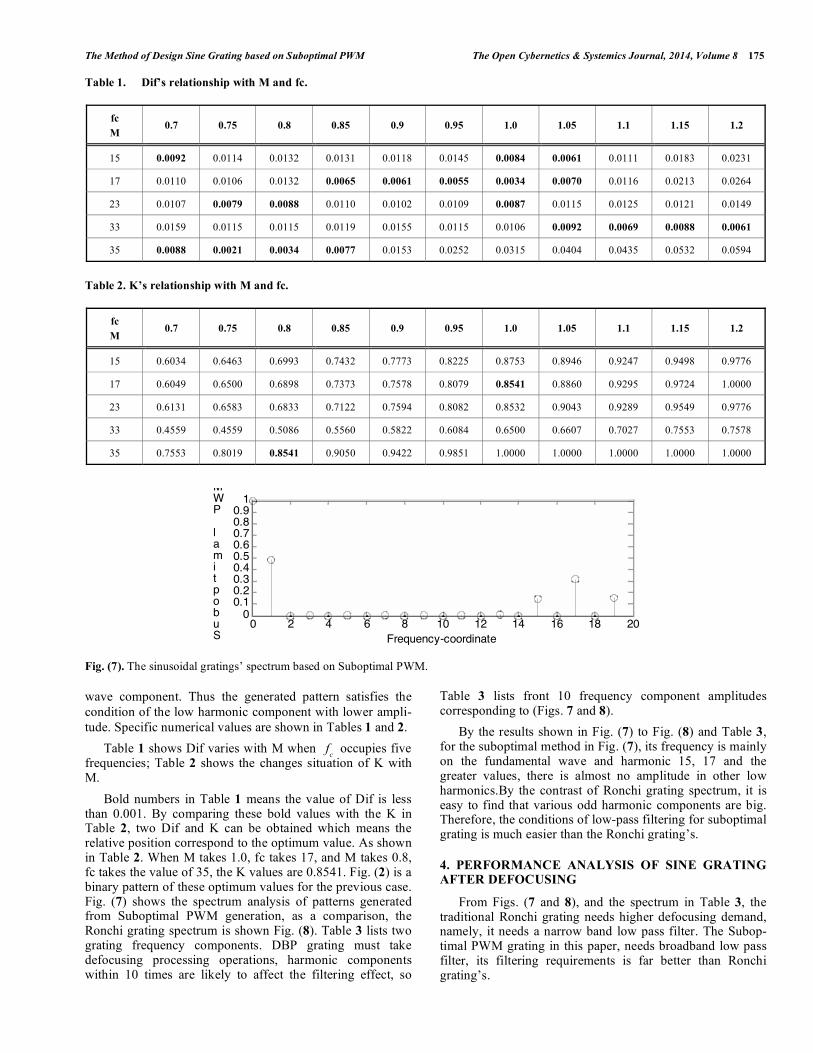
Fig. (7). The sinusoidal gratings’ spectrum based on Suboptimal PWM.
wave component. Thus the generated pattern satisfies the
condition of the low harmonic component with lower ampli-
tude. Specific numerical values are shown in Tables 1 and 2.
Table 1 shows Dif varies with M when f
c occupies five
frequencies; Table 2 shows the changes situation of K with M.
Bold numbers in Table 1 means the value of Dif is less than 0.001. By comparing these bold values with the K in Table 2, two Dif and K can be obtained which means the relative position correspond to the optimum value. As shown in Table 2. When M takes 1.0, fc takes 17, and M takes 0.8, fc takes the value of 35, the K values are 0.8541. Fig. (2) is a binary pattern of these optimum values for the previous case. Fig. (7) shows the spectrum analysis of patterns generated from Suboptimal PWM generation, as a comparison, the Ronchi grating spectrum is shown Fig. (8). Table 3 lists two grating frequency components. DBP grating must take defocusing processing operations, harmonic components within 10 times are likely to affect the filtering effect, so
Table 3 lists front 10 frequency component amplitudes corresponding to (Figs. 7 and 8).
By the results shown in Fig. (7) to Fig. (8) and Table 3, for the suboptimal method in Fig. (7), its frequency is mainly on the fundamental wave and harmonic 15, 17 and the greater values, there is almost no amplitude in other low harmonics.By the contrast of Ronchi grating spectrum, it is easy to find that various odd harmonic components are big. Therefore, the conditions of low-pass filtering for suboptimal grating is much easier than the Ronchi grating’s.
4. PERFORMANCE ANALYSIS OF SINE GRATING AFTER DEFOCUSING
From Figs. (7 and 8), and the spectrum in Table 3, the traditional Ronchi grating needs higher defocusing demand, namely, it needs a narrow band low pass filter. The Subop-timal PWM grating in this paper, needs broadband low pass filter, its filtering requirements is far better than Ronchi grating’s.

176 The Open Cybernetics & Systemics Journal, 2014, Volume 8 Qiao Fu
0 2 4 6 8 10 12 14 16 18 200
0.10.20.30.40.50.60.70.80.9
1
Frequency-coordinateRonchi PWM S
Fig. (8). The Ronchi’s spectrum.
Table 3. Frequency components of two grating pattern.
Grating
Amplitud
Frequency
1 2 3 4 5 6 7 8 9 10
Suboptimal 0.4870 0.0000 0.0011 0.0000 0.0052 0.0000 0.0049 0.0000 0.0051 0.0000
Ronchi 0.6366 0.0016 0.2122 0.0016 0.1273 0.0016 0.0910 0.0016 0.0707 0.0016
0 500 1000 1500 2000 2500 3000 3500 4000 4500 50000
0.1
0.2
0.3
0.4
0.5
0.6
0.7
Space-coordinateSuboptimal Fil
Fig. (9). Suboptimal PWM pattern after filtering.
0 500 1000 1500 2000 2500 3000 3500 4000 4500 50000
0.1
0.2
0.3
0.4
0.5
0.6
0.7
Space-coordinate
Ronchi Filter
Fig. (10). Ronchi pattern after filtering.
Harmonic has a great influence on the light intensity of
projection. We define the intensity of light and shade
contrast as: K =Y (t)
maxY (t)
min
Y (t)max
+Y (t)min
. According to the filtering
operation in formula 3 and 4, for the suboptimal sine grating
patterns in Fig. (2), we use broadband gaussian filtering to
recover sine wave as shown in Fig. (6), the light and shade
contrast K = 0.8541. For grating pattern corresponding to the
Ronchi grating spectrum in Fig. (9), we must develop a
narrowband gauss filter on it, the recovery sine wave as
shown in Fig. (10), and its light and shade contrast K=0.55.
Therefore, the Suboptimal PWM sine grating in this article,
its fringe pattern on the surface of the object to be tested by
the lens has a better light and shade contrast than Ronchi
grating.
5. CONCLUSION
This paper has designed a sinusoidal grating based on
Suboptimal PWM. Applying the Pulse Width Modulation in
time dimension to the space dimension, according to

The Method of Design Sine Grating based on Suboptimal PWM The Open Cybernetics & Systemics Journal, 2014, Volume 8 177
nonuniform spacing interval after modulation to rule grating
and after selecting the optimal parameter values, the grat-
ing’s low pass filter conditions are very low, and the pattern
contrast of this sinusoidal grating through the lens defocus-
ing is higher than the conventional Ronchi grating’s. There-
fore, the design of the PWM sinusoidal grating can improve
the precision of three-dimensional contour measurement, it
can be widely used in the field of 3 d profile measurement.
CONFLICT OF INTEREST
The author confirms that this article content has no con-
flict of interest.
ACKNOWLEDGEMENTS
We wish to acknowledge the Project of young talents of
Heilongjiang Institute of Science and Technology of China
in 2012(NO.Q20120204).
REFERENCES
[1] C.Y. Ren, H. X. Jiang, S. Li, L. Zhang, and H. Liu, “Structure and
Spectrum analysis of quasi-Sinusoidal grating in phase measure-ment profilometry,” Journal of Heilongjiang Institute of Science
and Technology , vol. 20, no. 3, pp. 201-205, 2010. [2] S. Y. Lei, and S. Zhang, “Digital sinusoidal fringe pattern genera-
tion:Defocusing binary patterns VS focusing sinusoidal patterns”, Optics and Lasers in Engineering, vol. 48, no. 5, pp. 561-569,
2010. [3] P. Cheng, C. Zhang, A. Abdugheni, X. D. Chen, and B. K. Wu, “A
new method of making projection grey sinusoidal grating,” Acta Photonica Sinica, vol. 39, no. 12, pp. 2174-2177, 2010.
[4] S. Y. Lei, and S. Zhang, “Flexible 3-D shape measurement using projector defocusing,” Optical Letters, vol. 34, no.20, pp.3080-
3082, 2009. [5] B. Zhou, F. Qiao, L. Rao, and Z. Y. Liu, “A design and analysis of
sinusoidal gratings based on mean pwm,” Journal of Central South University Science and Technology, vol. 44, no. s1, pp. 461-464,
2013. [6] W. Lohry, and S. Zhang, “3D shape measurement with 2D area
modulated binary patterns,” Optics and Lasers in Engineering, vol. 50, no. 27, pp. 917-921, Sep 2012.
[7] X-X. Li, and W. Chen, Pulse width modulation technology, CA: Wuhan of China, 1996, pp. 19-22.
Received: September 22, 2014 Revised: November 30, 2014 Accepted: December 02, 2014
© Qiao Fu; Licensee Bentham Open.
This is an open access article licensed under the terms of the Creative Commons Attribution Non-Commercial License (http://creativecommons.org/-
licenses/by-nc/3.0/) which permits unrestricted, non-commercial use, distribution and reproduction in any medium, provided the work is properly cited.