The Messer Pond Watershed-Based Implementation Plan …€¦The Messer Pond Watershed-Based...
26
The Messer Pond Watershed-Based Implementation Plan – More Science on a Lower Budget NHDES VLAP Workshop Presented By: Gabe Bolin, PE, CLM June 6, 2015
-
Upload
truongkhuong -
Category
Documents
-
view
216 -
download
0
Transcript of The Messer Pond Watershed-Based Implementation Plan …€¦The Messer Pond Watershed-Based...

The Messer Pond Watershed-Based
Implementation Plan –
More Science on a Lower Budget
NHDES VLAP Workshop
Presented By: Gabe Bolin, PE, CLM
June 6, 2015

Presentation Overview
• Messer Pond stats
• Pursing an implementation plan
• The Messer Pond Plan – Science
• The Messer Pond Plan – Volunteers
• Study Results
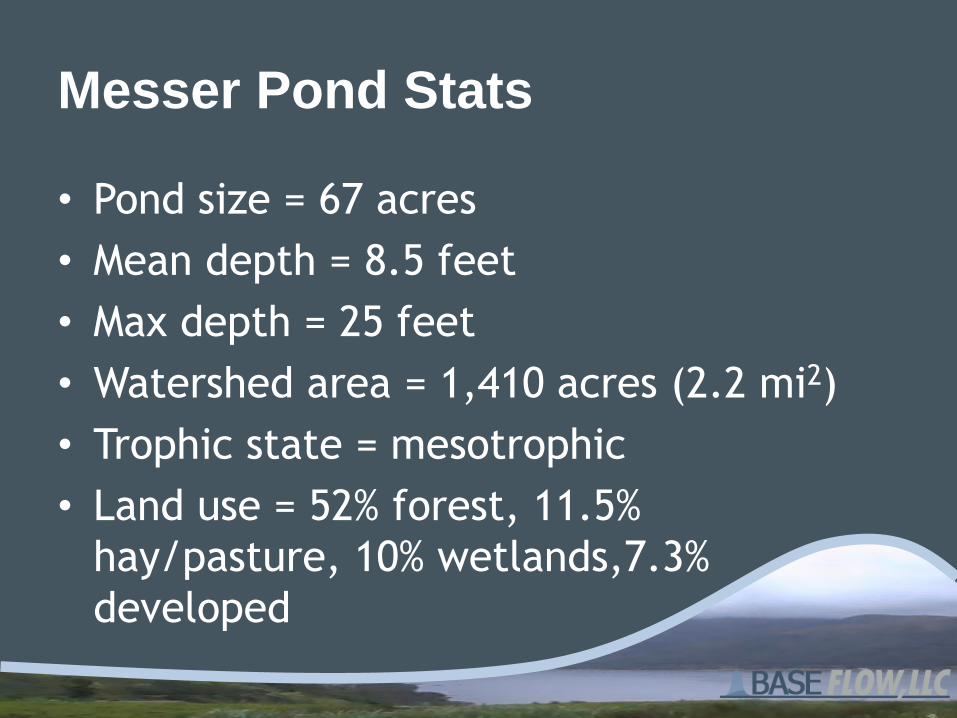
Messer Pond Stats
• Pond size = 67 acres
• Mean depth = 8.5 feet
• Max depth = 25 feet
• Watershed area = 1,410 acres (2.2 mi2)
• Trophic state = mesotrophic
• Land use = 52% forest, 11.5%
hay/pasture, 10% wetlands,7.3%
developed

Messer Pond Stats
Pursuing an Implementation Plan
• Why pursue a implementation plan?
– DES 2010 and 2012 impaired waters listings
for Messer Pond:
• Phosphorous
• Chlorophyll-a
• pH

Pursuing an Implementation Plan
• Long-term water quality trends
– Elevated conductivity levels
– Decreasing transparency since VLAP sampling
inception

Pursuing an Implementation Plan
• Long-term water quality trends
– Elevated tributary phosphorous levels during
wet weather
– Potential for hypoxia in epilimnion

Pursuing an Implementation Plan
• Funding
– NH Moose Plate grant
– Some 319h funds to complete final tasks
– Otherwise funded by MPPA

The Messer Pond Plan – Science EPA’s 9 Point Plan
a. Identify pollutant causes and sources
b. Pollutant load reduction estimates
c. Describe NPS management measures
d. Estimate technical and financial assistance
e. Public information and education
f. Implementation schedule
g. Interim milestones
h. Load reduction evaluation criteria
i. Monitoring

The Messer Pond Plan – Science EPA’s 9 Point Plan
a. Identify pollutant causes and sources
b. Pollutant load reduction estimates
– Proper ID and quantification of pollutant
sources and loading is the basis for effective
use of future 319h implementation funds
• Especially when sources are diffuse/unknown!!!
BMP/LID Design
Watershed Modeling
Water & Pollution Budgets; Surveys
The Messer Pond Plan – Science EPA’s 9 Point Plan – Point a
a. Identify pollutant causes and sources – “data sources are accurate and verifiable, assumptions can be reasonably justified”
• Loadings = Flow x Concentration – Flow
• Collected continuous flow data at all sampling stations
– Water Quality • Dry weather sampling – 4 rounds (seasons)
• Wet weather sampling – 3 storm events
– Sediment • From deep spot

The Messer Pond Plan – Science EPA’s 9 Point Plan – Point a
• Continuous 5 minute flow data, 4 stations

The Messer Pond Plan – Science EPA’s 9 Point Plan – Point a
• Water Quality
1 35 6
2 38 2
1 420 130
2 170 27
1 270 11
2 160 12
TP
(ug/L)
TSS
(mg/L)
Nutter
Brook
Avg. Storm
Intensity
(in/hr)
0.13
0.16
0.14
StationRainfall (in)/
Duration (hrs)
Storm 1
0.99", 7.75 hrs
Storm 2
1.76", 10.75
Storm 3
1.92", 13.25
Sampling
Round
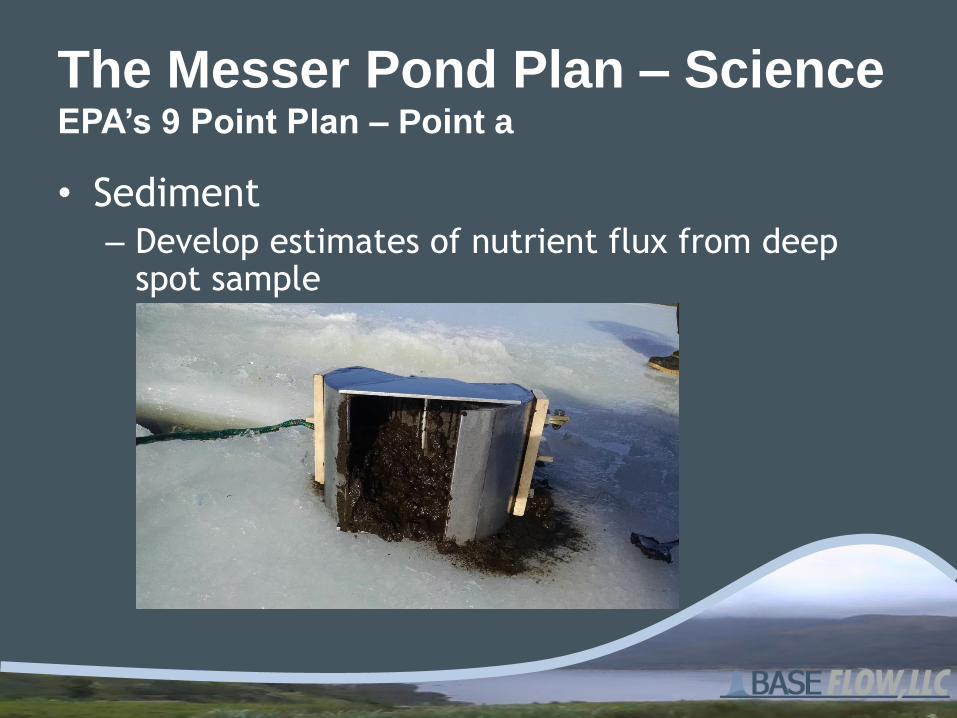
The Messer Pond Plan – Science EPA’s 9 Point Plan – Point a
• Sediment – Develop estimates of nutrient flux from deep
spot sample

The Messer Pond Plan – Science EPA’s 9 Point Plan – Point b
b. Pollutant load reduction estimates “modeling processes are accurate and verifiable, assumptions can be reasonably justified”
• Continuous rainfall/runoff model simulates: – Time varying rainfall, infiltration, runoff,
evaporation, NPS runoff/loading
– WQ – buildup/washoff of pollutants
– LID/BMP simulation
– Facilitation of calibration to field data

The Messer Pond Plan – Science EPA’s 9 Point Plan – Point b
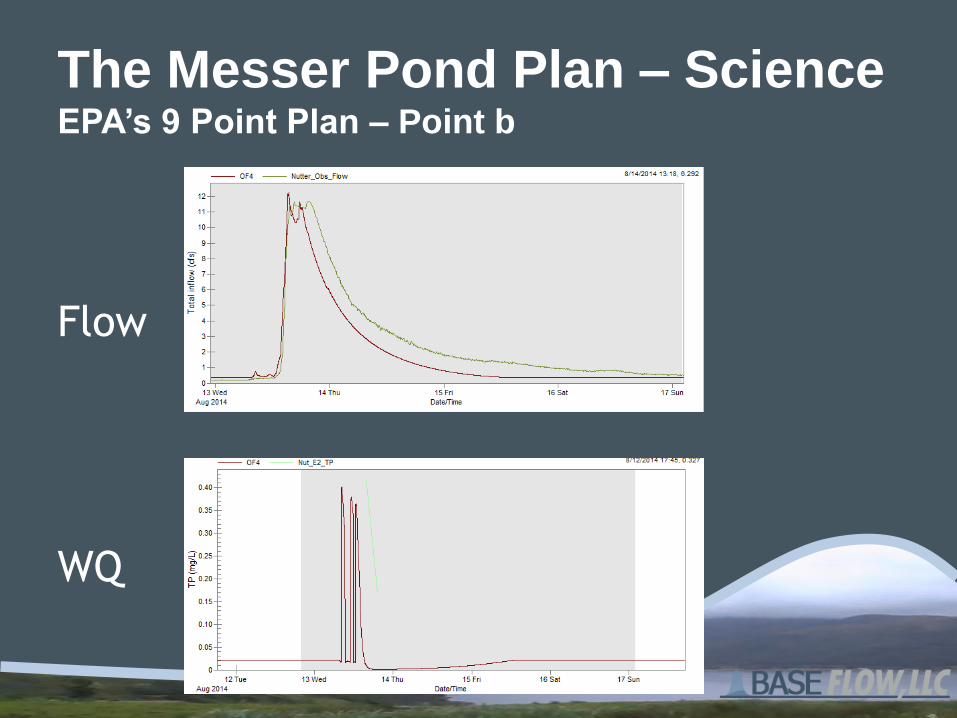
The Messer Pond Plan – Science EPA’s 9 Point Plan – Point b
Flow
WQ

The Messer Pond Plan – Science EPA’s 9 Point Plan – Point b
• Model is calibrated to site-specific hydrologic/WQ data – Flow inputs/outputs well
characterized
– ‘Calibrated’ pollutant export coefficients replace ‘regional’ export coefficients
Result = more accurate account of pollutant loadings, BMP/LID design
and funding allocation

The Messer Pond Plan – Volunteers Project Budget
• Budget set up allowing unlimited
volunteer involvement
– Volunteer hours applied against budget
• Reduced total project cost
• Motivation for volunteer involvement
• MPPA PM ‘recruitment’ of volunteers
– Unusual but appropriate for Associations
that aren’t on the ‘grant radar’

The Messer Pond Plan – Volunteers Volunteer Completed Projects
• Documentation of pond history
• Complete septic system survey
• WQ sampling – Dry weather
– Wet weather
• Sediment samples
• Watershed surveys
• Build-out analysis trend research
• Public outreach

Study Results Annual External P Load, %
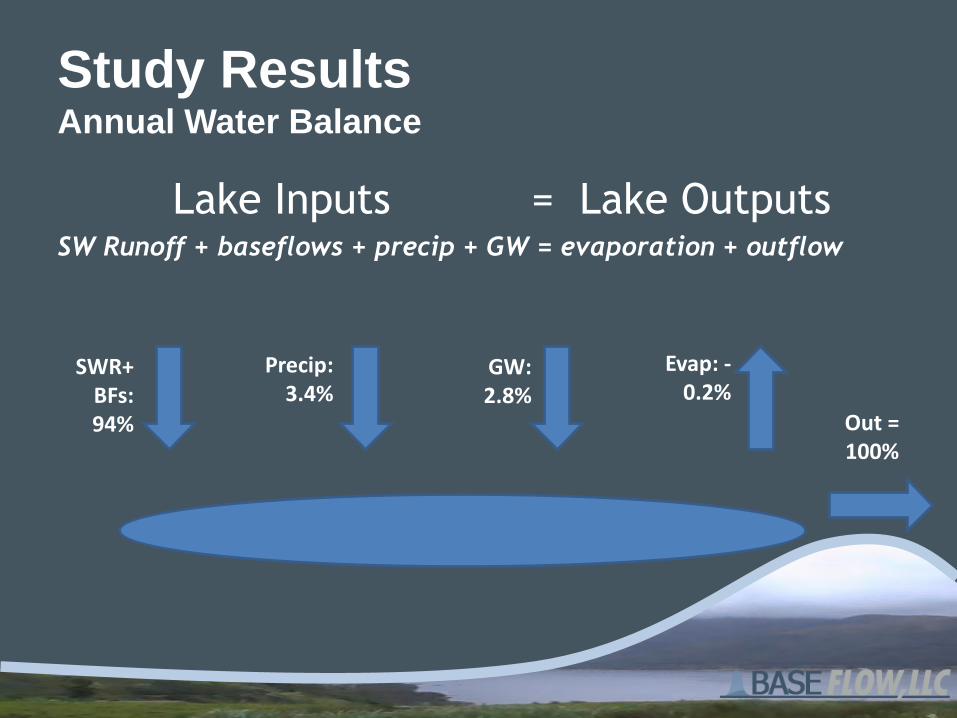
Study Results Annual Water Balance
Lake Inputs = Lake Outputs SW Runoff + baseflows + precip + GW = evaporation + outflow
SWR+BFs: 94%
Precip: 3.4%
Evap: -0.2%
GW: 2.8%
Out = 100%

Study Results Estimated Annual P Load
Total (lbs) Per Acre (lbs)
CRB_Upper 522.8 35.7 0.07 42.2
CRB_Lower 159.7 5.5 0.03 6.5
Unnamed_Trib 31.2 3.3 0.10 3.9
Haas_Brook 63.9 6.3 0.10 7.5
Nutter_Brook 133.4 9.2 0.07 10.9
Browns_Brook 110.6 11.0 0.10 13.0
Beaver_Point 15.9 1.4 0.09 1.7
North_1 103.8 4.9 0.05 5.8
North_2 81.7 3.0 0.04 3.5
North_3 39.8 1.7 0.04 2.1
Direct_Drainage 23.1 2.4 0.11 2.9
Messer Pond Watershed (total) 1285.9 84.50 0.07 100.00
Estimated Annual P LoadSize (ac)Sub-Basin
% of Watershed
Total P Load

Study Results Estimated Annual TSS Load
Total (lbs) Per Acre (lbs)
CRB_Upper 522.8 1,448 2.8 42.4
CRB_Lower 159.7 144 0.9 4.2
Unnamed_Trib 31.2 80 2.6 2.3
Haas_Brook 63.9 119 1.9 3.5
Nutter_Brook 133.4 371 2.8 10.9
Browns_Brook 110.6 1,029 9.3 30.1
Beaver_Point 15.9 24 1.5 0.7
North_1 103.8 89 0.9 2.6
North_2 81.7 51 0.6 1.5
North_3 39.8 28 0.7 0.8
Direct_Drainage 23.1 36 1.6 1.1
Messer Pond Watershed (total) 1285.9 3418.92 2.66 100.00
Estimated Annual TSS Load % of Watershed
Total TSS LoadSub-Basin Size (ac)

Study Results Final Steps
• Calculate required P reduction to meet
target lake concentration of 10 ug/L
• Select BMP/LID projects to meet
reduction
• Top 3 projects:
1. Browns Brook wetland restoration
2. TBD – mostly like dirt road BMPs
3. TBD – culverts/vegetative strips, etc.

Questions?
Gabe Bolin, PE, CLM
Base Flow, LLC
Amherst, NH
(603) 809-6101