The Mental Health Index report - Morneau Shepell
35
The Mental Health Index ™ report The United States, November 2020
Transcript of The Mental Health Index report - Morneau Shepell
The Mental Health Index™ reportThe United States, November 2020

iiThe Mental Health Index™ — The United States | November 2020
November 2020 report
Table of contents
November highlights 1The Mental Health Index™ 5Mental Health Index™ sub-scores 6
The Mental Health Index™ (regional) 9The Mental Health Index™(industry) 12The Mental Stress Change score 13Mental Stress Change (cumulative) 14Mental Stress Change (percentages) 15The Mental Stress Change (industry) 18Spotlight 19
Physical health during the pandemic 19Employees and the workplace 20Parental concerns during the COVID-19 pandemic 26The U.S. Presidential election 29
Overview of the Mental Health Index™ 31Methodology 31Calculations 31Additional data and analyses 32
1The Mental Health Index™ — The United States | November 2020
November 2020 report
November highlightsFor eight consecutive months, the mental health of Americans is significantly lower than prior to the COVID-19 pandemic. After the initial significant decline measured in April 2020, there were modest increases from April to July 2020. A reversal of this trend occurred in August and September, followed by a modest improvement in October, and a further decline in November. The level of mental health in November remains concerning as it indicates that the working population is currently as distressed as the most distressed nine per cent of working Americans, prior to 2020.
November continues a further decline in all sub-risk scores. Scores for anxiety, depression, work productivity, and isolation are at their lowest level since April 2020. Further, general psychological health is almost one point below its lowest score, observed in April and October.
The proportion of individuals reporting more stress than the prior month (21 percent) has remained constant since August. The proportion of individuals reporting less mental stress is 9 percent. The majority (71 percent) indicate the same level of stress when compared to the prior month, however, given the escalation in stress each month since the pandemic, this reflects an elevated level of cumulative stress for this group as well. With recent increases in cases in many parts of the country, this strain will likely continue.
Regional mental health scores since April have shown general improvement until July; however, all regions showed declines from July to September. While the West and South of the U.S. showed improvements in October, there were declines across all regions in November.
For the eighth consecutive month, full-time students have the lowest mental health score (-19.1) when compared to individuals across all industry sectors. Further, the most reported concerns among parents of children between 18 and 30 years old are the financial impact of the pandemic (46 percent), job opportunities/career impact for their adult children (37 percent), and the mental and physical health of their adult children (both at 36 percent).
The COVID-19 pandemic has caused increased strain on workplaces and employees. It has compelled many employers and employees to reconsider how they conduct their business, not only with those for whom they provide goods or service, but also with their employees. An equal number of respondents (fifteen percent) report a more positive view of their employers and more negatively when compared to before the COVID-19 pandemic.
A positive score on the Mental Health Index™ indicates better mental health in the overall working population, compared to the benchmark period of 2017 to 2019. A higher positive score reflects greater improvement. A negative Mental Health Index™ score indicates a decline in mental health compared to the benchmark period. The more negative the score, the greater the decline. A score of zero indicates mental health that is the same as it was in the benchmark period.

2The Mental Health Index™ — The United States | November 2020
November 2020 report
Nearly one-quarter (twenty-four percent) of respondents indicate that the COVID-19 pandemic led them to consider a job or career change. Individuals under the age of 40 are more than twice as likely to consider a job or career change when compared to those over the age of 50.
Workplace health and safety has risen to primary importance since the onset of the COVID-19 pandemic. Seventy-two percent of respondents believe that their employers are handling health and safety well. Respondents from lower income households are less likely to report that employers are handling the health and safety risks of the pandemic well than those in higher income households.
One of the many consequences of the COVID-19 pandemic is the closing or reduction of in-person workplaces. With a dispersed and remote workforce, employers rely on technology to ensure business continuity and connectedness. Sixty-eight percent of respondents report that their employers are handing the use of technology well, whereas seven percent report that their employers are handling the use of technology poorly.
Some employers were forced to reduce salaries, hours, or lay-off employees because of impacts to their business from the COVID-19 pandemic. Forty-two percent of respondents report that their employers are handling reductions to employee pay and hours well, whereas eleven per cent report that their employers are handling this issue poorly.
Business models have been modified to respond to changes in demand and to adhere to health and safety protocols. Sixty-two percent of respondents report that their employer is handling changes to the way in which business is conducted well, whereas nine per cent report that their employer is handling changes to the way business is being conducted poorly.
As the pandemic continues, the need for flexibility is critical. Employees need time for self-care, to attend to children or to other family members, and to address their daily tasks in a fluid, and sometimes complex environment. Sixty percent of respondents report that their employers are handling flexible work hours well, while ten per cent indicate that their employer is handling this issue poorly. Respondents from households with an annual income less than $30,000 are least likely to report that employers are handling flexible work hours well, when compared to individuals from households with an annual income of $150,000 or more.
3The Mental Health Index™ — The United States | November 2020
November 2020 report
In addition to flexible work hours, work from home has been driven by the COVID-19 pandemic. Fifty-five percent of respondents report that their employers are handling work from home policies well, whereas eight percent indicate that their employers are handling work from home poorly. Organizations with more than 50 employees are handling work from home better than organizations with less than 50 employees.
As employees come under increased strain due to the COVID-19 pandemic, many employers are reminding their people of the support and resources available to them to maintain or improve their wellbeing. Fifty-three percent of respondents report that their employers are handling the promotion of resources well, whereas thirteen percent indicate that their employers are handling this poorly.
Containing rising COVID-19 cases has forced restrictions across the country. Gyms and other recreational facilities have been required to close or to significantly reduce capacity. Previous findings (September 2020) show that over one quarter (27 percent) of individuals indicate that the pandemic has made them less likely to participate in health care than in 2019. Ten percent of individuals report that their physical health has worsened since the onset of the pandemic and this group has a mental health score that is significantly lower than average (-23.1).
Since the pandemic, parents of children under 18 years are finding themselves balancing work and their children’s personal and educational needs while daycares and schools have been under restrictions. The top concerns or fears that parents have regarding their children during the pandemic are the quality of education (46 percent), followed by the mental health of their children (42 percent) and the physical health of their children (35 percent). Parents who report concerns about children with special needs have the lowest mental health score (-23.5), followed by parents with concerns about their children’s mental health (-18.6), and those with concerns about childcare/work balance (-17.7).
While children’s education quality is the most reported concern, children’s mental health is the greatest concern (22 percent) among parents of children under 18 years, and the mental health score of this group is -19.3. The lowest mental health score (-20.9) is observed among the one percent of respondents who report that their greatest concern is children with special needs that are not being attended to.
4The Mental Health Index™ — The United States | November 2020
November 2020 report
Children under 18 years present a decidedly separate set of concerns for parents than adult children. Among parents of adult children, the lowest mental health score is observed among parents who are most concerned about their adult children’s mental health (-14.2), followed by concern about isolation (-12.5), and their children’s physical health (-10.5). As the top drivers of mental health continue to be financial risk and isolation, parents of adult children are concerned about similar issues for those children.
The mental health impact of the divisive U.S. Presidential election on mental health was documented in the October Mental Health Index™ report. Consistent with the October results (43 percent) just before the election, nearly half of respondents in November after the election (46 percent) feel that the election has had a negative effect on their mental health. Eighty-four percent of respondents report having voted or planned to vote in the election. The highest optimism scores in November are observed among individuals who had already voted or planned to vote (-7.3). Individuals who had voted or planned to vote in the election were not only the most likely to report a positive effect on their mental health, but also the most likely to report a negative effect on their mental health.
5The Mental Health Index™ — The United States | November 2020
November 2020 report
-9
-8
-7
-6
-5
-4
November2020
OctoberSeptember AugustJuly June May April2020
-8.0
-6.3-5.8
-5.1-5.6
-6.3 -6.2
-7.3
The Mental Health Index™
1 The benchmark reflects data collected in 2017, 2018 and 2019.
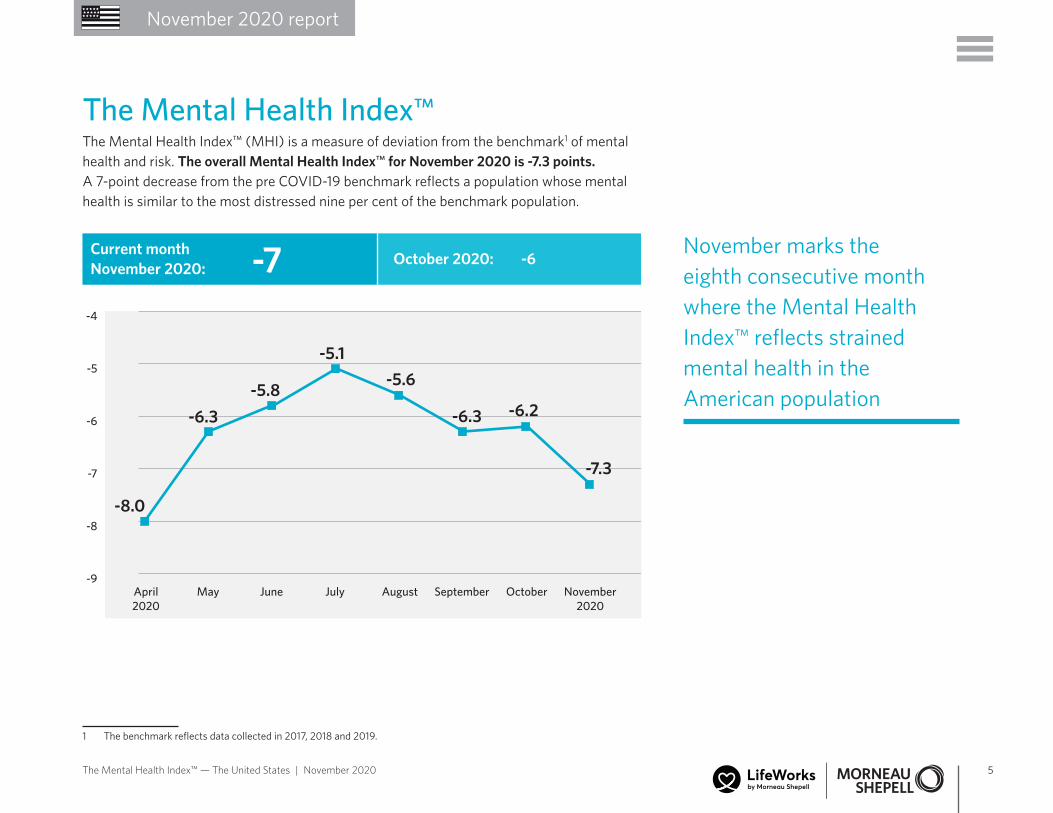
The Mental Health Index™ (MHI) is a measure of deviation from the benchmark1 of mental health and risk. The overall Mental Health Index™ for November 2020 is -7.3 points. A 7-point decrease from the pre COVID-19 benchmark reflects a population whose mental health is similar to the most distressed nine per cent of the benchmark population.
Current month November 2020: --7 October 2020: -6
November marks the eighth consecutive month where the Mental Health Index™ reflects strained mental health in the American population

6The Mental Health Index™ — The United States | November 2020
November 2020 report
Mental Health Index™ sub-scores
The lowest Mental Health Index™ sub-score is for the risk measure of anxiety (-9.6), followed by depression (-9.1), work productivity (-8.6), optimism (-7.9), and isolation (-7.8). The risk measure with the best mental health score is financial risk (6.7), followed by general psychological health (1.4).
• All mental health sub-scores worsened in November when compared to October.
• The November scores for anxiety, depression, work productivity, and isolation are at their lowest since April 2020.
• At 1.4 points in November, general psychological health is 0.7 points below its lowest point (2.1), observed in April and October.
MHI
sub-scores2November
2020October
2020
Anxiety -9.6 -8.0
Depression -9.1 -7.5
Work productivity -8.6 -8.3
Optimism -7.9 -7.5
Isolation -7.8 -6.2
Psychological health 1.4 2.1
Financial risk 6.7 7.4
2 The demographic breakdown of sub-scores are available upon request.

7The Mental Health Index™ — The United States | November 2020
November 2020 report
General psychological health
1
2
3
4
November2020
OctoberSeptember AugustJuly June May April2020
2.1
2.5 2.52.8
2.52.2 2.1
1.4
General psychological health
From April to July, minor improvements in general psychological health were observed. Since July, general psychological health has worsened to its lowest point in November.
Work productivity
An increase in work productivity scores was observed from April to August, except for a slight decline in June. Since September, the work productivity score has been in decline and is nearly equal to the lowest score in April.
Work Productivity
-9
-8
-7
-6
-5
-4
November2020
OctoberSeptember AugustJuly June May April2020
-8.7
-7.3-6.9
-5.5 -5.3
-7.8-8.3
-8.6
8The Mental Health Index™ — The United States | November 2020
November 2020 report
Financial risk
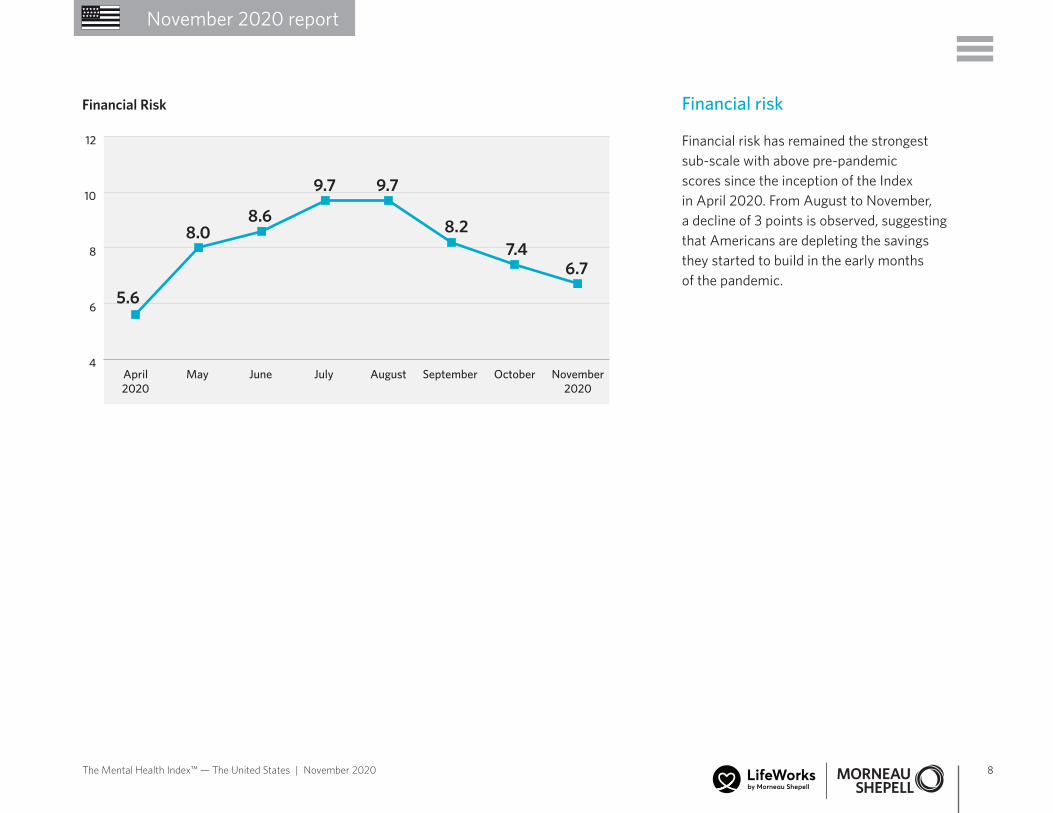
Financial risk has remained the strongest sub-scale with above pre-pandemic scores since the inception of the Index in April 2020. From August to November, a decline of 3 points is observed, suggesting that Americans are depleting the savings they started to build in the early months of the pandemic.
Financial Risk
4
6
8
10
12
November2020
OctoberSeptember AugustJuly June May April2020
5.6
8.08.6
9.7 9.7
8.2
6.77.4
9The Mental Health Index™ — The United States | November 2020
November 2020 report
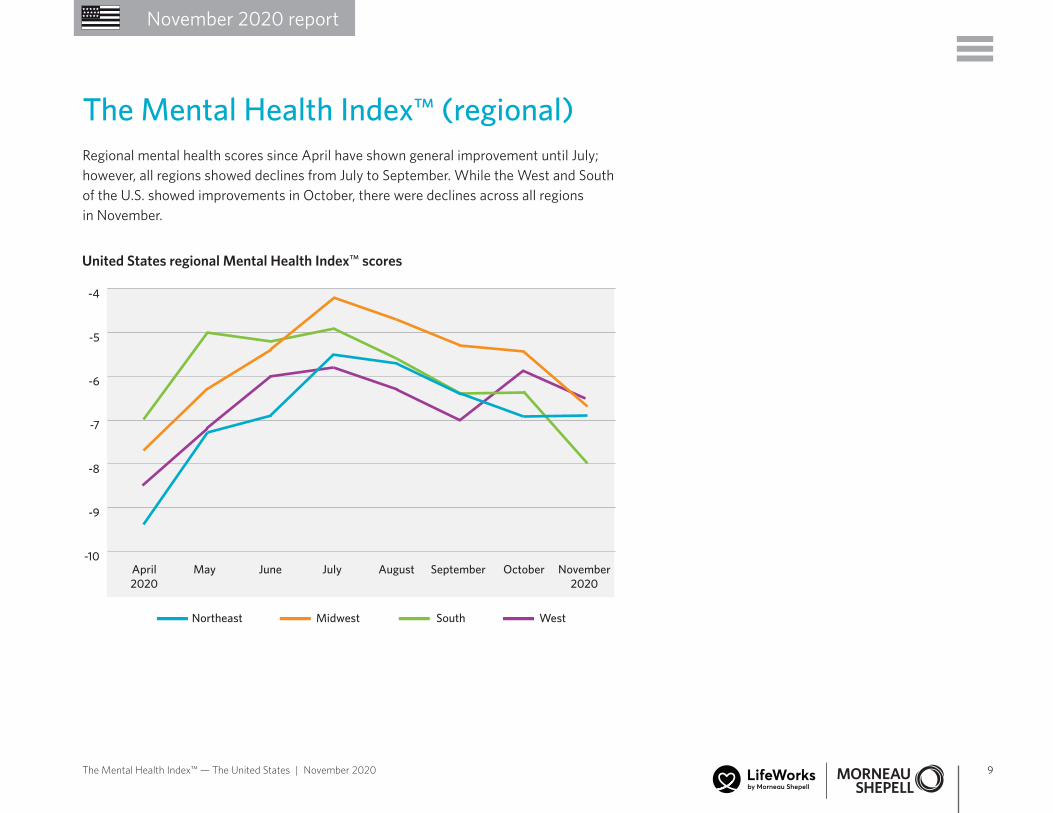
The Mental Health Index™ (regional)Regional mental health scores since April have shown general improvement until July; however, all regions showed declines from July to September. While the West and South of the U.S. showed improvements in October, there were declines across all regions in November.
-10
-9
-8
-7
-6
-5
-4
November2020
OctoberSeptember AugustJuly JuneMay April2020
WestSouthMidwestNortheast
United States regional Mental Health Index™ scores

10The Mental Health Index™ — The United States | November 2020
November 2020 report
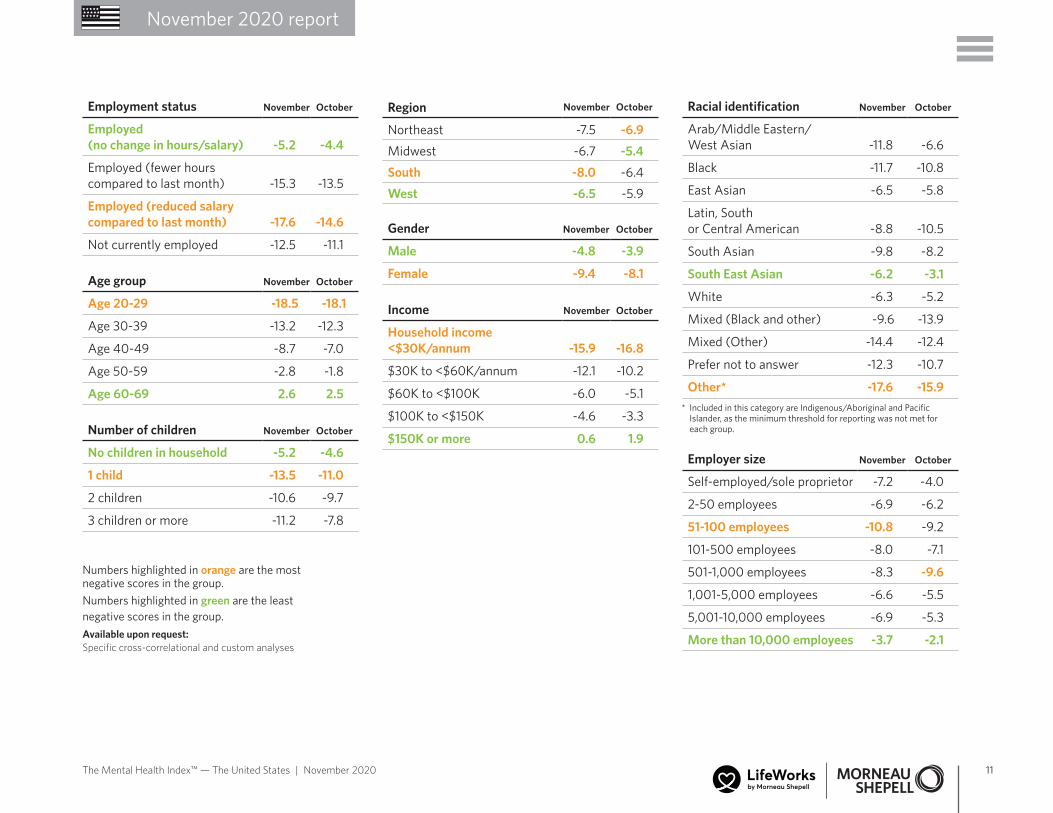
Demographics • For eight consecutive months, females (-9.4) have a significantly lower mental health score than males (-4.8); we also see that mental health scores improve with age.
• Respondents identifying as Other* (combined category of Indigenous/Aboriginal and Pacific Islander) have the lowest mental health score (-17.6), followed by those identifying as Mixed (Other) (-14.4).
• Individuals identifying as South East Asian have the highest mental health score (-6.2), followed by respondents identifying as White (-6.3), and those identifying as East Asian (-6.5).
• The variance in the mental health score between those with and without children has been observed since April, and results in November continue this trend with a lower score for those with at least one child (-13.5) when compared to those without children (-5.2).
Employment • Overall, five per cent of respondents are unemployed. While most individuals remain employed, 16 per cent report reduced hours or reduced salary since April 2020.
• Individuals reporting reduced salary when compared to the prior month (-17.6), have the lowest mental health score, followed by those who report fewer hours, when compared to the prior month (-15.3) and those not currently employed (-12.5).
• Individuals working for companies with more than 10,000 employees have the highest mental health score (-3.7), followed by individuals working for companies with 1,001-5,000 employees (-6.6).
• Respondents who report working for companies with 51-100 employees have the lowest mental health score (-10.8), followed by individuals working for companies with 501-1,000 employees (-8.3).
Emergency savings • Individuals without emergency savings continue to experience a lower score in mental health (-22.8) than the overall group. Those reporting an emergency fund have an average mental health score of -2.4.
11The Mental Health Index™ — The United States | November 2020
November 2020 report
Numbers highlighted in orange are the most negative scores in the group. Numbers highlighted in green are the least negative scores in the group.Available upon request:Specific cross-correlational and custom analyses
* Included in this category are Indigenous/Aboriginal and Pacific Islander, as the minimum threshold for reporting was not met for each group.
Employment status November October
Employed (no change in hours/salary) -5.2 -4.4
Employed (fewer hours compared to last month) -15.3 -13.5
Employed (reduced salary compared to last month) -17.6 -14.6
Not currently employed -12.5 -11.1
Age group November October
Age 20-29 -18.5 -18.1
Age 30-39 -13.2 -12.3
Age 40-49 -8.7 -7.0
Age 50-59 -2.8 -1.8
Age 60-69 2.6 2.5
Number of children November October
No children in household -5.2 -4.6
1 child -13.5 -11.0
2 children -10.6 -9.7
3 children or more -11.2 -7.8
Region November October
Northeast -7.5 -6.9Midwest -6.7 -5.4South -8.0 -6.4West -6.5 -5.9
Gender November October
Male -4.8 -3.9
Female -9.4 -8.1
Income November October
Household income <$30K/annum -15.9 -16.8
$30K to <$60K/annum -12.1 -10.2
$60K to <$100K -6.0 -5.1
$100K to <$150K -4.6 -3.3
$150K or more 0.6 1.9
Racial identification November October
Arab/Middle Eastern/ West Asian -11.8 -6.6
Black -11.7 -10.8
East Asian -6.5 -5.8
Latin, South or Central American -8.8 -10.5
South Asian -9.8 -8.2
South East Asian -6.2 -3.1
White -6.3 -5.2
Mixed (Black and other) -9.6 -13.9
Mixed (Other) -14.4 -12.4
Prefer not to answer -12.3 -10.7
Other* -17.6 -15.9
Employer size November October
Self-employed/sole proprietor -7.2 -4.0
2-50 employees -6.9 -6.2
51-100 employees -10.8 -9.2
101-500 employees -8.0 -7.1
501-1,000 employees -8.3 -9.6
1,001-5,000 employees -6.6 -5.5
5,001-10,000 employees -6.9 -5.3
More than 10,000 employees -3.7 -2.1
12The Mental Health Index™ — The United States | November 2020
November 2020 report
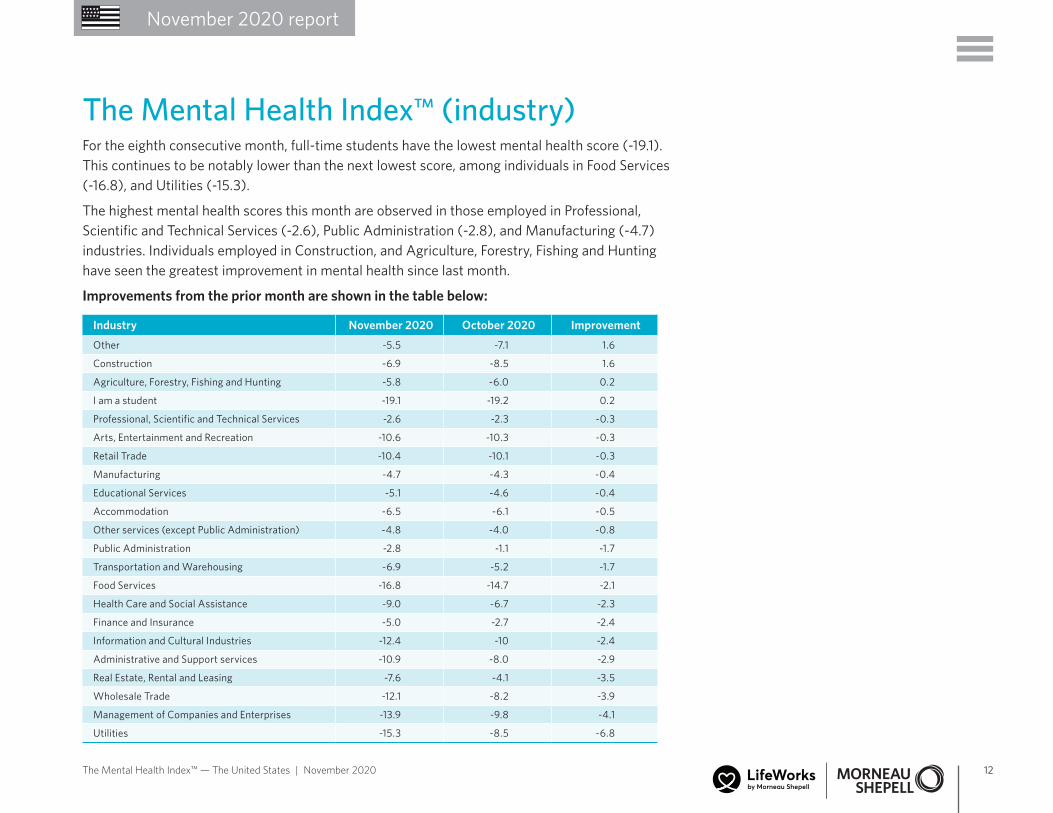
The Mental Health Index™ (industry)For the eighth consecutive month, full-time students have the lowest mental health score (-19.1). This continues to be notably lower than the next lowest score, among individuals in Food Services (-16.8), and Utilities (-15.3).
The highest mental health scores this month are observed in those employed in Professional, Scientific and Technical Services (-2.6), Public Administration (-2.8), and Manufacturing (-4.7) industries. Individuals employed in Construction, and Agriculture, Forestry, Fishing and Hunting have seen the greatest improvement in mental health since last month.
Improvements from the prior month are shown in the table below:
Industry November 2020 October 2020 Improvement
Other -5.5 -7.1 1.6
Construction -6.9 -8.5 1.6
Agriculture, Forestry, Fishing and Hunting -5.8 -6.0 0.2
I am a student -19.1 -19.2 0.2
Professional, Scientific and Technical Services -2.6 -2.3 -0.3
Arts, Entertainment and Recreation -10.6 -10.3 -0.3
Retail Trade -10.4 -10.1 -0.3
Manufacturing -4.7 -4.3 -0.4
Educational Services -5.1 -4.6 -0.4
Accommodation -6.5 -6.1 -0.5
Other services (except Public Administration) -4.8 -4.0 -0.8
Public Administration -2.8 -1.1 -1.7
Transportation and Warehousing -6.9 -5.2 -1.7
Food Services -16.8 -14.7 -2.1
Health Care and Social Assistance -9.0 -6.7 -2.3
Finance and Insurance -5.0 -2.7 -2.4
Information and Cultural Industries -12.4 -10 -2.4
Administrative and Support services -10.9 -8.0 -2.9
Real Estate, Rental and Leasing -7.6 -4.1 -3.5
Wholesale Trade -12.1 -8.2 -3.9
Management of Companies and Enterprises -13.9 -9.8 -4.1
Utilities -15.3 -8.5 -6.8

13The Mental Health Index™ — The United States | November 2020
November 2020 report
The Mental Stress Change scoreThe Mental Stress Change Score (MStressChg) is a measure of the level of reported mental stress, compared to the prior month. The Mental Stress Change score for November 2020 is 56.7. This reflects a net increase in mental stress compared to the prior month.
The current score indicates that 21 percent of the population is experiencing more mental stress compared to the prior month, with 8 percent experiencing less. A continued increase in mental stress over the last eight months indicates a significant accumulation of strain in the population.
Current month November 2020: -56.7 October 2020: 56.0
April 2020
May June July0
10
20
30
40
50
60
70
80
90
100
August
More mental stress
Less mental stress
50 = No change from prior month
September October November2020
71.664.4
58.4 55.1 56.1 56.4 56.0 56.7

14The Mental Health Index™ — The United States | November 2020
November 2020 report
Mental Stress Change (cumulative)The Mental Stress Change (MStressChg) score is a measure of the level of reported mental stress compared to the prior month. The change is rooted against a value of 50 implying no net mental stress change from the previous month, while values above 50 indicate a net increase in mental stress and values below 50 indicate a net decrease in mental stress. The graph below tracks the increases and decreases to account for the cumulative effect on mental stress.
The continual increase in mental stress demonstrates that Americans are reporting more mental stress month-over-month. To relieve this level of accumulated stress, a sizable portion of the population must start regularly reporting lower stress.
Cumulative MStressChg
Cumulative mental stress Baseline
71.6
105.7
More mental stress
Less mental stress
50 = No change from prior month
40
60
80
100
120
140
November2020
OctoberSeptemberAugust JulyJuneMay April2020
86.0
99.6
118.0124.7
94.4
112.1

15The Mental Health Index™ — The United States | November 2020
November 2020 report
Mental Stress Change (percentages)Mental Stress Change tracks an individual’s stress changes each month. The percentages of those experiencing more stress, the same level of stress, and less stress for each month of the survey are shown in the graph below.
Over the last eight months, the percentage of those experiencing more mental stress than the previous month has steadily decreased; however, the data shows that those experiencing less mental stress are insufficient to lower the overall Mental Stress Change score to below 50 (the level at which stress is lower than the previous month). As the proportion of individuals reporting the same level of stress or more stress than the previous month continues to significantly outweigh the proportion reporting less mental stress, the population will continue to feel the effects of significantly increased stress and will not be able to reach a more sustainable and health level of stress.
In April, 49 percent of individuals reported an increase in mental stress. While those reporting increased month-over-month mental stress has decreased to 21 percent in November 2020, 70 percent of respondents report the same level of mental stress and only 8 percent report a decrease in mental stress.
0%
10%
20%
30%
40%
50%
60%
70%
80%
90%
100%
Novembre 2020OctoberSeptember AugustJulyJuneMayApril 2020
6%
45%
49%
7%
58%
35%
9%
65%
26%
10%
70%
20%
9%
71%
21%
8%
70%
21%
Less mental stress
Same level of mental stress
More mental stress
Mental Stress Change by Month
8%
70%
21%
9%
71 %
21%
16The Mental Health Index™ — The United States | November 2020
November 2020 report
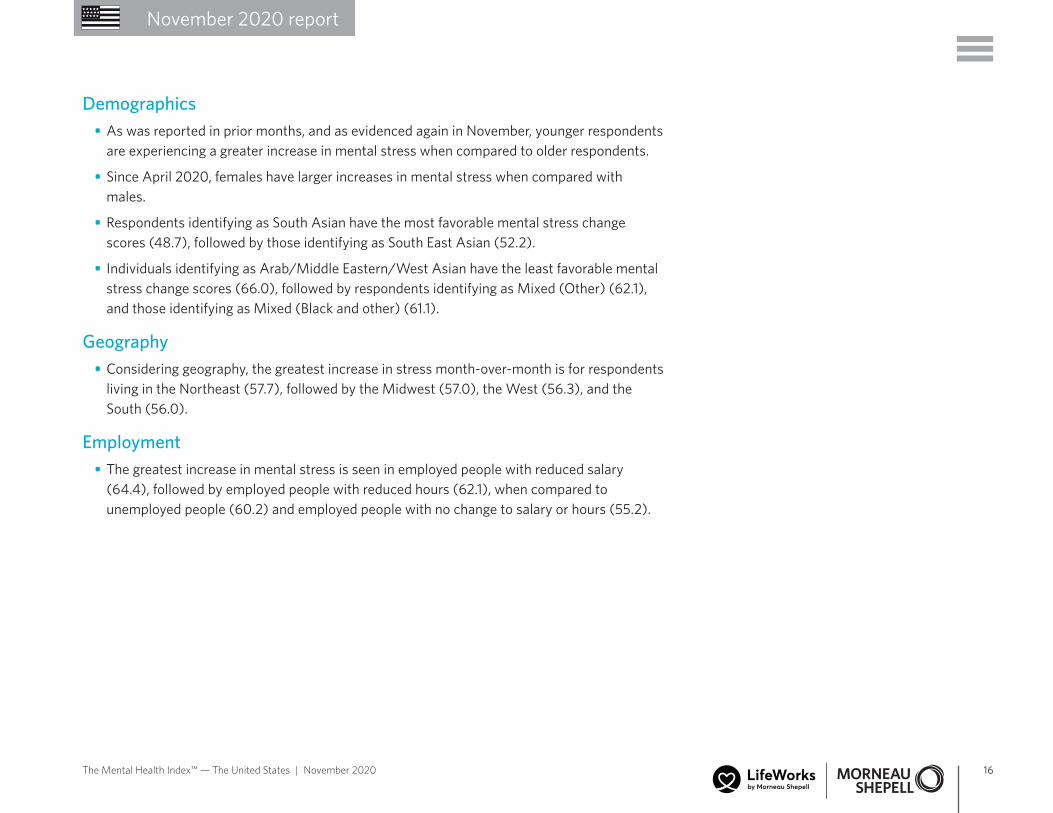
Demographics • As was reported in prior months, and as evidenced again in November, younger respondents are experiencing a greater increase in mental stress when compared to older respondents.
• Since April 2020, females have larger increases in mental stress when compared with males.
• Respondents identifying as South Asian have the most favorable mental stress change scores (48.7), followed by those identifying as South East Asian (52.2).
• Individuals identifying as Arab/Middle Eastern/West Asian have the least favorable mental stress change scores (66.0), followed by respondents identifying as Mixed (Other) (62.1), and those identifying as Mixed (Black and other) (61.1).
Geography • Considering geography, the greatest increase in stress month-over-month is for respondents living in the Northeast (57.7), followed by the Midwest (57.0), the West (56.3), and the South (56.0).
Employment • The greatest increase in mental stress is seen in employed people with reduced salary (64.4), followed by employed people with reduced hours (62.1), when compared to unemployed people (60.2) and employed people with no change to salary or hours (55.2).
17The Mental Health Index™ — The United States | November 2020
November 2020 report
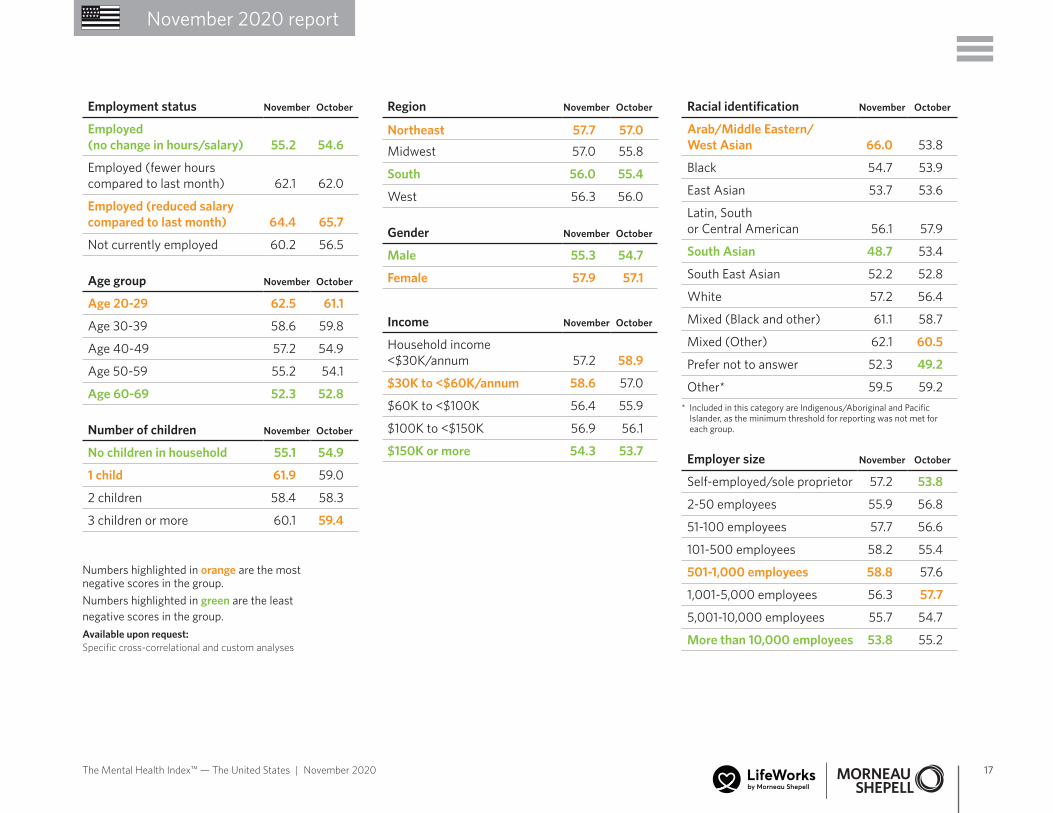
Employment status November October
Employed (no change in hours/salary) 55.2 54.6
Employed (fewer hours compared to last month) 62.1 62.0
Employed (reduced salary compared to last month) 64.4 65.7
Not currently employed 60.2 56.5
Age group November October
Age 20-29 62.5 61.1
Age 30-39 58.6 59.8
Age 40-49 57.2 54.9
Age 50-59 55.2 54.1
Age 60-69 52.3 52.8
Number of children November October
No children in household 55.1 54.9
1 child 61.9 59.0
2 children 58.4 58.3
3 children or more 60.1 59.4
Region November October
Northeast 57.7 57.0Midwest 57.0 55.8
South 56.0 55.4
West 56.3 56.0
Gender November October
Male 55.3 54.7
Female 57.9 57.1
Income November October
Household income <$30K/annum 57.2 58.9
$30K to <$60K/annum 58.6 57.0
$60K to <$100K 56.4 55.9
$100K to <$150K 56.9 56.1
$150K or more 54.3 53.7
Racial identification November October
Arab/Middle Eastern/ West Asian 66.0 53.8
Black 54.7 53.9
East Asian 53.7 53.6
Latin, South or Central American 56.1 57.9
South Asian 48.7 53.4
South East Asian 52.2 52.8
White 57.2 56.4
Mixed (Black and other) 61.1 58.7
Mixed (Other) 62.1 60.5
Prefer not to answer 52.3 49.2
Other* 59.5 59.2
Employer size November October
Self-employed/sole proprietor 57.2 53.8
2-50 employees 55.9 56.8
51-100 employees 57.7 56.6
101-500 employees 58.2 55.4
501-1,000 employees 58.8 57.6
1,001-5,000 employees 56.3 57.7
5,001-10,000 employees 55.7 54.7
More than 10,000 employees 53.8 55.2
Numbers highlighted in orange are the most negative scores in the group. Numbers highlighted in green are the least negative scores in the group.Available upon request:Specific cross-correlational and custom analyses
* Included in this category are Indigenous/Aboriginal and Pacific Islander, as the minimum threshold for reporting was not met for each group.

18The Mental Health Index™ — The United States | November 2020
November 2020 report
The Mental Stress Change (industry)Mental Stress Change scores for the Finance and Insurance, Manufacturing, and Public Administration industries are less steep when compared to the prior month.
Individuals working in Information and Cultural Industries have the most significant increase in Mental Stress Change (63.6), followed by individuals employed Utilities (61.3), and Food Services (61.2).
Mental Stress changes from the last two months are shown in the table below:
Industry November 2020 October 2020
Finance and Insurance 53.5 56.6
Manufacturing 53.6 53.4
Public Administration 54.5 51.6
Professional, Scientific and Technical Services 54.6 54.7
Construction 54.8 53.6
Other 55.1 55.3
Accommodation 55.6 65.3
Wholesale Trade 56.1 52.1
Retail Trade 56.3 57.2
Educational Services 56.4 55.4
Other services (except Public Administration) 56.6 55.5
I am a student 57.3 59.1
Administrative and Support services 57.9 56.0
Agriculture, Forestry, Fishing and Hunting 58.3 53.3
Arts, Entertainment and Recreation 58.5 61.3
Real Estate, Rental and Leasing 58.6 56.7
Management of Companies and Enterprises 58.9 51.5
Transportation and Warehousing 59.4 56.4
Health Care and Social Assistance 59.6 57.9
Food Services 61.2 62.3
Utilities 61.3 56.8
Information and Cultural Industries 63.6 54.8
19The Mental Health Index™ — The United States | November 2020
November 2020 report
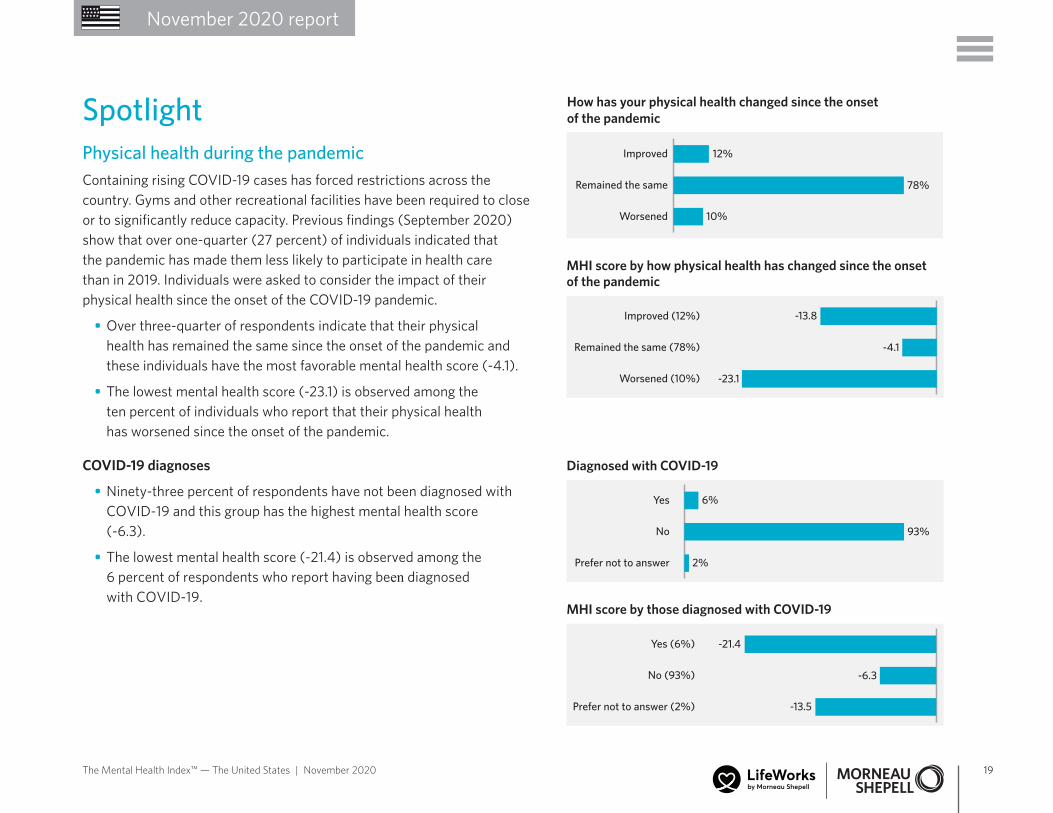
Spotlight Physical health during the pandemicContaining rising COVID-19 cases has forced restrictions across the country. Gyms and other recreational facilities have been required to close or to significantly reduce capacity. Previous findings (September 2020) show that over one-quarter (27 percent) of individuals indicated that the pandemic has made them less likely to participate in health care than in 2019. Individuals were asked to consider the impact of their physical health since the onset of the COVID-19 pandemic.
• Over three-quarter of respondents indicate that their physicalhealth has remained the same since the onset of the pandemic andthese individuals have the most favorable mental health score (-4.1).
• The lowest mental health score (-23.1) is observed among theten percent of individuals who report that their physical healthhas worsened since the onset of the pandemic.
COVID-19 diagnoses
• Ninety-three percent of respondents have not been diagnosed with COVID-19 and this group has the highest mental health score (-6.3).
• The lowest mental health score (-21.4) is observed among the6 percent of respondents who report having been diagnosedwith COVID-19.
How has your physical health changed since the onset of the pandemic
12%
10%
0 10 20 30 40 50 60 70 80 90 100
Worsened
Remained the same
Improved
78%
MHI score by how physical health has changed since the onset of the pandemic
-13.8
-4.1
-35 -30 -25 -20 -15 -10 -5 0
Worsened (10%)
Remained the same (78%)
Improved (12%)
-23.1
Diagnosed with COVID-19
6%
2%
0,0000009,61538519,23076928,84615438,46153848,07692357,69230867,30769276,92307786,53846296,153846105,769231115,384615
Prefer not to answer
No
Yes
93%
MHI score by those diagnosed with COVID-19
-21.4
-13.5
-33,000000 -28,285714 -23,571429 -18,857143 -14,142857 -9,428571 -4,714286 0,000000
Prefer not to answer (2%)
No (93%)
Yes (6%)
-6.3
20The Mental Health Index™ — The United States | November 2020
November 2020 report
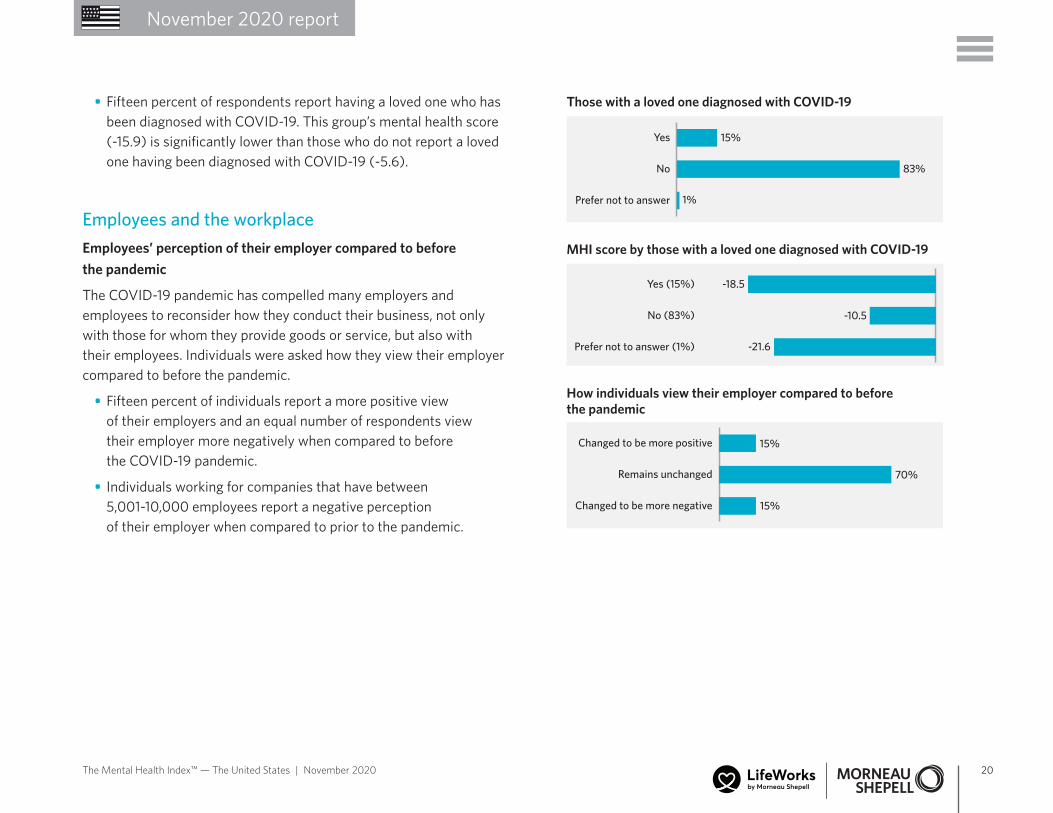
• Fifteen percent of respondents report having a loved one who has been diagnosed with COVID-19. This group’s mental health score (-15.9) is significantly lower than those who do not report a loved one having been diagnosed with COVID-19 (-5.6).
Employees and the workplace Employees’ perception of their employer compared to before the pandemic
The COVID-19 pandemic has compelled many employers and employees to reconsider how they conduct their business, not only with those for whom they provide goods or service, but also with their employees. Individuals were asked how they view their employer compared to before the pandemic.
• Fifteen percent of individuals report a more positive view of their employers and an equal number of respondents view their employer more negatively when compared to before the COVID-19 pandemic.
• Individuals working for companies that have between 5,001-10,000 employees report a negative perception of their employer when compared to prior to the pandemic.
Those with a loved one diagnosed with COVID-19
15%
1%
0 10 20 30 40 50 60 70 80 90 100 110
Prefer not to answer
No
Yes
83%
MHI score by those with a loved one diagnosed with COVID-19
-18.5
-21.6
-25 -20 -15 -10 -5 0
Prefer not to answer (1%)
No (83%)
Yes (15%)
-10.5
How individuals view their employer compared to before the pandemic
15%
15%
0 10 20 30 40 50 60 70 80 90 100 110
Changed to be more negative
Remains unchanged
Changed to be more positive
70%
21The Mental Health Index™ — The United States | November 2020
November 2020 report
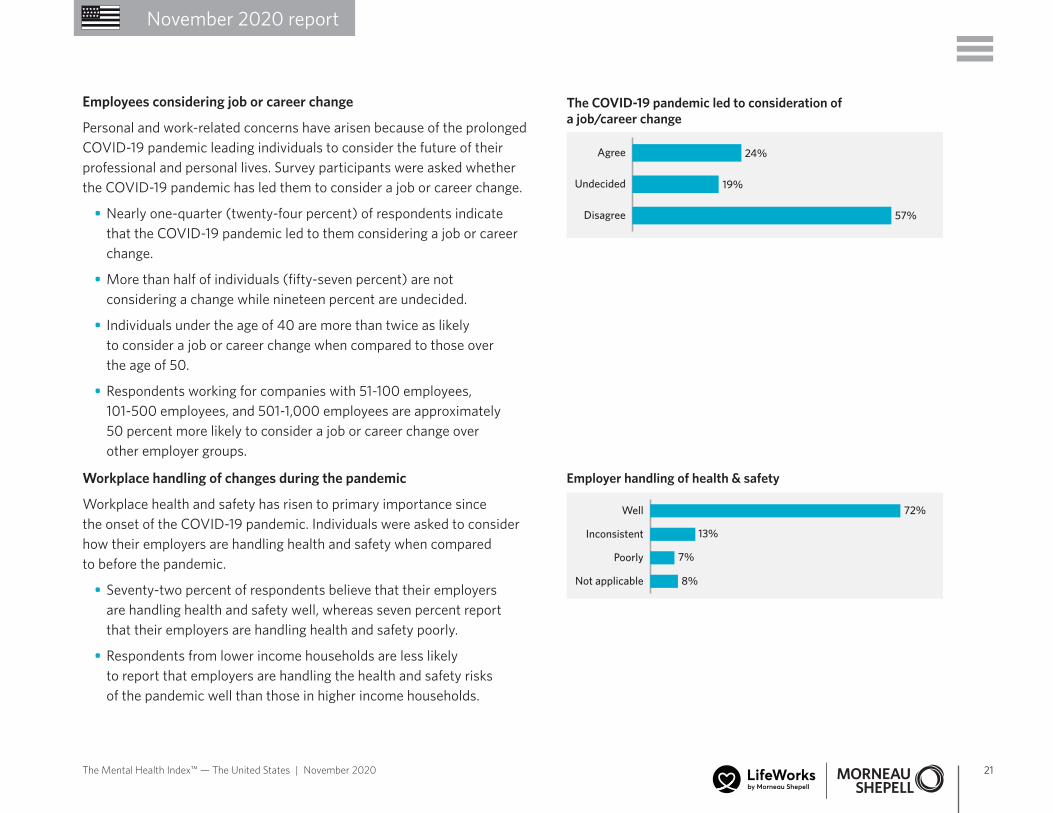
Employees considering job or career change
Personal and work-related concerns have arisen because of the prolonged COVID-19 pandemic leading individuals to consider the future of their professional and personal lives. Survey participants were asked whether the COVID-19 pandemic has led them to consider a job or career change.
• Nearly one-quarter (twenty-four percent) of respondents indicate that the COVID-19 pandemic led to them considering a job or career change.
• More than half of individuals (fifty-seven percent) are not considering a change while nineteen percent are undecided.
• Individuals under the age of 40 are more than twice as likely to consider a job or career change when compared to those over the age of 50.
• Respondents working for companies with 51-100 employees, 101-500 employees, and 501-1,000 employees are approximately 50 percent more likely to consider a job or career change over other employer groups.
Workplace handling of changes during the pandemic
Workplace health and safety has risen to primary importance since the onset of the COVID-19 pandemic. Individuals were asked to consider how their employers are handling health and safety when compared to before the pandemic.
• Seventy-two percent of respondents believe that their employers are handling health and safety well, whereas seven percent report that their employers are handling health and safety poorly.
• Respondents from lower income households are less likely to report that employers are handling the health and safety risks of the pandemic well than those in higher income households.
The COVID-19 pandemic led to consideration of a job/career change
24%
57%
0,000000 10,833333 21,666667 32,500000 43,333333 54,166667 65,000000
Disagree
Undecided
Agree
19%
Employer handling of health & safety
72%
8%
7%
0,000 10,625 21,250 31,875 42,500 53,125 63,750 74,375 85,000
Not applicable
Poorly
Inconsistent
Well
13%

22The Mental Health Index™ — The United States | November 2020
November 2020 report
Businesses and communities are in a state of constant change as they respond to the effects of the COVID-19 pandemic. Communicating with employees during this period of uncertainty is vital to ensure continued confidence, continuity, and engagement. Individuals were asked to consider how their employers are handling employee communications when compared to before the COVID-19 pandemic.
• Sixty-eight percent of respondents report that their employers are handling communications to employees well, whereas nine per cent report that their employers are handling employee communications poorly.
• Younger individuals are less likely to report that employers are handling employee communications well.
• Employer size does not influence whether respondents report that their employer is handling employee communications well.
One of the many consequences of the COVID-19 pandemic is the closing or reduction of in-person workplaces. With a dispersed and remote workforce, employers rely on technology to ensure business continuity and connectedness. Individuals were asked to consider how their employers are handling the use of technology when compared to before the COVID-19 pandemic.
• Sixty-eight percent of respondents report that their employers are handing the use of technology well, whereas seven percent report that their employers are handling the use of technology poorly.
• Individuals between the ages of 40 and 69 report that employers are handling the use of technology well.
Employer handling of communications to employees
68%
8%
9%
0 10 20 30 40 50 60 70 80
Not applicable
Poorly
Inconsistent
Well
15%
Employer handling of technology used by employees
68%
13%
7%
0 10 20 30 40 50 60 70 80
Not applicable
Poorly
Inconsistent
Well
12%
23The Mental Health Index™ — The United States | November 2020
November 2020 report
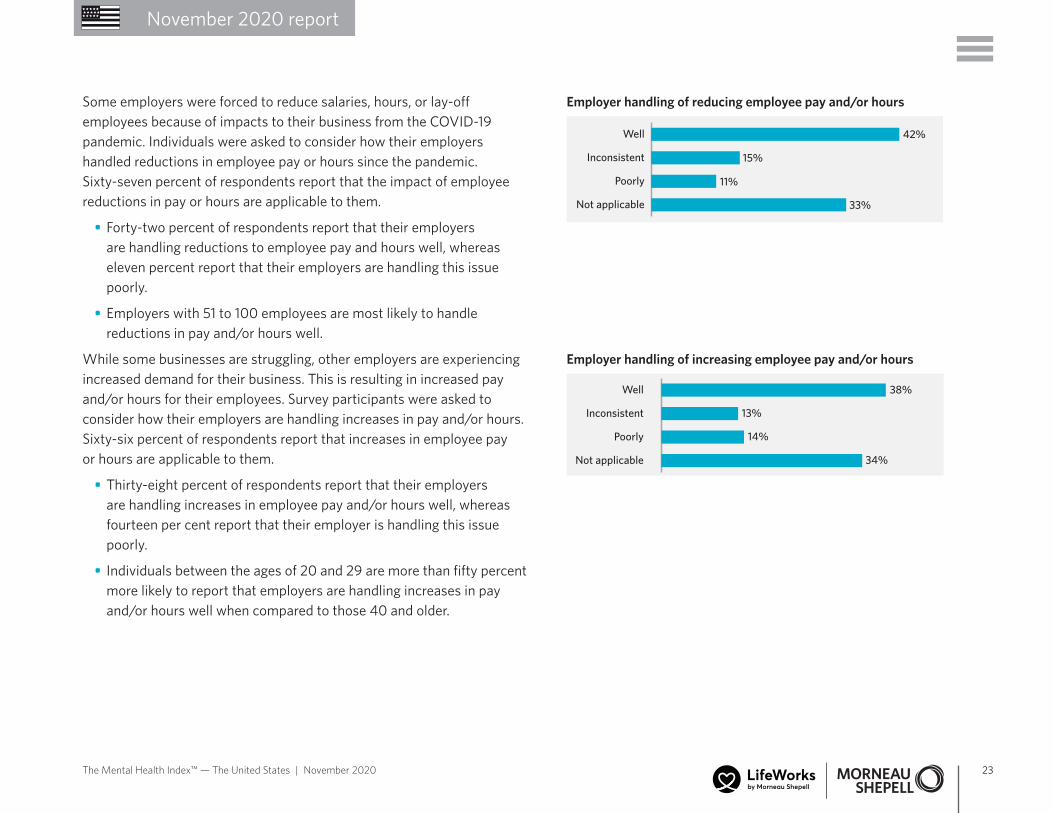
Some employers were forced to reduce salaries, hours, or lay-off employees because of impacts to their business from the COVID-19 pandemic. Individuals were asked to consider how their employers handled reductions in employee pay or hours since the pandemic. Sixty-seven percent of respondents report that the impact of employee reductions in pay or hours are applicable to them.
• Forty-two percent of respondents report that their employers are handling reductions to employee pay and hours well, whereas eleven percent report that their employers are handling this issue poorly.
• Employers with 51 to 100 employees are most likely to handle reductions in pay and/or hours well.
While some businesses are struggling, other employers are experiencing increased demand for their business. This is resulting in increased pay and/or hours for their employees. Survey participants were asked to consider how their employers are handling increases in pay and/or hours. Sixty-six percent of respondents report that increases in employee pay or hours are applicable to them.
• Thirty-eight percent of respondents report that their employers are handling increases in employee pay and/or hours well, whereas fourteen per cent report that their employer is handling this issue poorly.
• Individuals between the ages of 20 and 29 are more than fifty percent more likely to report that employers are handling increases in pay and/or hours well when compared to those 40 and older.
Employer handling of reducing employee pay and/or hours
42%
33%
11%
0 10 20 30 40 50
Not applicable
Poorly
Inconsistent
Well
15%
Employer handling of increasing employee pay and/or hours
38%
14%
34%
0 10 20 30 40 50
Not applicable
Poorly
Inconsistent
Well
13%
24The Mental Health Index™ — The United States | November 2020
November 2020 report
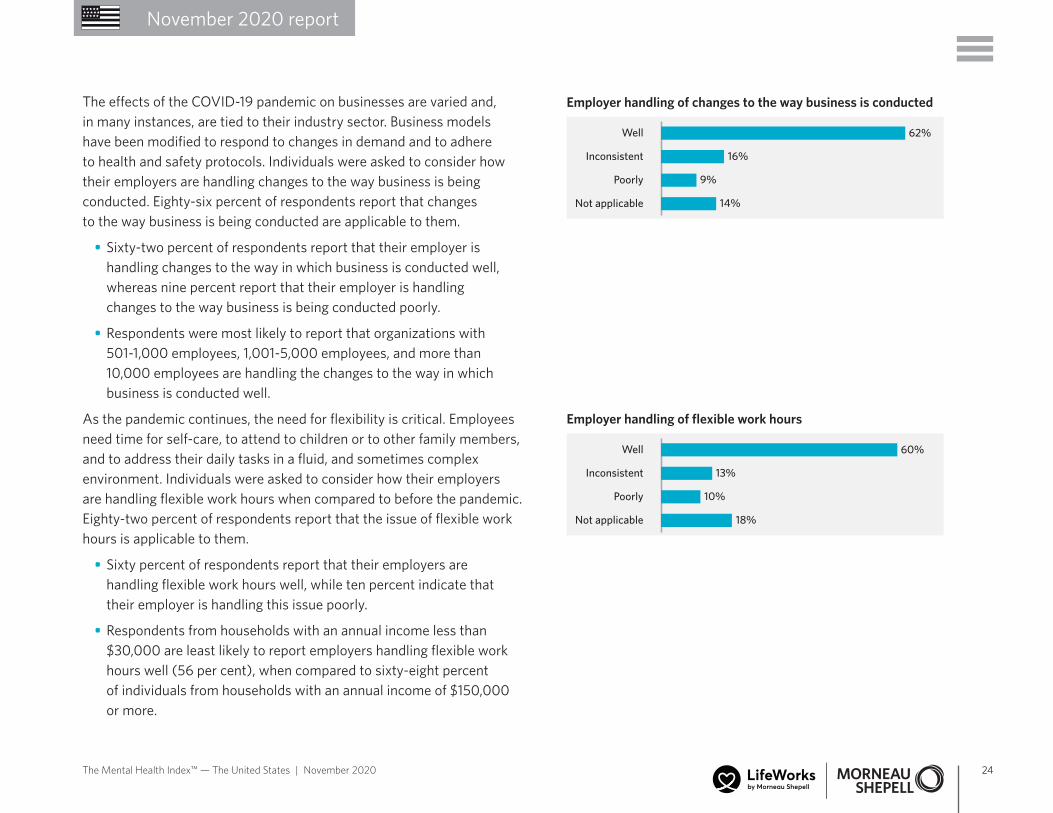
The effects of the COVID-19 pandemic on businesses are varied and, in many instances, are tied to their industry sector. Business models have been modified to respond to changes in demand and to adhere to health and safety protocols. Individuals were asked to consider how their employers are handling changes to the way business is being conducted. Eighty-six percent of respondents report that changes to the way business is being conducted are applicable to them.
• Sixty-two percent of respondents report that their employer is handling changes to the way in which business is conducted well, whereas nine percent report that their employer is handling changes to the way business is being conducted poorly.
• Respondents were most likely to report that organizations with 501-1,000 employees, 1,001-5,000 employees, and more than 10,000 employees are handling the changes to the way in which business is conducted well.
As the pandemic continues, the need for flexibility is critical. Employees need time for self-care, to attend to children or to other family members, and to address their daily tasks in a fluid, and sometimes complex environment. Individuals were asked to consider how their employers are handling flexible work hours when compared to before the pandemic. Eighty-two percent of respondents report that the issue of flexible work hours is applicable to them.
• Sixty percent of respondents report that their employers are handling flexible work hours well, while ten percent indicate that their employer is handling this issue poorly.
• Respondents from households with an annual income less than $30,000 are least likely to report employers handling flexible work hours well (56 per cent), when compared to sixty-eight percent of individuals from households with an annual income of $150,000 or more.
Employer handling of changes to the way business is conducted
62%
9%
14%
0 15 30 45 60 75
Not applicable
Poorly
Inconsistent
Well
16%
Employer handling of flexible work hours
60%
10%
18%
0 15 30 45 60 75
Not applicable
Poorly
Inconsistent
Well
13%

25The Mental Health Index™ — The United States | November 2020
November 2020 report
In addition to flexible work hours, work from home has been driven by the COVID-19 pandemic. Survey participants were asked to consider how their employers are handling work from home policies during the pandemic when compared to before the COVID-19 pandemic. Seventy-three percent of respondents report that work from home is applicable to their workplace.
• Fifty-five percent of respondents report that their employers are handling work from home policies well, whereas eight percent indicate that their employers are handling work from home poorly.
• Respondents from households with an annual income less than $30,000 are least likely to report that employers are handling work from home well (39 percent), when compared to seventy percent of individuals from households with an annual income of $150,000 or more.
• Organizations with more than 50 employees are handling work from home better than organizations with less than 50 employees.
As employees come under increased strain due to the COVID-19 pandemic, many employers are reminding their people of the support and resources available to them to maintain or improve their wellbeing. Individuals were asked to consider how their employers are handling the promotion of resources when compared to before the pandemic.
• Fifty-three percent of respondents report that their employers are handling the promotion of resources well, whereas thirteen percent indicate that their employers are handling this poorly.
• Respondents working for organizations with 2 to 50 are least likely to report that their employers are promoting resources well (45 percent), when compared to sixty-four percent of individuals working for organizations with more than 10,000 employees.
Employer handling of working from home
55%
8%
27%
0 10 20 30 40 50 60 70
Not applicable
Poorly
Inconsistent
Well
10%
Employer handling of promoting resources for employees
53%
13%
19%
0 10 20 30 40 50 60 70
Not applicable
Poorly
Inconsistent
Well
15%
26The Mental Health Index™ — The United States | November 2020
November 2020 report
Parental concerns during the COVID-19 pandemicParents of children under 18 years old
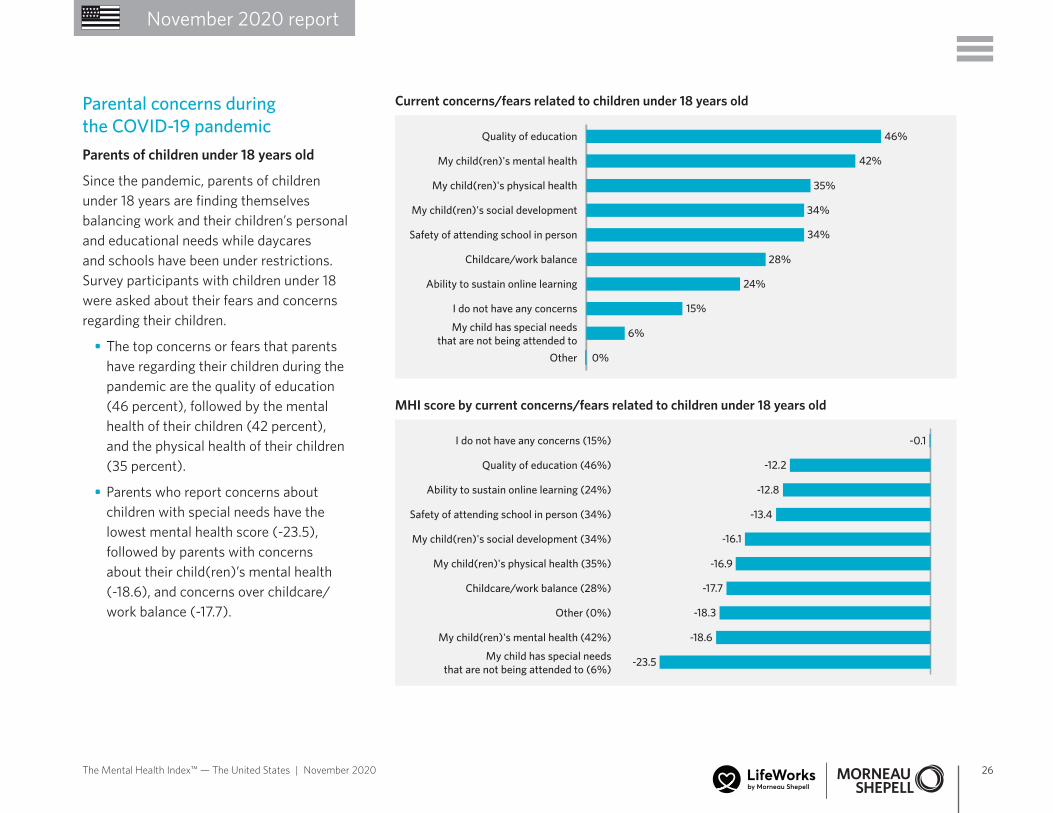
Since the pandemic, parents of children under 18 years are finding themselves balancing work and their children’s personal and educational needs while daycares and schools have been under restrictions. Survey participants with children under 18 were asked about their fears and concerns regarding their children.
• The top concerns or fears that parents have regarding their children during the pandemic are the quality of education (46 percent), followed by the mental health of their children (42 percent), and the physical health of their children (35 percent).
• Parents who report concerns about children with special needs have the lowest mental health score (-23.5), followed by parents with concerns about their child(ren)’s mental health (-18.6), and concerns over childcare/ work balance (-17.7).
Current concerns/fears related to children under 18 years old
0 10 20 30 40 50 60
Other
My child has special needsthat are not being attended to
I do not have any concerns
Ability to sustain online learning
Childcare/work balance
Safety of attending school in person
My child(ren)'s social development
My child(ren)'s physical health
My child(ren)'s mental health
Quality of education 46%
42%
35%
34%
34%
28%
24%
6%
15%
0%
MHI score by current concerns/fears related to children under 18 years old
-50 -40 -30 -20
My child has special needsthat are not being attended to (6%)
My child(ren)'s mental health (42%)
Other (0%)
Childcare/work balance (28%)
My child(ren)'s physical health (35%)
My child(ren)'s social development (34%)
Safety of attending school in person (34%)
Ability to sustain online learning (24%)
Quality of education (46%)
I do not have any concerns (15%) -0.1
-12.2
-12.8
-13.4
-16.1
-16.9
-17.7
-18.6
-18.3
-23.5

27The Mental Health Index™ — The United States | November 2020
November 2020 report
Parents who identified concerns were asked to indicate their greatest concern related to children under 18 years.
• While children’s quality of education is the most reported concern, children’s mental health is the greatest concern (22 percent) and the mental health score of this group is -19.3.
• The lowest mental health score (-20.9) is observed among the one percent of parents who report that their greatest concern is for their child with special needs that are not being attended to.
Greatest concerns/fears related to children under 18 years old
0 5 10 15 20 25
Other
My child has special needsthat are not being attended to
Ability to sustain online learning
My child(ren)'s social development
Safety of attending school in person
Childcare/work balance
My child(ren)'s physical health
Quality of education
My child(ren)'s mental health 22%
21%
16%
15%
12%
10%
1%
4%
0%
MHI score by greatest concerns/fears related to children under 18 years old
-45 -40 -35 -30 -25
My child has special needs that are not being attended to (1%)
My child(ren)'s mental health (22%)
Other (0%)
My child(ren)'s social development (10%)
Childcare/work balance (15%)
My child(ren)'s physical health (16%)
Safety of attending school in person (12%)
Quality of education (21%)
Ability to sustain online learning (4%) -6.8
-8.2
-8.9
-16.6
-17.3
-18.0
-19.3
-18.3
-20.9
28The Mental Health Index™ — The United States | November 2020
November 2020 report
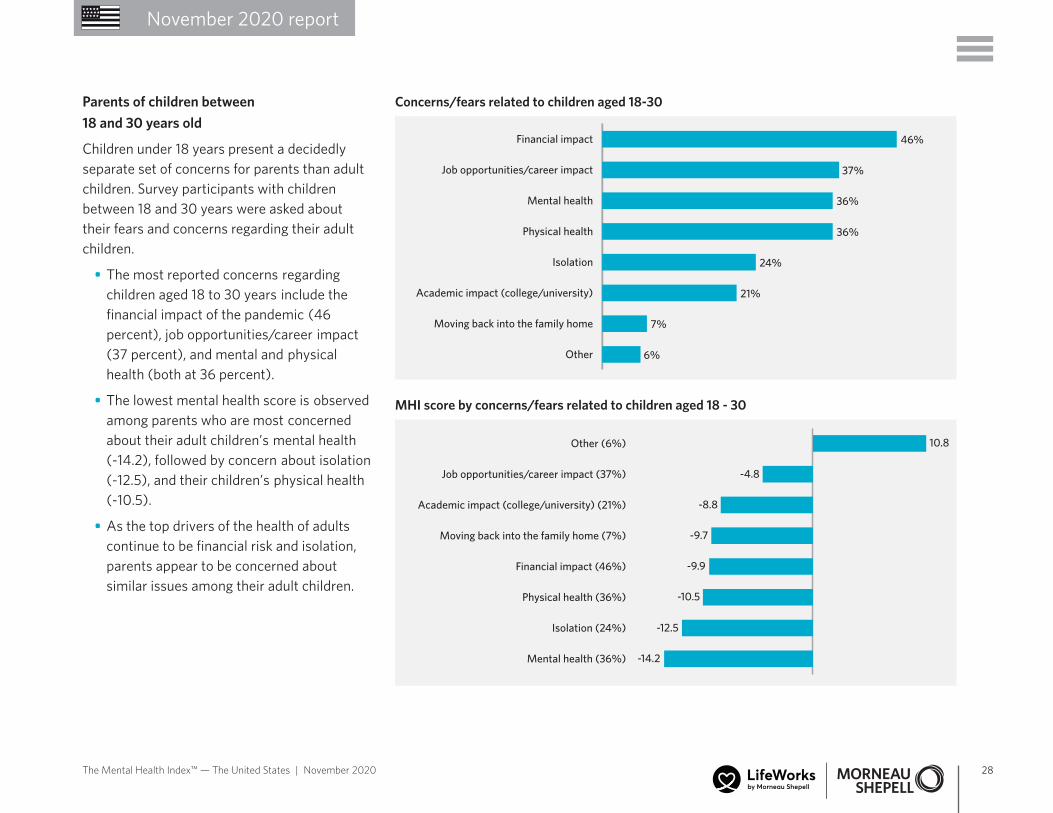
Parents of children between 18 and 30 years old
Children under 18 years present a decidedly separate set of concerns for parents than adult children. Survey participants with children between 18 and 30 years were asked about their fears and concerns regarding their adult children.
• The most reported concerns regarding children aged 18 to 30 years include the financial impact of the pandemic (46 percent), job opportunities/career impact (37 percent), and mental and physical health (both at 36 percent).
• The lowest mental health score is observed among parents who are most concerned about their adult children’s mental health (-14.2), followed by concern about isolation (-12.5), and their children’s physical health (-10.5).
• As the top drivers of the health of adults continue to be financial risk and isolation, parents appear to be concerned about similar issues among their adult children.
Concerns/fears related to children aged 18-30
0 10 20 30 40 50 60
Other
Moving back into the family home
Academic impact (college/university)
Isolation
Physical health
Mental health
Job opportunities/career impact
Financial impact 46%
37%
36%
36%
24%
7%
21%
6%
MHI score by concerns/fears related to children aged 18 - 30
-30 -25 -20 -15 -10
Mental health (36%)
Isolation (24%)
Physical health (36%)
Financial impact (46%)
Moving back into the family home (7%)
Academic impact (college/university) (21%)
Job opportunities/career impact (37%)
Other (6%) 10.8
-4.8
-8.8
-9.7
-9.9
-12.5
-10.5
-14.2

29The Mental Health Index™ — The United States | November 2020
November 2020 report
The U.S. Presidential electionThe divisive U.S. election stimulated a high voter turnout despite the continued COVID-19 pandemic. The data for this report was collected in the days leading up to the election and indicates that a high number of individuals had already voted or planned to vote.
• Eighty-four percent of respondents report having voted or planned to vote in the election.
• At the time of the survey, ten percent of respondents did not plan to vote and 4 per cent were undecided.
• The highest optimism scores in November are observed among individuals who had already voted or planned to vote (-7.3).
Voting in the Presidential election
84%
4%
2%
0 10 20 30 40 50 60 70 80 90 100 110 120 130 140
Prefer not to answer
Undecided about voting
I do not plan to vote
I plan to vote/have voted
10%
Optimism score by those who plan to vote/have voted
-7.3
-14.6
-11.6
-30 -25 -20 -15 -10 -5 0
Prefer not to answer (2%)
Undecided about voting (4%)
I do not plan to vote (10%)
I plan to vote/have voted (84%)
-8.8
30The Mental Health Index™ — The United States | November 2020
November 2020 report
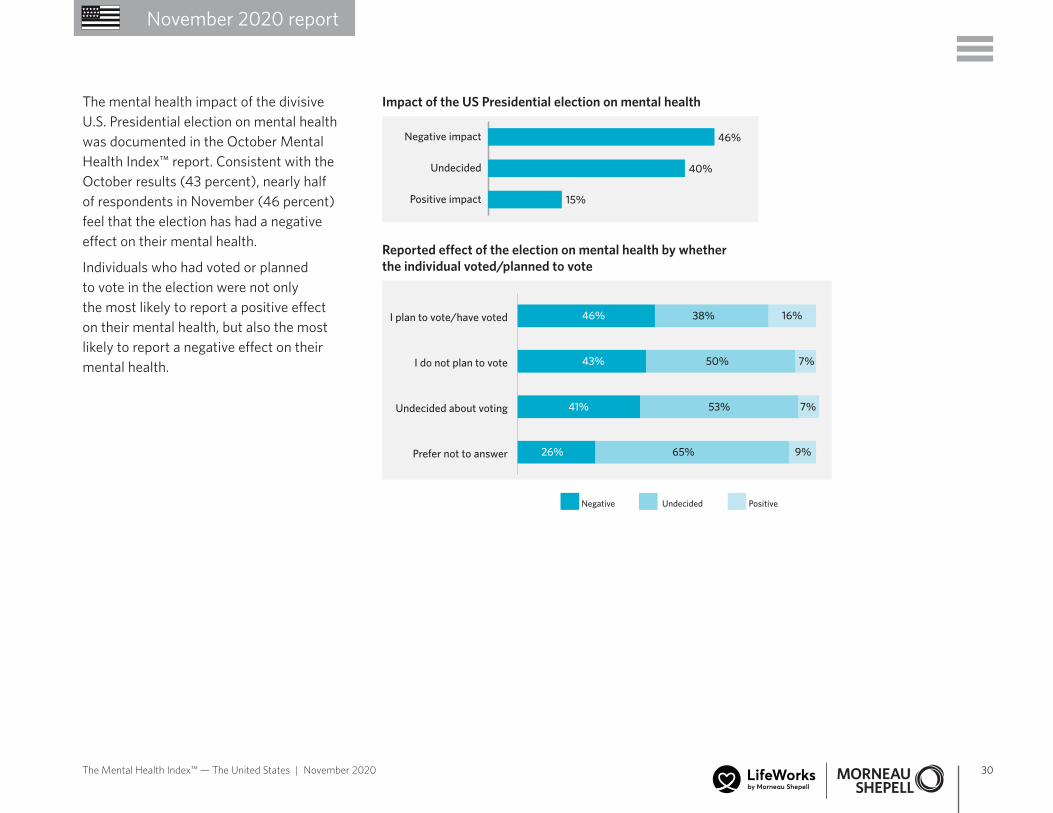
The mental health impact of the divisive U.S. Presidential election on mental health was documented in the October Mental Health Index™ report. Consistent with the October results (43 percent), nearly half of respondents in November (46 percent) feel that the election has had a negative effect on their mental health.
Individuals who had voted or planned to vote in the election were not only the most likely to report a positive effect on their mental health, but also the most likely to report a negative effect on their mental health.
Impact of the US Presidential election on mental health
46%
15%
0 10 20 30 40 50 60
Positive impact
Undecided
Negative impact
40%
PositiveUndecidedNegative
Prefer not to answer
Undecided about voting
I do not plan to vote
I plan to vote/have voted
26% 65% 9%
41% 53% 7%
43% 50% 7%
46% 38% 16%
Reported e�ect of the election on mental health by whether the individual voted/planned to vote

31The Mental Health Index™ — The United States | November 2020
November 2020 report
Overview of the Mental Health Index™The mental health and wellbeing of a population is essential to overall health and work productivity. The Mental Health Index™ provides a measure of the current mental health status of employed adults in a given geography, compared to the benchmarks collected in the years of 2017, 2018 and 2019. The increases and decreases in the Index are intended to predict cost and productivity risks, and inform the need for investment in mental health supports by business and government.
The Mental Health Index™ report has three main parts:
1. The overall Mental Health Index™ (MHI), which is a measure of change compared to the benchmark of mental health and risk.
2. A Mental Stress Change (MStressChg) score, which measures the level of reported mental stress, compared to the prior month.
3. A spotlight section that reflects the specific impact of current issues in the community.
MethodologyThe data for this report was collected through an online survey of 5,000 Americans who are living in the United States and are currently employed or who were employed within the prior six months. Participants were selected to be representative of the age, gender, industry, and geographic distribution in the United States. The same respondents participate each month to remove sampling bias. The respondents were asked to consider the prior two weeks when answering each question. The Mental Health Index™ is published monthly, starting in April 2020. The benchmark data was collected in 2017, 2018 and 2019. The data for the current report was collected between October 25 to November 5, 2020.
CalculationsTo create the Mental Health Index™, the first step leverages a response scoring system turning individual responses to each question into a point value. Higher point values are associated with better mental health and less mental health risk. Each individual’s scores are added and then divided by the total number of possible points to get a score out of 100. The raw score is the mathematical mean of the individual scores.
32The Mental Health Index™ — The United States | November 2020
November 2020 report
To demonstrate change, the current month’s scores are then compared to the benchmark and the prior month. The benchmark is comprised of data from 2017, 2018 and 2019. This was a period of relative social stability and steady economic growth. The change relative to the benchmark is the Mental Health Index™. A score of zero in the Mental Health Index™ reflects no change, positive scores reflect improvement, and negative scores reflect decline.
A Mental Stress Change score is also reported given that increasing and prolonged mental stress is a potential contributor to changes in mental health. It is reported separately and is not part of the calculation of the Mental Health Index™. The Mental Stress Change score is (percentage reporting less mental stress + percentage reporting the same level of mental stress *0.5) * -1 + 100. The data compares the current to the prior month. A Mental Stress Change score of 50 reflects no change in mental stress from the prior month. Scores above 50 reflect an increase in mental stress, scores below 50 reflect a decrease in mental stress. The range is from zero to 100. A succession of scores over 50, month over month, reflects high risk.
Additional data and analysesDemographic breakdown of sub-scores, and specific cross-correlational and custom analyses are available upon request. Benchmarking against the national results or any sub-group, is available upon request. Contact [email protected]
Morneau Shepell is a leading provider of technology-enabled HR services that deliver an integrated approach to employee wellbeing through our cloud-based platform. Our focus is providing world-class solutions to our clients to support the mental, physical, social and financial wellbeing of their people. By improving lives, we improve business. Our approach spans services in employee and family assistance, health and wellness, recognition, pension and benefits administration, retirement consulting, actuarial and investment services. Morneau Shepell employs approximately 6,000 employees who work with some 24,000 client organizations that use our services in 162 countries. Morneau Shepell inc. is a publicly traded company on the Toronto Stock Exchange (TSX: MSI). For more information, visit morneaushepell.com.
@Morneau_Shepell
Morneau Shepell
©2020 Morneau Shepell Ltd. | NMHI-USA_112020