THE MENTAL HEALTH CONTINUUM-SHORT FORM IN …
30
LLEWELLYN ELLARDUS VAN ZYL * & CHANTAL OLCKERS THE MENTAL HEALTH CONTINUUM-SHORT FORM IN ORGANISATIONAL CONTEXTS Factorial Validity, Invariance, and Internal Consistency (Received: 16 November 2018; accepted: 15 June 2019) The study aimed to examine the psychometric properties of the MHC-SF within selected organ- isational contexts. Specifically, the aim was to determine the factorial validity, measurement invari- ance, and reliability of the instrument for South African organisations. A cross-sectional online sur- vey-based research design was employed, coupled with a convenience sampling strategy (N = 624). The results showed that the original three-dimensional factor structure of the MHC-SF fitted the data the best. Items loaded statistically significantly on all three subscales (emotional, psycho- logical, social wellbeing). Further, the scale showed full configure, convergent and metric invari- ance between males and females. However, invariance was not established in either age cohorts, language groups, or marital status. The instrument proved to be reliable at both a lower (Cronbach Alpha) and upper level (Composite reliability) limit within South African organisational contexts. Keywords: Measurement Invariance, Mental Health Continuum Short Form, Mental Wellbeing, Psychometric properties 1. Introduction Mental health, as a construct of interest for organisations, has long been defined as the absence of mental illness (KEYES 2002; 2005; WESTERHOF & KEYES 2008). According to KEYES mental health is conceptualized as a ‘complete state in which individuals are free of psychopathology and flourishing with high levels of emo- tional, psychological and social wellbeing’ (2005, 539). In effect, KEYES (2002) argued that mental health is a function of feeling good (emotional wellbeing) and functioning well (psychological wellbeing; social wellbeing). European Journal of Mental Health 14 (2019) 230–259 https://doi.org/10.5708/EJMH.14.2019.2.2 ISSN 1788-7119 © 2019 Semmelweis University Institute of Mental Health, Budapest * Corresponding author: Llewellyn Ellardus van Zyl, Department of Human Performance Management, Uni- versity of Eindhoven, Eindhoven, the Netherlands; Optentia Research Focus Area, North-West University (VTC), Vanderbijlpark, South Africa; Department of Human Resource Management, University of Twente, the Netherlands; Institut für Psychologie, Goethe University, Frankfurt am Main, Germany; llewellyn101@gmail. com. – Chantal Olckers, Department of Human Resource Management, University of Pretoria,Pretoria, South Africa; [email protected].
Transcript of THE MENTAL HEALTH CONTINUUM-SHORT FORM IN …

LLEWELLYN ELLARDUS VAN ZYL* & CHANTAL OLCKERS
THE MENTAL HEALTH CONTINUUM-SHORT FORM IN ORGANISATIONAL CONTEXTS
Factorial Validity, Invariance, and Internal Consistency
(Received: 16 November 2018; accepted: 15 June 2019)
The study aimed to examine the psychometric properties of the MHC-SF within selected organ -isational contexts. Specifically, the aim was to determine the factorial validity, measurement invari-ance, and reliability of the instrument for South African organisations. A cross-sectional online sur-vey-based research design was employed, coupled with a convenience sampling strategy (N =624). The results showed that the original three-dimensional factor structure of the MHC-SF fittedthe data the best. Items loaded statistically significantly on all three subscales (emotional, psycho-logical, social wellbeing). Further, the scale showed full configure, convergent and metric invari-ance between males and females. However, invariance was not established in either age cohorts,language groups, or marital status. The instrument proved to be reliable at both a lower (CronbachAlpha) and upper level (Composite reliability) limit within South African organisational contexts.
Keywords: Measurement Invariance, Mental Health Continuum Short Form, Mental Wellbeing,Psychometric properties
1. Introduction
Mental health, as a construct of interest for organisations, has long been defined asthe absence of mental illness (KEYES 2002; 2005; WESTERHOF & KEYES 2008).According to KEYES mental health is conceptualized as a ‘complete state in whichindividuals are free of psychopathology and flourishing with high levels of emo-tional, psychological and social wellbeing’ (2005, 539). In effect, KEYES (2002)argued that mental health is a function of feeling good (emotional wellbeing) andfunctioning well (psychological wellbeing; social wellbeing).
European Journal of Mental Health 14 (2019) 230–259https://doi.org/10.5708/EJMH.14.2019.2.2
ISSN 1788-7119 © 2019 Semmelweis University Institute of Mental Health, Budapest
* Corresponding author: Llewellyn Ellardus van Zyl, Department of Human Performance Management, Uni-versity of Eindhoven, Eindhoven, the Netherlands; Optentia Research Focus Area, North-West University(VTC), Vanderbijlpark, South Africa; Department of Human Resource Management, University of Twente, theNetherlands; Institut für Psychologie, Goethe University, Frankfurt am Main, Germany; [email protected]. – Chantal Olckers, Department of Human Resource Management, University of Pretoria,Pretoria, SouthAfrica; [email protected].

Emotional wellbeing, stemming from the Greek concept of hedonic wellbeing,involves the study of happiness that focuses on positive emotions and one’s overalllevel of life satisfaction or affect balance (DIENER 1984; SELIGMAN 2011; UCHIDA etal. 2004). Specifically, happiness relates to dynamic positive affective experiences(‘states’) that encompass positive thoughts, feelings, behaviours and attitudes, whichfluctuate over time but remain at a positive median (GAVIN & MASON 2004). Accord-ing to DIENER and BISWAS-DIENER (2008), happy people tend to live longer, are health-ier, have more fulfilling jobs, and form personal relationships of a better quality.
Functional wellbeing, also known as eudaimonic wellbeing, incorporatesaspects of psychological wellbeing (RYFF 1989) and social wellbeing (KEYES 2002)and reflects one’s meaning in life. According to the eudaimonic approach, happinessis more related to positive relationships and a sense of purpose in life than the ex -perience of mere positive emotions. Wellbeing in this context means to function wellin life and is related to personal growth and fulfilment (PERUGINI et al. 2017).
KEYES (2002; 2005) unified the hedonic and eudaimonic perspectives of well-being and developed the Mental Health Continuum (MHC) and Mental Health Con-tinuum–Short Form (MHC-SF) to measure these wellbeing components, also knownas flourishing. The MHC and MHC-SF assess the degree of mental health acrossthree domains: emotional wellbeing (feeling well) and psychological and social well-being (functioning well).
Emotional wellbeing (EWB) consists of the presence of positive emotions andsatisfaction with life (DIENER et al. 1999). Psychological wellbeing (PWB) measureshow much individuals see themselves thriving in their personal life (KEYES 2002) andincludes aspects of an individuals’ psychological functioning such as self-acceptance,autonomy, and having meaning in life and a purpose (RYFF 1989). Social wellbeing(SWB) captures an individuals’ social integration and contribution as a member ofa larger society. Social wellbeing evaluates the individuals’ assessment of their socialand public lives and includes dimensions of social integration, social contribution,social coherence, social actualisation, and social acceptance (KEYES 2002).
The wellbeing of individuals on the MHC and MHC-SF is measured on a con-tinuum that includes three varying levels of positive mental health: from flourishing,to moderately mentally healthy, to languishing (KEYES 2005). Flourishing individualsare high in hedonic and positive functioning and thus experience high levels of emo-tional, psychological, and social wellbeing. Languishing individuals, however, arelow in hedonic and positive functioning and thus display low wellbeing and anabsence of mental health.
A mentally healthy or flourishing workforce is not only beneficial to individuals(i.e. in terms of longevity, mental fitness, buffers against the onset of illness) but alsodramatically impacts on organizational outcomes such as performance, productivity,staff retention, quality of work and excellent customer service (ROTHMANN 2014;2013; SELIGMAN 2011). Individuals with high amounts of wellbeing were, for ex -ample, found to display higher amounts of resilience (BURNS et al. 2011), and optimism(CARVER & SCHEIER 2014; PETERS et al. 2010; WU et al. 2013), and were additionally
THE MENTAL HEALTH CONTINUUM-SHORT FORM 231
EJMH 14:2, December 2019

found to make use of adequate coping strategies (CARVER & CONNOR-SMITH 2010),and psychological flexibility (KASHDAN & ROTTENBERG 2010; WOODRUFF et al. 2014).With respect to the organizational level, individuals with high amounts of wellbeingwere among others found to function much better at the workplace. This excellentfunctioning is illustrated through the increased efficiency and capacity to perform atwork, through the enhanced initiative, interest and responsibility, as well as througha heightened concern for the organisation and the colleagues (FAIRBROTHER & WARN
2003). The beneficial effects of mentally healthy employees for organisations, as wellas the possibility to influence wellbeing through the use of simple interventions, haveincreased the popularity of wellbeing and mental health promotion within the work-ing environment (BONDE 2008). Given that mental health is such a beneficial com-ponent for both individual and organisational outcomes, it is imperative to measureit accurately within organizational contexts.
Although the psychometric properties of the MHC-SF were determined in sev-eral other studies across many countries, this study expands on the previous studies ina number of ways: (a) it assesses all known factor structures of the MHC-SF in organ-isational contexts, (b) the measurement invariance of the MHC-SF will be studiedbetween different genders and across age cohorts, language groups and relationshipstatuses of individuals and (c) the internal consistency will be determined by calcu-lating not only Cronbach’s alpha values but composite reliabilities as well.
1.1. Factorial validity
The MHC-SF have been adapted in many countries, providing a considerable volumeof evidence to support not only the utility, but the validity and reliability of the instru-ment. Several previous studies have confirmed the three-factor structure (EWB, SWB,PWB) of the MHC-SF using confirmatory factor analyses (CFA). For example, KARAŚ
and colleagues(2014) on a Polish sample; LAMERS and colleagues (2011) on a Dutchsample; PETRILLO and colleagues (2015) in the Italian context; GUO and colleagues(2015) in Chinese adolescents, SALAMA-YOUNES and ISMAÏL (2011) in a sample fromEgypt, and JOSHANLOO and colleagues (2013), across three cultural groups: Dutch,South African, and Iranian. In contrast, in a 38-country comparison on the factor struc-ture of the MHC-SF, ŻEMOJTEL‐PIOTROWSKA and colleagues (2018) could not find ade-quate data fit (i.e. CFI > 0.90) for the three-factor model within samples from Algeria,Armenia, Bulgaria, Chile, Colombia, India, Iran, Kenya, Latvia, Nepal, Panama, Pak-istan, Puerto Rico, Serbia, Slovakia, and Spain. These authors also did not find supportfor a one factor structure of overall wellbeing in any of the surveyed countries(ŻEMOJTEL‐PIOTROWSKA et al. 2018). Further, with the exclusion of Kazakhstan,Malaysia and the Ukraine, ŻEMOJTEL‐PIOTROWSKA and colleagues (2018) also did notfind support for a two-factor structure (i.e. hedonic and eudaimonic wellbeing) of theMHC-SF. Despite these findings, the three-factor structure is predominantly reportedas the best-fitting model within diverse cultural contexts such as South Africa (ROTH-MANN 2013; SCHUTTE & WISSING 2017; ŻEMOJTEL‐PIOTROWSKA et al. 2018).
L.E. VAN ZYL & CH. OLCKERS232
EJMH 14:2, December 2019

Although only a small number of studies investigated specifically the factorialvalidity of the MHC-SF within the South African context, several structural equationmodelling (SEM) studies, employing a CFA measurement modelling strategy, havebeen shown to be a better fit for the three-factor correlated structure rather than a twoor one factor model. Both DE BRUIN and DU PLESSIS (2015) and VAN ZYL and ROTH-MANN (2012a) confirmed the three-factor structure in a multi-cultural sample of highereducation students; KEYES and colleagues (2008) the same within the general popula-tion of collectivistic Tswana-speaking individuals from a rural area in the North-WestProvince; VAN RENSBURG and colleagues (2017) within a sample of employed individ-uals within the information technology sector; ŻEMOJTEL‐PIOTROWSKA and colleagues(2018) within the general population and NIEMAND (2019) in a sample of industrialand organisational psychologists. Neither the one or two factor structures reported inother international papers have been found to fit the data better than the three-factorstructure within the South African context. Therefore support exists that the threecomponents of mental health presented by KEYES (2002) and measured by the MHC-SF, are applicable to the diverse, multi-cultural, and socio-economically divided po -pu lation within South Africa. However, the fit indices of several of these studies wereonly marginally acceptable according to conventional criteria (BROWN 2006). Further,according to JOVANOVIC (2015), in a three-factor structure, the effects of general well-being are not controlled for, with the result that there is limited evidence for each sub-scale reflecting a variation on the specific component of wellbeing.
Therefore, several other researchers (DE BRUIN & DU PLESSIS 2015; HIDES et al.2016; JOVANOVIC 2015; ŻEMOJTEL-PIOTROWSKA et al. 2018) extended their researchinto the validity of the MHC-SF by testing a bi-factor model. They provided evidencethat a bi-factor model, consisting of one general factor of overall mental health andthe three factors of EWB, SWB, PWB, where each item was allowed to load both onthe general factor (overall wellbeing) and specific factor (EWB, SWB, PWB) (REISE
et al. 2016), provided the best-fitting solution. It was, however, found in the studyconducted by JOVANOVIC (2015) that although the bi-factor model provided strongsupport for the general factor of wellbeing for the MHC-SF , some of the PWB andSWB items did not display significant loadings on their specific factors, thus provid-ing limited evidence for a viable multi-dimensional structure of the MHC-SF.MACHADO and BANDEIRA (2015) employed various techniques such as principal com-ponent analysis, factor analysis, Item Response Theory and network analysis to deter-mine the psychometric properties of the MHC-SF among Brazilian-Portuguesespeaking adults and found support for a unidimensional structure of the MHC-CF.
Both JOSHANLOO (2016a) in an Iranian sample, and JOSHANLOO and colleagues(2017) in a New Zealand context, found support for the tripartite model of mentalwellbeing in comparison with one- and two-factor models using both ExploratoryStructural Equation Modeling (ESEM) and CFA. However, ESEM provided a moresensitive fit and greater factor distinctiveness to the data than did CFA.
The results of a study conducted by LONGO and colleagues (2017) in four coun-tries (The Netherlands, Poland, Portugal, and Serbia) indicated that a bifactor ESEM
THE MENTAL HEALTH CONTINUUM-SHORT FORM 233
EJMH 14:2, December 2019
model, in comparison to a three-factor ESEM and three-factor CFA, provided thebest fit to the data in all samples. Thus, this supports the bifactor structure of wellbe-ing with a strong general factor explaining most of the variance in the items. Simi-larly, SCHUTTE and WISSING (2017) reported that a bifactor model displayed a su -perior fit among a culturally diverse South African sample.
Although various factorial permutations of the MHC-SF are reported in the lit-erature, it would seem as though the three-factor structure is the most frequentlyoccurring and best-fitting model across cultures, continents, and population groups.Given that the three-factor mental health structure predominantly shows a superiorfit within the South African context, it is presumed that such will fit the data the bestwithin the sample of employees from South African organisations.
1.2. Measurement invariance
Various studies have attempted to establish the invariance of the MHC-SF for demo-graphic characteristics, and the results varied between sample types, cultures, andnations. For example, in a 38-country comparative study on the structure and applica-tion of the MHC-SF, ŻEMOJTEL-PIOTROWSKA and colleagues (2018) could not establishfull or strong invariance between different nations (i.e. different cultures). This indicatesthat the way in which mental health is perceived and the components of the MHC-SFare interpreted, differs significantly between cultures. This is not surprising as KEYES
(2002) argued that demographic characteristics such as culture, gender, age, level ofeducation, relationship status, language group and occupational status might affectongoing mental health. It is therefore important to investigate the invariance on variousdemographic characteristics within multi-cultural contexts such as South Africa.
Measurement invariance of the MHC-SF across gender in several diverse cul-tures was reported in various previous studies suggesting that the same basic factorstructure (configural invariance), similar factor loadings (full metric invariance), andno differences in the intercepts were found between the genders (GUO et al. 2015;JOSHANLOO 2016b; JOSHANLOO & JOVANOVIĆ 2016; KARAŚ et al. 2014; LAMERS et al.2011; PETRILLO et al. 2015). Using differential item functioning, MACHADO and BAN-DEIRA (2015) reported no difference between the two gender groups. However, itshould be noted that these studies investigated the measurement invariance of theMHC-SF across genders within primarily individualistic cultures, where genderdiversity is valued.
WESTERHOF and KEYES (2010) reported partial support for differences betweenage groups. They found that older adults experience more emotional, similar social andless psychological wellbeing in comparison to younger adults. GUO and colleagues(2015) reported measurement invariance across ages amongst Chinese adolescents.
SCHUTTE and WISSING (2017) reported full configural, but partial metric andscalar equivalence across three language groups within South Africa: English,Afrikaans and Setswana speakers. No studies could be found that tested for measure-ment invariance across language groups within organisational contexts.
L.E. VAN ZYL & CH. OLCKERS234
EJMH 14:2, December 2019

Further, no studies were found establishing measurement invariance betweenindividuals in different relationship/marital status groups. Research suggests that sig-nificant differences in the levels of mental health exist between married and unmarriedindividuals (DIENER et al. 2000; CHAPMAN & GUVEN 2016; QIAN & QIAN 2015; VEEN-HOVEN 2015). Married individuals report to be healthier, happier, and live longer thantheir unmarried counterparts (DIENER et al. 2000). Within the marital dynamic, theinterpretation of individual emotional, psychological and social wellbeing couldlargely be influenced by the nature and quality of the relationship (CHAPMAN & GUVEN
2016). HELLIWELL and PUTMAN (2004), in their study across a US and Canadian sam-ple, found that marriage seems to increase subjective wellbeing equally among menand women and is further enhanced by the presence of children. Having regular inter-action and spending more time with the family increases individual-level subjectivewellbeing. The wellbeing of the family (as a unit), directly influences the wellbeingof the individual members (HELLIWELL & PUTMAN 2004; KAMP DUSH & AMATO 2005).Further, within collectivistic cultures, such as those found predominantly within SouthAfrica, the wellbeing of the family is not distinguishable from the wellbeing of theindividual (DIENER & SUH 2003). It seems that being in a romantic relationship is notonly beneficial to people’s health and happiness, due to the social support and socialintegration that it provides, but could affect how wellbeing is seen, perceived andinterpreted. The relationship status could therefore affect how the components of men-tal health are perceived, interpreted and experienced. Testing measurement invarianceacross genders, age cohorts, language groups and between different relationship/mari -tal status does not serve to test the scale structure, but to determine whether there isa possibility to allow meaningful cross-gender, -age, -language and –relationship sta-tus comparisons of the strength of the relationship between the latent factor of thescale and other constructs (metric); to meaningfully compare latent means betweenmales and females, age cohorts, language groups, and between individuals having dif-ferent relationships/marital status (scalar); and to check whether identical patterns offactors and items exist across all these groupings (configural).
Therefore, the current study aims to investigate the configural, metric, andscalar measurement invariance across genders, age cohorts, language groups andbetween different relationships/marital status within South African organisationalcontexts.
1.3. Reliability
The internal consistency of the MHC-SF has been determined in various studiesacross a number of countries and was found to be a reliable measurement of wellbe-ing. In studies where the MHC-SF was presented as a three-factor structure, accept-able Cronbach’s alpha values well above 0.70 were reported (GUO et al. 2015; KARAŚ
et al. 2014; LAMERS et al. 2011; PETRILLO et al. 2015). In these studies, for example,alpha values ranging between 0.86 and 0.92 were reported for the total MHC-SF;coefficients ranging between 0.81 and 0.86 for the psychological wellbeing subscale;
THE MENTAL HEALTH CONTINUUM-SHORT FORM 235
EJMH 14:2, December 2019

values ranging between 0.75 and 0.92 for the emotional wellbeing scale and valuesbetween 0.70 and 0.83 for the subjective wellbeing scale. Predominantly, the internalconsistency of the MHC-SF was estimated through the use of Cronbach’s alpha,which often resulted in over- or underestimation of the reliability because it assumedthat the factor loadings and error variances were equal (CHO & KIM 2015). Given thechallenges and critiques associated with the use of Cronbach’s alpha, an investigationwas done and only one study was found that used a more ‘accurate’ estimation ofinternal consistency (i.e. composite reliability) (WANG & WANG 2012). MACHADO andBANDEIRA (2015) calculated the rho coefficients (as a measure of composite reliabil-ity) of the MHC-SF in a bi-factor model and reported a value of 0.90 for the generalfactor of wellbeing while the rho coefficients ranged between 0.34 and 0.47 for thethree sub-factors.
In the majority of studies where a bifactor model of the MHC-SF was con-firmed, coefficient omega hierarchical (ωh) was used to measure reliability. Accord-ing to ZINBARG and colleagues (2005), omega hierarchical outperforms Cronbach’salpha because it indicates the reliability of the general trait controlling for specificfactor variance. As a rule of thumb, a minimum of 50%, preferably 75% of subscalevariance, should be accounted for before a subscale is considered to be a valid rep-resentation of a separable dimension (REISE et al. 2016). JOVANOVIĆ (2015) reporteda high reliability as estimated by the omega coefficient for the general factor of well-being: (ωh) = 0.81 in a student sample and 0.83 in an adult sample), but low omega-subscale coefficients. The reliabilities of the EWB, SWB, and PWB subscalesreported were 0.28, 0.32, 0.10 in the student sample and 0.31, 0.35, 0.07 in the adultsample, respectively. These results illustrated that the ability of the subscales to reli-ably measure the specific variances of EWB, SWB and PWB is low, because theyreflect variations primarily on the general wellbeing factor. These results wereaffirmed by DE BRUIN and DU PLESSIS (2015), who reported a McDonald’s coeffi-cient ω-hierarchical for the general factor of 0.74 and coefficient ω-specific of 0.26,0.38 and 0.19 for the EWB, PWB and SWB subscales respectively. Similarly, HIDES
and colleagues (2016) as well as LONGO and colleagues (2017) found only the generalfactor of wellbeing to be reliable as evidenced by an omega hierarchical (ωh) of above 0.80. However, the sub-factors were not reliable, with all ωhs below 0.41.
As such, the current study aims to determine the internal consistency of theMHC-SF at both the lower (Cronbach’s alpha ≥ 0.70) and upper (composite reliabil-ity/rho coefficients > 0.80) level limits.
1.4. Current study
Based on the discussion above, the purpose of this study was to examine the psy-chometric properties of the MHC-SF within selected organisational contexts. Specif-ically, the aim was to determine the (a) factorial validity, (b) measurement invari-ance between genders and across age cohorts, language groups and relationshipstatus, as well as (c) to determine the reliability of the instrument for South African
L.E. VAN ZYL & CH. OLCKERS236
EJMH 14:2, December 2019

organisations. It was expected that the instrument validly, invariably, and reliablymeasures mental health within the South African business environment.
2. Methods
2.1. Participants
A convenience sampling strategy, following a descriptive cross-sectional survey-based research design, was employed to withdraw 624 respondents from variousSouth African organisations. The demo- and biographic information of the respond -ents is summarized in Table 1.
Table 1Demo- and biographic characteristics
THE MENTAL HEALTH CONTINUUM-SHORT FORM 237
EJMH 14:2, December 2019
Variable Category Frequency (f) Percentage (%)
GenderMale 285 45.7
Female 339 54.3
Age in years
19 to 29 years 158 25.3
30 to 39 years 182 29.2
40 to 49 years 131 21.0
50+ years 153 24.5
Ethnicity
Asian 47 7.5
African 203 32.5
Coloured 61 9.8
Caucasian 286 45.8
Other 27 4.3
Home Language
English 166 26.6
Afrikaans 216 34.6
African 242 38.8
Level of Education
Grade 11 and below 1 0.2
Grade 12 149 23.9
National Certificate 72 11.5
Higher Certificate 30 4.8
Bachelor’s Degree 97 15.5
Master’s Degree 272 43.6
Doctoral Degree 3 0.5
Marital Status
Single 128 20.5
Married 290 46.5
Divorced or Widowed 206 33.0

The majority of the participants was married (46.5%) Afrikaans speaking(34.6%) Caucasian (45.8%) females (54.3%) between the ages of 30 to 39 (29.2%)with a master’s degree (43.6%). Further, almost all the participants were full-time,permanent employees (98.4%) of their respective companies.
2.2. Procedures
The sample consisted of three independent organisations where the MHC-SF scalewas used. The procedure involved the distribution of electronic surveys usingLimeSurvey™ to various organisations within the broader South African context. Pri-marily, the sample consisted of registered industrial psychologists, selected Blue ChipFinancial Companies, and a Public Utility. The data was captured online and storedon a secure SQL server for later retrieval. The data was downloaded in MS Excel for-mat and prepared for analysis in both SPSS and Mplus.
2.3. Measures
The following instruments were used to gather data for this study:A self-developed biographical questionnaire was used to gather biographic
information of the participants relating to gender, ethnicity, age group, home lan-guage, level of education, marital status and employment status.
The Mental Health Continuum – Short Form (MHC-SF; KEYES 2002; 2005) wasused to measure the emotional, psychological, and social wellbeing of the participants.The instrument consisted of 14 items, which were rated on a five-point Likert scaleranging from 1 (all of the time) to 5 (none of the time). Examples of the items areDuring the last month how often did you feel . . . ‘happy’ (EWB), ‘that the way inwhich our society functions, makes sense to you’ (SWB) and ‘confident to think orexpress your own ideas and opinions’ (PWB). High levels of internal consistencyhave been found in various clinical studies ranging from Cronbach Alpha levels of0,7 to 0,9 (KEYES et al. 2002; KEYES & SHAPIRO 2004).
2.4. Analysis
The statistical analysis was conducted with the aid of SPSS 24 (IBM 2016) andMplus version 8 (MUTHÉN & MUTHÉN 2017). First, factorial validity was estimatedthrough a confirmatory factor analytic (CFA) approach; employing the maximumlikelihood estimator (MUTHÉN & MUTHÉN 2017). Structural equation modelling(SEM) was employed to assess the model fit for the competing measurement modelswhereby the following fit indices were considered: a) absolute fit indices whichincluded the χ2 statistic, the Root-Means-Square Error of Approximation (RMSEA)and the Standardized Root Mean Residual (SRMR), b) incremental fit indices,including the Comparative Fit Index (CFI) and the Tucker-Lewis Index (TLI) and c)comparative fit indices, Akaike information criterion (AIC), and Bayesian information
L.E. VAN ZYL & CH. OLCKERS238
EJMH 14:2, December 2019

criterion (BIC) were used to compare competing models. Model fit is consideredwhen the TLI and CFI are greater than 0.90, and RMSEA and SRMR are lower thanthe 0.05 and 0.08 cut-offs (WANG & WANG 2012). Further, the lowest AIC, BIC andχ2 values indicate the best fitting model (MUTHÉN & MUTHÉN 2017).
Second, to assess the internal consistency or ‘reliability’ of the MHC-SF, bothCronbach Alpha (lower-bound) and Rho (upper-bound) were estimated. Rho is calcu-lated through the use of ROTHMANN’S (2013) rho calculator, which estimates internalconsistency through the proportion variance explained by a factor divided by the totalvariance (WANG & WANG 2012). Reliability cut-offs are set at 0.70 (Cronbach Alpha;NUNNALLY & BERNSTEIN 1994) and 0.80 (Rho; WANG & WANG 2012) respectively.
Finally, measurement invariance was investigated based on gender, age cohorts,predominant languages in the South African culture, and relationship/marital status.Configural (similar factor structures), metric (similar factor loadings), and scalar(similar intercepts) invariance was computed. Before invariance testing could becomputed, the sampling adequacy for each demographic characteristic needed to beestablished. The Kaiser-Meyer-Olkin (KMO) measure of sampling adequacy wasemployed to assess the adequacy of the sample size for each sub-sample of the demo-graphic characteristics which were to be employed for invariance testing (p < 0.01;KMO < 0.70) (CERNY & KAISER 1977). To assess whether MHC-SF was perceivedsimilarly or differently by respondents of different genders, ages, and languagegroups: configural- (similar factor structure / model form), metric- (equivalence ofthe item loadings), and scalar (similar intercepts) invariances were computed. Invari-ances estimation was based on non-significant (p > 0.05) (a) chi-square (Δχ2) as wellas (b) ΔCFI differences between the configural, metric, and scalar invariance models(WANG & WANG 2012). Further, (c) changes greater than 0.01 in the magnitude of theCFI were regarded as an indication that the more restrictive model should be rejected(WANG & WANG 2012). Finally, (d) all invariance models needed to meet the cut-offcriteria of the fit-indices mentioned above. Invariance was only established if all fourof these conditions (non-significant Δχ2 & ΔCFI, ΔCFI > 0.01 and model fit) weresimultaneously satisfied (CHEN 2007; CHEUNG & RENSVOLD 2002; VAN DE SCHOOT etal. 2012; VANDENBURG & LANCE 2000). If the conditions for strong invariance werenot met, and at least two out of the three invariant model comparisons showed non-significant differences (e.g. metric vs configural and scalar vs. configural), partialinvariance testing was pursued. A top-down approach would be employed where con-straints were sequentially released on parameters that lacked invariance (BYRNE
2012; VAN DE SCHOOT et al. 2012). If the conditions for partial scalar invariance weremet, the variance and means of the common factors were evaluated to determine ifthese were invariant. Here, common factor means and variances would be con-strained to be equal (WANG & WANG 2012).
In instances where full/strong or partial invariance was established, latent meandifferences between the groups were computed and categorically compared. Here,one group was identified as a reference group (its mean is set to zero), whilst thecomparative groups’ mean was estimated freely. Should the comparative group’s
THE MENTAL HEALTH CONTINUUM-SHORT FORM 239
EJMH 14:2, December 2019

latent mean differ significantly from zero, then groups are found to differ signifi-cantly from one another (BYRNE 2012; WANG & WANG 2012).
3. Results
To test the six hypotheses of this study, the results of the factorial validity, measure-ment invariance, and internal consistency (reliability) will be separately reported. Theresults will be presented in tabulated format with a brief subsequent interpretation.
3.1. Factorial Validity
To determine the factorial validity of the MHC-SF, CFA approach was employedcomparing all theoretically known factor structure permutations of the MHC-SF.A competing measurement model strategy was employed where these theoreticalmodels were systematically compered through (exploratory) structural equation mod-elling. No items were omitted, and observed/measured items were used as indicatorsof the latent variables within these measurement models (WANG & WANG 2012).These observed variables (measured items) were treated as continuous variables(given the level of measurement) and measurement error terms were uncorrelated.Neither item parcelling nor correlations between items, or error terms, was allowed.
The following models were tested:Model 1 was hypothesized as a unidimensional factorial model of overall men-tal health which consisted of all the 14 items (Figure 1).Model 2 was specified as the original theoretical model proposed by KEYES
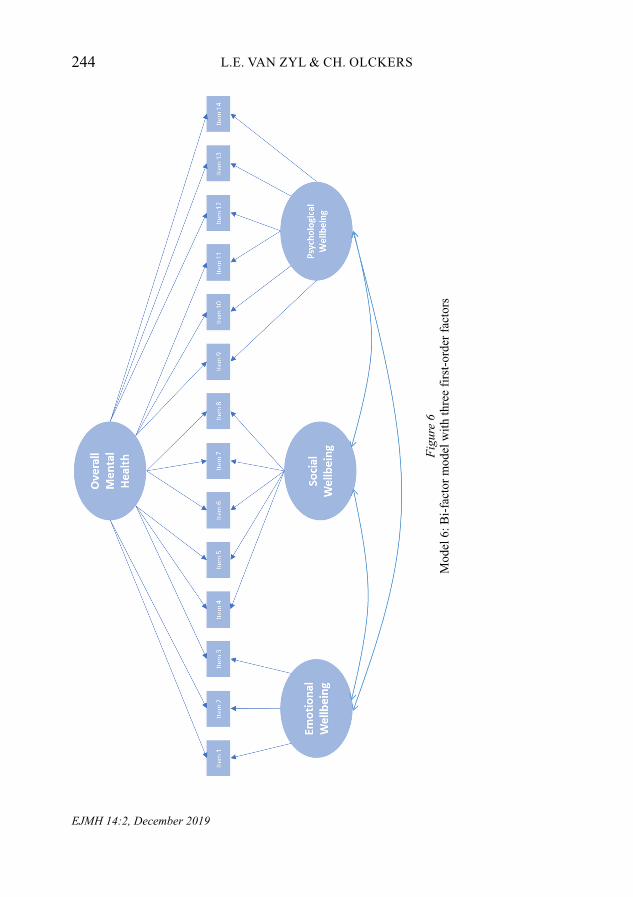
(2002), which was comprised of three first-order factors consisting of EWB(Item 1, 2 &3), SWB (Item 4, 5, 6, 7 & 8), and PWB (Item 9, 10, 11, 12, 13 &14) (Figure 2).Model 3 was hypothesised as a second order hierarchical model was comprisedof three first-order factors consisting of EWB (Item 1, 2 &3), SWB (Item 4, 5,6, 7 & 8), and PWB (Item 9, 10, 11, 12, 13 & 14) as well as a second-order fac-tor for overall Mental Health (Figure 3).Model 4 was a first-order factorial model which consisted of the hedonic (EWBitems 1, 2 & 3) and eudemonic (PWB and SWB items 4, 5, 6, 7, 8, 9, 10, 11, 12,13, 14) components of wellbeing (Figure 4).Model 5 was hypothesised as a second order hierarchical model encompassingtwo first order factors namely: hedonic- (EWB items 1, 2 & 3) and eudemonic-(PWB and SWB items 4, 5, 6, 7, 8, 9, 10, 11, 12, 13, 14) wellbeing, which loadedon a second-order factor for general mental health (Figure 5).Model 6 specified a bi-factor model with three first-order factors consisting ofEWB (Item 1, 2 & 3), SWB (Item 4, 5, 6, 7 & 8) and PWB (Item 9, 10, 11, 12, 13& 14) and a global mental health factor ecompassing all items. All factors werespecified as orthogonal, with inter-factor correlations constrained (Figure 6).
L.E. VAN ZYL & CH. OLCKERS240
EJMH 14:2, December 2019

THE MENTAL HEALTH CONTINUUM-SHORT FORM 241
EJMH 14:2, December 2019
Item
1
Item
2
Item
3
Item
4
Item
5
Item
6
Item
7
Item
8
Item
9
Item
10
Item
11
Item
12
Item
13
Item
14
Men
tal
Hea
lth
Item
4
Item
5
Item
6
Item
7
Item
8
Item
1
Item
2
Item
3
Emot
iona
l W
ellb
eing
So
cial
W
ellb
eing
Item
9
Item
10
It
em
11
It
em
12
It
em
13
It
em
14
Psyc
holo
gica
l W
ellb
eing
Figu
re 1
Mod
el 1
: Uni
dim
ensi
onal
Fac
tori
al M
odel
Figu
re 2
Mod
el 2
: Thr
ee f
irst
-ord
er F
acto
rial
Mod
el

L.E. VAN ZYL & CH. OLCKERS242
EJMH 14:2, December 2019
Figu
re 3
Mo
del
3:
Seco
nd
ord
er
Hie
rarc
hic
al
Th
ree f
irst-
ord
er
Facto
rial
Model
Figu
re 3
Mod
el 3
: Sec
ond
orde
r H
iera
rchi
cal T
hree
fir
st-o
rder
Fac
tori
al M
odel

THE MENTAL HEALTH CONTINUUM-SHORT FORM 243
EJMH 14:2, December 2019
Item
1
Item
2
Item
3
Hed
onic
W
ellb
eing
Item
4
Item
5
Item
6
Item
7
Item
8
Item
9
Item
10
Item
11
Item
12
Item
13
Item
14
Eude
mon
ic
Wel
lbei
ng
Figu
re 4
Mod
el 4
: Tw
o fi
rst-
orde
r F
acto
rial
Mod
el
Figu
re 5
Item
1
Item
2
Item
3
Hed
onic
W
ellb
eing
Item
4
Item
5
Item
6
Item
7
Item
8
Item
9
Item
10
It
em
11
It
em
12
It
em
13
It
em
14
Eude
mon
ic
Wel
lbei
ng
Gen
eral
M
enta
l H
ealth
Figu
re 5
Mod
el 5
: Sec
ond
orde
r H
iera
rchi
cal t
wo
firs
t-or
der
Fac
tori
al M
odel
L.E. VAN ZYL & CH. OLCKERS244
EJMH 14:2, December 2019
Figu
re 6
Mo
del 6
: B
i-fa
cto
r m
od
el
wit
h t
hre
e f
irst-
ord
er
facto
rs
Figu
re 6
Mod
el 6
: Bi-
fact
or m
odel
wit
h th
ree
firs
t-or
der
fact
ors

THE MENTAL HEALTH CONTINUUM-SHORT FORM 245
EJMH 14:2, December 2019
F
igur
e 7
Mo
del
7: B
i-facto
r m
od
el
wit
h t
wo
fir
st-
ord
er f
acto
rs
Ite
m 4
Ite
m 5
Ite
m 6
Ite
m 7
Ite
m 8
Ite
m 1
Ite
m 2
Ite
m 3
Hed
onic
W
ellb
eing
Eud
emon
ic
Wel
lbei
ng
Ite
m 9
Ite
m 1
0
Ite
m 1
1
Ite
m 1
2
Ite
m 1
3
Ite
m 1
4
Ove
rall
Men
tal
Hea
lth Fi
gure
7M
odel
7: B
i-fa
ctor
mod
el w
ith
two
firs
t-or
der
fact
ors
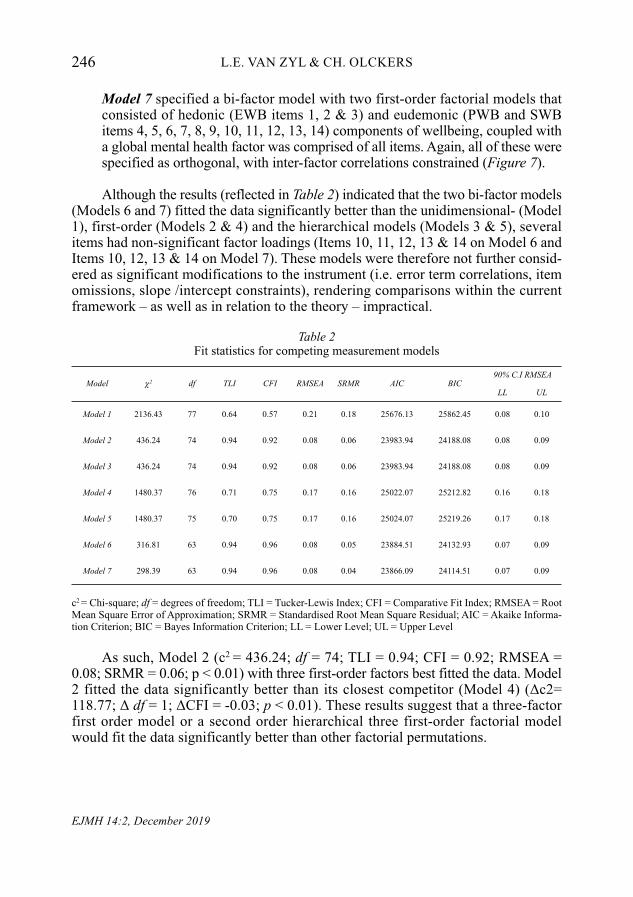
Model 7 specified a bi-factor model with two first-order factorial models thatconsisted of hedonic (EWB items 1, 2 & 3) and eudemonic (PWB and SWBitems 4, 5, 6, 7, 8, 9, 10, 11, 12, 13, 14) components of wellbeing, coupled witha global mental health factor was comprised of all items. Again, all of these werespecified as orthogonal, with inter-factor correlations constrained (Figure 7).
Although the results (reflected in Table 2) indicated that the two bi-factor models(Models 6 and 7) fitted the data significantly better than the unidimensional- (Model1), first-order (Models 2 & 4) and the hierarchical models (Models 3 & 5), severalitems had non-significant factor loadings (Items 10, 11, 12, 13 & 14 on Model 6 andItems 10, 12, 13 & 14 on Model 7). These models were therefore not further consid-ered as significant modifications to the instrument (i.e. error term correlations, itemomissions, slope /intercept constraints), rendering comparisons within the currentframework – as well as in relation to the theory – impractical.
Table 2Fit statistics for competing measurement models
c2 = Chi-square; df = degrees of freedom; TLI = Tucker-Lewis Index; CFI = Comparative Fit Index; RMSEA = RootMean Square Error of Approximation; SRMR = Standardised Root Mean Square Residual; AIC = Akaike Informa-tion Criterion; BIC = Bayes Information Criterion; LL = Lower Level; UL = Upper Level
As such, Model 2 (c2 = 436.24; df = 74; TLI = 0.94; CFI = 0.92; RMSEA =0.08; SRMR = 0.06; p < 0.01) with three first-order factors best fitted the data. Model2 fitted the data significantly better than its closest competitor (Model 4) (Δc2=118.77; Δ df = 1; ΔCFI = -0.03; p < 0.01). These results suggest that a three-factorfirst order model or a second order hierarchical three first-order factorial modelwould fit the data significantly better than other factorial permutations.
L.E. VAN ZYL & CH. OLCKERS246
EJMH 14:2, December 2019
Model c2 df TLI CFI RMSEA SRMR AIC BIC90% C.I RMSEA
LL UL
Model 1 2136.43 77 0.64 0.57 0.21 0.18 25676.13 25862.45 0.08 0.10
Model 2 436.24 74 0.94 0.92 0.08 0.06 23983.94 24188.08 0.08 0.09
Model 3 436.24 74 0.94 0.92 0.08 0.06 23983.94 24188.08 0.08 0.09
Model 4 1480.37 76 0.71 0.75 0.17 0.16 25022.07 25212.82 0.16 0.18
Model 5 1480.37 75 0.70 0.75 0.17 0.16 25024.07 25219.26 0.17 0.18
Model 6 316.81 63 0.94 0.96 0.08 0.05 23884.51 24132.93 0.07 0.09
Model 7 298.39 63 0.94 0.96 0.08 0.04 23866.09 24114.51 0.07 0.09
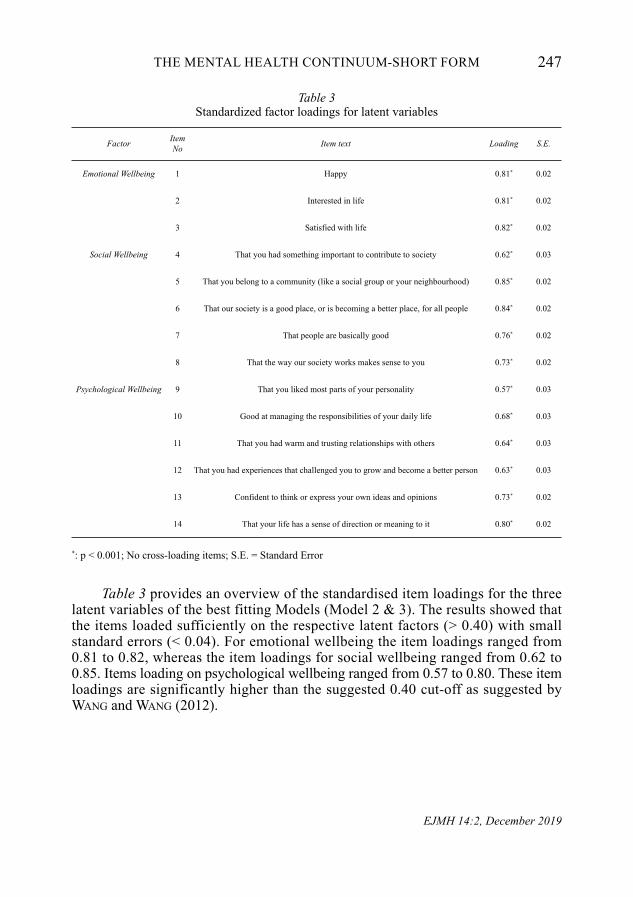
Table 3Standardized factor loadings for latent variables
*: p < 0.001; No cross-loading items; S.E. = Standard Error
Table 3 provides an overview of the standardised item loadings for the threelatent variables of the best fitting Models (Model 2 & 3). The results showed thatthe items loaded sufficiently on the respective latent factors (> 0.40) with smallstand ard errors (< 0.04). For emotional wellbeing the item loadings ranged from0.81 to 0.82, whereas the item loadings for social wellbeing ranged from 0.62 to0.85. Items loading on psychological wellbeing ranged from 0.57 to 0.80. These itemloadings are significantly higher than the suggested 0.40 cut-off as suggested byWANG and WANG (2012).
THE MENTAL HEALTH CONTINUUM-SHORT FORM 247
EJMH 14:2, December 2019
Factor ItemNo Item text Loading S.E.
Emotional Wellbeing 1 Happy 0.81* 0.02
2 Interested in life 0.81* 0.02
3 Satisfied with life 0.82* 0.02
Social Wellbeing 4 That you had something important to contribute to society 0.62* 0.03
5 That you belong to a community (like a social group or your neighbourhood) 0.85* 0.02
6 That our society is a good place, or is becoming a better place, for all people 0.84* 0.02
7 That people are basically good 0.76* 0.02
8 That the way our society works makes sense to you 0.73* 0.02
Psychological Wellbeing 9 That you liked most parts of your personality 0.57* 0.03
10 Good at managing the responsibilities of your daily life 0.68* 0.03
11 That you had warm and trusting relationships with others 0.64* 0.03
12 That you had experiences that challenged you to grow and become a better person 0.63* 0.03
13 Confident to think or express your own ideas and opinions 0.73* 0.02
14 That your life has a sense of direction or meaning to it 0.80* 0.02

3.2. Measurement Invariance
Measurement invariance was assessed in two phases. First, KMO sphericity wasassessed to determine sampling adequacy for each sub-category of the demo-graphic characteristics being employed. The results showed that all categories; i.e.genders (male vs female), age categories (19 to 29 years; 30 to 39 years; 40 to 49years; 50+ years), language groups (Afrikaans, English and African) and maritalstatus (single, married, and divorced/widowed) had adequate sample sizes to con-tinue with invariance testing (KMO < 0.70, p < 0.01; CERNY & KAISER 1977). Sec-ond, measurement invariance was assessed. The specifics of each analysis are pre-sented below.
Invariance was first tested between different genders (males vs females). Theparticipants consisted of 285 males and 339 females. The results provided strong evi-dence of measurement invariance across the different genders (Table 4). No signifi-cant Δc2 or ΔCFI differences could be found between the configural, metric, andscalar models (p > 0.05).
Table 4Invariance testing based on gender
*: No statistically significant differences exist (p > 0.05)
Strong invariance was supported between males and females, therefore latentmean differences between the groups were investigated. With males as the referencegroup, the results showed that females did not score statistically significantly loweron the unstandardized fitted mean on EWB (M = 0.04, SE = 0.09, p = 0.68), PWB(M = −0.06, SE = 0.09, p = 0.49) or SWB (M = −0.07, SE = 0.09, p = 0.41).
L.E. VAN ZYL & CH. OLCKERS248
EJMH 14:2, December 2019
Model c2 df TLI CFI RMSEA SRMR AIC BIC ModelComparison Δc2 ΔCFI
M1 ConfiguralInvariance 436.24 146 0.94 0.92 0.03 0.05 23983.94 24188.08 – –
M2 MetricInvariance 552.94 157 0.92 0.93 0.05 0.06 23889.52 24235.55 M2 vs M1 116.70* –0.01*
M3 ScalarInvariance 537.62 168 0.92 0.93 0.03 0.06 23902.20 24310.33 M3 vs M2 –15.32* 0.00*

Table 5Invariance testing based on Age
* No statistically significant differences exist (p > 0.05)
Next, invariance was assessed between different age categories (Table 5). Theparticipants consisted of 158 individuals between the ages of 19 and 29 years, 182between 30 and 39 years, 131 between 40 and 49 years, and 153 that were over 50years of age. The results indicated no evidence of measurement invariance across thegroups. Significant differences in both Δc2 and ΔCFI were found between the con-figural, metric, and scalar invariance models (p < 0.05). Partial invariance was notpursued as comparisons between all invariance models were shown to be statisticallysignificant. Further, none of the models met the RMSEA and SRMR requirementsfor model fit. Therefore, the MHC-SF was not invariant among age categories andmeaningful mean comparisons cannot be made.
Further, measurement invariance was assessed between different languagegroups (Table 6). The participants consisted of English- (n = 166), Afrikaans- (n =216) and African language groups (n = 242). Again, the results indicated no evidenceof measurement invariance across the different language groups. Significant differ-ences in both Δc2 and ΔCFI were found between the configural, metric, and scalarinvariance models (p < 0.05). Partial invariance was not pursued as comparisonsbetween the invariance models showed that a non-statistically significant differenceonly existed for one model (the configural vs. metric model). Further, none of themodels met the model fit criteria for RMSEA and only the configural model met therequirements for SRMR. The conditions for further investigations were thus not met.Therefore, the MHC-SF was not invariant among different language groups andmeaningful mean comparisons cannot be made.
THE MENTAL HEALTH CONTINUUM-SHORT FORM 249
EJMH 14:2, December 2019
Model c2 df TLI CFI RMSEA SRMR AIC BIC ModelComparison Δc2 ΔCFI
M1 ConfiguralInvariance 751.15 292 0.92 0.90 0.10 0.07 23943.40 24759.64 – –
M2 MetricInvariance 796.24 325 0.92 0.91 0.09 0.08 23922.47 24592.33 M2 vs M1 45.08 –0.01
M3 ScalarInvariance 865.85 358 0.91 0.91 0.09 0.09 23926.09 24449.58 M3 vs M2 69.92 0.00
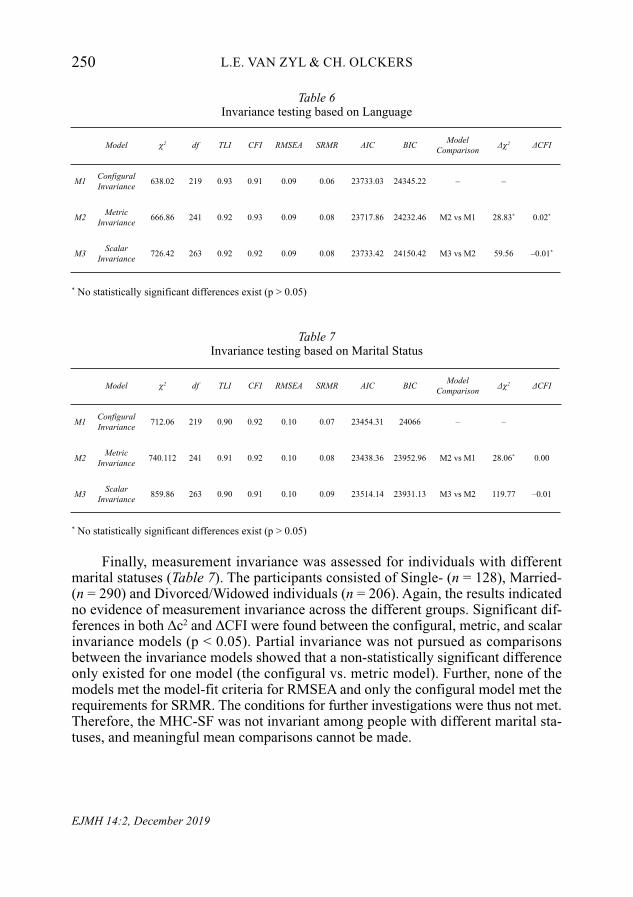
Table 6Invariance testing based on Language
* No statistically significant differences exist (p > 0.05)
Table 7Invariance testing based on Marital Status
* No statistically significant differences exist (p > 0.05)
Finally, measurement invariance was assessed for individuals with differentmarital statuses (Table 7). The participants consisted of Single- (n = 128), Married-(n = 290) and Divorced/Widowed individuals (n = 206). Again, the results indicatedno evidence of measurement invariance across the different groups. Significant dif-ferences in both Δc2 and ΔCFI were found between the configural, metric, and scalarinvariance models (p < 0.05). Partial invariance was not pursued as comparisonsbetween the invariance models showed that a non-statistically significant differenceonly existed for one model (the configural vs. metric model). Further, none of themodels met the model-fit criteria for RMSEA and only the configural model met therequirements for SRMR. The conditions for further investigations were thus not met.Therefore, the MHC-SF was not invariant among people with different marital sta-tuses, and meaningful mean comparisons cannot be made.
L.E. VAN ZYL & CH. OLCKERS250
EJMH 14:2, December 2019
Model c2 df TLI CFI RMSEA SRMR AIC BIC ModelComparison Δc2 ΔCFI
M1 ConfiguralInvariance 638.02 219 0.93 0.91 0.09 0.06 23733.03 24345.22 – –
M2 MetricInvariance 666.86 241 0.92 0.93 0.09 0.08 23717.86 24232.46 M2 vs M1 28.83* 0.02*
M3 ScalarInvariance 726.42 263 0.92 0.92 0.09 0.08 23733.42 24150.42 M3 vs M2 59.56 –0.01*
Model c2 df TLI CFI RMSEA SRMR AIC BIC ModelComparison Δc2 ΔCFI
M1 ConfiguralInvariance 712.06 219 0.90 0.92 0.10 0.07 23454.31 24066 – –
M2 MetricInvariance 740.112 241 0.91 0.92 0.10 0.08 23438.36 23952.96 M2 vs M1 28.06* 0.00
M3 ScalarInvariance 859.86 263 0.90 0.91 0.10 0.09 23514.14 23931.13 M3 vs M2 119.77 –0.01

3.3. Reliabilities and descriptive statistics
Table 8 indicates the descriptive statistics (means, standard deviations, skewness, kur-tosis), Cronbach alphas, composite reliabilities, and Pearson/Spearman relationshipsamongst the latent variables. The results showed that all the scales are reliable at boththe lower (Cronbach Alpha > 0.70) and upper bound limits (Composite reliability /Rho coefficients (ρ) > 0.80). Hypotheses 5, which indicates that the MHC-SF isa reliable measure, therefore it can be accepted.
Table 8Descriptive statistics, Cronbach alpha coefficients, and composite reliabilities for Model 2&3
x̄ = mean; σ = standard deviation; ρ = composite reliability; α = Cronbach’s alpha
4. Discussion
The purpose of this paper was to investigate the psychometric properties of theMHC-SF within selected organisations within the South African context. Specifically,the aim was to determine the factorial validity, the measurement invariance for dif-ferent demographic factors, and to determine the reliability of the instrument forSouth African organisations. The results showed that the original three-dimensionalfactor structure of the MHC-SF proposed by KEYES (2002) fitted the data compara-tively better than any other theoretical permutation of the model. Items loaded statis-tically significantly on all three subscales (emotional, psychological, social wellbe-ing) of the best-fitting model. Further, the scale showed full configure, convergentand metric invariance between males and females. Within the current study, no dif-ferences in emotional, psychological, and social wellbeing between the genders werefound. However, invariance was not established for different age cohorts, languagegroups, or marital statuses. The instrument proved to be reliable at both a lower(Cronbach Alpha) and upper-level (Composite reliability) limit within South Africanorganisational contexts.
THE MENTAL HEALTH CONTINUUM-SHORT FORM 251
EJMH 14:2, December 2019
Variable x̄ Σ Skewness Kurtosis ρ α
Overall Mental Health 4.33 0.88 –0.57 0.31 0.94 0.80
Emotional Wellbeing 4.71 0.99 –1.13 1.38 0.85 0.86
Psychological Wellbeing 4.74 0.89 –0.94 1.07 0.83 0.86
Social Wellbeing 3.54 1.27 –0.13 –0.87 0.87 0.88

4.1. The factorial validity of the MHC-SF
Various factor-structure permutations of the MHC-SF exist within the literature;with little consistency in their application across samples or contexts. Research hasshown that the MHC-SF is used either as (a) a unidimensional model (i.e. generalmental health), (b) a three- (emotional, psychological, and social wellbeing) ortwo-factor (hedonic and eudemonic wellbeing) first order model, or (c) as a hier-archical model comprised out of either the three- or two- first order factors thatbuilds up to an overall second-order called ‘Overall Mental Health’. Contemporar-ily, two additional types of models have been introduced in the literature: ESEMand Bi-Factor models (JOSHANLOO 2016; JOSHANLOO & JOVANOVIĆ 2016; JOSHAN-LOO et al. 2017; ŻEMOJTEL‐PIOTROWSKA et al. 2018).
The current study attempted to categorically compare all the aforementionedmodels (with the exclusion of the ESEM approach) within the South African organ-isational context. Initially, the results indicated that these two bi-factor modelsassessed in this study fitted the data best. However, upon further inspection it wasfound that even though these models fitted the data comparatively better than theother competing models, the majority of the items on the ‘psychological wellbeing’(or eudemonic subscales for the two-factor, bi-factor model) had non-significant fac-tor loadings. DE BRUIN and DU PLESSIS (2015) presented similar results. Theseauthors found that the bi-factor model fitted the data better than a large amount oftotal test variance. However, even though the general mental health factor’s itemsloaded significantly on the global factor, most of the item loadings reported on theindividual subscales did not meet WANG and WANG’S (2012) suggested item loadingcut-off of 0.5, nor FIELD’s (2016) more lenient 0.40.
REISE and colleagues (2016) explain that even though bi-factor models providea better fit relative to unidimensional or correlated factor models (as a result of thecomplexity of the specified model; it’s the least restrictive of all possible models), it‘…Accommodates implausible, possibly invalid, response patterns. We warn readersthat, even if such suspect patterns could be reliably identified with high precision,there is no “adjustment” to factor score estimates that can turn invalid responses intovalid score estimates’ (p. 19). These authors specifically warn against employing bi-factor models in general, as these models do not provide the ‘answers’ to the trad -itional questions posed when developing or validating instruments; especially whencompeting CFA approaches are employed. Bifactor models are predispositioned toignore cross-loadings and may result in biased estimates (JOSHANLOO 2016). Finally,in some instances and for some psychometric instruments, the general factor esti-mated in bi-factor models does not function as a ‘true’ general factor, but rather actsas a general function to superficially inflate model-fit (MORGAN et al. 2015). In theseinstances, a normal two-level hierarchical factorial model would be more preferentialand could yield better results (REISE et al. 2016; ŻEMOJTEL‐PIOTROWSKA et al., 2018).
As such, these bi-factor models were excluded from further analyses. Therefore,the results showed that KEYES’ (2002) original three-factor model (Model 2: EWB,
L.E. VAN ZYL & CH. OLCKERS252
EJMH 14:2, December 2019

PWB, SWB; Model 3: Overall Mental Health = EWB, PWB, SWB) fitted the datasignificantly better than the unidimensional- (Model 1), first-order (Model 4) andthe hierarchical models (Model 5). For employees within the South African organ-isational context, a clear distinction exists between three different, yet complimen-tary, components of wellbeing: emotional wellbeing, psychological wellbeing, andsocial wellbeing. Our results are aligned with several studies conducted by JOSHAN-LOO and colleagues (2017) ranging from Italy (PETRILLO et al. 2015), and theNetherlands (LAMERS et al. 2011), to France (SALAMA-YOUNES & ISMAÏL 2011) andArgentina (PERUGINI et al. 2017). Further, it is important to note that our findingswere also in contrast to other studies that conceptualised KEYES’ (2002) instrumentas a unidimensional-, two-factor model- or two-factor hierarchical models (JOSHAN-LOO 2017).
4.2. Measurement invariance for Genders, Age cohorts, Language groups and Relational /Marital status
Determining the best fitting model allowed for further investigation into equivalencefactor structures (configural invariance), similarity in factor/item loadings (metricinvariance), and to determine if different groups have similar intercepts (scalar invari-ance). The aim was to specifically investigate the measurement invariance of gen-ders, age cohorts, language groups and between different relationships/marital status.The results only showed support for invariance between males and females; and incontrast to our initial belief, not for individuals of different ages from different lan-guage groups and people who are in different types of relationships. Also, partialinvariance for these groups could not be established. This implies that men andwoman interpret the items of the MHC-SF in a similar way, and therefore interpretemotional, psychological and social wellbeing in the same way (VAN DE SCHOOT etal. 2012). As such, future studies can make meaningful cross-gender comparisons onthe occurrence, determinants and consequences of the components of MHC-SFwithin South African organisational contexts. This is in line with the findings of GUO
and colleagues (2015), JOSHANLOO and colleagues (2017), KARAŚ and colleagues(2012), PETRILLO and colleagues (2015), all of whom reported invariance in genderin different cultures and contexts.
In contrast, according to GUO and colleagues (2015) as well as others, individualsfrom different age groups and with different relationship statuses will interpret theconstructs being measured differently and therefore, cross-generation and cross-rela-tionship comparisons cannot be reasonably made. Importantly, differences that mayoccur between these groups could be therefore due to inadequate mental-health meas-urement within these groups. Further, in contrast to SCHUTTE and WISSING (2017),measurement invariance could not be established between the different languagegroups within the current sample. Within the South African context, the native lan-guage is used as a proxy for cultural identification and classification. Seeing thatsignificant differences exist between Afrikaans-, English-, and African-speaking
THE MENTAL HEALTH CONTINUUM-SHORT FORM 253
EJMH 14:2, December 2019

individuals within this sample, cross-cultural comparisons on mental health betweenthese groups – within this context – cannot meaningfully be made.
Care should therefore be given when applying the instrument to people from dif-ferent ages, as they may understand and interpret the information differently due tothe magnitude of experiences accumulated over time (older generations), or due tonaivety as a result of a lack of insight (younger generations). Similarly, when appliedto or within cross-cultural or multi-lingual environments, it is to be suggested to utiliseone of the many translated and validated versions of the MHC-SF in order to ensurethat language does not impact the quality of the results. Finally, although we know thatdifferences in wellbeing exists between individuals in or out of relationships, whenapplying the MHC-SF to measure and compare wellbeing between individuals that arein a relationship or are single or are divorced/widowed, one must be cognisant thatunderlying relational dynamics may affect how the questions are interpreted.
4.3. The internal consistency of the MHC-SF
Although the MHC-SF is considered to be a reliable instrument to assess mentalhealth, it has been shown to fluctuate in reliability between different cultures,between adults and adolescents, as well as within different contexts (KARAŚ et al.2014; KEYES et al. 2008; SINGH et al. 2015). The reliability also depends on the typeof theoretical model that was employed in the given context (e.g. a unidimensionalmeasure may present with higher levels of internal consistency than the three-factormodel in the same context).
The results of this study showed that the instrument is a reliable measure (atboth the lower and upper bound consistency limits) for mental health within SouthAfrican organisational contexts. The results showed acceptable levels of internal con-sistency (Cronbach Alpha > 0.70; NUNNALLY & BERNSTEIN 1994) and composite reli-ability (Rho / (ρ) > 0.80; WANG & WANG 2012). Our findings are primarily alignedwith the other South African studies where the MHC-SF was applied to multi-culturalgroups and found to be reliable (KEYES et al. 2008).
5. Recommendations and Limitations
This study has a number of limitations that need to be reported in order to appropriateinterpret the results and discussion. The first limitation of this study pertains to thefact that the MHC-SF is a self-report measure, relying on the self-knowledge and thesubjective experience of an individual’s situations that might have an impact on theaccuracy of the results. Secondly, a convenience South African sample was utilised,therefore the results cannot be generalised to other samples. In this study, only thepositive mental health model was tested. It might be beneficial to determine the factorstructure of both positive and negative patterns at the same time in future studies.Third, this was a cross-sectional study. Seeing that mental health fluctuates over time,it might be viable to conduct longitudinal validation studies.
L.E. VAN ZYL & CH. OLCKERS254
EJMH 14:2, December 2019

6. Conclusion
The MHC-SF is a proven instrument to assess the mental health of both students(VAN ZYL & ROTHMANN 2012b) and adults (KEYES et al. 2008) within the SouthAfrican context. This study showed that it could further be used as a tool to assessthe wellbeing and mental health of working adults within the given context. This,however, should be taken against the backdrop that within the current study, a num-ber of context-specific factors and differences from the literature exist. The MHC-SFcan be used to differentiate between genders, but not between different languages (i.e.cultures), age cohorts, and people within various marital statuses. Albeit such, thetool is still one of the most prominent positive psychological assessment measureswhich has – stood the test of time!
References
BONDE, J.P.E. (2008) ‘Psychosocial Factors at Work and Risk of Depression: A Systematic Reviewof the Epidemiological Evidence’, Occupational and Environmental Medicine 65, 438–445(http://doi.org/10.1136/oem.2007.038430).
BROWN, T.A. (2006) Confirmatory Factor Analysis for Applied Research (New York, NY: Guil-ford).
BURNS, R.A., K.J. ANSTEY & T.D. WINDSOR (2011) ‘Subjective Well-Being Mediates the Effectsof Resilience and Mastery on Depression and Anxiety in a Large Community Sample ofYoung and Middle-Aged Adults’, Australian and New Zealand Journal of Psychiatry 45(3),240–48 (http://doi.org/10.3109/00048674.2010.529604).
BYRNE, B.M. (2012) Structural Equation Modeling with Mplus: Basic Concepts, Applications andProgramming (New York, NY: Taylor & Francis).
CARVER, C.S. & J. CONNOR-SMITH (2010) ‘Personality and Coping’, Annual Review of Psychology61, 679–704 (http://doi.org/10.1146/annurev.psych.093008.10035).
CARVER, C.S. & M.F. SCHEIER (2014) ‘Dispositional Optimism’, Trends in Cognitive Sciences 18,293–99 (http://doi.org/10.1016/j.tics.2014.02.003).
CERNY, B.A. & H.F. KAISER (1977) ‘A Study of a Measure of Sampling Adequacy for Factor-Ana-lytic Correlation Matrices’, Multivariate Behavioral Research 12, 43–47 (http://doi.org/10.1207/s15327906mbr1201_3).
CHAPMAN, B. & C. GUVEN (2016) ‘Revisiting the Relationship between Marriage and Wellbeing:Does Marriage Quality Matter?’ Journal of Happiness Studies 17, 533–51 (http://doi.org/10.1007/s10902-014-9607-3).
CHEN, F.F. (2007) ‘Sensitivity of Goodness of Fit Indexes to Lack of Measurement Invariance’,Structural Equation Modeling 14, 464–504 (https://doi.org/10.1080/10705510701301834).
CHEUNG, G.W. & R.B. RENSVOLD (2002) ‘Evaluating Goodness-of-Fit Indexes for Testing Meas-urement Invariance’, Structural Equation Modeling 9, 233–55 (https://doi.org/10.1207/S15328007SEM0902_5).
CHO, E. & S. KIM (2015) ‘Cronbach’s Coefficient Alpha: Well-Known but Poorly Understood’,Organizational Research Methods 18, 207–30 (https://doi.org/10.1177%2F1094428114555994).
DE BRUIN, G.P. & G.A. DU PLESSIS (2015) ‘Bifactor Analysis of the Mental Health Continuum–Short Form (MHC–SF)’, Psychological Reports 116, 438–46 (http://doi.org/10.2466/03.02.PR0.116k20w6).
THE MENTAL HEALTH CONTINUUM-SHORT FORM 255
EJMH 14:2, December 2019

DIENER, E. (1984) ‘Subjective Well-Being’, Psychological Bulletin 95, 542–75. DIENER, E. & R. BISWAS-DIENER (2008) Rethinking Happiness: The Science of Psychological
Wealth (Malden, MA: Blackwell).DIENER, E. & E.M. SUH. eds. (2003) Culture and Subjective Well-Being (Cambridge, M.A.: MIT
press).DIENER, E., C.L. GOHM, E.M. SUH & S. OISHI (2000) ‘Similarity of the Relations between Marital
Status and Subjective Well-Being across Cultures’, Journal of Cross-Cultural Psychology31, 419–36 (https://doi.org/10.1177/0022022100031004001).
DIENER, E., E.M. SUH, R. LUCAS & H.L. SMITH (1999) ‘Subjective Well-Being: Three Decades ofProgress’, Psychological Bulletin 125, 276–302 (http://doi.org/10.1037/0033-2909.125.2.276).
FAIRBROTHER, K. & J. WARN (2003) ‘Workplace Dimension: Stress and Job Satisfaction’, Journalof Management Psychology 18, 8–21 (http://doi.org/10.1108/02683940310459565).
FIELD, A. (2016) An Adventure in Statistics: The Reality Enigma (Los Angeles etc.: Sage).GAVIN, J.H. & R.O. MASON (2004) ‘The Virtuous Organization: The Value of Happiness in the
Workplac’, Organizational Dynamics 33, 379–92.GUO, C., G. TOMSON, J. GUO, X. LI, C. KELLER & F. SÖDERQVIST (2015) ‘Psychometric Evaluation
of the Mental Health Continuum-Short Form (MHC-SF) in Chinese Adolescents: A Method-ological Study’, Health and Quality of Life Outcomes 13, Nr. 198 (http://doi.org/10.1186/s12955-015-0394-2).
HELLIWELL, J.F. & R.D. PUTNAM (2004) ‘The Social Context of Well-Being’, Philosophical Trans-actions of the Royal Society B: Biological Sciences 359, 1435–46 (http://doi.org/10.1098/rstb.2004.1522).
HIDES, L., C. QUINN, S. STOYANOV, W. COCKSHAW, T. MITCHELL & D. KAVANAGH (2016) ‘Is theMental Wellbeing of Young Australians Best Represented by a Single, Multidimensionalor Bifactor Model?’ Psychiatry Research 241, 1–7 (http://doi.org/10.1016/j.psychres.2016.04.077).
JANSE VAN RENSBURG, C., S. ROTHMANN & E. DIEDERICKS (2017) ‘Person-Environment Fit, Flour-ishing and Intention to Leave in Universities of Technology in South Africa’, SA Journal ofIndustrial Psychology/SA Tydskrif vir Bedryfsielkunde 43, a1422 (https://doi.org/10.4102/sajip.v43i0.1422).
JOSHANLOO, M. (2016a) ‘A New Look at the Factor Structure of the MHC‐SF in Iran and theUnited States Using Exploratory Structural Equation Modeling’, Journal of Clinical Psy-chology 72, 701–13 (http://doi.org/10.1002/jclp.22287).
JOSHANLOO, M. (2016b) ‘Revisiting the Empirical Distinction between Hedonic and EudaimonicAspects of Well-Being Using Exploratory Structural Equation Modeling’, Journal of Hap-piness Studies 17, 2023–36 (https://doi.org/10.1007/s10902-015-9683-z).
JOSHANLOO, M. (2017) ‘Factor Structure and Measurement Invariance of the MHC-SF in theUSA’, European Journal of Psychological Assessment 35, 521–25 (https://doi.org/10.1027/1015-5759/a000425).
JOSHANLOO, M. & V. JOVANOVIĆ (2016) ‘The Factor Structure of the Mental Health Continuum-Short Form (MHC-SF) in Serbia: An Evaluation Using Exploratory Structural EquationModeling’, Journal of Mental Health 26, 510–15 (http://doi.org/10.1080/09638237.2016.1222058).
JOSHANLOO, M., P.E. JOSE & M. KIELPIKOWSKI (2017) ‘The Value of Exploratory Structural Equa-tion Modeling in Identifying Factor Overlap in the Mental Health Continuum-Short Form(MHC-SF): A Study with a New Zealand Sample’, Journal of Happiness Studies 18, 1061–74 (http://doi.org/10.1007/s10902-016-9767-4).
L.E. VAN ZYL & CH. OLCKERS256
EJMH 14:2, December 2019

JOSHANLOO, M., M.P. WISSING, I.P. KHUMALO & S.M.A. LAMERS (2013) ‘Measurement Invarianceof the Mental Health Continuum-Short Form (MHC-SF) across three Cultural Groups’, Per-sonality and Individual Differences 55, 755–59 (http://doi.org/10.1016/j.paid.2013.06.002).
JOVANOVIĆ, V. (2015) ‘Structural Validity of the Mental Health Continuum-Short Form: The Bifac-tor Model of Emotional, Social and Psychological Well-Being’, Personality and IndividualDifferences 75, 154–59 (http://doi.org/10.1016/j.paid.2014.11.026).
KAMP DUSH, C.M. & P.R. AMATO (2005) ‘Consequences of Relationship Status and Quality forSubjective Well-Being’, Journal of Social and Personal Relationships 22, 607–27 (http://doi.org/10.1177/0265407505056438).
KARAŚ, D., J. CIECIUCH & C.L. KEYES (2014) ‘The Polish Adaptation of the Mental Health Con-tinuum-Shortform (MHC-SF)’, Personality and Individual Differences 69, 104–09 (http://doi.org/ 10.1016/j.paid.2014.05.011).
KARAŚ, D., J. CIECIUCH & C.L. KEYES (2014) ‘The Polish Adaptation of the Mental Health Con-tinuum-Short Form (MHC-SF)’, Personality and Individual Differences 69, 104–09 (http://doi.org/10.1016/j.paid.2014.05.011).
KASHDAN, T.B. & J. ROTTENBERG (2010) ‘Psychological Flexibility as a Fundamental Aspect ofHealth’, Clinical Psychology Review 30, 865–78 (http://doi.org/10.1016/j.cpr.2010.03.001).
KEYES, C.L.M. (2002) ‘The Mental Health Continuum: From Languishing to Flourishing in Life’,Journal of Health and Social Behavior 43, 207–22.
KEYES, C.L.M. (2005) ‘Mental Illness and/or Mental Health? Investigating Axioms of the Com-plete State Model of Health’, Journal of Consulting and Clinical Psychology 73, 539–48(https://doi.org/10.1037/0022-006X.73.3.539).
KEYES, C.L.M. & A.D. SHAPIRO (2004) ‘Social Well-Being in the United States: A Descriptive Epi-demiology’ in O.G. BRIM, C.D. RYFF & R.C. KESSLER, eds., How Healthy are we? A NationalStudy of Well-Being at Midlife (Chicago, IL: U of Chicago P) 350–72.
KEYES, C.L.M., D. SHMOTKIN & C.D. RYFF (2002) ‘Optimizing Well–Being: The EmpiricalEncounter of two Traditions’, Journal of Personality and Social Psychology 82, 1007–22.
KEYES, C.L.M., M.P. WISSING, J.P. POTGIETER, M. TEMANE, A. KRUGER & S. VAN ROOY (2008)‘Evaluation of the Mental Health Continuum–Short Form (MHC–SF) in setswana‐SpeakingSouth Africans’, Clinical Psychology & Psychotherapy 15, 181–92 (https://doi.org/10.1002/cpp.572).
LAMERS, S.M.A., G.J. WESTERHOF, E.T. BOHLMEIJER, P.M. TEN KLOOSTER & C.L.M. KEYES (2011)‘Evaluating the Psychometric Properties of the Mental Health Continuum-Short Form(MHC-SF)’, Journal of Clinical Psychology 67, 99–110 (http://doi.org/10.1002/jclp.20741).
LONGO, Y., V. JOVANOVIĆ, J. SAMPAIO DE CARVALHO & D. KARAŚ (2017) ‘The General Factor ofWell-Being: Multinational Evidence Using Bifactor ESEM on the Mental Health Contin-uum–Short Form’, Assessment (http://doi.org/10.1177/1073191117748394).
MACHADO, W.L. & D.R. BANDEIRA (2015) ‘Positive Mental Health Scale: Validation of the MentalHealth Continuum–Short Form’, Psico-USF 20, 259–74 (http://doi.org/10.1590/1413-82712015200207).
MORGAN, G. B., K.J. HODGE, K.E. WELLS & M.W. WATKINS (2015) ‘Are Fit Indices Biased inFavor of Bi-Factor Models in Cognitive Ability Research? A Comparison of Fit in Corre-lated Factors, Higher-Order, and Bi-Factor Models via Monte Carlo Simulations’, Journalof Intelligence 3, 2–20 (https://doi.org/10.3390/jintelligence3010002).
MUTHÉN, L. & B. MUTHÉN, B. (2017) Mplus User’s Guide (Los Angeles, CA: Muthén & Muthén). NIEMAND, C. (2019) Mental Health of South African Industrial Psychologists: Results of a Latent
Profile Analysis (M.H. thesis, North-West University, Vanderbijlpark).NUNNALLY, J.C., & I.H. BERNSTEIN (1994) Psychometric Theory (3rd ed., New York: McGraw-Hill).
THE MENTAL HEALTH CONTINUUM-SHORT FORM 257
EJMH 14:2, December 2019

PERUGINI, M.L.L, G. DE LA IGLESIA, A.C. SOLANOA & C.L.M. KEYES (2017) ‘The Mental HealthContinuum–Short Form (MHC–SF) in the Argentinean Context: Confirmatory Factor Analy-sis and Measurement Invariance’, Europe’s Journal of Psychology 13, 93–108 (http://doi.org/10.5964/ejop.v13i1.1163).
PETERS, M.L., I.K. FLINK, K. BOERSMA & S.J. LINTON (2010) ‘Manipulating Optimism: Can Ima-gening a Best Possible Self be Used to Increased Positive Future Expectancies?’ Journal ofPositive Psychology 5, 204–11 (http://doi.org/10.1080/17439761003790963).
PETRILLO, G., CAPONE, V., CASO, D., & KEYES, C. L. M. (2015). The Mental Health Continuum–Short Form (MHC–SF) as a Measure of Well-Being in the Italian Context’, Social IndicatorsResearch 121, 291–312 (http://doi.org/10.1007/s11205-014-0629-3).
QIAN, Y. & Z. QIAN (2015) ‘Work, Family, and Gendered Happiness Among Married People inUrban China’, Social Indicators Research 121, 61–74 (https://doi.org/10.1007/s11205-014-0623-9).
REISE, S.P., D.S. KIM, M. MANSOLF & K.F. WIDAMAN (2016) ‘Is the Bifactor Model a Better Modelor is it Just Better at Modeling Implausible Responses? Application of IterativelyReweighted Least Squares to the Rosenberg Self-Esteem Scale’, Multivariate BehavioralResearch 51, 818–38.
ROTHMANN, S. (2013) ‘From Happiness to Flourishing at Work: A Southern African Perspective’,in M.P. WISSING, ed., Well-being research in South Africa (The Netherlands: Springer.)123–151.
ROTHMANN, S. (2014) ‘Flourishing in Work and Careers’ in M. COETZEE, ed., Psycho-SocialCareer Meta-Capacities (The Netherlands: Springer) 203–20.
RYFF, C.D. (1989) ‘Happiness is Everything, or is it? Explorations on the Meaning of Psycholog-ical Well-Being’, Journal of Personality and Social Psychology 57, 1069–81 (https://doi.org/10.1037/0022-3514.57.6.1069).
SALAMA-YOUNES, M. & A. ISMAÏL (2011) ‘Validation of the Factor Structure of the Mental HealthContinuum Short Form (MHC-SF) for Physically Active Old Out’,. World Journal of SportSciences 4, 24–30.
SCHUTTE, L. & M.P. WISSING (2017) ‘Clarifying the Factor Structure of the Mental Health Contin-uum Short Form in Three Languages: A Bifactor Exploratory Structural Equation ModellingApproach’, Society and Mental Health 7, 142–58 (http://doi.org/10.1177/2156869317707793).
SELIGMAN, M.E.P. (2011) Flourish: A Visionary New Understanding of Happiness and Well-Being(New York, NY: Free Press).
SINGH, K., M. BASSI, M. JUNNARKAR & L. NEGRI (2015) ‘Mental Health and Psychosocial Func-tioning in Adolescence: An Investigation Among Indian Students from Delhi’, Journal ofAdolescence 39, 59–69 (https://doi.org/10.1016/j.adolescence.2014.12.008).
UCHIDA, Y., V. NORASAKKUNKIT & S. KITAYAMA (2004) ‘Cultural Constructions of Happiness: The-ory and Empirical Evidence’, Journal of Happiness Studies 5, 223–39.
VAN DE SCHOOT, R., P. LUGTIG & J. HOX (2012) ‘A Checklist for Testing Measurement Invariance’,European Journal of Developmental Psychology 9, 486–92 (http://doi.org/10.1080/17405629.2012.686740).
VAN ZYL, L.E. & S. ROTHMANN (2012a) ‘Beyond Smiling: The Evaluation of a Positive Psycho-logical Intervention Aimed at Student Happiness’, Journal of Psychology in Africa 22, 369–84 (https://doi.org/10.1080/14330237.2012.10820541).
VAN ZYL, L.E. & S. ROTHMANN (2012b) ‘Flourishing of Students in a Tertiary Education Institu-tion in South Africa’, Journal of Psychology in Africa 22, 593–99 (https://doi.org/10.1080/14330237.2012.10820573).
L.E. VAN ZYL & CH. OLCKERS258
EJMH 14:2, December 2019

VANDENBURG, R.J. & C.E. LANCE (2000) ‘A Review and Synthesis of the Measurement InvarianceLiterature: Suggestions, Practices, and Recommendations for Organizational Research’,Organizational Research Methods 3, 4–69 (http://doi.org/10.1177/109442810031002).
VEENHOVEN, R. (2015) ‘Social Conditions for Human Happiness: A Review of Research’, Inter-national Journal of Psychology 50, 379–91 (https://doi.org/10.1002/ijop.12161).
WANG, J. & X. WANG (2012) Structural Equation Modelling: Applications Using Mplus (Chichester,UK: Wiley & Sons).
WESTERHOF, G.J. & C.L.M. KEYES (2010) ‘Mental Illness and Mental Health: The two ContinuaModel across the Lifespan’, Journal of Adult Development 17, 110–19 (http://doi.org/10.1007/s10804-009-9082-y).
WOODRUFF, S.C., C.R. GLASS, D.B. ARNKOFF, K.J. CROWLEY, R.K. HINDMAN & E.W. HIRSCHHORN
(2014) ‘Comparing Self-Compassion, Mindfulness, and Psychological Inflexibility as Pre-dictors of Psychological Health’, Mindfulness 5, 410–21.
WU, G., FEDER, A., COHEN, H., KIM, J. J., CALDERON, S., CHARNEY, D. S., & MATHÉ, A. A. (2013).‘Understanding Resilience’, Frontiers in Behavioral Neuroscience 7, Nr. 10 (http://doi.org/10.3389/fnbeh.2013.00010).
ŻEMOJTEL‐PIOTROWSKA, M., J.P. PIOTROWSKI, E.N. OSIN, J. CIECIUCH, B.G. ADAMS, R. ARDI, R.,S. BĂLŢĂTESCU, S. BOGOMAZ, A.L. BHOMI, A. CLINTON, G.T. DE CLUNIE, A.Z. CZARNA, C.ESTEVES, V. GOUVEIA, M.H.J. HALIK, A. HOSSEINI, N. KHACHATRYAN, S.V. KAMBLE, A.KAWULA, V.M. LUN, D. ILISKO, M. KLICPEROVA-BAKER, K. LIIK, E. LETOVANCOVA, S.M.CERRATO, J. MICHALOWSKI, N. MALYSHEVA, A. MARGANSKI, M. NIKOLIC, J. PARK, E. PAS-PALANOVA, P.P. DE LEON, G. PÉK, J. RÓŻYCKA-TRAN, A. SAMEKIN, W. SHAHBAZ, T.T. KHANH
HA, H. TILIOUINE, A. VAN HIEL, M. VAUCLAIR, E. WILLS-HERRERA, A. WŁODARCZYK, I.YAHIIAEV & J. MALTBY (2018) ‘The Mental Health Continuum‐Short Form: The Structureand Application for Cross‐Cultural Studies–A 38 Nation Study’, Journal of Clinical Psy-chology 74, 1034–52 (http://doi.org/10.1002/jclp.22570).
ZINBARG, R.E., W. REVELLE, I. YOVEL & W. LI (2005) ‘Cronbach’s α, Revelle’s ß, and McDonald’sωh: Their Relations with Each Other and two Alternative Conceptualizations of Reliability’,Psychometrika 70, 123–33 (http://doi.org/10.1007/s11336-003-0974-7).
THE MENTAL HEALTH CONTINUUM-SHORT FORM 259
EJMH 14:2, December 2019