THE MECHANISM OF NUCLEATE POOL BOILING HEAT …
159
THE MECHANISM OF NUCLEATE POOL BOILING HEAT TRANSFER TO SODIUM AND THE CRITERION FOR STABLE BOILING Isaac Shai January 1967 DSR 76303-45 Engineering Projects Laboratory Department of Mechanical Engineering Massachusetts Institute of Technology Contract No. AT(30-1)3357,A/3 ENGINEERING NGINEERING 4GINEERING 1INEERING 'NEERING 'EERING ERING 'RING ING iG PROJECTS LABORATORY PROJECTS LABORATOR PROJECTS LABORATO' PROJECTS LABORAT PROJECTS LABORK PROJECTS LABOR PROJECTS LABO PROJECTS LAB' PROJECTS LA PROJECTS L PROJECTS PROJECT 7 R.OJEC
Transcript of THE MECHANISM OF NUCLEATE POOL BOILING HEAT …

THE MECHANISM OF NUCLEATEPOOL BOILING HEAT TRANSFERTO SODIUM AND THE CRITERIONFOR STABLE BOILING
Isaac Shai
January 1967
DSR 76303-45
Engineering Projects LaboratoryDepartment of MechanicalEngineeringMassachusetts Institute ofTechnology
Contract No. AT(30-1)3357,A/3
ENGINEERINGNGINEERING4GINEERING1INEERING
'NEERING'EERING
ERING'RING
INGiG
PROJECTS LABORATORYPROJECTS LABORATORPROJECTS LABORATO'PROJECTS LABORATPROJECTS LABORKPROJECTS LABORPROJECTS LABOPROJECTS LAB'PROJECTS LAPROJECTS LPROJECTSPROJECT 7
R.OJEC

DSR 76303-45
MECHANISM OF NUCLEATE POOL BOILING HEATTRANSFER TO SODIUM AND THE CRITERION FOR
STABLE BOILING
Isaac Shai
Atomic Energy Commis sion
Contract AT(30-1)3357, A/3

1in1.MEHEIIMIjhh
ABSTRACT
A comparison between liquid metals and other common fluids,
like water, is made as regards to the various stages of nucleate pool
boiling. It is suggested that for liquid metals the stage of building
the thermal layer plays the most significant part in transfer heat
from the solid. On this basis the transient conduction heat transfer
is solved for a periodic process, and the period time is found to be
a function of the degree of superheat, the heat flux, and the liquid
thermal properties.
A simplified model for stability of nucleate pool boiling of
liquid metals has been postulated from which the minimum heat flux
for stable boiling can be found as a function of liquid-solid properties,
liquid pressure, the degree of superheat, and the cavity radius and
depth.
Experimental tests with sodium boiling from horizontal sur-
faces containing artificial cavities at heat fluxes of 20, 000 to 300, 000
BTU/ft hr and pressures between 40 to 106 mm Hg were obtained.
At relatively low heat fluxes, convection currents have
significant effects on the period time of bubble formation. An empirical
correlation is proposed, which takes into account the convection effects,
to match the experimental results.
Some recorded temperature variations in the solid close to the
surface during stable nucleate boiling are presented.
- 3 -
111311911Hh'' 1111d, , " , " "
-.4.
TABLE OF CONTENTS
Page
ABSTRACT..... . . . . . . . . . . . . . . . . . . . . . . 3
TABLE OF CONTENTS . . . . . . . . . . . . . . . . . . . . . 4
LIST OF FIGURES . . . . . . . . . . . . . . . . . . . . . . 7
NOMENCLATURE . . . . . . . . . . . . . . . . . . . . . . . 9
1. INTRODUCTION . . . . . . . . . . . . . . . . . . . . . . 12
2. MECHANISM OF POOL BOILING . . . . . . . . . . . . . . . 14
2.1 Introduction 14
2.2 The Various Stages of Nucleate Boiling 14
2.2.1 Thermal Layer 142.2.2 Initiation of Bubble Growth 152.2.3 Bubble Growth 152.2.4 Bubble Departure 162.2.5 The Various Stages as Regards to Liquid Metals 16
2.3 Detailed Analysis on the Formation of Thermal Layer 17
2.3.1 Remarks 172.3.2 Mathematical Formulation 182.3.3 Periodic Behaviour of the Phenomena 21
3. STABILITY OF NUCLEATE POOL BOILING . . . . . . . . . . . 25
3.1 General Considerations 25
3.2 Stability Criterion Obtained by Marto (5) 26
3.3 A New Criterion for Stable Boiling of Alkali Metals 27
3.4 The Variables Affecting Stable Boiling 29
3.4.1 Cavity Geometry 293.4.2 Fluid Properties and Pressure 303.4.3 Solid Properties 303.4.4 Comparison Between Equations (22) and (26) 31
3.5 Stability for Fluids of Low Thermal Conductivity 31
-5-
Page
4. DESCRIPTION OF EQUIPMENT . . . . . . . .. . .. . . . . . 32
4.1 Boiler-Condenser 32
4.2 Main Heater 34
4.3 High Vacuum System 36
4.4 Helium Cover Gas Line 37
4.5 Sodium Fill System 38
4.6 Containment and Safety Equipment 39
4.7 Safety Controls 39
4.8 Instrumentation 40
5. EXPERIMENTAL PROCEIJRE . . . . . . . . . . . . . .. .. 44
5.1 General 44
5.2 Preparation of Test Surfaces 44
5.2.1 Surfaces for Repeating Marto's Work 445.2.2 Surfaces with an Artificial Cavity and a
Permanent Thermocouple 455.2.3 Surfaces with an Artificial Cavity and
Without a Permanent Thermocouple 46
5.3 Preparation of the System 47
5.4 The Operation Method 49
5.5 Reducing of Data 51
6. RESULTS AND DISCUSSION . . . . . - - - - - - - - - - . 54
6.1 Observations 54
6.1.1 Natural Convection 546.1.2 Stable Nucleate Boiling 546.1.3 Unstable Boiling or Bumping 55
6.2 Experimental Results 56
6.3 Empirical Correlation 60

-6-
Page
6.4 The Limiting Curve for Stable Boiling 61
6.5 Plots of Heat Fluxes Versus Superheat 63
T. SUMARY AND CONCLUSIONS . . . . . . . . .. ... . . .... .64
BIBLIOGRAPHIY . . . . . . . . . . . . .. . . . . . .. .. .. 67
APPENDICES o..... . . . . . . . . . . . . . . . . . .o..
A. Solution to the Transient Heat Conduction 70
B. The Conditions for a Periodic Process 76
C. Liquid Superheat During Stable Boiling 78
D. Bubble Growth and Departure in Liquid Metals 82
D.1 Growth Controlled by Heat Conduction 82D.2 Growth Controlled by Evaporation 83D.3 Growth Controlled by Mass Inertia of Displaced 84
Liquid
E. The Critical Penetrating Distance 85
F. Tabulation of Experimental Results 89
G. Calculated Example 102
H. Table No. 1 105

-7-
LIST OF FIGURES
Fig. No. Title Page
1 Wall Surface Temperature Variations during BubbleFormation and Departure of Liquid Toluene fromGlass (copied from Cooper (9)) 1o6
2 Initial Temperature Distribution in the Solid andin the Liquid 107
3 Temperature Variations in the Solid Equation (18) 108
4 Variations of Heat Flux at the Surface (Equation 20) 109
5 The Ratio of the Critical Cavity Length to theRelaxation Length 110
6 Schematic Diagram of Apparatus 111
7 Partial Assembly of Equipment 112
8 General View of Heat Transfer Facility 113
9 Boiler Parts 114
10 Heater and Boiler Sectional Drawing 115
11 Condenser Sectional Drawing 116
12 View of Condenser 117
13 Overhead View of Main Heater 118
14 Electrical Wiring Diagram for Control System 119
15 Adjustable Vertical Probe 120
16 Boiler Plate of Marto (5) 121
17 Sample of Doubly Re-Entrant Cavity 0.004-inchMouth Dia. x 0.025-inch Deep 122
18 Boiler Plate with an Artificial Cavity with aPermanent T. C. 123
19 Surface with Mirror Finish (Looking from Top ofthe Boiler) 124
20 Boiler Plate with an Artificial Cavity WithoutPermanent T. C. 125
MMUMM111111141",

-8-
Fig. No. Title Page
21 Temperature Variations During Bumping 126
22 q0/w(0,0) vs. T 12723 Traces of Temperature Variation During Stable
Boiling 128-130
24 Traces of Temperature Variation During StableBoiling 131-133
25 Traces of Temperature Variation During StableBoiling 134-139
26 Traces of Temperature Variation During StableBoiling 140-143
27 Temperature Variations in the Solid as Functionof Time (With the Position as a Parameter) 144
28 Minimum Heat Fluxes for Stable Boiling 145
29 Transition from Stable Boiling to NaturalConvection 146
30 Minimum Heat Fluxes for Stable Boiling for theCases of Marto (5) and Hoffman (18) 147
31 Run No. 1 148
32 Runs No. 2 and 5 149
33 Runs No. 3 and 4 150
34 Runs No. 6 and 7 151
35 Runs No. 8 and 9 152
36 Runs No. 10 and 11 153
37 Run No. 12 154
38 Run No. 13 155
39 Run No. 14 156
40 Superheat in Liquid Sodium 157
41 The Approximated Equation (E-10) 158
42 Calculated Example for Reducing Data 159

-9-
NOMENCLATURE
a constant in Equation (1)
A constant in Equation (C-4)
b constant in Equation (1)
b* empirical constant in Equation (22)
B constant in Equation (C-4)
c constant in Equation (1)
c specific heat
c, c2 constants in Equation (A-8a)
c3, c4 constants in Equation (A-8b)
g gravity acceleration
h empirical constant in Equation (30)
h fg latent heat of vaporization
I function of f , Equation (12)
J function of ( , Equation (14)
k thermal conductivity
K function of , Equation (21)
cavity depth
L relaxation length
M molecular weight
n positive integer
p pressure
p vapor pressure in equilibrium with the liquid along
curvature interface
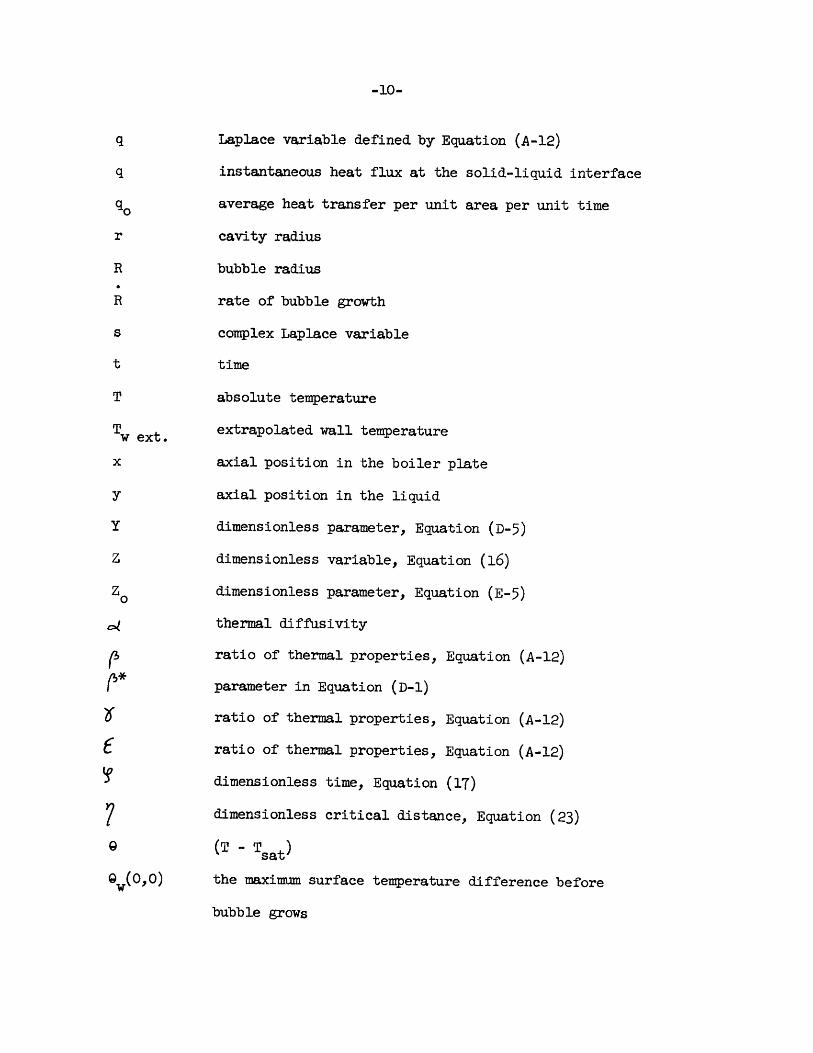
q Laplace variable defined by Equation (A-12)
q instantaneous heat flux at the solid-liquid interface
g 0 average heat transfer per unit area per unit time
r cavity radius
R bubble radius
R rate of bubble growth
s complex Laplace variable
t time
T absolute temperature
T ext. extrapolated wall temperature
x axial position in the boiler plate
y axial position in the liquid
Y dimensionless parameter, Equation (D-5)
Z dimensionless variable, Equation (16)
Z 0 dimensionless parameter, Equation (E-5)
thermal diffusivity
ratio of thermal properties, Equation (A-12)
parameter in Equation (D-1)
ratio of thermal properties, Equation (A-12)
C ratio of thermal properties, Equation (A-12)
dimensionless time, Equation (17)
dimensionless critical distance, Equation (23)
(T - Tsat)
Q(0,0) the maximum surface temperature difference before
bubble grows
-10-

-11-
w(0,0)
9 (0)
I(
Subscripts
cr
d
fsat
v
w
the critical position and time for which the minimum
temperature is equal to 9 (0,0)
condition at bubble departure
liquid
saturation conditions at the liquid pressure
vapor
boiler plate
the temperature gradient at the surface before bubble
grows
the second derivative of temperature with respect to
position, before bubble grows (not function of position)
dynamic viscosity
density
surface tension
coefficient in Equation (D-4)
the waiting time
dimensionless time, Equation (D-6)
contact angle
a function defined by Equation (D-1)

-12-
1. INTROIXJCTION
The study of heat transfer in pool boiling was primarily performed
with non-metallic fluids.
In recent years with the developments of nuclear reactors, the
application of liquid metals as a coolant has become important because
of their high boiling point. Although none of the designed reactors
are based on boiling liquid metals, it is of interest to consider the
conditions of boiling in the case of loss of coolant during regular
operation.
In previous works of pool boiling with liquid metals (l_), (2_),
(3_), (4_), (L), and others, it was found that during boiling there
exist significant temperature fluctuations close to the heating sur-
face. At low pressures of the order of 1 psi and at heat fluxes below
100,000 BTU/ft2hr, these fluctuations were not regular and were accom-
panied by a big audible "bump." Also, the data obtained were quite
scattered. Noyes (3_), Marto ( 5), and others concluded that these
scattering in the data are due to the effects of the conditions of the
heating surface.
Using the fluid properties, Krakoviak (6_) theoretically explained
why such "bumps" should be expected. Recently, Marto (5_) established
a criterion combining the properties of the liquid and boiler material
(including cavity size) which predicts which surface fluid combination
at a given heat flux and pressure will have stable nucleate boiling.
His criterion is based on the mechanism of heat transfer to a growing

-13-
bubble and the surface behaviour suggested for water by Moore (L) and
Bonnet (8_).
In non-metallic fluids there exist two basic hypothesis for the
mechanism of heat transfer in nucleate pool boiling:
I. The mechanism of a microlayer of superheated liquid at the
base of a growing bubble evaporates with heat fluxes from
the metal surface higher than the average heat flux. (7)
(8_), (9_)
II. The mechanism of builing a thermal layer by transient con-
duction heat transfer which transfers heat to the growing
bubble. The thermal layer is carried away from the surface
after the bubble departure. In this mechanism high heat fluxes
from the solid surface exist when the thermal layer is built.
(19), (11)
The recent work of Cooper (9_) with toluene boiling on glass shows
that probably the two mechanisms co-exist. The combined properties of
the fluid and the solid will determine which one of the two mechanisms
plays the most significant role in each case.
The purpose of the present work is to establish the dominant
mechanism of heat transfer in nucleate pool boiling with alkali metals,
in particular sodium, based on theoretical analysis and experimental
results. After the mechanism of heat transfer has been established, a
model for the behaviour of an active cavity can be adopted. From this
model a criterion is developed combining all the important parameters
of the liquid-solid combination. This criterion predicts the minimum
heat flux for stable boiling under the operating conditions.

2. M4ECHANISM OF POOL BOILING
2.1 Introduction
By nature nucleate pool boiling is a nonequilibrium phenomena, where
a heated solid transfers heat to the fluid adjacent to the surface and
forms bubbles from active cavities. In spite of the nonequilibrium, it
is possible to consider a quasi-steady state process when the formation
of bubbles and their departure occur in a periodic fashion. The exact
details of each part of a full cycle are quite complicated, but it has
become common to divide the full cycle into several distinct stages.
I. Building a superheated thermal layer in the liquid near the
heated surface
II. Establishing the conditions for bubble growth from an active
cavity in thermal and mechanical equilibrium.
III. Bubble growth.
IV. Bubble departure accompanied by a removal of the thermal layer.
The cycle is repeated when cold liquid comes in coitact with the
solid surface.
Although the various stages are interrelated, it is worthwhile to
analyze each one separately to discover the main factors governing each
part.
2.2 The Various Stages of Nucleate Pool Boiling
2.2.1 Thermal Layer
The creation of a thermal layer in the liquid is a process of
transient conduction heat transfer, when two bodies initially at differ-
ent temperatures are brought in contact. The time required to build

-15-
the thermal layer and the temperature history of the two bodies are
functions of the physical properties of both the fluid and the solid
as well as the solid surface conditions, the fluid pressure, and the
average heat flux transferred from the solid. More detail analysis
is given in (2.3).
2.2.2 Initiation of Bubble Growth
A bubble starts to grow from an active cavity, which is a cavity
filled with vapor or gas. In this state the new born bubble is in
thermodynamic and mechanical equilibrium with the superheated liquid
adjacent to the surface. The degree of superheat is a function of the
cavity mouth size as well as the fluid pressure and properties. The
mathematical formulation of the superheat is given in Appendix C.
2.2.3 Bubble Growth
This part is the most complicated one, since the shape of the
growing bubble is not well defined; furthermore, the temperature and
the pressure fields around the bubble are not simple.
In order to analyze this stage, several models were adopted, most
of which consider a spherical bubble.
One common model considers the growth of a bubble by heat conduc-
tion from the thermal layer around the growing bubble and evaporation
taking place in the interface between the liquid and the vapor. (11)(12)
More recently the experiments of Moore and Mesler (L), Bonnet, et
al., (8_), Cooper and Lloyd (L), and others show that a more important
factor in bubble growth may be the evaporation of a superheated micro-
layer which is formed between the solid surface and the growing bubble.
010''

This process is accompanied by a large temperature drop in the solid
surface and a quick recovery when the surface dries out. It is visual-
ized that as the bubble grows rapidly the viscous effects very near
the solid surface cause this small layer of liquid to be left on the
surface under the bubble. The rate of growth of a bubble in one compo-
nent liquid is controlled by three different mechanisms acting simultane-
ously, which are as follows: The inertia of the displaced liquid, the
heat conduction in the liquid, and the rate of vaporization in the inter-
face. Which one of these will provide the greatest resistance for growth
rate will depend on the properties of the liquid, its pressure, and the
degree of superheat.
2.2.4 Bubble Departure
The bubble will depart from the surface when the bouyancy force will
overcome the surface tension force and the inertia force due to the
resistance of flow which in turn is related to the rate of growth. (13)
2.2.5 The Various Stages as Regards to Liquid Metals
As was emphasized before, in all the above-mentioned stages, the
physical properties of the liquid are very important. In comparison
with common liquids, for example water, liquid metals have much greater
thermal conductivity. It therefore would not be surprising to obtain
quite different behaviour of liquid metals during the various stages
of pool boiling.
First, the degree of superheat will be much greater in liquid metals
than in water for the same pressure and cavity size. This can be easily
seen from Equation (C-13) of Appendix C, since the degree of superheat

is the function of the absolute boiling temperature squared, and these
values are much higher in liquid metals than in any common liquids.
Second, for the same cavity size, pressure, and heat flux, the
time required to build the thermal layer as well as its thickness will
be much greater in liquid metals than in other liquids.
Third, the rate of bubble growth in liquid metals will be mostly
controlled by the inertia terms and vaporization rates rather than by
heat conduction. This provides much greater growth rates, or shorter
growth time (see Appendix D). Finally, the bubble size at the depar-
ture is greater in liquid metals than in water, which means that each
cavity influences a greater area.
From what has been said above, it becomes obvious that the period
(or frequency) of bubble formation and departure in pool boiling of
liquid metals will be almost solely controlled by the first stage of
boiling, namely, the formation of a thermal layer. In this stage most
of the heat is transferred from the solid to the liquid, and, therefore,
a more detailed analysis of this part of the boiling will provide the
necessary information to understand the behaviour of liquid metals boil-
ing.
2.3 Detailed Analysis on the Formation of Thermal Layer
2.3.1 Remarks
In general, any heating surface consists of randomly distributed
cavities of various sizes, which make any treatment a two-dimensional
one. To simplify the problem, we assume that heat conduction in the
liquid that flow to the heating after bubbles leave can be treated
as a one-dimensional problem.
imiiiiiimklllllullld W'l 11 RIM

The recent work of Copper (j) for boiling toluene on glass shows
that the surface temperature drops twice in a boiling cycle. The first
temperature drop, Figure 1, is due to evaporation taking place from a
superheated microlayer during bubble growth, and the second temperature
drop is due to cold liquid coming to the surface after bubble departure.
As discussed in paragraph 2.2.5, the time for bubble growth and depar-
ture in liquid metal is very short compared with the waiting time before
the next bubble forms. We shall therefore consider here only the effect
of cold liquid coming to the surface and ignore completely any effects
during bubble growth. This means that the temperature profile in the
solid before the bubble starts to grow is the same as after bubble depar-
ture and cold liquid comes to the surface.
2.3.2 Mathematical Formulation
After a bubble and its influenced thermal layer have left the sur-
face, cold liquid at saturation temperature comes in contact with the
solid surface. To solve the transient heat conduction, we shall use
the following assumptions:
I. The problem is one dimensional.
II. The liquid is semi-infinite and stagnant.
III. Constant liquid and solid properties.
IV. No interfacial thermal resistance between the solid and the
liquid.
V. The liquid is at saturation temperature.
VI. The temperature profile in the solid is a parabolic function
up to a certain length (X = L) from the surface, where the
temperature gradient becomes equal to the average gradient

-19-
during a full cycle. Beyond this point the gradient is con-
stant with time and position.
The implication of assumption VI is:
(See Figure 2.)
&c (x, 0) =
where F =
a + Xx + C X
6 = T - TsaT.
at = OW (0, 0)
f, = ow (0, 0)
G"(o)C = 2
and
DOW (L/O)= constantx - kw
(4)
also (X,0)= 9+ 2CX . Set X=L and with Equations (3) and (4) find
L - gw(00) (5)O"(0)
The energy equations for the solid and the liquid:
I DO494
x 2 -(6a)
(6b)):2 e _ If DG
with the initial conditions at t = 0
o-, x L OW (X;0) = o*0) 0 0) *
0 4 ,y0) =0
(Ta)
(7b)
o0<X,< L (1)
(2)
(3)
I- -- MOMMUMME111141iffil

-20-
and the boundary conditions
X=L
oc-p- o
t>O
- constant6w(t x
Lg(o )=
, d=
OW(c1')
~9e&~tJ _ 09(0t)4d xBy solving simultaneously Equations (6) with the initial and boundary
conditions, and using the Laplace transformation, we find the temperature
history in the liquid and in the solid. Full solution is given in Appen-
dix A.
The simplified solutions (A-16c and (A-16d) are given below:
OW fXt) = -- o erfc. 2
O39(0,0)+ /5
44x t
X 2
- X e/-
x2 2+ [i-
+ (0,0) 40 [
ey/ci2)
t>0 j (8a)
(8b)
(9a)
(9b)
Gj% i ) =-4 f
(10a)
+f0,0 1o 4' Z) e 2-N e
(lob)
OW (x, 0) + e t C (0)
(O f0) e r- 20e ) y/C-~
fro?,

-21-
These solutions contain three undetermined terms as &, (0, 0) ,
Ow (0,0) , and 0.(0) . It will be shown in Appendix C that OV0-O)
is a function of the cavity size and the pressure only. The other two
terms will be evaluated in Appendix B by using the conditions of a
periodic process.
2.3.3 Periodic Behaviour of the Phenomena
As was mentioned before, stable boiling is a quasi-steady state
process in which all the temperature variations occur in a periodic
way within the relaxation length L. This cycling behaviour requires
that the temperatures and the temperature gradients will be the same
after each full cycle. Furthermore, the average heat flux at the sur-
face must be equal to the constant heat flux far away from the surface
where no variations of temperature occur during the cycle.
Applying these three requirements to the temperature distribution
in the solid (Equation 10a) will give us the periodic time 5 as a func-
tion of measurable values. (See Appendix B.)
6&(o,0) 4 e c
where 1()= 6'W 6 7P 70 -,-16 (12)3FT(1+&)(Tf+4)
The time T is, in general, the waiting time required to build
the thermal layer. Since (10 ) is not a strong function of properties
(see Table 1), this time is a function of the liquid properties as well
as the cavity geometry, the heat flux, and the pressure and almost
MINIWMIIWIA

-22-
independent of solid physical properties. In the case of liquid metals,
this time is much longer than the bubble growth time; therefore, it is
the period time for bubble formation.
Equation (11) can be easily tested by varying one or more of its
parameters. For example, one can use a given cavity size and vary the
pressure while the heat flux is kept constant or alternatively vary the
heat flux while the pressure is kept constant. Moreover, different
cavity sizes can be used together with variation in pressures and heat
fluxes.
Another quantity can be derived from the analysis of transient
heat conduction together with the cycling behaviour. This quantity
is the relaxation length L within which the temperature variations
occur and beyond which the temperature profile remains unaltered dur-
ing all the stages of stable boiling.
Using Equations (B-T), (B-8), and (B-10) in the definition of L
Equation (5), we find
L- 9o/k - If60 0 )- PW J-(/3) (13)OW (13)
where 3 IT/!' 2 + (14)
J( ) is a very weak function of / as shown in Table 1. This valueL
is greater than 1.55 for any /3, which makes > 1.55 as was pointed
out in Appendix A.
Rearranging Equation (13) with the help of Equation (11), we find
L as a function of the degree of superheat and the heat flux

-23-
L _ o,o) V ke ift Ce d4 V) (15)O
Equation (15) provides some limitation on the minimum thickness
of the heating solid of the pool. If the thickness of the heating solid
is smaller than the calculated one from this equation, variation in
temperature will occur at every point of the solid during the transient
period, and the above analysis would not hold.
Finally, it is of interest to find out what kind of temperature
variations should be expected at any distance within the relaxation
length.
Defining now two dimensionless variables
XZ =(16)
(17)
then Equation (10a) can be written with the help of (B-7) and (B-8)
and (7-a)
G, A, Y)10 l~ rZ + crl {#4 er/<)+e +I-f- [ 3 L Z)/3~
+~ (18)
The maximum temperature variation will occur at the surface where
Z = 0.
P Q4)(0o + 2(2+/3) IT-2

Equation (19) shows that for large values of P the temperature varia-tions at the surface will approach zero. This is the case for fluids
of very low thermal conductivity in contact with solid material of
high thermal conductivity. For the case of liquid metals where is
of the order of 2, we would expect large temperature variations at the
surface, even at so-called stable boiling.
The variations of heat flux at the surface can also be found from
Equation (10a)
DowA' (0 ) - + r'+ 4) 2f3 (lr-2)x+(z+ ) + (2+) j (20)
where k- 3Tr(+5)(2+@ (21)MT+ -t- "2+ 7 9/3+ 16|
Equations (18), (19), and (20) are plotted in Figures (3) and (4),
respectively.

-25-
3. STABILIT! OF RUCLEATE POOL BOILING
3.1 General Considerations
Boiling from a heated surface in a pool is taking place by
heterogeneous nucleation (14) from active cavities in the solid sur-
face. Those cavities which have trapped vapor and a size correspond-
ing to the liquid superheat are called active cavities. During the
various stages of boiling, some active cavities may become de-active
if all the trapped vapor condenses, and only those cavities which suc-
ceed in maintaining vapor remain active cavities. If under certain
conditions all the active cavities in the surface become de-active,
the boiling will stop, and the heat will transfer by natural convec-
tion only. Since the heat transfer coefficient for boiling is much
higher than that for natural convection, it should be expected to
have a temperature rise in the heating solid when boiling stops. This
temperature rise increases the liquid superheat and might activate
smaller cavities (see Equation (C-10))which in turn when boiling resumes
will re-activate even larger cavities. This phenomena causes fluctua-
tion of temperatures between the boiling point and the natural convec-
tion point for a given heat flux, and it is called unstable boiling,
or bumping.
As will be shown later, stability of boiling of ordinary fluids
exists almost always. On the other hand, several investigators (2_),
(3), (5_) have reported unstable behaviour of liquid alkali metals
during boiling. Prior to these observations no one had observed these
instabilities.
=101i'liffi,

-26-
3.2 Stability Criterion Obtained by Marto (5_)
Marto was the first who attacked analytically the stability prob-
lem. He considered the case of a right cylindrical cavity filled with
vapor immediately after a bubble has departed and cold liquid comes in
contact with the surface. He assumed that at that moment the surface
temperature was cooled down to the coming liquid temperature. By solv-
ing the energy equation for the penetrating liquid into the cavity while
condensation takes place in the liquid-vapor interface, he found the
conditions when condensation will stop.
His criterion for stability states that if a cavity is deep enough,
such that the penetration distance of the liquid into the cavity is
smaller than the cavity depth, then the cavity will be an active cavity
from which stable boiling exists. On the other hand, if the cavity
depth is smaller than that distance, the cavity will bede-activated,
and boiling will stop. Any re-entry type cavity will be stable because
the liquid-vapor interface must pass a point of infinite radius of curva-
ture.
Since Equation (21) of Marto (5_) involves some experimental con-
stants which were obtained with water boiling from stainless steel (15)
and could not be applied to other surfaces or different liquids, it
would be more convenientto re-write Marto's criterion in the following
approximate form:
-. (-kw jT2 (22)* 4' , f, h . (h + s t c(()S'je

where is the contact angle;
is an experimental value, taken as 20;
is the cavity depth.
In reaching Equation (22) Marto assumed that the surface tempera-
ture drops during evaporation taking place from a superheated micro-
layer, and the temperature recovery starts after the bubble leaves the
surface. Recently, Cooper (9_) showed that for toluene boiling on glass
the surface temperature drops when the bubble grows, but the tempera-
ture recovery starts and is almost completed before the bubble leaves
the surface. This means that during this time, condensation cannot
take place.
A second temperature drop occurs when the cold liquid comes in
contact with the surface, (See Figure (1)), In this second temperature
drop, the surface temperature does not drop down as low as the satura-
tion temperature (see Equation (19)), and, therefore, the rate of con-
densation will be much smaller than is considered in Marto's analysis.
Furthermore, as is shown by Kroger (16) a thermal resistance to con-
densation plays a significant role in liquid metals which tends to
reduce further the rate of condensation, or the penetrating distance
by the liquid.
3.3 A New Criterion for Stable Boiling of Alkali Metals
This criterion analysis is based on the model adopted in Chapter 2.
We shall consider a cylindrical cavity of radius-to-length ratio,
such that the resistance to heat transfer radially in the cavity will
be an order of magnitude smaller than the resistance to heat transfer
UNINININIfildflAINH
-27-

-28-
in the solid along the cavity, or I > 10 r for liquid metals. This
choice of cavity geometry allows us to assume that the liquid tempera-
ture distribution in the cavity is the same as the temperature distribu-
tion in the cavity walls. The liquid temperature in the cavity is
therefore given by Equation (18), which describes the temperature varia-
tion in the solid at any distance from the surface during the waiting
time. At the same time the vapor temperature in the cavity is kept
constant at Tv = T (0, 0), Appendix C. Here T is the saturation tem-
perature corresponding to pv in the cavity.
As long as the liquid temperature at the liquid-vapor interface
will be below the vapor temperature, condensation of vapor will proceed,
and the liquid-vapor interface will penetrate into the cavity. The
condensation will stop when the liquid temperature at the interface
reaches the vapor temperature, TV'
From this consideration it follows that the condensation will stop
after the liquid travels a distance Xcr from the solid surface if dur-
ing the waiting time, the minimum temperature at that point will be
equal to the vapor temperature.
By equating to zero, the derivitive of Equation (10a) with respect
to time, we get a relation between the distance from the solid surface
and the time when the minimum temperature in a cycle occurs. Further-
more, by equating Equation (18) to the liquid superheat, we get another
relation between the same quantities.
From these two relations we can find the two unknowns as functions
of the relaxation length L and the solid-liquid properties. The mathemati-
cal treatment is given in Appendix E.
-29-
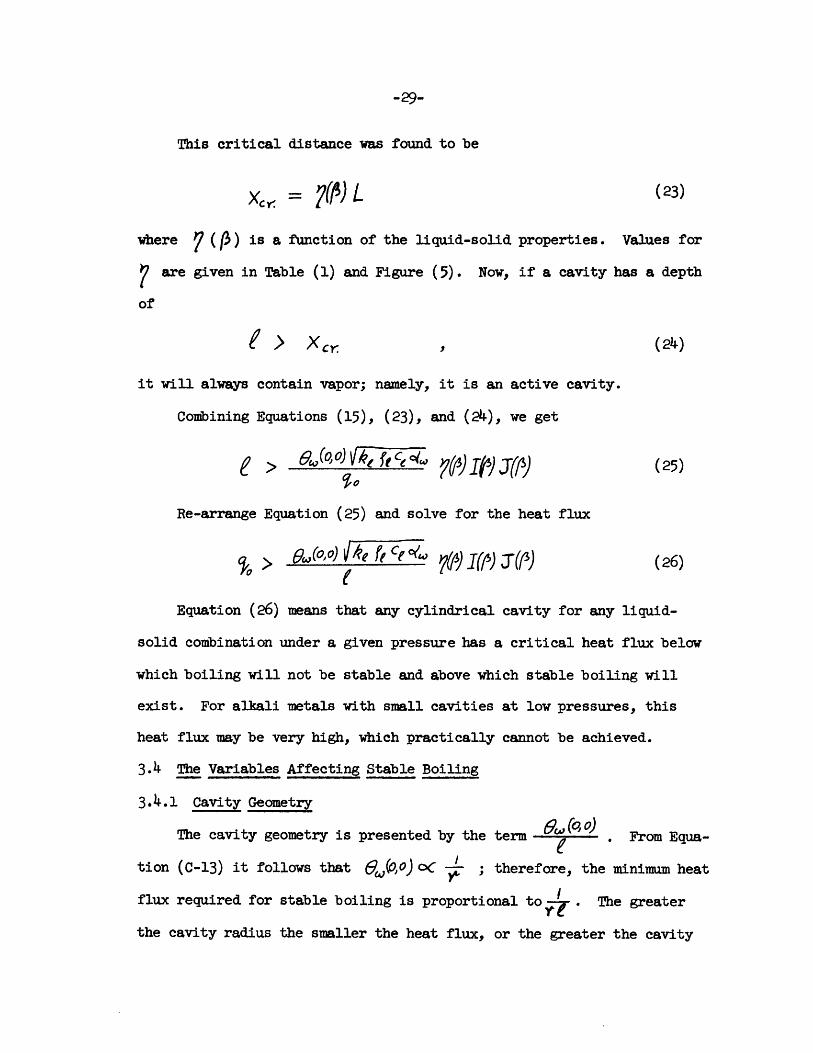
This critical distance was found to be
Xc (23)
where 7 (p3) is a function of the liquid-solid properties. Values for
7 are given in Table (1) and Figure (5). Now, if a cavity has a depth
of
S> Xc, , (24)
it will always contain vapor; namely, it is an active cavity.
Combining Equations (15), (23), and (24), we get
~,> ~,Oc.(0 ) k ftCe (25)
Re-arrange Equation (25) and solve for the heat flux
> W( fe ''O r)5) r(o (26)
Equation (26) means that any cylindrical cavity for any liquid-
solid combination under a given pressure has a critical heat flux below
which boiling will not be stable and above which stable boiling will
exist. For alkali metals with small cavities at low pressures, this
heat flux may be very high, which practically cannot be achieved.
3.4 The Variables Affecting Stable Boiling
3.4.1 Cavity Geometry
The cavity geometry is presented by the term . From Equa-
tion (C-13) it follows that 6,(00) o( ; therefore, the minimum heat
flux required for stable boiling is proportional to . The greater
the cavity radius the smaller the heat flux, or the greater the cavity
1=111011111141411'11"

-30-
depth the smaller the heat flux (keeping the ratio of >/Oy). It
should be emphasized here that any re-entry-type cavity does not obey
Equation (26), since Tv would not remain constant when the interface
liquid-vapor passes through the point of infinite radius of curvature.
3.4.2 Fluid Properties and Pressure
The effect of fluid properties on the minimum heat flux for stable
boiling is given in quite complicated terms (0,o)V "kefe ce )V) ) .As was said before (see Table (1)), 4 )JJ) are very weak functions of
P and, therefore, may be considered as constants. Although (a') is
a strong function of P , it varies very little for values of /3 >1.5,
which is the range for most of the fluid-solids combinations. The
greatest effect of fluid properties is therefore presented by the term2
O00) k f C . From Equation (C-13) it follows that 6(O,0)oC 8 T.
For fluids of high saturation temperature and high thermal conductivity,
as is the case for alkali metals, the minimum heat flux for stable boil-
ing is much higher than for water. On the other hand, as the saturation2
pressure increases, the term ~sar decreases, which in turn tends8 Psxr.
towards the decrease of the minimum heat flux.
3.4.3 Solid Properties
Solids of higher thermal diffusivity will tend to increase the mini-
mum heat flux since oc . This is due to the fact that in metals
of higher c the temperature fluctuation on the surface will penetrate
deeper into the solid than in metals of low c . This conclusion is
opposite to what was concluded by Marto (5_), but it is in agreement
with Equation (22) which is a modified equation of Marto.

-31-
3.4 .4 Comparison Between Equations (22) and (2
Although the modified Marto prediction (Equation (22)) differs in
form from the present prediction (Equation (26)), the effect of the
various variables is in very good agreement.
3.5 Stability for Fluids of Low Thermal Conductivity
In reaching the criterion for alkali metals, Equation (26), it
was assumed that the fluid has high thermal conductivity. This assump-
tion allows us to simplify Equation (C-12) to Equation (C-13). For the
case of fluids of low thermal conductivity, this assumption does not
hold; therefore, the values of 7 (/ ) are not correct. In order to
examine the case of fluids of low thermal conductivity, Equation (19)
together with Equation (C-12) should be used. From these two equations,
it can be easily shown that for fluids of low thermal conductivity boil-
ing from a metal surface, the solid temperature will never fall below
the vapor temperature, and stability is secured.
-32-
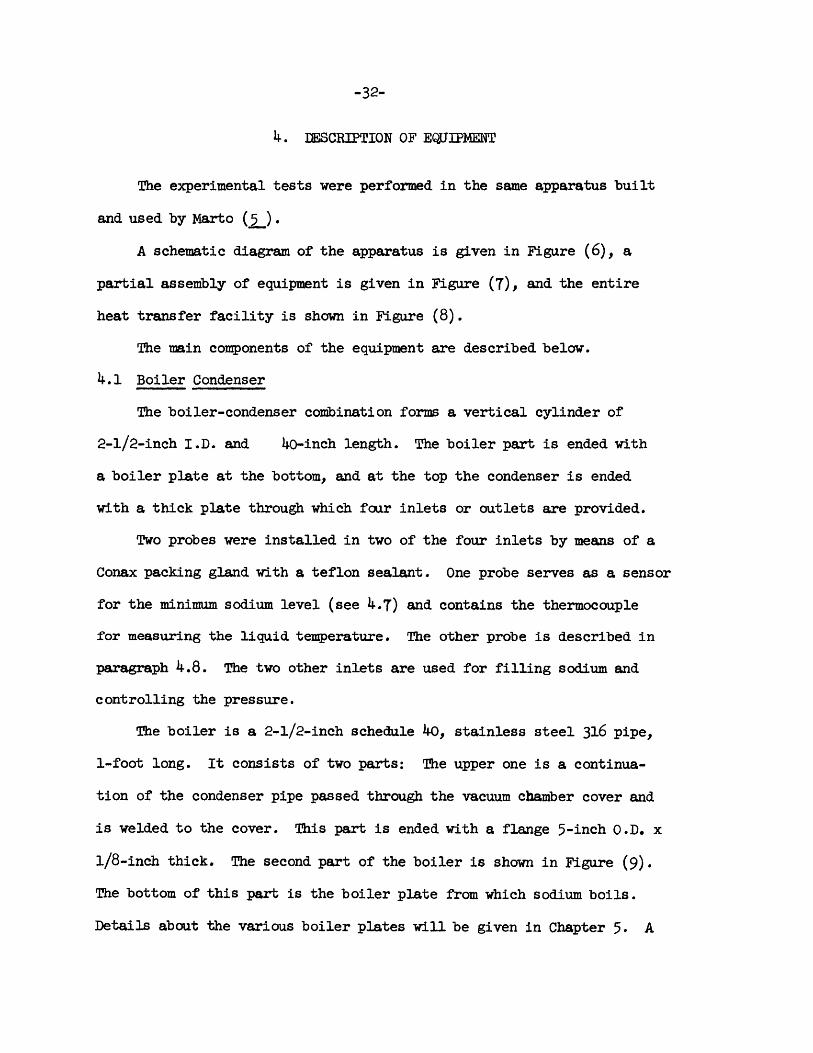
4. IESCRIPTION OF EQUIPMENT
The experimental tests were performed in the same apparatus built
and used by Marto (5_).
A schematic diagram of the apparatus is given in Figure (6), a
partial assembly of equipment is given in Figure (T), and the entire
heat transfer facility is shown in Figure (8).
The main components of the equipment are described below.
4.1 Boiler Condenser
The boiler-condenser combination forms a vertical cylinder of
2-1/2-inch I.D. and 40-inch length. The boiler part is ended with
a boiler plate at the bottom, and at the top the condenser is ended
with a thick plate through which four inlets or outlets are provided.
Two probes were installed in two of the four inlets by means of a
Conax packing gland with a teflon sealant. One probe serves as a sensor
for the minimum sodium level (see 4.7) and contains the thermocouple
for measuring the liquid temperature. The other probe is described in
paragraph 4.8. The two other inlets are used for filling sodium and
controlling the pressure.
The boiler is a 2-1/2-inch schedule 40, stainless steel 316 pipe,
1-foot long. It consists of two parts: The upper one is a continua-
tion of the condenser pipe passed through the vacuum chamber cover and
is welded to the cover. This part is ended with a flange 5-inch O.D. x
1/8-inch thick. The second part of the boiler is shown in Figure (9).
The bottom of this part is the boiler plate from which sodium boils.
Details about the various boiler plates will be given in Chapter 5. A

-33-
nickel pipe 2-1/2-inch I.D. x 3 inches long was welded to the boiler
plate. (See Figures(9) and (10).)
The extension of the nickel pipe was a 2-1/2-inch x 6 -inch
long schedule 40, stainless steel 316 pipe. This pipe is ended with
a flange 5-inch 0.D. x 1/8-inch thick to match the upper boiler part.
The two flanges were welded together to form the boiler. Each time a
different plate surface was tested, the weld of these flanges was ground
off, and a new set of the second boiler part was welded instead.
The condenser section is a vertical, 28-inch length of 2-1/2-inch
schedule 40 stainless steel 316 pipe with eighteen copper fins, 18-inch
long x 1-1/4-inch wide x 1/16-inch thick, silver soldered on the outside.
It is welded directly to the boiler pipe just above the vacuum chamber
cover. An outer jacket armf~ld steel which has the dimensions of 6-inch
0.D. x 5-3/4-inch I.D. x 28-1/4-inch long is fitted over this condenser
pipe to channel the air flow over the copper fins. A 120 CFM centrifugal
type air blower is attached to the inlet of this condenser cover by a
flexible connector. The air enters at the top of the condenser through
a horizontal 4-inch diameter x 3-inch long mild steel tube and is pre-
heated by a coil of Chromel "A" resistance wire wrapped around Transite
insulation. The air passes over the copper fins and leaves at the bottom
of the condenser through a horizontal 4-inch diameter x 3-inch long mild
steel tube which is attached by a flexible connector to a 6-inch gal-
vanized duct that leads to the main M.I.T. exhaust system. Flexible
connectors between the air blower and condenser inlet and between the
galvanized duct and condenser outlet are made of asbestos cloth inter-
woven with aluminum thread. The condenser is shown in Figures (11) and (12).

-34-
4.2 Main Heater
The heater consists of three tantalum 10 percent tungsten filaments
fastened in series between four tantalum clamps. The filaments are
.010-inch thick x 1-inch wide x 4-inch long. They are fabricated by
corrugating a .010 x 3 x 4-inch foil along the 4-inch axis with an inter-
nal angle of 30 degrees. An overhead photograph of the heater is shown
in Figure 13.
The filaments operate near 4000 OF (the melting point of tantalum
10 percent tungsten is approximately 5300 OF) and require the use of
a high vacuum system to prevent complete oxidation during operation.
In general, the heater is quite reliable, but there were several occa-
sions when one of the filaments cracked due to oxidation embrittlement
caused by the coarse grain structure of tantalum. These failures usually
took place after operation at high power levels in a poor vacuum (i.e.,
a vacuum greater than one micron).
Each filament is held in place by pressing it between two 1/4-inch
thick tantalum clamps which are machined to fit the filament corruga-
tions. This assembly is riveted together by placing a piece of tantalum
wire, 1A6-inch diameter x 5/8-inch long, through a .0635-inch diameter
drilled hole and by peening over the edges of the wire. This method of
attachment insures a good electrical contact at all times and facili-
tates dismantling.
The tantalum clamps are fastened to 1/8-inch thick molybdenum elec-
trodes using No. 10-32 x 3/4-inch long tantalum screws with hex. hd.
nuts. These molybdenum pieces are bolted to "L" shaped molybdenum

-35-
electrodes with 3/8-inch diameter x 1-inch long stainless steel cap
screws with hex. hd. nuts. The "L" shaped electrodes are slotted
vertically to allow for adjustment of the overall height of the fila-
ments and are in turn bolted to 3/8-inch thick horizontal copper bus
bars as shown in Figure 10.
Vertical copper electrodes are silver soldered to the underside
of the horizontal bus bars. They are fabricated by silver soldering
a 1/2-inch pipe inside a 1-inch pipe (Figure 10). Cooling water from
the laboratory supply line flows up the inside of the 1/2-inch pipe
and down and out the annulus. These electrodes are electrically insu-
lated from the vacuum chamber base plate by means of Teflon collars
which are pressed between stainless steel flanges, silver soldered to
the electrodes, and between the base plate (Figure 10). In order to
prevent the Teflon from outgassing at high temperature operation, how-
ever, water-cooled copper coils are locally installed within grooves
machined in the underside of the base plate.
High temperature electrical insulators made of aluminum oxide and
also of Lava are used to channel the current so that the three filaments
are connected in series. A DC power supply rated at 1000 amps, 15 volts
is connected through flexible copper leads to the vertical copper elec-
trodes.
To increase the thermal efficiency of the heater as much as possi-
ble, eleven concentric radiation shields are used. They are 12 inches
high with diameters varying on the half inch from 8 inches to 13 inches.
The innermost shield is made of .010-inch thick molybdenum while all
illim I IN imimlliiihi W lull 1,

-36-
the rest are made of .019-inch thick stainless steel 304. In addition,
fifteen horizontal radiation shields of stainless steel 304, .019-inch
thick x 3-inch wide x 6-inch long are placedbeneath the filaments.
4.3 High Vacuum System
The boiler and heater are contained within a 14-inch O.D. x 1/8-
inch thick x 18-inch long stainless steel 316 vacuum chamber. This
vessel is fabricated by heliarc welding 3/4-inch thick x 16-3/4-inch
diameter flanges to the top and bottom of the cylinder and by bolting
to these flanges 3/4-inch thick x 16-3/4-inch diameter plates. Twelve
1/2-inch diameter x 2-inch long stainless steel hex. hd. cap screws
with hex. hd. nuts are used with each flange. A single 14-l/4-inch
O.D. "0" ring, which is made of copper, provides a vacuum seal. The
copper "0" rings are silver soldered from .072-inch diameter wire.
Three Conax multiple thermocouple glands with Lava sealants are used
to provide vacuum seals for all the thermocouples in the test section.
These glands are heliarc welded to the vacuum chamber cover at posi-
tions 90 degrees apart on an 11-1/2-inch diameter circle. The Teflon
collars which were previously described, provide excellent seals for
the main heater copper electrodes. A vacuum better than 10-5 mm Hg
is generally attainable with this system. The entire vacuum chamber
is covered with 1-1/2 inches of Fiberfrax thermal insulation to cut
down heat losses during operation, and the unit is raised and lowered
using two hydraulic jacks and a steel support ring.
The high vacuum line consists of a horizontal, 4-inch schedule
40 stainless steel pipe welded to the wall of the vacuum chamber at a

point 11 inches above the base plate. This pipe is bolted to a National
Research Corporation 4-inch flexible connector which in turn is bolted
to a 4-inch stainless steel 316 90-degree elbow. Both flanges use
standard neoprene gaskets for vacuum seals. The elbow is bolted to a
National Research Corporation type HS4-T50 diffusion pump using a
neoprene "0" ring. A Welsh Duo-Seal type 1402 B mechanical pump, con-
nected directly in series with the diffusion pump, is used as the rough-
ing and backing pump. No cold trap or separate roughing lines are used.
4.4 Helium Cover Gas Line
In order to maintain the sodium as free of oxides as possible,
helium is used as a cover gas. The helium is dried and filtered by
flowing through a molecular sieve bed (1/16-inch diameter pellets of
an alkali metal alumino silicate from Linde Co. were packed firmly
within a 2-inch diameter x 10-inch long stainless steel 304 cylinder)
at liquid nitrogen temperatures. The entire helium gas line is 1/4-inch
stainless steel 316 tubing, and all valves are Hoke type TY440.
A Cenco-Magavac mechanical vacuum pump is connected to this helium
system through a standard ice trap where the 1/4-inch stainless steel
pressure tubing is joined to a series of 1/4-inch copper coils.
A large stainless steel 316 pressure tank is attached to the helium
system above the condenser section. It is an 8-inch, schedule 5 pipe,
18 inches long, with welded caps at both ends. Six brass baffles are
silver soldered on the inside of the tank, and water-cooled copper coils
are soft soldered on the outside. The tank is used both as a reservoir
to damp any pressure fluctuations during boiling and also as a cold trap

-38-
for sodium vapors. All breakable joints utilize stainless steel Parker
Triple-lok or Swagelok fittings, and all permanent joints utilize stain-
less steel Parker Braze-lok fittings.
4.5 Sodium Fill System
Sodium is stored in a stainless steel 316 tank, 4-1/2-inch O.D. x
6 inches high. This tank is flanged at the top and is sealed with a
4-1/2-inch I.D. x 0.139-inch thick Viton "0" ring. A steel sheathed,
0.260 diameter Calrod heater is wrapped around the tank and is covered
with a 1/2-inch thick coating of Thermon cement to provide a good thermal
bond. This heater is rated at 1.25 KW and receives power through a 1 KVA
variac. Thermal insulation consists of a 1/2-inch thick inner layer of
Fiberfrax alumina-silica fibers and a 1/2-inch thick outer layer of stand-
ard fiberglas strips.
The sodium fill line is fabricated entirely from 3/8-inch diameter
stainless steel 316 tubing. This line goes from the fill tank through
a 3/8-inch diameter x 12-inch long Anaconda flexible stainless steel
tubing and into the vapor space through the condenser top. Briskeat
heating tapes are wrapped around the entire length of the line and are
covered with the same type of thermal insulation used on the fill tank.
Sodium is filtered before entering the boiler by passing through a
flanged stainless steel cup, 1-1/2-inch O.D. x 3 inches long, which is
packed with fine grade stainless steel wool. This filter is kept at
a temperature near 350 OF. All valves are Hoke type Ty445, and all
breakable joints utilize either Parker Triple-lok or Swagelok fittings.

-39-
4.6 Containment and Safety Equipment
Since the boiler section operates within the 14-inch O.D. vacuum
chamber, this chamber acts as a primary source of containment for any
sodium leakage.
In addition, the entire heat transfer apparatus is enclosed inside
a 5 x 5 x 8-foot high enclosure shown in Figures 7 and 8. This enclosure
is fabricated by bolting 20-gage steel sheets to an all-welded framework
of 1-1/2 x 1-1/2 x 3/16-inch angle irons (Figure 7). Rubber weather
stripping is used between the sheets and framework to provide a pres-
sure-tight seal in the event that an inert atmosphere is necessary. A
plexiglass window, 22 x 16 x 1/4 inch, is attached to the top half of
the front side of the enclosure. Just beneath this window is a 5 x
4-1/2-foot hinged door. All valve handles are extended through the
enclosure skin to permit operation from the outside. The enclosure
is vented through a 6-inch duct to exhaust any possible fumes.
Safety equipment includes an Ansul MET-L-X fire extinguisher, a
safety helmet, safety glasses, a methyl methacrylate face shield, and
asbestos lined leather gloves.
4.7 Safety Controls
In order to safely operate the apparatus, a semi-automatic control
system is utilized. This system monitors the sodium level within the
boiler, the condenser air flow rate, the main electrode cooling water
flow rate, and the main vacuum system pressure. If the sodium level
drops beneath a prescribed value and if there is a loss of air flow,
loss of vacuum, or loss of water circulation, then this system activates
111111011,

-40-
a buzzer and one of four control panel lights. The system is semi-
automatic because although detection is automatic, control of the
equipment is manual. A master stop button on the control panel is
used to shut off the main power supply in the event of an emergency.
An electrical wiring diagram for this control circuit is shown in
Figure (14).
Each sensing device operates an electrical relay which controls
a common buzzer and an individual light. The sensor for the air flow
rate is a mercury switch attached to a butterfly valve inside the air
duct. When the flow of air is turned on or off, the butterfly valve
opens or closes the mercury switch. The sensor for the sodium level
utilizes the vertical thermocouple probe described earlier. A 110-volt
DC power supply is connected to this probe which is electrically insu-
lated from the condenser by means of a Conax electrode gland with a
Teflon sealant. The sodium level acts as a switch, making or breaking
contact when the level is above or below the probe tip. The sensors
for both the water flow rate and the high vacuum system utilize stand-
ard pressure diaphragms attached to micro-switches. As the water
pressure (or vacuum) changes, the diaphragm moves, thereby opening or
closing the micro-switch.
4.8 Instrumentation
Six platinum-platinum 10% rhodium "Ceramo" type thermocouples are
used in the boiler test plate. These thermocouples are 1/16-inch 0.D.,
inconel sheathed, magnesium oxide insulated, and werespecially cali-
brated at either 1200, 1400, 1600, and 1800 OF or 1400, 1600, 1800, and

-41-
2000 OF by the Thermo Electron Engineering Corporation to an accuracy
better than 1 OF. A 1/16-inch 0.D., stainless steel sheathed, Chromel-
Alumel, "Ceramo" type thermocouple is used in a vertical probe to meas-
ure the liquid temperature. In the last few runs, two Chromel-Alumel
thermocouples wereadded to the boiler plate, and another one was located
in the second vertical probe to measure the vapor temperature. These
thermocuples were 0.040-inch 0.D., inconel sheathed, magnesium oxide
insulated, and grounded at the end. They were calibrated at 1200, 1300,
and 1400 OF by Conax.
The above-mentioned thermocouples are connected through a Leeds
and Northrup 16-pole rotary switch to a Leeds and Northrup, type K preci-
sion potentiometer with an external standard cell, battery, and galvanome-
ter. The reference junction for these thermocouples was chosen at room
temperature, and this reference value was recorded for each data point
by means of a 30-gage Chromel-Alumel glass insulated thermocouple which
was read against an ice junction.
In order to record the temperature of all the above-mentioned thermo-
couples, two Leeds and Northrup milivolt potentiometers, Cat. No. 8690,
were used connected to a Recording Oscillograph 5-124 by Consolidated
Electrodynamics Corp. This recorder has various chart speeds of 0.25,
1, 4, 16, and 64 inch per second and can record 18 points.
The two Chromel-Alumel thermocouples, placed in the liquid and in
the vapor, were connected through a selecting switch to one of those
potentiometers. The other potentiometer was connected,through a switch,
in parallel with the type K Leeds and Northrup potentiometer.

-42-
These two potentiometers provided a reference temperature level,
and only the temperature variations were recorded. The arrangement of
these two potentiometers makes it possible to record, at the same time,
any temperature variations in the boiler plate together with either
the liquid or the vapor temperature. To record the various temperatures
in the boiler plate, the main rotary switch was used while the recorder
was in operation. All other thermocouples inthe apparatus were used
to obtain operational information. They were all 30-gage iron-constantan,
glass insulated thermocouples and were connected directly to a Minneapolis-
Honeywell, Brown Electronik, 20-point recorder which has a range of
0-1000 'F.
The second vertical probe, shown in Figure (15), serves two purposes.
First, it contains the thermocouple to measure the vapor temperature.
Second, it acts like a switch in a 1-1/2-volt loop. Whenever the sodium
liquid level touches the probe, the loop is closed, and a signal is fed
to the Recording Oscillograph. By this arrangement we can record on
the same chart the temperature variations and the changes of liquid level.
The probe is housed in three inconel bellows which permit its position
to be changed without breaking the seal at the top.
Pressure in the helium line ;as measured by an open-end manometer
and a Marsh compound pressure gage. The pressure in the vapor space
of the condenser was recorded by a Taylor high temperature volumetric
pressure transducer which had been previously calibrated against the
manometer down to a pressure of 40 m Hg.
The main heater voltage drop was recorded by a 0-25-volt DC voltme-
ter, and the main current was determined by observing the voltage drop

-43-
across a National Bureau of Standards shunt. This voltage drop across
the shunt was recorded by a 0-50 MV millivolt meter. For the shunt,
50 MV equalled 1000 amps. All other heater power supplies were moni-
tored using variacs and ammeters in each circuit.
The pressure in the high vacuum system was determined with two
thermocouple gages and one ionization gage. All three gages were
ennected to a National Research Corporation, type 710 B gage control.
The vacuum was monitored from 1 mm Hg down to 10-6 mm Hg.
A phonograph crystal cartridge is taped directly to the high
vacuum line to pick up vibrations in the test section. Because the
crystal is limited to temperatures below approximately 140 OF, the
pickup is positioned about 2 inches from the vacuum chamber wall and
is locally cooled by flowing water through copper coils which are
soldered to the vacuum line. The noise created during boiling is
directly transmitted to this cartridge, and the electrical signal is
fed to an oscilloscope for observation.

5. EXPERIMENTAL PROCE]WRE
5.1 General
In order to confirm the theory presented in Chapter 2 from which
the stability criterion was developed (Chapter 3), the test surfaces
must contain a pre-described cavity.
Initially some of Marto's (5_) surfaces were re-run for the pur-
poseof getting acquainted with the apparatus and the operation methods.
Also, it was of interest to see how a surface containing re-entry type
cavities would behave after cleaning and re-installing. The experi-
mental procedure consists of the following steps: preparation of the
test surface, preparation of the system, operating the system, and
reducing the data.
5.2 Preparation of Test Surfaces
There were mainly three types of boiler plates which were used
in this experiment.
5.2.1 Surfaces for Repeating Marto's Work
These boiler plates were made of nickel "A" discs of 2-9/16-inch
diameter x 0.750-inch thick, with six holes of 1/16-inch diameter,
Figure 16, containing removable thermocouples for temperature measure-
ments. One plate had twelve re-entry-type cavities (runs 27, 28 of
Marto). These cavities were fabricated by drilling a hole of 0.0145-inch
diameter x 0.025-inch deep in the test surface. A plug, 0.015-inch
diameter x 0.015-inch long, which was tappered on one end with a 45-degree
bevel, was press fitted into the hole in the test surface so that the
top of the plug was flush with the top of the surface. This plug had

a 0.004-inch diameter hole drilled along its longitudinal axis to pro-
vide a mouth for the cavity. (See Figure 17.)
The other two plates were coated by porous discs. The coating
procedure was as follows: The test plate was lapped to get a smooth
flat finish. After cleaning this surface, a 2-1/2-inch diameter x
1/32-inch thick disc of porous nickel "A" was then placed on it. These
porous plates were manufactured by Pall Corporation and had a mean pore
size of 65 microns and 35 microns. The two pieces were pressed together
under a pressure of about 5 psi and were fired in a wet hydrogen fur-
nace at 1100 0C for two hours to create a good metallurgical bond.
5.2.2 Surfaces with an Artificial Cavity and a Permanent Thermocouple
These boiler plates were made of two parts, see Figure (18). One
part was made of a nickel "A" disc of 2-9/16-inch diameter x 0.80-inch
thick with three holes of 1/16-inch diameter containing removable thermo-
couples for temperature measurements to obtain the heat flux. The other
part was made of a nickel "A" disc of 2-1/4-inch diameter x 0.220-inch
thick which was made to fit the first part. This disc contains one
cylindrical cavity in the middle. A calibrated Choromel-Alumel thermo-
couple was put on the other side of the disc with its hot junction
facing the cavity hole and exposed to the liquid. This thermocouple
was 1/16-inch 0.D. inconel sheathed, grounded type with compacted
mineral insulation. After chemical treatment, the two parts and the
thermocouple were put together with a 0.001-inch thick copper foil and
were brazed in a hydrogen furnace to obtain a good metallurgical bond.
Afterwards the unit was shaped to its final dimensions, see Figure 18,
-45-

and the surface was polished to a mirror finish. To obtain a mirror
finish, the following procedure was followed: Rough polishing was done
on a Buehler rotary grinder. This grinder contains discs of 240, 320,
400, and 600 grit emergy paper which was attached by adhesive backing
to the rotating grinder discs. Water continually flowed over the eraergy
paper keeping it clean and serving as a lubricant. The test surface
was kept in each stage of grinding until all the scratches from the pre-
vious stage had disappeared. The final polish was done on a Buehler
rotary disc covered by a polishing cloth and using a "B" type solution
which is a suspension of fine grade alumina powder in distilled water.
At the end of this polishing process, the surface has a mirror-like
finish without any scratches. A photograph of this surface taken from
the top of the boiler is given in Figure 19. Three surfaces of this type
were fabricated, having the following cavity size: 0.010-inch, 0.020-inch,
and 0.0465-inch diameter with 0.050-inch depth.
5.2.3 Surfaces with Artificial Cavity and Without a Permanent Thermocouple
These boiler plates were made of a nickel "A" disc of 2-9/16-inch
diameter x 0.850-inch thick. Six holes of 1/16-inch diameter were drilled
in the plate for temperature measurement from which the heat flux was
calculated. Two smaller holes of 0.040-inch diameter were drilled at
a distance of 0.050 inch from the surface, for measuring the temperature
fluctuations. (See Figure 20.)
In one of these plates one re-entry-type cavity was put at the middle
of the surface. This re-entry cavity was fabricated by drilling a hole
of 0.0195-inch diameter x 0.030-inch deep in the test surface. The sur-
face was then polished to a mirror finish following the procedure described

-47-
in paragraph 5.2.2. A plug, 0.020-inch diameter x 0.020-inch long,
which tappered on one end with a 45-degree bevel, was press fitted into
the hole in the test surface so that the top of the plug was flush with
the top of the surface. This plug had a 0.005-inch diameter hole drilled
along its longitudinal axis.
The other plate was first polished to a mirror finish, and then
one cylindrical cavity was drilled into the middle of the surface. This
cylindrical cavity was 0.0105-inch diameter x 0.150-inch deep.
5.3 Preparation of the System
Before testing a new surface, the previous boiler section had to
be removed, and instead the new one had to be installed.
All water and electrical lines were first disconnected from the
vacuum chamber. Two hydraulic jacks with a steel support ring were
positioned under the vacuum chamber and were raised until they began
to support the load. The top and side flanges of the vacuum chamber
were then opened,and the vacuum chamber was lowered to the floor by
slowly releasing the pressure within the jacks. The entire vacuum cham-
ber unit was then slid to one side of the enclosure. All thermocouples
were removed from the test plate and were bent away from the boiler
flange. A portable grinder with a 3-inch diameter x 1/4-inch thick
abrasive wheel was then used to grind off the weld on the boiler flange.
This generally took about thirty minutes. A helium pressure of 3 psi
was maintained inside the boiler during this time. When the crack between
the two flange faces was visible around the entire circumference of the
flange, the weld was broken open by shocking it with a hammer and chisel.
Milli

-48-
The boiler section containing the sodium was then removed and reacted
with n-butyl alcohol in a 55-gallon drum. All burrs on the edges of
the top flange and all traces of sodium were removed. This usually
took about two minutes during which helium was purged through the sys-
tem in an effort to prevent oxidation of the sodium inside the appara-
tus. A new boiler was then clamped in place, taking great care that
the thermocouple wells in the test plate were orientated in the same
direction as for the previous boiler. The boiler was then welded to
the top flange. It took about fifteen minutes to complete this weld,
and the system was immediately pumped down to less than 1 mm Hg. and
re-pressurized with 5 psi of helium. The boiler flange was then leak
tested. When this joint was tight the thermocouples were placedin the
test plate, the vacuum chamber with a new metallic "O" ring was raised,
and the top and side vacuum flanges were tightened until a vacuum of at
least 10-5 mm Hg. could be obtained.
Whenever the equipment bad been dismantled and re-assembled, leak
testing would take place. The entire system was pressurized to 10 psi
with helium, and all previously opened joints were checked with a soap
solution. The system was considered tight if a pressure of 10 psi was
held overnight without any change occurring in the open-end manometer.
The main vacuum system was leak tested after assembly until a vacuum
of between 10-5 mm Hg and 10-6 mm Hg existed. Leaks were checked by
spraying all joints with acetone and watching the response of the thermo-
couple gages for a vacuum between 10 and 103 mm Hg and of the ioniza-
tion gage for a vacuum below 10 mm Hg.

14.9-
On some occasions it was found that sodium oxide was deposited on
the condenser surface. Whenever this happened the condenser and all
the connection lines were removed and were reacted in the same drum
containing the n-butyl alcohol. Then all parts were thoroughly washed
in hot water, degreased with trichloroethylene, and re-assembled in
place.
To re-load the system with a new batch of sodium, the fill tank
was disconnected, and its flange was opened. All remaining sodium oxide
was removed mechanically. A brick of sodium, 2-1/4-inch diameter x 3-inch
long, was put into the fill tank after all surface oxides had been scraped
away. Then the cover, with a new viton "0 " ring, was bolted in place,
and the fill tank was connected to the system. The entire apparatus was
immediately evacuated to 1 mm Hg and pressurized to 10 psi with helium.
At this stage the system was ready for the new test.
5.4 The Operation Method
The operation started when the sodium system was under a pressure
of 5 psi helium and the vacuum chamber under a pressure of 10~5 mm Hg
or better. Then, the heaters for the fill tank, fill line, and pressure
line were turned on. Also, the main heater and the air heater were
turned on. All the heaters were kept on for about two hours until the
fill tank was at 450 "F, all lines were near 450 OF, and the boiler plate
was at 400 0 F. When these temperatures were reached, the boiler-condenser
part was evacuated to about 1 mm Hg, keeping the fill tank under a pres-
sure of 5 psi. The sodium fill line valve was opened, and the sodium
flowed into the boiler. During this transfer operation all the tempera-
tures were recorded, and the change in pressure at the open-end manometer
IMMIMINHNI

-50-
was observed. The transfer was completed in a few seconds. To clean
the lines of any trapped sodium, the fill tank was evacuated while the
boiler-condenser part was pressurized keeping the fill line valve closed.
Then this valve was opened, and helium flowed from the boiler to the fill
tank cleaning the lines. When the blow-back was completed, the fill line
valve was closed, and the heaters for the fill tank and a part of the
fill line up to the valve were closed. While keeping the rest of the
lines including the top of the condenser at a temperature of about 400 0F,
gradually the main power was increased. The system remained under a
pressure of 5 psi until the desired working temperatures were obtained;
then it was evacuated to the desired pressure.
The sodium level was found by lowering the second probe with the
bellows until an electrical contact was made. Then this probe was raised
to 1/4 inch above the liquid vapor interface byturning a graduated screw.
Before taking any boiling data, several data points were taken in
the natural convection region. This gave a reasonable check for a cor-
rect behaviour of all the thermocouples.
When nucleate boiling began, the condenser air blower was turned on,
dropping the condenser air inlet temperature to approximately 125 OF. At
the same time the rest of the heaters were still on to keep the auxiliary
lines at 4C00 F.
For any given heat flux level the equilibrium condition was reached
after about fifteen to twenty minutes. This was observed by watching
the temperatures in the liquid and in the solid on the Recording Oscillo-
graph without running the paper. When equilibrium was obtained, the
following successions of operations were performed: The barometric

-51-
pressure, the Taylor gage, and the open-end manometer were recorded as
well as the power input to the main heater. Then all the thermocouples
were read twice, as well as the reference temperature, by the Leeds and
Northrup type K potentiometer. Afterwards, all the temperatures in the
boiler plate together with the temperature of either the liquid or the
vapor were recorded on the Recording Oscillograph at a chart speed of
either 0.25 inch per second or 1 inch per second. For boiling runs, it
was impossible to read the temperature of the two thermocouples close
to the surface by the type K potentiometer; therefore, these temperatures
were only recorded by the Recording Oscillograph.
After the set of measurements was completed, which took about ten
to fifteen minutes, the power to the main heater was changed. Data for
both increasing and decreasing heat flux were observed.
The system was shut down by turning off the main heater and pressuriz-
ing the system to 5 psi with helium. After a certain time, when the tem-
perature of the liquid was cooled to about 1000 OF, all the electrical
heaters were turned off. The entire system cooled down overnight, and
the sodium was left to solidify within the boiler. When the system was
cold the vacuum pumps were turned off.
5.5 Reducing of Data
By plotting the translated temperatures from the four thermocouple
readings in the boiler plate versus their axial position, the tempera-
ture distribution in the boiler plate was obtained. A straight line
connecting these temperatures gave the temperature slope from which the
heat flux was obtained from
= w 4 2T (27)
WIMINIII

-52-
The extrapolated wall temperature T was obtained by extrapolat-
ing the straight line to the boiler surface.
From the Recording Oscillograph the minimum and the maximum tempera--
turesof thermocouple No. T, which was close to the surface, were reduced.
The minimum temperature of this thermocouple was usually on the straight
line.
For ' = 1, Equation (20) becomes
0'(o) = k 9 (28)
where K is given in Equation (21).
In order to find the maximum wall temperature, Tw(0, 0), a straight
line with a slope of 9'(0, 0) was drawn passing through the maximum tem-
perature obtained by thermocouple T and extrapolated to the boiler sur-
face.
Furthermore, the temperature readings of thermocouple No. T varied
in a periodic way from which the period time I could be found.
The saturation temperature was found by the temperature measurements
of the thermocouple in the vapor and compared with saturation pressure
measured by the open-end manometer by the relationship recommended by
Bonilla, et al. (E) .
log P=4.52I72 - 5220.42 (29)10 T
where P is in atmosphere, and T is in degrees Kelvin. Usually, good
agreement was obtained between the two measurements of the saturation
temperature within 2 to 3 OF. In every case the temperature read by
the thermocouple was taken to be the temperature of the vapor. The

-53-
other three thermocouples in the boiler plate were not taken into account,
and they served only for checking radial temperature distribution. For
those runs where the Recording Oscillograph was not used, only the heat
flux and the extrapolated wall temperature were reduced. A calculated
example is given in Appendix G.
1=11, ,

6. RESULTS AND DISCUSSION
6.1 Observations
Data for heat transfer from a heating surface of nickel "A" to
liquid sodium were taken at heat fluxes ranging from 20,000 to about
300,000 BTU/ft 2 hr at absolute pressures ranging from 40 to 105 mm Hg.
Most of the runs were taken at a pressure of about 60 mm Hg, when the
vapor temperature above the liquid was at saturation temperature corres-
ponding to the pressure. The sodium depth in the boiler was usually
around 2 inches.
During the experiments of the present work, three different regions
of heat transfer were observed.
6.1.1 Natural Convection
Heat transfer by natural convection from the solid surface to the
liquid sodium, while evaporation took place at the liquid-vapor inter-
face, was characterized by stable temperatures in the solid and in the
liquid with heat transfer coefficients of the order of 800 to 1000
BTU/ft2hrOF. This usually took place either at the beginning of each
run when the power was gradually increased, or when boiling stopped
after decreasing the input power. The dat a obtained during natural
convection were independent of the surface conditions and the pressure
at this working range.
6.1.2 Stable Nucleate Boiling
Heat transfer during nucleate stable boiling was characterized by
constant temperatures in the boiler plate far away from the solid-liquid
interface and constant temperature of the vapor. The liquid temperature,

-55-
measured at about 3/4 inch from the solid-liquid interface, was subcooled
in the range of 0 to 10 0F, depending on the heat flux, and its reading
was stable. The Chromel-Alumel thermocouples, located in the boiler
plate near the surface, measured a periodic fluctuation of temperatures
and could only be recorded on the Recording Oscillograph. Once a stable
boiling was achieved for a given heat flux, it existed for all the heat
fluxes for which the input power was increased. While decreasing the
power, stable boiling was observed until reaching a certain heat flux
below which boiling stopped and natural convection heat transfer was
observed.
6.1.3 Unstable Boiling or Bumping
For each run, before reaching the first heat flux for which stable
boiling existed, a transition between natural convection and nucleate
boiling was observed. This was characterized by temperature variations
in all the boiler plate thermocouples as well as in the liquid and in
the vapor. At the same time large pressure variations in the boiler
occurred accompanied by a big noise. This noise was detected by the
phonograph crystal pickup and was observed on the oscilloscope.
The variations of temperatures were not periodic and could not be
read on the type K potentiometer. For any given heat flux, when bump-
ing took place, and after waiting a certain amount of time, the bumping
stopped, and the heat was transferred by natural convection only. When
the input power was increased, the bumping resumed at that higher heat
flux. By further increasing the power, a heat flux was reached for
which a sudden transition from natural convection to boiling took place,
and after that the boiling was stable. The range of heat fluxes, for

-56-
which the bumping phenomena was observed, was between 50,000 to 200,000
BTLU/ft 2 hr, depending on the surface conditions.
The data obtained during bumping could not be accurate since it
was very difficult to get the exact temperature measurements. An example
for temperature variations during bumping is given in Figure (21).
6.2 Experimental Results
The experimental results of this work are tabulated in Appendix F.
Each table, given for each run, contains the surface conditions, the
sodium depth, and the important values which were either measured or
calculated. Also a short description of the mode of heat transfer is
mentioned. A calculated example is given in Appendix G.
The tabulated important parameters are as follows: The saturation
temperature T measured at the vapor temperature and the corresponding
saturation pressure p calculated from equation (29) (in those runs in
which the vapor temperature was not measured, the saturation temperature
was calculated from the pressure measurements), the liquid temperature
Tt , and the extrapolated wall temperature T . Also are presentedthe exlulte Alsoag aret presente
the calculated average heat flux , the calculated difference (Tw ext- T sat)
the calculated wall superheat 9w(0,0), and the average measured waiting
time CT.
The best way to analyze the results of this experimental work is
to divide them into groups according to the various surfaces.
The first run (No. 1) was made from a porous nickel "A" of 65 microns
grade. This run was performed immediately after run No. 30 of Marto (5),
where the sodium was left to solidify in the boiler. Table F-1 shows
good agreement with Table C-15 of Marto.
-57-
Runs No. 3 and 4 were made with porous nickel "A" of 35 microns
grade. In these two runs most of the measured points were in the natural
convection region, and only a few points were of stable boiling. These
stable boiling points were at heat fluxes higher than about 150,000
BTU/ft 2hr.
Runs No. 2 and 5 were with twelve re-entry type cavities. This
was the same surface as in runs 27, 28 of Marto (5), after the sodium
was reacted. In the first of the two runs the surface was chemically
cleaned, while in the second run it was also cleaned in an ultrasonic
cleaner. In both of these runs bumping took place up to heat fluxes
of about 200,000 BTU/ft2hr, where as in runs 27, 28 of Marto, stable
boiling was observed from this surface at heat fluxes as low as 100,000
BT/ft 2 hr. The explanation to this different behaviour could be found
in the following argument. When sodium is reacted in n-butyl alcohol,
it frees hydrogen from the reaction. If the hydrogen is trapped -in the
cavity, it prevents any further reaction with the sodium in the cavity.
When this surface is exposed to air, the diffusion of oxygen into the
cavity will cause oxidation of the remaining sodium which cannot be
removed even with an ultrasonic cleaner. As a result of this, the
original re-entry cavity is no longer a re-entry type cavity, but instead,
a cylindrical one. This size of cylindrical cavity is the same as was
used in run 24 of Marto in which bumping took place at these high heat
fluxes.
In all the above-mentioned runs, no measurements were taken of
bubble frequency and temperature variation at the surface during stable

-58-
boiling. The results of runs 1 to 5, therefore, cannot be used to con-
firm the theory predicted in Chapter 2.
The second group of runs, 6 to 12, was made with boiler plates of
nickel "A" polished to a mirror finish with one cylindrical cavity in
the middle and with a permanent thermocouple which was exposed to the
liquid. See paragraph 5.2.2.
These runs were recorded on the Recording Oscillograph and con-
tained data points of the three regions of heat transfer mentioned in
paragraph 6.1.
From the results of all these runs, it was obvious that the con-
trolling cavity mouth was not the cylindrical cavity which was drilled
into the surface, but some smaller size cavity. The arrangement of the
permanent thermocouple and the cavity probably formed some re-entry
type cavity with a controlling mouth size smaller than the drilled one.
From the calculated Gw(0,0), for each run, together with the saturation
pressure, the average controlling cavity radius was calculated, using
Equation (C-13), and was given in each table. Comparing runs 9 and 10
in which the same surface was used, except that run 10 was made after
the boiler was removed and the sodium was reacted, show that the con-
trolled cavity radius was smaller in run 10 then in run 9. This con-
firms once again that any re-entry type cavity may become plugged after
the sodium is reacted. The results of runs 6 to 12 were used in establish-
ing the relation between the waiting time, the degree of superheat, and
the heat flux.
The third group of runs consists of runs 13 and 14, which have a
predescribed cavity size. The boiler plates of runs 13 and 14 were made

-59-
of nickel "A" polished to a mirror finish. In run 13 one re-entry type
cavity was fabricated in the middle of the surface with a cavity mouth
diameter of 0.005 inch, whereas in run 14 one cylindrical cavity of
0.0105-inch diameter x 0.150-inch long was drilled in the middle of the
surface. The Chromel-Alumel thermocouples which were near the surface
did not touch the cavity in both cases. The results of these runs con-
firmed the relation (C-13) for the surface superheat during stable boil-
ing and gave more data points for the desired relation between the wait-
ing time, the degree of superheat, and the heat flux.
In order to combine the results of runs 6 to 14 in one single curve,
the data points were plotted with versus the waiting time f,
in Figure (22). Such plotting eliminates the use of either the cavity
radius or the pressure as a parameter, since 9 (0,0) combines the two
factors. The theoretical curve, Equation (11), is also plotted in
Figure (22), which is a general curve for sodium (almost independent
of the solid material). For different liquid metals this curve will
be shifted according to the liquid properties.
All the experimental data points lie above the theoretical curve;
namely, for any value O ,k the experimental waiting time is longer
than the predicted one from Equation (11).
Some recorded temperature fluctuations during stable boiling are
given in Figures 23, 24, 25, and 26. At low heat flux and long waiting
time, it is very easy to see the periodic behaviour of these fluctua-
tions and to calculate the average waiting time. The calculated tem-
perature variations are plotted versus the time in Figure (2T), using
Mablifil

-60-
Equations (18) and (19), where the position in the boiler plate is a
parameter.
6.3 Empirical Correlation
The model analyzed assumed pure conduction heat transfer to a
stagnant liquid.
The difference between the heat transfer q9 and this heat trans-
fer to the liquid determines the rate of rise of the wall surface tem-
perature. Actually the heat transferred to the liquid will be greater
than that resulting from the assumption in the model because of convec-
tion effects in the liquid. To retain the expression resulting from
the conduction model and attempt to account for this convection effect,
we alternatively may increase the rate of heat transfer to the liquid
or reduce the magnitude of g in the equation. As an empirical approxima-
tion to account for the convection effect, we tried reducing q0 by an
amount equal to 1.4 times the natural convection heat flux correspond-
ing to the maximum wall temperature during the transient existing after
boiling has begun.
It is emphasized that this is an empirical correction to attempt
to account for the convection effects, but is applied to q0 to reduce
the difference between the actual q9 and the heat transferred to the
liquid in the simplified conduction model. This leads to the follow-
ing equation:
5) (30)
where h is taken here as constant at h = 1200 BTU/ft 2hr.

Equation (30) is also plotted in Figure (22). At all waiting times
above 0.5 see., the agreement of the empirical correlation curve with
the data points is quite good. At much shorter times the deviation of
the data from the curve is greater. This is due to the fact that for
short waiting times, the effect cf the bubble growth and departure time
may became more important and probably cannot be simply neglected as
was done in the theoretical model of Chapter 2.
6.4 The Limiting Curve for Stable Boiling
Run No. 14 was made to check the stability criterion, Equation (26).
For the cavity size chosen and in the range of heat fluxes used in this
experiment, we should expect to obtain regions for which boiling is
stable and regions for which boiling stops and natural convection occurs.
The limiting points for stable boiling were obtained in the following
way: First, stable boiling was achieved at high heat fluxes, and then
the power was decreased until boiling stopped. For different pressures
different heat fluxes existed for which boiling stopped. It was very
difficult to control the exact limiting heat flux since the input power
could not be adjusted very sensitively. Figure (28) shows the data
points of run 14 where the heat flux q0 is plotted versus the surface
superheat 9w(0,0). The limiting points designated by 0 were stable
boiling, and after slightly reducing the power, boiling stopped and
natural convection began with increasing boiler plate temperatures.
Figure (29) shows a recorded temperature of the thermocouple near the
surface when the transition from boiling to natural convection took
place while decreasing the input power.

-62-
In Figure (28) there are also plotted the predicted limiting curve
of this work, Equation (26), and the modified Marto (5_) prediction,
Equation (22), for the same given cavity length. The figure shows that
the predicted Equation (26) is much lower than the experimental points.
In the light of paragraph 6.3, the waiting time as well as the relaxa-
tion length were found to be greater than that predicted. The empirical
correlation (30) together with Equations (13), (23), and (24) will there-
fore give an empirical correlation for the limiting heat flux
where h is the same constant as in Equation (30), h = 1200 BTU/ft2hr.
Equation (31) is also plotted in Figure (28). The agreement of this
equation with the experimental results is remarkably good.
Only two cases were found in the literature where cylindrical
cavities were used in boiling liquid metals. Marto (5_) used ten
cylindrical cavities of 0.004-inch diameter x 0.018-inch long. Using
this cavity dimension in Equation (31), the limiting heat fluxes for
stable boiling of sodium are given in Figure (30). All the data points
of run 24 of Marto were below this curve; therefore, stable boiling was
not reached.
The other case with a cylindrical cavity was made by Hoffman (18)
where potassium was boiled from a surface with a "hot finger" of 0.050-
inch diameter x 0.250-inch long, drilled in the boiler surface. Using
this cavity length with the properties for potassium in Equation (31),
we obtain the limiting heat fluxes, Figure (30).

-63-
Hoffman (18) reported that stable boiling was obtained if the "hot
finger" temperature was kept more than 65 0 C above the liquid tempera-
ture at the measured point. No direct observations of heat fluxes or
surface superheat were presented.
6.5 Plots of Heat Fluxes vs. Superheat
Since it is quite common to present any heat transfer data of boil-
ing in a plot of heat flux versus wall superheat, we present here these
plots in Figures 31 to 39. It becomes obvious from this work that the
term wall superheat in boiling liquid metals is meaningless since any
temperature measuring device at the surface will never read a unique
temperature. We therefore specify here two terms of wall superheat.
The first one is the extrapolated wall temperature minus the saturation
temperature (T e T ), and the second one is the maximum wall tem-w ext. sat
perature at each period minus the saturation temperature 9 w(0,0). In
Figures 31, 32, and 33 only the first type of superheat was calculated
and plotted. In Figures 34 to 39 the two expressions for wall super-
heat are presented for any heat flux during stable boiling. These two
values are connected with a solid line and represent one data point.
The dotted lines in these figures represent bumping data where
approximate values were measured. In Figure 33 the three regions of
heat transfer are shown schematically.
7. SUMMARY AND CONCUJSIONS
When heat is transferred to liquid sodium in a pool, three differ-
ent phenomena are observed. At low heat fluxes heat is transferred by
natural convection with heat transfer coefficients of the order of 800
to 1,000 BTU/ft2hrOF. At higher heat fluxes stable nucleate boiling
may exist with much higher heat transfer coefficients. A transition
between natural convection and stable nucleate boiling is always observed.
This transition phenomenon is called bumping and is characterized by
large temperatures and pressure fluctuations due to the fact that no
active cavities exist for that given heat flux.
During stable nucleate boiling temperature variations exist in the
solid surface and its close vicinity. A simplified theoretical model
for the mechanism of heat transfer in pool boiling of liquid alkali
metals was presented which predicts the temperature variations in the
solid material and the frequency of bubble formation as functions of
the wall superheat, the heat flux, and the solid-liquid properties.
From this simplified model a criterion was established for the
minimum heat flux for which stable boiling exists. The criterion shows
that the minimum heat flux for stable boiling is a function of the
liquid-solid properties, liquid pressure, the degree of superheat, and
cavity size.
A set of experimental runs was performed on an existing apparatus
using various surfaces with artificial cavities. Heat fluxes of 20,000
to 300,000 FTU/ft2hr were obtained at various pressures between 40 to
106 mm Hg.

-65-
The experimental results of the period time for bubble formation
are in good agreement with an empirical correlation, which is a modifica-
tion of the theoretical prediction of the simplified model. Also, the
experimental results for the criterion of minimum heat fluxes for which
stable boiling exists are in good agreement with the predicted one,
using the same modificated expression.
Conclusions
1. During stable nucleate pool boiling of sodium, the solid surface
temperature fluctuates between the temperature required to initiate
an active cavity of a given size and some lower temperature depend-
ing on the liquid-solid properties.
2. In liquid metals the frequency of bubble formation from a given
cavity is a function of the degree of superheat, the heat flux,
and the liquid thermal properties and is almost independent on
the solid thermal properties.
3. For uniform distributed cavities of equal size, the degree of
superheat and the minimum surface temperature are not functions
of the heat flux.
4. Stable nucleate boiling can exist in sodium from cylindrical cavi-
ties provided the degree of superheat, the cavity geometry, and the
heat flux satisfy the Equation (31).
5. Better stability conditions in boiling sodium can be obtained with
solid metals of lower thermal diffusivity.
6. Convection heat transfer has an effect on the period of bubble forma-
tion and the stability criterion.
1111 WIN,

-66-
Recommendations
1. Further work should be done at smaller cavity sizes and higher heat
fluxes and pressures.
2. An attempt should be made to measure the bubble size and frequency
by direct observation of the bubbles.
3. The surface temperature variations during stable nucleate boiling
should be measured directly with sensible instruments, similar to
what was used by Cooper (9).
4. A simplified model for cavity distribution of various sizes should
be adopted from which analytical and experimental work could be
performed in order to find the behaviour of any commercial surfaces.
BIBLIOGRAPHY
1. Lyon, R. E., Foust, A. S., and Katz, D. L., "Boiling Heat Transferwith Liquid Metals," Chem. Engr. Prog. Symposium Series No. 17, 51(1955).
2. Madsen, N. and Bonilla, C. F., "Heat Transfer to Boiling Sodium-Potassium Alloy," Chem. Engr. Prog. Symposium Series No. 30, 56 (1959).
3. Noyes, R. C., "Boiling Studies for Sodium Reactor Safety," Part 1NAA-SR-7909 (1963).
4. Colver, C. P., "A Study of Saturated Pool Boiling Potassium up toBurnout Heat Fluxes," Ph.D. Thesis, U. of Michigan (1963) (citedin 5).
5. Marto, P. J. and Rohsenow, W. M., "The Effect of Surface Conditionson Nucleate Pool Boiling Heat Transfer to Sodium," Ph.D. Thesis,M.I.T. Report No. 5219-33 (1965).
6. Krakoviak, A. I., "Notes on the Liquid Metal Boiling Phenomenon,"ORNL-TM-618 (1963).
7. Moore, F. D. and Mesler, R. B., "The Measurement of Rapid SurfaceTemperature Fluctuations During Nucleate Boiling of Water," A.I.Ch.E.J1. (1961).
8. Bonnet, C., Macke, E., and Morin, R., "Visualization of Bubble Forma-tion at Atmospheric Pressure and Related Measurement of the WallTemperature Variations," EUR 1622.e. (1965).
9. Cooper, M. G. and Lloyd, A. J. P., "Transient Local Heat Flux inNucleate Boiling," Proceeding of the Third International Heat Trans-fer Conference, Chicago, Vol. III, pp. 193-203 (1966).
10. Zuber, N. "The Dynamics of Vapor Bubbles in Nonuniform TemperatureFields," Int. J. Heat Mass Transfer, 2 pp. 83-98 (1961).
11. Han, C. Y. and Griffith, P., "The Mechanism of Heat Transfer inNucleate Pool Boiling - Part I," Int. J. Heat Mass Transfer, 8pp. 887-904 (1965).
12. Hamburger, L. G., "On the Growth and Rise of Individual VaporBubbles in Nucleate Pool Boiling," Int. J. Heat Mass Transfer,8 pp. 1369-1386 (1965).
13. Deyer, V. I. and Solovyev, A. N., "On the Mechanism of Boilingof Liquid Sodium on a Heating Surface at Free Convection," Transla-tion from Inzhenerno-Fizicheskiy Zhurnal (Russian), Vol. 7 No. 6(1964).
lul

-68-
14. Bankoff, S. G., "Ebullition from Solid Surfaces in the Absence ofa Pre-existing Gaseous Phase," Heat Transfer and Fluid MechanicsInstitute, Stanford, Cal. (1956).
15. Hsu, S. T. and Schmidt, F. W., "Measured Variations in Local Sur-face Temperatures in Pool Boiling of Water," ASME-A.I.Ch.E. HeatTransfer Conference, Buffalo, N. Y. (1960).
16. Kroger, D. G., "Heat Transfer During Film Condensation ofPotassium Vapor," D.Sc Thesis, M.I.T. Report No. 75239-42(1966).
17. Bonilla, C. F., Sawhney, D. L., and Makansi, M. M., "Vapor Pressureof Alkali Metals, III Rubidium, Cesium, and Sodium-Potassium AlloyUp To 100 Pounds per Square Inch," Proc. of 1962 High-TemperatureLiquid-Metal Heat Transfer Technology Meeting, BNL 756 (1962).
18. Hoffman, E. E., "Metals and Ceramics Div. Annual Progress Report,"ORNL-347O, pp. 114-118 (1963).
19. Carslaw, H. S. and Jaeger, J. C., "Conduction of Heat in Solids,"Oxford University Press (1950).
20. Bergles, A. E. and Rohsenow, W. M., "The Determination of Forced-Convection Surface-Boiling Heat Transfer," ASME paper 63-HT-22 (1963).
21. Hsu, Y. Y. and Graham, R. W., "An Analytical and Experimental Studyof the Thermal Boundary Layer and Ebullition Cycle in Nucleate Boil-ing," NASA TN-D-594 (1961).
22. Lenon, A. W., Jr., Deem, H. W., Hall, E. H., and Walling, J. F.,"The Thermodynamic and Transport Properties of Potassium," Pro-ceeding of 1963 High-Temperature Liquid-Metal Heat TransferTechnology Meeting, Vol. 1, USAEC Report ORNL-3605 (1964).
23. Achener, P. Y., "The Determination of the Latent Heat of Vaporiza-tion and Vapor Pressure of Potassium from 1000 to 1900 OF," Aerojet-General Nucleonics Report AGN-8141 (1965). (Cited in 28)
24. Achener, P. Y., "The Determination of the Latent Heat of Vaporiza-tion, Vapor Pressure, Enthalpy, and Derm ity of Liquid Rubidium andCesium Up To 1800 OF," Proceeding of 1963 High-Temperature Liquid-Metal Heat-Transfer Technology Meeting, Vol. 1, USAEC ReportORNL-3605 (1964).
25. Tepper, F., Murchison, A., Zelenak, J., and Roehlich, F., "Thermo-physical Properties of Rubidium and Cesium," Proceeding of 1963High-Temperature Liquid-Metal Heat Transfer Technology Meeting,Vol. 1, USAEC Report ORNL-3605 (1964).

-69-
26. Keenan, J. H. and Keyes, F. G., "Thermodynamic Properties of Steam,"John Wiley & Sons, Inc. (1957).
27. Scriven, L. E., "On the Dynamics of Phase Growth," Chem. Engr. Sci.,10 pp. 1-13 (1959).
28. Wichner, R. P. and Hoffman, H. W., "Vapor-Bubble-Growth Rates inSuperheated Liquid Metals," USAEC Report ORNL-TM-1413 (1966).
29. Hogan, C. L. and Sawyer, R. B., "The Thermal Conductivity of Metalsat High Temperature," Jl. of Applied Physics, 23 p. 177 (1952).
MUNIIINK

-70-
APPENDIX A
SOLUTION TO THE TRANSIENT HEAT CONIUCTION
Following the assumptions given in (2.3.2), the energy equations
with their initial and boundary conditions are as follows: (See Figure
2.)
2
IO4~)
- O~'e
where 9 =T - Tsat
At t = 0
O)(x,0)== CZ + x + c x 2
C= ()(not function of position)
Therefore,
Of(xo)= c o)+i'(ojo)x + &'(o) X
, (t,0) = 0
(A-a>)
(A-2c)
at t > 0
x=L (contaLn)t) =3aD
(A-la)
(A-lb)
0<X4. L
where
(A-2a)
(constant)x = L- (A-3a)

~I -~ ~
At 1>0)
-ke 6w' (c t)
The Laplace Transformations of Equations (A-la and A-lb) after using
the initial conditions (A-2b and A-2c) are:
-+
~1WS
L90(x.; a) -O0
where s is a complex variable, and
9 is the Laplace Transformation of 9.
The transformed boundary conditions become:
At x= L
At X= 0
O X
I(, s)= 0_
,j S) = (, S)
d dx(O>S)kw dO x
-71-
-0
X = 0 ,
(A-3b)
O (Ot) (A-la)
(A-4b)
(A-5a)
(A-5b)
(A-6a)
(A-6b)
S4 (0,s)
d y -
(A-Ta)
(A-Tb)
WIMIIMIM19111

-72-
The solutions to Equations (A-5a and A-5b) are:
(x + C2eV + +2K"(o)C, e S S
+ C4 e
From Equation (A-6a)
kw __ _~ '44,Sdx
but
+ C2 e
S(Lj 0) =1/
therefore,
2 L
and from Equation (A-6b) C4 = 0
Using the conditions (A-9) in Equations (A-8), we get
) LX e(XNS) = C2 -f +e
- Ox2 o) 9 ,S(0)S (A-lOa)
(A-lob)
Applying Equation (A-Ta) gives
C3 C2 /+ 2L _
+ eS0 (A-lla)$ O)
and Equation (A-Tb) gives
C3~~ L~j~j (I-c (A-lb)
(A-8a)
(A-8b)
(A-9a)
(A-9b)
0/4 Y
rx-C/ e
C 3 e -P40Y5) =
(/ -C2 k~ Y/~3 e (A-llb)

-T3-
Defining the following values
k w 4 o7 E =(A-12)
Now, solving the two Equations (A-ll) and using the above definitions
(A-12), we can find the two unknowns c2 and c3 *
ow a )S 1
- 2L %]
C G(o,0)3 S
+de 9"(o)-r -
69,0) cl'wS - E2 L %)
The term can be expanded into a series, since 164 1After expansion this term becomes:
(A-14)-- E e- 21nL%-fL
Putting Equations (A-13) and (A-14) into Equations (A-10), we finally
find the solutions for 9.(X,5) and (ge, S)
19UxS)-, L, -
S
S S tJLO
~,[~$z I)zL-XJ
o(W 0)
S
I (O) Gw &(0OO)6e' S
O6~4I &o)1r n - i)+2L+ -s
+ ,jo0o) +* (A-l0bL
2 L S e2
S(00)s (A-13a)
-2L)
(A-13b)
and 2L >O.
I~ e2
(Zn L X)
(A-15a)
(00)
(,+ )[/ - 6
(A-15b)

The inverted equations of the above Laplace Transformations involved
the following terms:
e(. +L- xL 2 ___t
ex (hi24-XPL?-Zw- t
ec.2 L+X
- 2 \(~w;As will be shown later these terms approach zero for any value of
n > 0 since '> 1.55 for all times of a full cycle. We shall there-
fore use terms with n = 0 only.
After using the inversion of Laplace Transformations from (19),
we find the temperature history in the solid and in the liquid.
Q(X,t) = (x,) + GAtO() + &1-
(2L -X)2
+ e 4+-G, (0,0)2 x &(~ - (2 L -X) c( j+
(2L -X)
+-4- Xv wC
iL-x +x 2
4044, t(A-16a)
(Wo,) Le* c2
-jL0) 2 [e //C e
(I
'3*+~
CA1 Qw'f () (ZL Ig
-- &r c L
-* ' Y (2L + a ] ±r
+ e /Y Ove -
(2 L 1)2
e
+ (I- 2 ,0" )I+,P WILe
Ie -4ce
-(2L+)
(2 r
+ oewO(0 L
e o, t) i -
24--+ 9) 1 e) -2- Oeto
, e) ,/zc ,e (A-16b)
-X PC
2 rop

-75-
These two equations satisfy the two differential equations and
the initial and boundary conditions; therefore, they are a complete
solution to the problem.
Since y > 0 and as mentioned before > 1.55, we can
neglect all terms containing L in Equation (A-16b)
Og { =(0o) &). + (,0)2 - ' 'r(c. +
+f oC (0) e+ .-- (-16c )
Furthermore, for values of x near the surface where x = 0, we can neg-
lect all terms containing L also in the solution (A-16a)
X) 0) -f+- Q o) (0) +- ) 4
X
+ (,0)[2 .- X 2
X
6 X -- 2(A-16d)
The solutions (A-16c and A-16d) are functions of position, time, and
initial temperature profile in the solid. This initial tempera-
ture profile will be found later in Appendix B by applying the condi-
tions of a periodic process.

-76-
APPENDIX B
THE CONDITIONS FOR A PERIODIC PROCESS
In order to satisfy a periodic process, we have to fulfill the
following three requirements:
I. The surface temperature varies with a period time T or
o(0, ) = L9 (0,0) (B-1)
II. The temperature slope at the surface varies with the same
period time
(0,0(B-2)
III. The average heat flux at the surface during the period time
is equal to the constant heat flux far away from the surface
at x > L, or
-- (B-3)
Applying x = 0 to Equation (10-a) will give us the surface temperature
as a function of time
6J~ - [(00) (B2-4)
Also taking the derivitive of Equation (10-a) with respect to x and
applying x = 0, we shall get the temperature slope at the surface as a
function of time.
D2 L(B-5)

-TT-
Now, we put the requirement (B-1) into (B-4) and the requirement (B-2)
into (B-5) to get
(B-6a)
P Owl ,0) = - &J'(4o'- + 2 / ~0()2F
We can express the two unknowns in Equations (6) as a function of the
period time T and the superheat 6'(oo)
6c1' (,0 )0"(o,o) qr(z+A) (B-7)
i (n -- (B-8
Using (B-7) and (B-8) in (B-5) and applying the third condition (B-3)
kw aiJOO) gr-(2 +/13Ifr-
L
2 (fI-2+ f*- (B-9)
After performing the integration and rearranging the terms, we finally
come to the relation between the heat flux, the degree of superheat,
and the waiting time .
_ 4 eOWOJ)/3 oeCOY
where
6T-#+b, 7WqPf+f1 4
.3 r (f I-4 /-/)
(B-10)
(B-11)
Using the definition of
(B-10)
-w weV, we rearrange Equation
(B-12)
(B-6b)
)
IMIIWIIMIMIM
= 2 /3 V C ?C45-00 ------ - (0) 0)OW(I ) qr
aj (01, 0) klef; Tfq,

-78-
APPENDIX C
LIQUID SUPERHEAT URING STABLE BOILING
Today it is quite commonly accepted that boiling takes place from
discrete points on the solid surface. These points are cavities con-
taining vapor or gas phase in equilibrium with the surrounding liquid.
If we assume that the boiling was maintained for quite some time,
then the effect of gas can be neglected, and only the vapor in the
cavity should be considered. Furthermore, we shall assume that far
away from the solid surface the liquid is at the saturation temperature
corresponding to the liquid pressure.
At the point just before the bubble starts to grow from the cavity,
Bergles and Rohsenow (20), following Hsu and Graham (21), consider an
hemispherical vapor bubble of radius r in a mechanical and thermodynamic
equilibrium with the liquid. The mechanical equilibrium requires that
26~P- - Pu (C-1)
where P is the vapor pressure in a curvature interface, Gis the sur-
face tension, and r is the cavity radius. The thermodynamic equilibrium
requires that
(C-2)
where Tv is the vapor temperature in the cavity, and Te is the liquid
temperature around the bubble. Since P .> Psat for the bubble to grow,
the liquid is superheated in respect to its pressure.

-T9-
In order to find the amount of superheat in the liquid, Bergles
and Rohsenow (20) applied the Clapeyron equation together with the
perfect gas approximation to obtain
T TTsark{,z (C-3)T -T Sosa
where R is the vapor constant and h is the heat of vaporization.
A similar expression can be obtained by using the pressure-tem-
perature relation along the saturation line for a flat interface. This
relation is most commonly given in the following form:
7 P= Al - 8 (c-4)
In fact most of the data on liquid metals are presented in the form of
Equation (C-4). (_1T), (22), (24).
Writing Equation (C-4) for the two pressures, P and P v, and sub-
tracting one from the other, we get
to se.SL. ~(C-5)
This relation exists on a flat interface, and, therefore, P, is slightly
higher than P for a curvature interface. If we assume that Pv P '
then, after applying Equation (C-1), we get
T _) (c-6)1a-r Tsa P5
In comparison between Equation (C-6) and (C-3), we find that they
are equivalent if
B =_ (C-7)R, &10

-80-
hWhile in Equation (C-3) the value - has to be evaluated forR
each pressure, B in Equation (C-6) is very nearly a constant for a wide
range of pressures. This makes Equation (C-6) more useful.
Solving T in Equation (C-5), we get
T 15aT.V -1 26 N~'~ ,
Since for all practical values of , the termTssaT)
a , r P « we can exp
Taylor series and solve for (T - T sat)
(C-8)
and (c-8) into a
2
T - s r .os/ 7 og / + (C-9)
Equation (C-9) is applicable to any fluid once the value B for that
particular fluid is known. Some values of B for different fluids are
given below:
Sodium
9396.75 (17)
Potassium
7797.6 (22)
7707.31(23)
Rubidium
6994.68 (24)
7062.45 (25)
6983.03 (17)
Cesium
6880.18 (24)
6631.74 (25)
6665.30 (17)
Water
3732.83 (*)
All values of B are in (OR).
(*) The value was calculated from the Steam Tables (26) in the range
of pressures between 30 psi to 960 psi.
For all practical purposes, Equation (C-9) can be simplified to
2
T-t = sar o / + (C-10)

since the second term on the right-hand side is always small to the
order of 2 percent.
Equation (C-10) provides means to calculate the liquid tempera-
ture in equilibrium with the ready-to-grow bubble if the saturation
pressure or temperature as well -s the cavity radius are known. The
surface tension C should be calculated at the vapor temperature
rather than at the saturation temperature, but since the variations
of C' with temperature are small for moderate superheat, it is a good
approximation to evaluate 6 at the saturation conditions.
As was assumed by Bergles and Rohsenow (20), the bubble will grow
if the liquid temperature at a distance y = r from the wall is equal
or greater than the vapor temperature in the hemispherical bubble.
Since r is much smaller than the thickness of the thermal layer,
a linear temperature profile in the liquid was approximated.
- T, (C-11)
or at the moment when the bubble is ready to grow,
0(0,o) = TW(0,0)-Tax = (Ti T T + (C-12)
For liquid metals having high thermal conductivity, the second term
in Equation (C-12) can be safely neglected, which makes the wall superheat
during stable boiling to be
2
-(00) Tsa. / (C-13)
Equation (C-13) is plotted for sodium with B = 9396.75 (OR) in Figure
(40) where the saturation pressure is a parameter.

-82-
APPENDIX D
BUBBLE GROWTH AND DEPARTURE IN LIQUID METALS
The main purpose of this Appendix is to get an idea about the time
of bubble growth and departure in liquid metals and to compare it to
the required time to build the thermal layer (or the waiting time).
The material which follows is not an attempt to develop a new theory
of bubble growth, but rather is an attempt to obtain an approximation
for the relative times for bubble growth and waiting period.
For one component system there are three possible mechanisms which
might control the rate of bubble growth:
I. Heat Conduction
II. Rate of Evaporation
III. Mass Inertia of the Displaced Liquid
We shall adopt here for each of the above mechanisms a known theory
in the literature and try to apply the same average values which are
applicable for sodium. Although the three mechanisms are interrelated,
we shall analyze them separately.
D.l Growth Controlled by Heat Conduction
For the case of a single bubble growing in an unlimited superheated
liquid, Scriven (27) presents a complete solution as a function of one
parameter fb*. This parameter can be found from the liquid properties
and the degree of superheat. When I << 1, the function of P3* is
given below
e -(D-l)
S'' 6/21

-83-
In the case of sodium boiling at low pressures around 60 mm Hg
from a cavity of radius r = 2.5 x 10⁻³ inchthe superheat is 58 OF.
We find that (/3*) = 247. Using Table I in (E), we find /* = 240.
The rate of growth and the bubble radius are given (2)
(D-2)
R =2P Me t (D-3)
If we assume a maximum bubble radius at departure to be 1 inch,
then
t d K4.*5 x 10⁻⁵ sec.,
and the rate of growth
R = 920 ft/sec.
If the bubble size is smaller than 1 inch, then the growth time is smaller.
D.2 Growth Controlled by Evaporation
For the same conditions of pressure and temperatures as in D.1, we
can find the rate of growth by using kinetic theory (16)
2 - G'* 2(RT /7~e
*where G' is an accommodation coefficient found experimentally for
liquid metals by Kroger (16) and for the pressure mentioned above
0.11.
Equation (D-4) will give a constant rate of growth of R = 29 ft/sec.
By assuming that Rd 4. 1 inch, we find the growth time to be
td - 2.9 x 10~3 sec.
M111010111 01111wh 11611"

D.3 Growth Controlled by Mass Inertia of Displaced Liquid
Wichner and Hoffman (28) have solved the Rayleigh equation for a
bubble growing in a superheated liquid metal when the inertia is the
only controlling factor. Their results involve a dimensionless parameter
Y given below:
For a cavity size of r = 2.5 x 10⁻³ inch and at the pressure given
-6in D.1, Y 1.74 x 10~
A dimensionless time is also presented in (28)
Cj~- = -' It (D-6)
For a bubble radius at departure of Rd .< 1 inch, we find from
Figure 1 of (28) that
* -3d = 220 or td = 5.9 x 10~ see.,
and the rate of growth is Rd = 23 ft/sec.
From Equation (11) using the properties in D.l and heat flux of
105 BTU/ft.hr, the waiting time 5' is calculated to be cfzO. 7 sec.
We can see from the three mechanisms analyzed above that the bubble
growth time is about two order of magnitude smaller than the waiting
time calculated from Equation (11).
This suggests that, indeed, the waiting time to build the thermal
layer is dominant in liquid metals.

-85-
APPENDIX E
THE CRITICAL PENETRATING DISTANCE
Following the considerations and assumptions given in paragraph
3.3, two conditions must be satisfied in order to find the critical
penetrating distance xcr. These conditions are as follows:
(E-1)
and
(E-2)OW(Xcl) 4r) = W(Oo)
Rewriting Equation (10-a) after using Equation (B-T) and (B-8), we get
e(x, ) = OW ( 1o) - /+Pe c(2 )
+ cY'r- fc2 &Yfc
(E-3)
The time derivitive of Equation (E-3) becomes
atO(o, o)
1+0 /0) 2+ 0-t
x z~4e t x
2~vr4,,O'2e
x +2
4(, (" +4Fb ? -+_ 7 2 (E-4i)
9 xwcr r
X CAx 2
q7(2+1'*) 6do10) 01 e t x+(qr+ 4rs 2VW; e -x e, /cz e-n)

-86-
Defining
zo 2 CY (E-5)
applying condition (E-1) to Equation (E-4), and using the definition
(E-5), we get
rV~r(2+P) C.tfl f- (rr-2)2,-
- (E-6)
As will be shown later Z < l and also < I , we can simplify
Equation (E-6) by neglecting the second term on the right-hand side.
Therefore,
z = {z+r) Icr (E-T)
To satisfy condition (E-2) we use Equation (18) with the defini-
tion (E-5) to obtain
+
,) (01 + -2 (+ - ,+
+ 2
(E-8)
Re-arrange Equation (E-8)
~rfcZ,2 = (246) I/~F~vZ+e , 7 / F4
AL+22, |+)2
-- ,Z +- |-e (-VqZ+ 9 )
2
e A/
2Ze,1
(E-9)

-87-
We shall use the following approximation, Figure 41,
The approximation (E-10) simplifies the following term
2 2
'O- TZe e'#Z,) = C r C Z, (E-11)
Now, we re-write Equation (E-9) with the approximation (E-11) together
with the Equation (E-7) and get the final equation for Z0
4f3 ~. 2( / ) + +2 ] (E-12)qr (2-f3) 2 oJ IT (2 41!) 2
The best way to solve Equation (E-12) is by a graphical method.
The left-hand side of Equation (E-12) would not vary much with P , butthe right-hand side is a strong function of /3. By using various values
of and solving Equation (E-12), we find Z as a function of /3. See
Table (1).
Using the definition (E-5) in Equation (E-7) and solving Xcr'
we get
'2 (qqI3+4)ypw- 22 = (E-13)cy {~+ (2E3
Define, now, the ratio between the critical distance and the relaxa-
tion length
XcrL Y (E-14)
Combining Equations (E-13) and (13) with the definition (E-14), we get
2.2 Z (E-15)

-88-
7 is a function of only and is given in Table (1) and plotted in
Figure (5).
Re-arranging Equation (E-7) we find the ratio of the critical time
to the waiting time.
r~z~) 20(E-16)
This ratio is a function of f only and is given in Table (1). The
magnitude of this term is of the order of 0.5 and, therefore, justifies
the approximation of Equation (E-6) to (E-T).

-89-
APPENDIX F
TABULATION OF EXPERIMENT AL RESULTS
In the following tables several symbols were used to designate
the modes of heat transfer which were observed while taking the data.
N.C. - Natural Convection
N.C. (S.C.) - Natural Convection, the Liquid is Sub-Cooled
B.B. - Before Bumping
A.B. - After Bumping
Bumping - Bumping
S.B. - Stable Boiling
Run No. 1
Boiler plate made of nickel "A," coated with porous nickel "A," 65 micron
grade, 1/32-inch thick. After had been solidified from Marto's (5_) run 30.
Sodium depth: 2.5 in.
P Tsat Tt .T ext. w ext.-T sat o
(mm Hg) (OF) (OF) (OF) (OF) (BTU/ft2hr) Remarks
58.0 1206 1027 1050 23 29,000 N.C. (S.C.)
56.5 1203 1198 1230 32 45,000 N.C. (S.C.)
59.0 1209 1212 1273 64 71,000 Bumping
61.5 1214 1210 1236 22 92,000 S.B.
58.0 1206 1205 1240 34 12T,000 S.B.
55.0 1199 1198 1242 43 161,000 S.B.
54.5 1198 1200 1248 50 197,000 S.B.
56.5 1203 1203 1234 31 111,000 S.B.
58.5 1207 1206 1229 22 77,000 S.B.
59.0 1209 1209 1228 19 44,000 S.B.
62.0 1215 1170 1220 50 30,000 N.C. (S.C.)

-90-
Run No, 2
Boiler plate made of nickel "A" with twelve re-entry type cavities of
I 0.004 in. After was cleaned from Marto's (5_) run No. 28.
Sodium depth:
P Tsat
(mm Hg) (OF)
64.058.559.559.557.557.560.559.5
1219
1208
1210
1210
1205
1205
1212
1210
1-1/2 in.
Te
(OF)
1162
1202
1195
1195
1206
1206
1199
1201
Tw ext.
(OF)
T -Tatw ext. sat
(OF)
1183
1235
12381226
1261
1236
1232
1229
o
(BTU/ft h)
23,000
43,000
99,000
87,000109,000
122,000
173,000
203,000
Remarks
N.C. (S.C.)
Bumping
Bumping
Bumping
Bumping
Bumping
Bumping
Bumping
Run No. 3
Boiler plate made of nickel "A," coated with porous nickel "A," 35
microns grade, 1/32-inch thick.
Sodium depth: 2 in.
( H sat
(mm Hg) (OF)
58.558.56o.0
57.0
57.0
1208
1208
1211
1204
1204
Te
(OF)
1193
1201
1226
1221
1200
Tw ext.
(OF)
T -Tstw ext. sat
(OF)
1206
1220
1252
1261
1228
q0
(BTtJ/ft2hr)
25,000
26,000
39,000
54,00061,000
Remarks
N.C. (S.C.)
N.C. (S.C.)
N.C.
B.B.
A.B.

Run No. 4
Same as in run 3. System cooled down and sodium solidified; then
reheated, and tests were repeated,
P sat
(mm Hg) (OF)
55.5
56.o
57.0
57.0
58.0
58.5
58.5
50.0
56.0
60.5
61.0
6o.5
1201
1202
1204
1204
1206
1207
1207
1187
1202
1212
1213
1212
T e
(OF)
1194
11971199
1201
1201
1202
1202
1191
1200
1206
1210
1204
T ext.
(OF)
1243
1286
1296
1235
1325
1271
1235
1255
1293
1240
1240
1239
Tw ext. sat
(OF)
49
89
92
31
119
64
28
68
91
28
27
2T
(BTU/ft2 hr)
44,000
73,000
98,000
100,000
106,000
54,ooo33,000
55,000
87,000
141,000
195,000
233,000
Remarks
(S.C.)(S.C.)
N.C.
N.C.
B.B.
A.B.
N.C.
N.C.
N.C.
N.C.
N. C.
S.B.
S.B.
S.B.
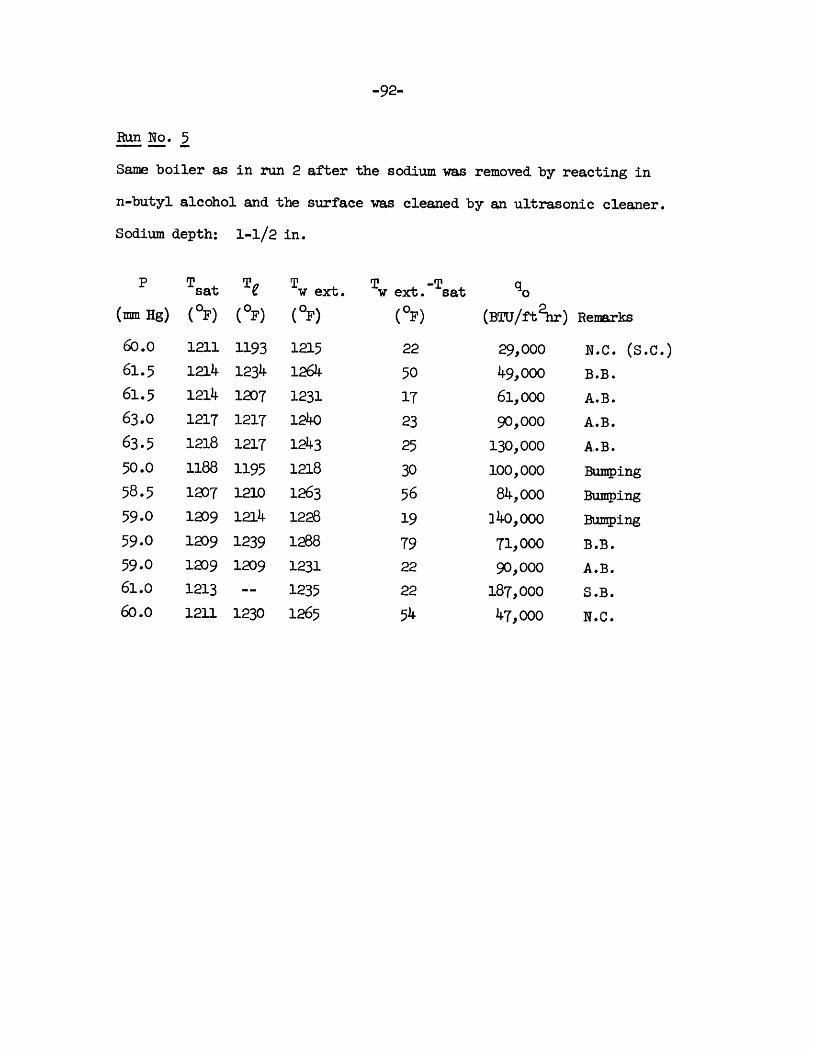
-92-
Run No. 5
Same boiler as in run 2 after the sodium was removed by reacting in
n-butyl alcohol and the surface was cleaned by an ultrasonic cleaner.
Sodium depth:
P Tsat
(mm Hg) (OF)
1-1/2 in.
Te
(OF)
Tw ext.
(OF)
T -Tw ext. sat
(OF)
( o
(BTU/ft2h)
1193 12151234 1264
1207 12311217 1240
1217 1243
1195 12181210 12631214 1228
1239 1288
1209 1231-- 1235
1230 1265
Remarks
60.0
61.561.5
63.0
63.5
50.0
58.559.0
59.0
59.061.0
60.o
1211
1214
1214
1217
1218
1188
12071209
1209
1209
1213
1211
22
50
17
23
25
30
5619
7922
22
54
29,000
49,0ooo
61,000
90,000
130,000
100,000
84,000
140, 000
71,000
90,000
187,000
47,000
N.C. (S.C.)
B.B.
A.B.
A.B.
A.B.
Bumping
Bumping
Bumping
B.B.
A.B.
S.B.
N.C.

-93-
Run No. 6
Boiler plate made of two pieces of nickel "A," copper brazed with a
permanent T.C. One cylindrical cavity of $ 0.010 in. x 0.050 in.*
Sodium depth: 2 in.
P Tsat
(mm Hg) (OF)
6o.563.5
57.560.0
53.553.566.0
60.554.558.559.563.5
54.556.0
60.560.5
1212
1218
1205
1211
1196
1196
1223
1212
1198
1207
1210
1218
1198
1202
1212
1212
T
(OF)
1166
1210
1212
1228
1225
1202
1212
1200
1188
1200
1203
1209
1196
1191
1200
1202
Tw ext.
(OF)
1189
1253
1258
1286
1287
1247
1273
1292
1294
1310
1290
1290
1263
1289
1303
1312
Tw ext.
F)
23
35537591
51
50
80
96
103
80
72
658T7
91
100
':20 w(0,0)
ft2 hr
22,000
33,000
45,000
64,000
69,000
92,000
136,000
163,000
225,000
200,000
158,000
104,000
65,000168,ooo
190,000
300,000
(OF) (sec) Remarks
-- -- N.C.
-- -- N.C.
-- -- N.C.
-- -- N.C.
-- -- B.B.
-- -- A.B.
-- -- A.B.
106 8.0 S.B.
110 1.0 S.B.
117 2.0 S.B.
101 4.5 S.B.
108 7.0 S.B.
-- -- N.C.
114 4.5 S.B.
107 3.2 S.B.
109 0.7 S.B.
Calculated effective cavity radius r = 1.15 x 10i-3
(S.C.)
in.

-.94-
Run No. 7
Same as run 6. System cooled and sodium solidified; then reheated and
*tests repeated.
P T T T T e 0 w(o,o) f(~sat t w ext. sat BTU
(mm Hg) (0F) (OF) (OF) (OF) ft2hr (OF) (sec) Remarks
59.5 1210 12o4 1230 24 18,000 -- -- N.C.
60.0 1211 1210 1244 33 22,000 -- -- N.C.
60.0 1211 1218 1260 49 35,000 -- -- N.C.
60.5 1212 1223 1282 70 52,000 -- -- N.C.
60.5 1212 1228 1325 113 8o,ooo -- -- N.C.
62.5 1216 lo6 1287 71 164,000 100 3.5 S.B.
64.5 1220 1214 1285 65 210,000 90 1.9 S.B.
71.0 1233 1227 1303 70 250,000 93 1.0 S.B.
79.5 1248 1238 1330 82 260,ooo 95 o.6 S.B.
65.0 1221 1211 1285 64 128,ooo 85 4.6 S.B.
65.0 1221 1214 1301 80 70,ooo -- -- N.C.
68.0 1227 1222 1305 77 180,000 95 2.2 S.B.
* 3Calculated effective cavity radius r = 1.15 x lo0 in.

-95-
Run No. 8
Boiler plate made of two pieces of nickel "A," copper brazed with a
permanent T. C. One cylindrical cavity of 0 o.0465 in. x 0.050 in.*
Sodium depth: 2 in.
TSw ext .- q 9 (0,0) CP Tsat T Tw ext. Tsat BTU
(mm Hg) (OF) (OF) (OF) (OF) ft2hr (OF) (sec) Remarks
6o.5 1212 1182 1200 18 15,000 -- -- N.C. (S.C.)
63.0 1217 1224 1240 23 20,000 -- -- N.C.
59.0 1209 1232 1255 46 28,000 -- -- N.C.
67.o 1225 1235 1265 40 30,000 -- -- N.C.
60.5 1212 1218 1260 48 46,000 -- -- N.C.
64.5 1220 1220 1250 30 92,000 40 1.3 S.B.
72.0 1235 1226 1266 31 140,000 39 1.1 S.B.
74.5 1239 1229 1275 36 202,000 40 0.4 S.B.
45.5 1176 1176 1210 34 80,000 50 7.0 S.B.
56.o 1202 1202 1233 31 89,000 49 4.7 S.B.
68.5 1228 1227 1260 32 110,000 40 1.5 S.B.
88.0 1262 1257 1300 38 240,000 42 0.3 S.B.
60.5 1212 1212 1250 38 30,000 -- -- N.C.
Calculated effective cavity radius r = 3.3 x 10⁻³ in.
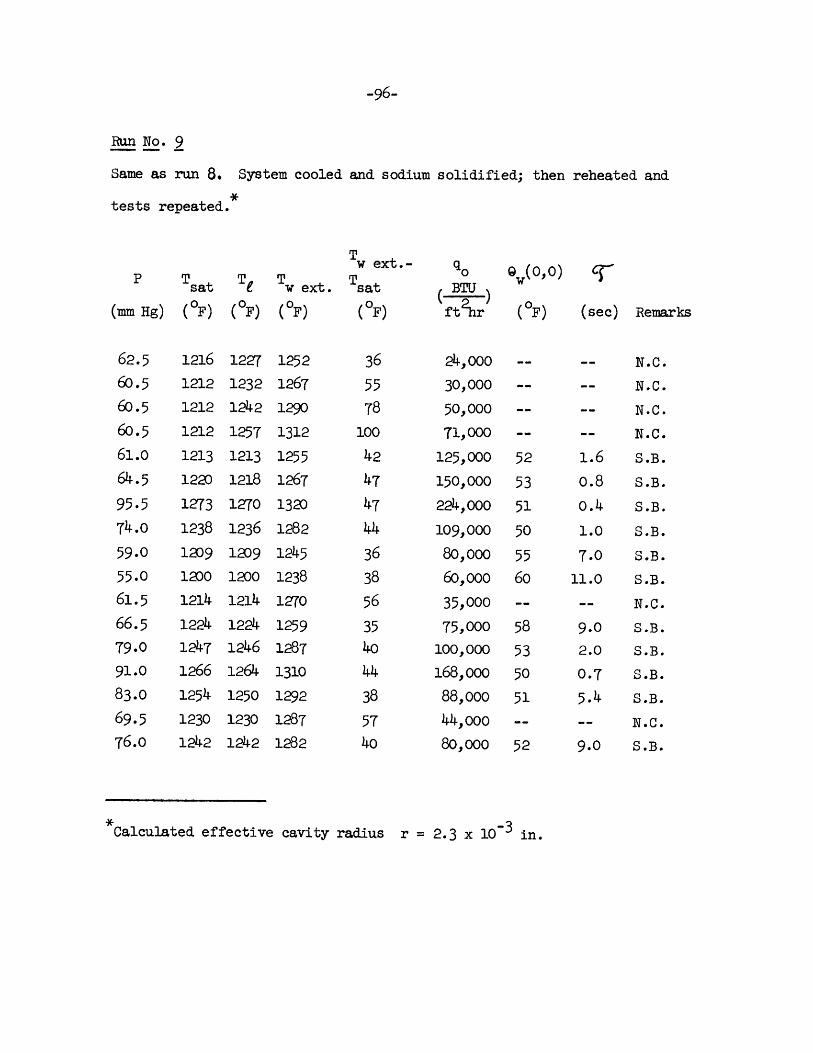
-96-
Run No. 9
Same as run 8. System cooled and sodium solidified; then reheated and
*tests repeated.
T w ext.- q0 (o) CCsat e w ext. sat BTU
(mm Hg) (OF) (OF) (OF) (OF) ft2hr (OF) (sec) Remarks
62.5 1216 1227 1252 36 24,ooo -- -- N.C.
60.5 1212 1232 1267 55 30,000 -- -- N.C.
60.5 1212 1242 1290 78 50,ooo -- -- N.C.
60.5 1212 1257 1312 100 71,000 -- -- N.C.
61.o 1213 1213 1255 42 125,000 52 1.6 S.B.
64.5 1220 1218 1267 47 150,000 53 0.8 S.B.
95.5 1273 1270 1320 47 224,ooo 51 0.4 S.B.
74.o 1238 1236 1282 44 109,000 50 1.0 S.B.
59.0 1209 1209 1245 36 80,000 55 7.0 S.B.
55.0 1200 1200 1238 38 60,000 60 11.0 S.B.
61.5 1214 1214 127o 56 35,000 -- -- N.C.
66.5 1224 1224 1259 35 75,000 58 9.0 S.B.
79.0 1247 1246 1287 40 100,ooo 53 2.0 S.B.
91.0 1266 1264 1310 44 168,ooo 50 0.7 S.B.
83.0 1254 1250 1292 38 88,ooo 51 5.4 S.B.69.5 1230 1230 1287 57 44,000 -- -- N.C.
76.0 1242 1242 1282 4o 80,000 52 9.0 S.B.
*Calculated effective cavity radius r = 2.3 x 10 in.

-97-
Run No. 10
Same surface as in runs 8 and 9 after the sodium was reacted, and the
surface re-polished.*
Sodium depth: 2-1/4 in.
Tw ext.- g 0 (0,0) 'P Tsat T Tw ext. Tsat BTU ) V
(mm Hg) (OF) (OF) (OF) (OF) ft2hr (OF) (sec) Remarks
62.5 1216 1145 1168 23 17,000 -- -- N.C. (S.C.)
63.0 1217 1228 1247 30 28,000 -- -- N.C.
60.0 1211 1237 1265 54 40,000 -- -- N.C.
63.0 1217 1230 1286 69 52,000 -- -- N.C.
67.0 1225 1236 1302 77 77,000 -- -- N.C.
69.0 1229 1229 1304 75 90,000 -- -- Bumping
77.5 1244 1241 1286 42 108,000 69 9.0 S.B.
88.0 1262 1261 1310 48 145,000 70 5.0 S.B.
73.5 1237 1246 1316 79 77,000 -- -- N.C.
62.5 1216 1216 1283 67 62,000 -- -- N.C.
62.5 1216 1214 1266 50 140.,ooo 83 6.0 S.B.
79.0 1247 1240 1315 68 215,000 78 2.0 S.B.
Calculated effective cavity radius r = 1.5 x 103 in.
loll
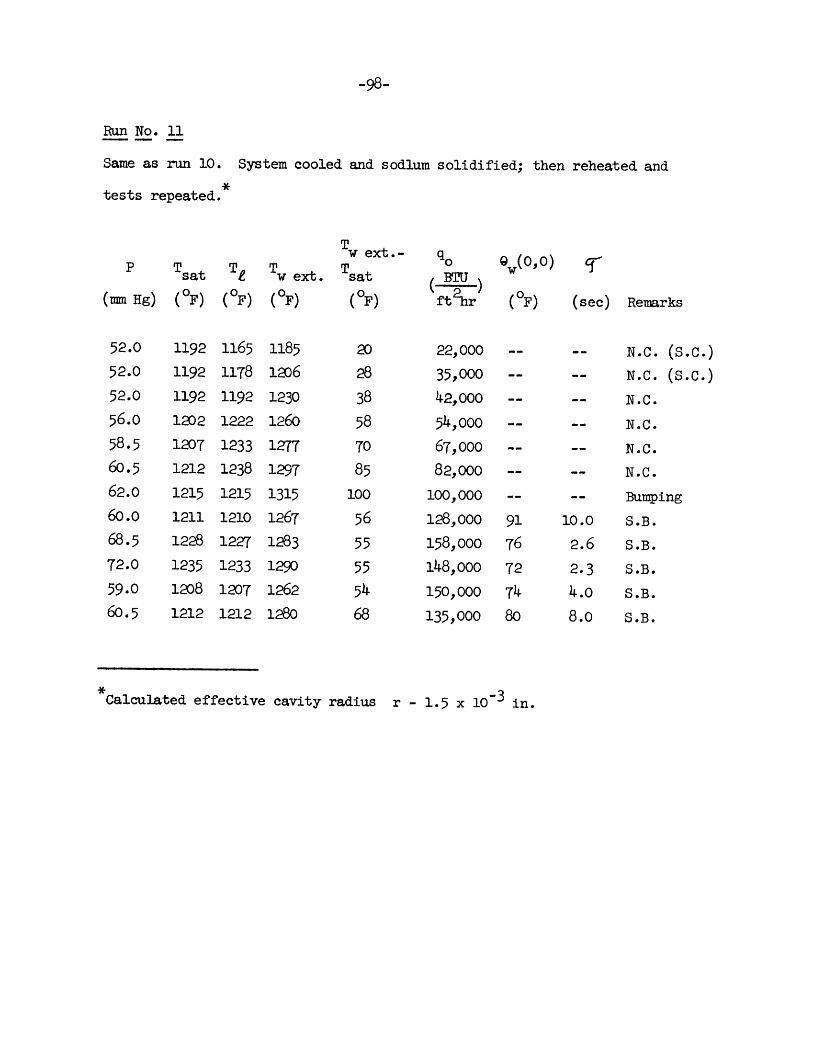
-98-
Run No. 11
Same as run 10. System cooled and sodlum solidified; then reheated and
tests repeated.
TTw ext.- q 0 9 090)P T T T T _ *w0,o)sat T w ext. sat BTU w
(mm Hg) (OF) (OF) (OF) (OF) ft2hr (OF) (sec) Remarks
52.0 1192 1165 1185 20 22,000 -- -- N.C. (S.C.)
52.0 1192 1178 1206 26 35,000 -- -- N.C. (S.C.)52.0 1192 1192 1230 38 42,000 -- -- N.C.
56.0 1202 1222 1260 58 54,000 -- -- N.C.
58.5 1207 1233 1277 70 67,000 -- -- N.C.
60.5 1212 1238 1297 85 82,000 -- -- N.C.
62.0 1215 1215 1315 100 100,000 -- -- Bumping
60.0 1211 1210 1267 56 128,ooo 91 10.0 S.B.
68.5 1228 1227 1283 55 158,000 76 2.6 S.B.72.0 1235 1233 1290 55 148,000 72 2.3 S.B.
59.0 1208 1207 1262 54 150,000 74 4.0 S.B.60.5 1212 1212 1280 68 135,000 80 8.0 S.B.
Calculated effective cavity radius r - 1.5 x 10⁻³ in.

-99-
Run No. 12
Boiler plate made of two nickel "A," copper brazed with a permanent
T. C. One cylindrical cavity of $ 0.020 in. x 0.050 in.*
Sodium depth:
P Tsat
(mm Hg) (OF)
56.0
59.0
6o.5
60.5
62.0
65.5
70.5
78.0
61.5
59.554.549.549.566.0
1202
1209
1212
1212
1215
1222
1232
1245
1214
1210
1199
1186
11861223
2-1/2 in.
T f
(OF)
1209
1224
1214
1213
1215
1221
1229
1241
1212
1207
1198
1186
1185
1221
TTw ext.
(OF)
1236
1252
1252
1252
1262
12T2
1280
1294
1262
1254
1244
1233
1233
12T5
Tw ext. -Tsat
(OF)
3443
4.0
40
4.7
50
48
494844
45
47
47
52
5870.5 1232 1230 1290
q 0BTU
ft2hr
23,000
35,000
55,000
77,000
93,000
126,000
152,000
213,000
128,000
100,000
90,000
40,000
72,000
195,000
280,000
9,(0,0) T
(OF) (sec) Remarks
-- -- N.C.
-- -- N.C.
-- -- Bumping
65 8.0 S.B.
65 3.0 S.B.
62 2.0 S.B.
57 1.0 S.B.
58 0.3 S.B.
58 1.5 S.B.
57 1.8 S.B.
61 5.6 S.B.
-- -- N.C.
66 9.0 S.B.
59 0.7 S.B.
65 0.3 S.B.
Calculated effective cavity radius r = 2.2 x 10⁻³ in.
NOW

-100-
Run No. 13
Boiler plate made of nickel "A," with one re-entry type cavity of
9 0.005 in.
Sodium depth: 2 in.
w ext.- q 9 (0,0) cf'
sat e w ext. sat BTUJ
(mm Hg) (OF) (OF) (OF) (*F) ft2 r (F) (sec) Remarks
34.0 1140 1141 1160 20 14,000 -- -- N.C.
36.5 1149 1156 1182 33 26,000 -- -- N.C.
36.5 1149 1166 1199 50 40,000 -- -- N.C.
37.0 1150 1169 1207 57 50,000 -- -- N.C.
39.0 1156 1188 1242 86 73,000 -- -- N.C.
41.5 1164 1217 1267 103 111,000 -- -- B.B.
42.0 1166 1158 1205 39 190,000 94 5.0 S.B.
64.5 1220 1213 1255 35 126,000 69 8.0 S.B.
64.5 1220 1212 1255 35 160,000 60 1.3 S.B.
65.5 1222 1213 1255 33 233,000 51 0.5 S.B.
64.0 1219 1210 1253 34 113,000 61 4.0 S.B.
64.0 1219 1211 1259 40 136,000 66 6.o S.B.
105.5 1287 1278 1310 23 137,000 38 1.1 S.B.
105.5 1287 1277 1311 24 99,000 44 2.5 S.B.
106.5 1288 1279 1308 20 212,000 35 0.3 S.B.
104.0 1285 1277 1310 25 90,000 47 8.0 S.B.
39.5 1159 1150 1198 39 180,000o 83 10.0 S.B.

-101-
Run No. 14
Boiler plate made of nickel "A." One cylindrical cavity of 0 0.0105 in x
0.150 in.
Sodium level: 2-1/4 in.
Tw ext.- g 0 (0,0) r
P Tsat T t ex Tsat (BTU )(mm Hg) (OF) (OF) (OF) (OF) ft 2 hr (OF) (sec) Remarks
37.0 1151 1154 1177 26 20,000 -- -- N.C.
37.5 1152 1158 1190 38 24.,000 -- -- N.C.
41.0 1163 1175 1212 49 36,000 -- -- N.C.
37.5 1152 1170 1210 58 46,000 -- -- N.C.
37.5 1152 1180 1230 78 65,000 -- -- N.C.
40.5 1161 1207 1293 132 90,000 -- -- N.C.
50.0 1188 1180 1213 25 159,000 38 0.3 S-B-
46.0 1177 1169 1206 29 126,000 39 o.6 S.B.
39.0 1157 1152 1192 35 90,000 49 4.5 S.B.
36.0 1147 1139 1200 61 60,000 -- -- N.C. (S.C.)
38.0 1153 1145 1225 80 97,000 -- -- N.C. (S.C.)
39.5 1158 1149 1198 40 106,000 57 6.2 S.B.
42.0 1166 1157 1198 32 138,000 51 2.4 S.B.
58.0 1206 1200 1229 23 190,000 33 0.3 S.B.
56.0 1202 1198 1227 25 123,000 35 1.0 S-B.
96.0 1274 1331 1415 141 125,000 -- -- N.C.
96.0 1274 1267 1290 16 133,000 23 0.2 S.B.
96.0 1274 1267 1290 16 88,000 24 0.3 S.B.
90.5 1265 1258 1282 17 58,000 24 0.7 S.B.
50.0 1187 1180 1215 28 115,000 38 1.1 S.B.
54.0 1197 1189 1222 25 147,000 33 0.2 S.B.
67.0 1225 1220 1249 24 110,000 33 0.5 S.B.
67.0 1225 1221 1248 23 86,000 35 1.5 S.B.
67.0 1225 -- 1318 93 80,000 -- -- N.C.

-102-
APPENDIX G
CALCULATED EXAMPLE
The method of reducing the data is described in paragraph 5.5,
but it will be more clear by arbitrarily selecting one data point and
calculating it numerically. We have selected here the data point 12
of run 14. The reduced temperatures and the measured pressure are
given in Table G.1
Table G.1
Distance fromT.C. No. Boiler Surface (in.)
0.750
0.550
0.350
0.150
0.550
0.150
0.050
0.050
0.75
Above liquid surface
Temperature (OF)
1399
1345
1292
1242
1348
1237
1224
1208
1220
1149
1158
Remarks
In the liquid
In the vapor
The measured pressure by the open-end manometer P = 39 mm Hg.
1
2
3
4
5
6
7 max.
7 min.
8 ave.
9
11

-103-
The temperatures presented in Table G.1 were measured by the type
K potentiometer, except those of T.C 7 which were recorded on the Record-
ing Oscillograph.
Thermocouples 5, 6, and 8 were used only for indication of radial
effects and were not used in any further calculations.
In order to find the heat flux, the temperatures measured by T.C
1, 2, 3, and 4 were plotted versus their positions in the boiler plate.
(See Figure (42).) Usually a reasonable straight line was found to con-
nect these points from which the heat flux was obtained from
LOTW (G-1)
where the thermal conductivity of nickel is given by Hogan and Sawyer (29).
k = 20.3 + 0.00965 T (G-2)w
k is in (BTLU/ft.hr OF) and T in (OF).w
Using the average wall temperature for the four thermocouples, which
is about 1300 0F, the thermal conductivity is found to be k = 33w
BTU/ft.hr OF, and the heat flux
g = 106,000 BTU/ft2hr .
The saturation temperature was taken as the measured vapor tempera-
ture which was in this case T = 1158 OF. From the saturation tempera-
ture, the saturation pressure is found by using Equation (29)
5220.42log10 P = 4.52172 - Tsat (G-3)Tsat
which in this case is found to be
p = 39.5 mi Hg.
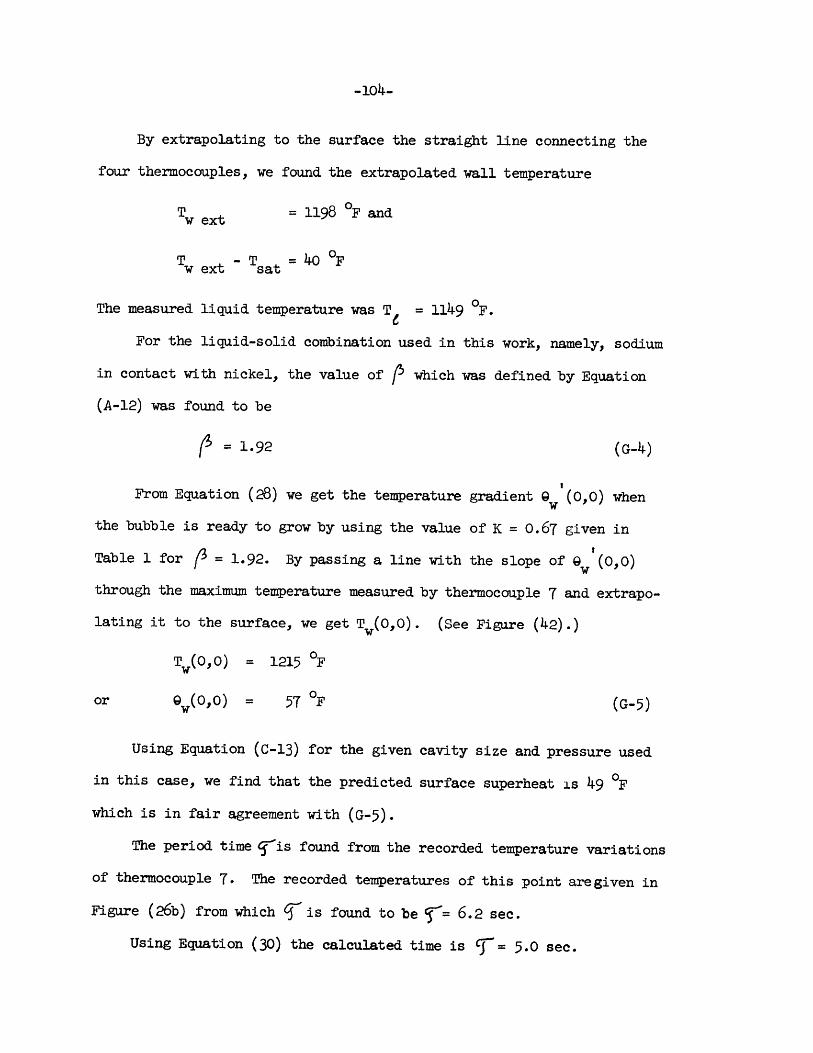
By extrapolating to the surface the straight line connecting the
four thermocouples, we found the extrapolated wall temperature
T = 1198 0 F and
T - T =40 OFw ext sat
The measured liquid temperature was T = 1149 OF.
For the liquid-solid combination used in this work, namely, sodium
in contact with nickel, the value of which was defined by Equation
(A-12) was found to be
= 1.92 (G-4)
From Equation (28) we get the temperature gradient 9 w(00) when
the bubble is ready to grow by using the value of K = 0.67 given in
Table 1 for = 1.92. By passing a line with the slope of 9 (0,0)
through the maximum temperature measured by thermocouple 7 and extrapo-
lating it to the surface, we get T,(0,0). (See Figure (42).)
T (0,0) = 1215 OF
or 9w(0,0) = 5T OF (G-5)
Using Equation (C-13) for the given cavity size and pressure used
in this case, we find that the predicted surface superheat is 49 OF
which is in fair agreement with (G-5).
The period time qis found from the recorded temperature variations
of thermocouple 7. The recorded temperatures of this point aregiven in
Figure (26b) from which C5 is found to be T= 6.2 sec.
Using Equation (30) the calculated time is CT= 5.0 sec.
-104-
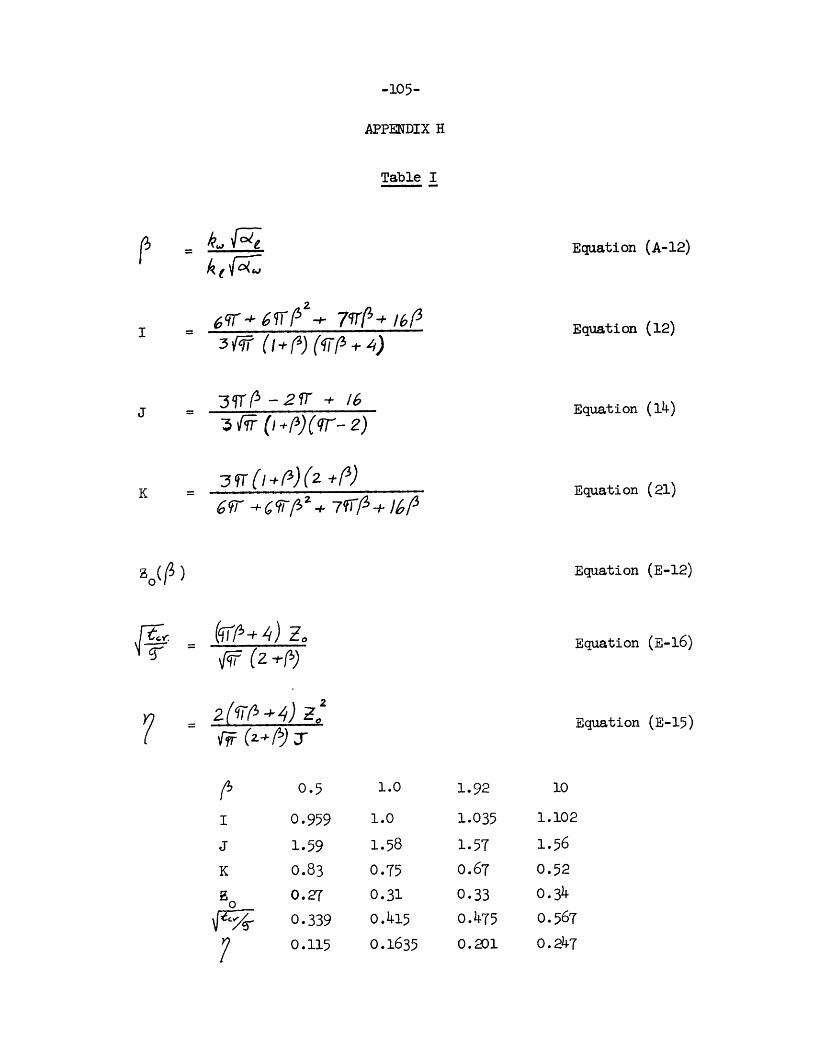
-105-
APPENDIX H
Table I
Equation (A-12)
67* T- 2+ " f + 13/6
3 - 2)( -+ 1)-3r (qT +*)(Or- 2)
3 1 +9 +3 ~(2+ I7
Equation (12)
Equation (14)
Equation (21)
Equation (E-12)
0.5
0.959
1.59
0.83
0.27
0.339
1.0
1.0
1.58
0.75
0.31
0.415
0.115 0.1635
1.92
1.035
1.57
0.67
0.33
0.475
0.201
Equation (E-16)
Equation (E-15)
10
1.102
1.56
0.52
0.34
0.567
0.247
kJ~
s-
(172.4+ ) z0
_2 -4- z 2
I
J
K
0

I |
Stag 1 1 Stage 2 Icol Stage41I I
t
Stage 1: Evaporation from a microlayer, surface temperature decreases.
Stage 2: The microlayer was evaporated, low rate of heat transfer tothe vapor. Surface temperature increases.
Stage 3: The bubble left the surface. Heat is transferred to theliquid with decreasing surface temperature.
Stage 4: Normal thermal boundary layer is re-formed.
FIG. 1: WALL SURFACE TEIPERATURE VARIATIONS WRING BUBBLE FORMATIONAND DEPARTURE OF LIQUID TOLUENE FROM GLASS (COPIED FROM COOPER (9))
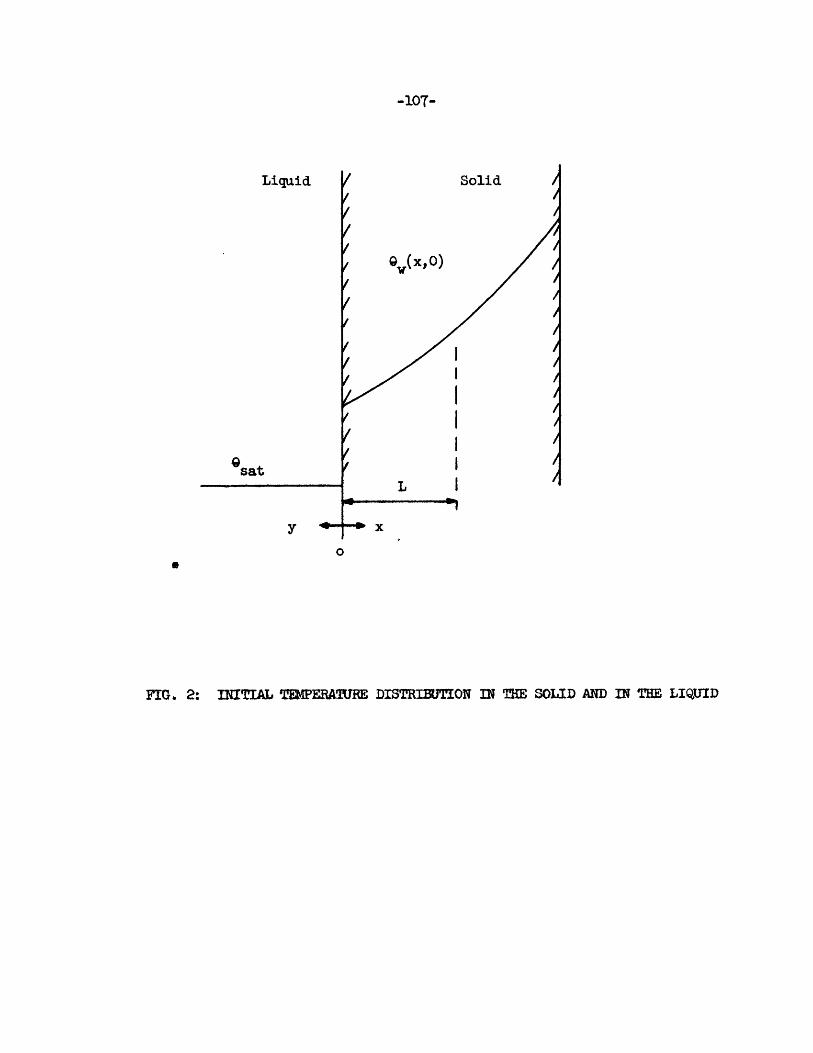
Liquid
0sat
Solid
9 v(X, 0)
LI
FIG . 2: INITIAL TEMPERA'URE DISTRIBUTION IN THE SOLID AND IN THE LIQUID
-107-
INIA11,111I..

Q (x, t)Q W(0,0)
1.7
1.5
1.4
1.3
1.2 ___
01.1 //
1.0
0.9o-
0.8
0.6
0 .1 .2 -3 *4 .5 .6 .T .8 .9 1.0 (x/L)
FIG. 3: TEMPERATURE VARIATIONS IN THE SOLID. EQUATION (18)(f = 1.52)

MHII,
q/q 0 -109-
2.8 ri
2.6
2.4
2.2
2.0
1.8
1.4
1.2
1.0
0.8
0.60 .1 .2 .3 .4 .5 .6 .T .8 .9 1.0 t/
FIG. 4: VARIATIONS OF HEAT FWX AT THE SURFACE. EQJATION 20(FUR P= 1.92)
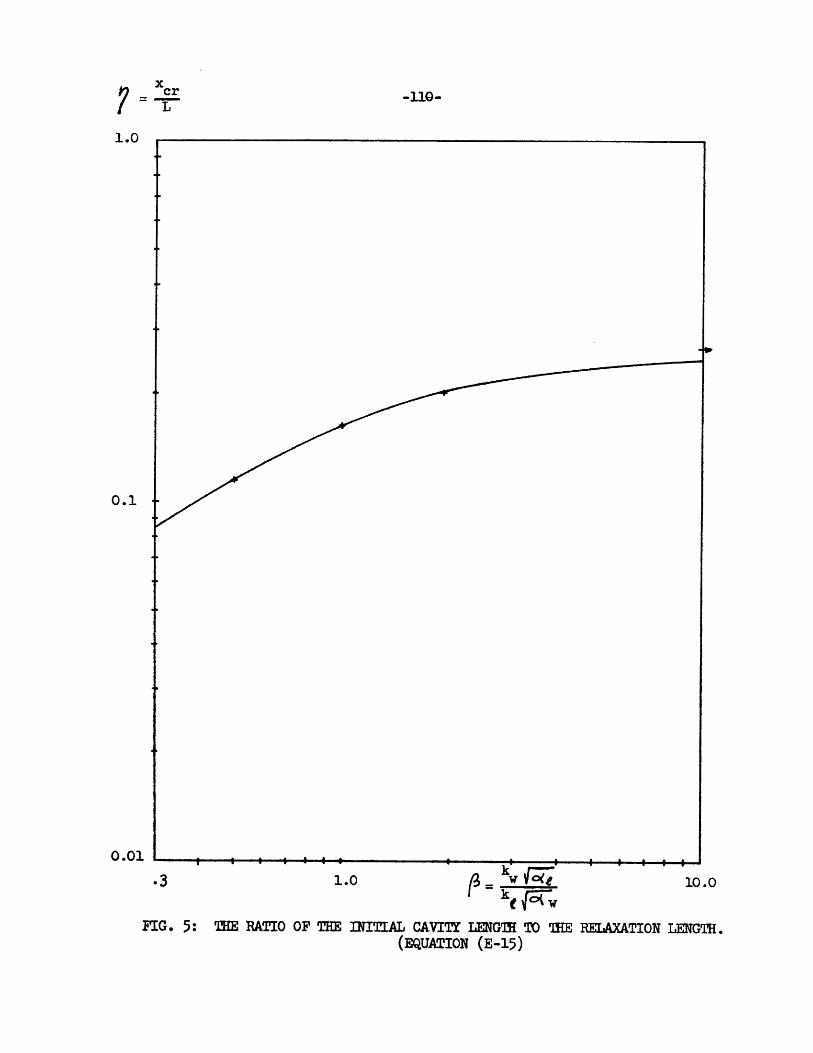
X? r -110-L
1.0
0.1
0.01
.3 1.0 10.0
FIG. 5: THE RATIO OF THE INITIAL CAVITY LENGTH TO THE RELAXATION LENGTH.(EQUATION (E-15)

VERTICALTHERMO0UPLEWELL
SODIUM POOL -
TEST PLATE WITHTHERMOCOUPLES
VACUUM CHAMBER
OPEN ENDNAMMETER
HELIUMFILTER
HELIUMSUPPLYTANK
HIGH VACUUM SYSTEM
FIG. 6 SCHEMATIC DIAGRAM OF APPARATUS

- 112 -
FIG. 7. PARTIAL ASSEMBLY OF EQUIPMENT

-a
FIG. 8. GENERAL VIEW OF HEAT TRANSFER FACILITY

- 114 -
Stainless Steel Pipe
Nickel Pipe
Boiler Plate
FIG. 9 BOILER PARES

CONAX MULTIPLETHERMOCOUPLE GLAND
2- I.D. STAINLESS STEEL,BOILER PIPE
2L" 1.D. NICKELBOILER PIPE
TANTALUM -10% TUNGSTENELECTRICAL FILAMENT
MOLYBDENUM BUS
INTERNALLY COOLEDCOPPER ELECTRODE
TO CONDENSER SECTION-WELDED BOILER FLANGE
-14"OD STAINLESS STEELVACUUM CHAMBER
CONNECTION
RADIATION SHIELDS
2t OD BOILER SURFACEWITH THERMOCOUPLE WELLS
TEFLON INSULATORS
FIG.10 HEATER & BOILER SECTIONAL DRAWING

2x SS CONAX PACKING GLANDFOR TWO PROBES
AIR INLET-
X L x 18" COPPER FINS HELIARC16 4TACK WELDED TO SS PIPE AT TOPa BOTTOM AND SILVER SOLDEREDALONG ENTIRE LENGTH
VACUUM CHAMBER COVER
3 SS TUBE - PRESSURE aVACUUM CONNECTION
SS TUBE - TAYLOR
GAUGE LINE
6" OD X 28" LONG STEELCONDENSER COVER
AIR OUTLET
FIG 11 CONDENSER SECTIONAL DRAWING

- 117 -
Vacuum Chamber
Copper Condenser Fins
l.- Thermocouple Gland
FIG. 12 VIEW OF 0ONIENSER

000cc-
-I-4

LOW WATERFLOW RATE
LOSS OFVACUUM
IOW AIRFLOW RATE
LOW SODIUMLEVEL
V - DC
FIG. 14: ELECTRICAL WIRING DIAGRAM FMR CONTROL SYSTEM
110

- 120 -
FIG. 15 ADJUSTABLE VERTICAL PROBE
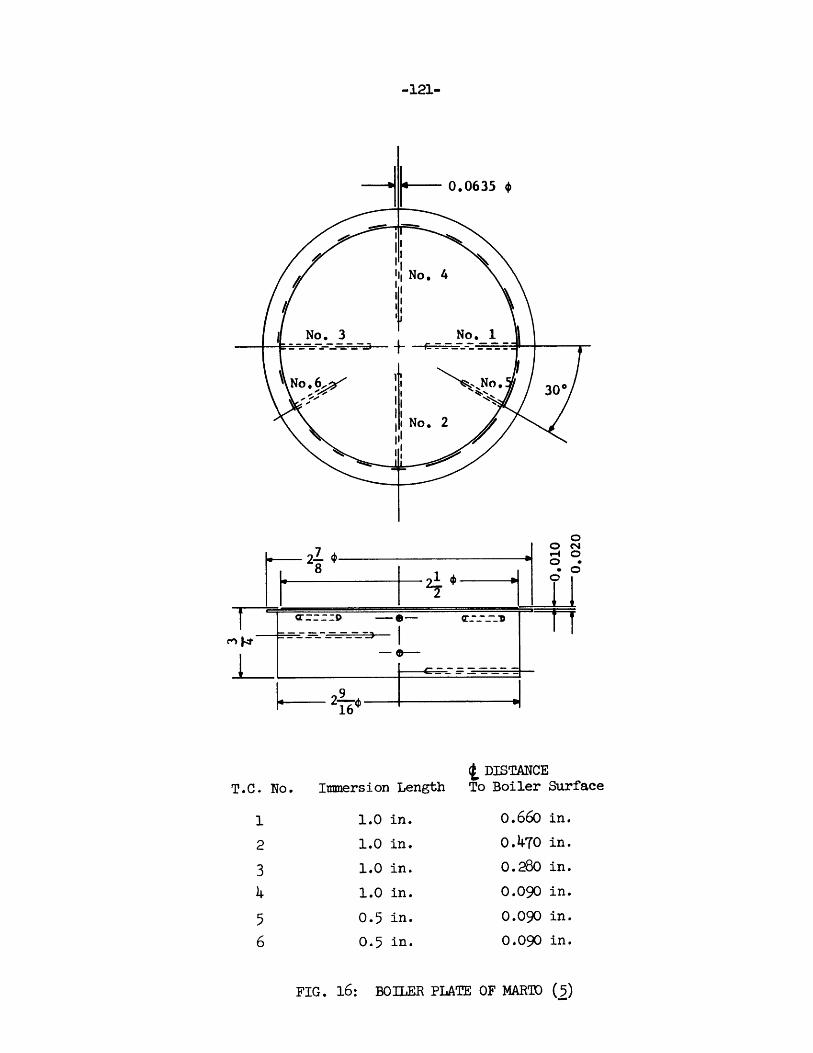
-121-
0ONSOO.0
t DISTANCET.C. No. Immersion Length To Boiler Surface
1 1.0 in. o.66o in.
2 1.0 in. 0.470 in.
3 1.0 in. 0.280 in.
4 1.0 in. 0.090 in.
5 0.5 in. 0.090 in.
6 0.5 in. 0.090 in.
FIG. 16: BOILER PLATE OF MARTO (5)

- 122 -
FIG. 17. SAMPLE OF DOUBLY RE-ENTRANT CAVITY0. 004 IN. MOUTH DIA. X 0.025 IN. DEEP
(75X) MARTO

1:1 NICKEL II
PIPE
NICKEL II
ImersionLength
1.0 in.
1.0 in.
1.0 in.
Under Cavity
t Distance FromBoiler Surface
0.710 in.
0.510 in.
0.310 in.
0.050 in.
FIG. 18: BOILER PLATE WITH PERMANENT T. C.
T.C. No.

- 124 -
FIG. 19 SURFACE WITH MIRROR FINISH
(Looking from the Top of the Boiler)

-125-
Run: 13: Re-Entry CavtjyScale 50:1
DiameterT.C. No. (in.)
1 0.0625
2 0.0625
3 0.0625
4 0.0625
5 0.0625
6 0.0625
7 0.040
8 0.04o
ImmersionLength(in.)
1.275
1.275
1.275
1.275
o.650
o.650
1.100
0.800
t DistanceFrom Surface
0.750
0.550
0.350
0.150
0.550
0.150
0.050
0.050
(in.)
Run 14: CylindricalCavity. Scale 25:1
FIG. 20: BOILER PLATE WITH ARTIFICIAL CAVITIES

T(OF)
1300
1260
1220
1180
114o
T(Liquid)
T(Vapor)
30 6o 90 120 t(sec.)
FIG. 21 T ERATUF": VARIATIONS LJRING BUMPING
T. C. No. 7

o 0 BTU
o(0,0) ft 2 r F Curve I (Eq. 11)
Curve II (Eq. 30)
x~ + q .
0 ++
0 t
0H103 -
+ Run 6X Run T0 Run 80 Run 9a Run 10
V Ru 11o Run 12
* Run 13m Run 14
10 2 1 1 10.1 1.0 10 r(sec.)
FIG. 22: 0,0) vs.Q 0.0

Run 9-13
q = 100,000 -
o ft2hr' = 2 sec.
P = 79 tr Hg
Tsat = 1247 OF
T.C. 4
T (Liquid)
I * I I I I I I I I
12 28 32 t (sec.)
TRACES OF TEPERATURE VARIATION WRING STABLE BOILING
T
(OF)
1320
1300
1280
1260
1240
8
FIG. 23a:

T.C. 4
Run 9-15
q = 88,000 BTU
ft 2 hr
9r ' = 5.4 see
P = 83 mn Hg
Tsat = 1254 'F1330
1310
1290
12T0
1250
1230
TRACES OF TEMPERATURE VARIATION DURING STABLE BOILING
T
(OF)
T (Liquid)
i I i I a i m . w
4 8 12 16 20 24 28 32 t (sec.)
............................
FIG. 23b:

Run 9-17
q = 82,000 -TUho ft~hr
c' = 9.0 sec
P = 76 mm Hg
TsatT.C. 4= 1242 OF
(OF)
1310
1290
1270
1250
TRACES OF TEMPERATURE VARIATION DURING STABLE BOILING
T (Liquid)
8 2 i i i 3 t1 4 8 12 16 20 24 26 32 t (sec.)
1230
FIG. 23c:

Run 11-10
q = 148,ooo --
ft 2 hr
= 2.3 sec.
PTsat
T (Liquid)
FIG. 24a: TRACES OF TEM4PERATURE VARIATION RING STABLE BOILING
T.C. 4
T
(OF)
1320
1300
1280
1260
1220
0 2 4 6 8 10 12 14 16 18 20 22 24 26 28 30 32 t(sec.)

Run 12-10
q = 100,000 TU= . e r
i= 1.8 sece.
= 59.5 mm Hg= 1210 OF
T
(OF)
1270
1250
1230
1210
1190
8 t (sec.)
TRACES OF TEMPERATURE VARIATION IURING STABLE BOILING
T.C. 4
T(Vapor)
T(Liquid)
T 4
iiiiiiiiiiiiiiiiiiiiiillillililloolo"
FIG. 24b:

Run 12-11
T q = 90,000 B P = 54.5 mm Hg
(OF) ft 2 hr Tsat = 1199 OF
1280 = 5.6 sec.
T.C. 4
1260
1240
1220
120O T(Liquid) T(Vapor)
180 14. 8 12 16 20 20 4 8 12 16 20 24 28 32 t (sec.)
FIG. 24c: TRACES OF TF4PERATURE VARIATION DURING STABLE BOILING

Run 13-8BTU
q = 137,000 -
= 1.1 sec
P =105.5 mm Hg
.sat= 1287 0 F
T.C. 7
T
(OF)
1350
1330
1310
1290
.4
FIG. 25a: TRACES OF TEPERATURE VARIATION IJRING STABLE BOILING
T (Vapor)
12708 t(sec.)

Run 13-9
T q = 16o,ooo BTU
(OF) ft 2hr
1290= 1.3 Sec.
P = 64.5 mm Hg'.C' T T sat = 1220 OF
1270
1250
12301230 T (Vapor)
1210 I
0 1 2 3 4 5 6 7 8 t(sec.)
FIG. 25b: TRACES OF TEMERATURE VAKEATION DURING STABLE BOILING

T Run 13-11
(OF) q = 113,000 B
= sec.
1300 P 64 mm Hg
T.C. TTsat= 1219 0F
1280
1260
1240
T (Vapor1220
1200 t
0 4 8 12 16 20 24 28 32 t(sec.)
TRACES OF TEMPERAIURE VARIATION IURING STABIE BOILINGFIG. 25c:

Run 13-13
BT1Uq = 137,000 fThr
= 1.1 sec.
P =105.5 mm HgT.C. 8 T = 1287 OF
.I
T (Vapor
T (Liquid)
0 4 8 12 16 20 24 28 32 t(sec.)
TRACES OF TEMPERATUME VARIATION MING STABLE BOILING
T
O0 F)
13,50
1330
1310
1290
12TO
FIG. 25d:
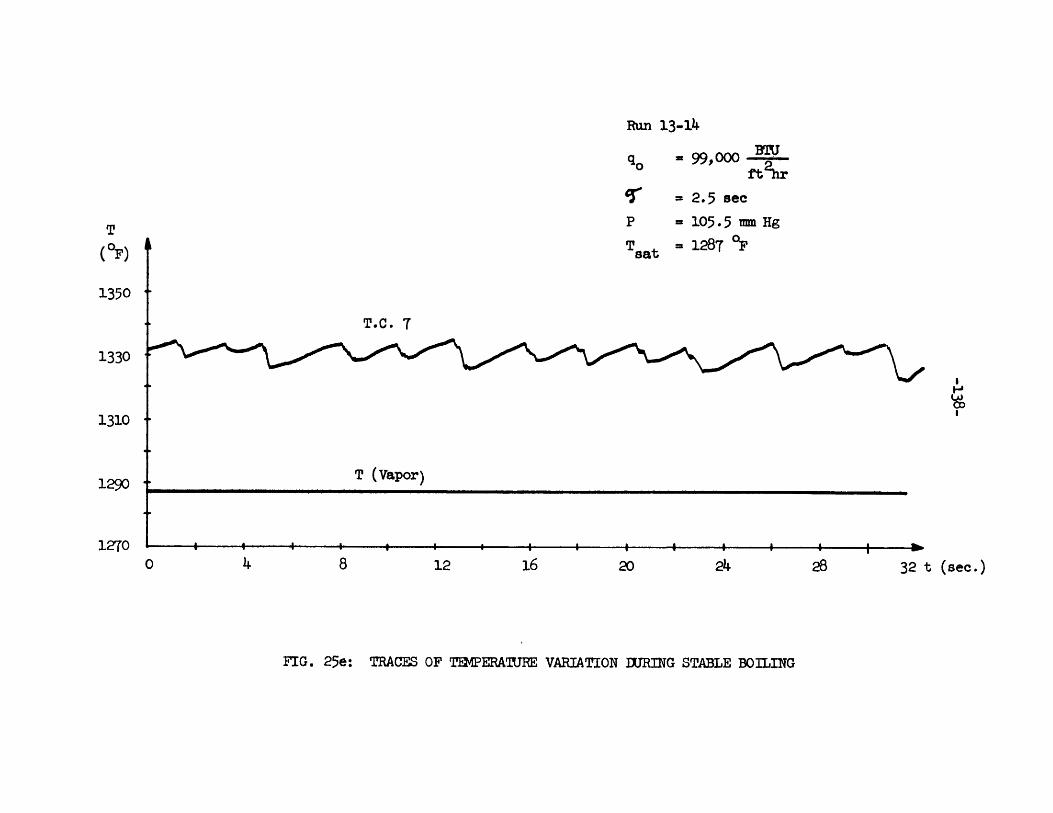
Run 13-14
S = 99,000 iho ftihr
'-' -2.5 seeP = 105.5 mm Hg
Tsat = 1287 OF
T.C. T
T (Vapor)
TRACES OF T&IPERA1URE VARIATION DURING STABLE BOILING
T
(OF)
1350
1330
1310
1290
12704 8 12 16 20 24 28 32 t (se.)
FIG. 25e:

Run 13-17
= 180,000ft2hr
- = 10 sec.
P = 39.5 mm Hg Tsat = 1159 *F
0 4 8 12 32 t(sec.)
TRACES OF TEMPERATURE VARIATION DURING STABLE BOILING
T.C. 7
('F)
1240
1220
1200
1180
1160T (Vapar)
FIG. 25f :

Run 14-9
q 0 90,000 BT.U
- 4.5 see
P w 39.0 mm Hg
Tsat = 1157 "F
T. C. 7
T (Vapor)
T (Liquid)
I I a a i i i i0 4 8 12 16 20 24 28 32 t(sec.)
TRACES OF TEMPERATURE VARIATION DURING STABLE BOILING
T
(OF)
1220
1200-
1180
116o
3.140
FIG. 26a:

Run 14-12
q = 1o6,ooo BTU0 ~ ft2 hr
cr = 6.2 see.
P = 39.5 mm Hg
Tsat = 1158 'F
T(OF)
1250
1230
1210
1190
1170
T (Liquid)
TRACES OF TEMPERATURE VARIATION IURING STABLE BOILING
T (Vapor)
1150
T. C. T7
4 8 12 16 20 24 28 32 t (sec.)
FIG. 26b:

Run 14-13
B'lUq = 138,000 -T-o r
= 2.4 seC.
= 42.0 mm Hg
= 1166 OF
> 4 a48 12 16 20 24l 28
T (Liquid)
32 t (sec.)
FIG. 26c: TRACES OF TEMPERATURE VARIATION IURING STABLE BOILING
T
(OF)
1250
1230
1210
1190
1170
T. C. 7Tsat
1150 -
T (Vapor)

Ran 14-19
q 0 = 58,9ooo BTft 2 hr
= 0.7 sec.
P
Tsat
= 90.5 mm Hg
= 1265 OF
T (Liquid)
i I I I I I I I
4 8 12 16 20 24 28 32 t(se,)
FIG. 26e
T. C. 7
T (Vapor)
0 1 2 3 4 5 6 7 8 t(sec.)
FIG. 26d
TRACES OF TEMPERATURE VARIATION DURING STABLE BOILING
T
(OF)
1290
1270
T.C. 7
T (Vapor)
1250
1310
1290
1270
1250
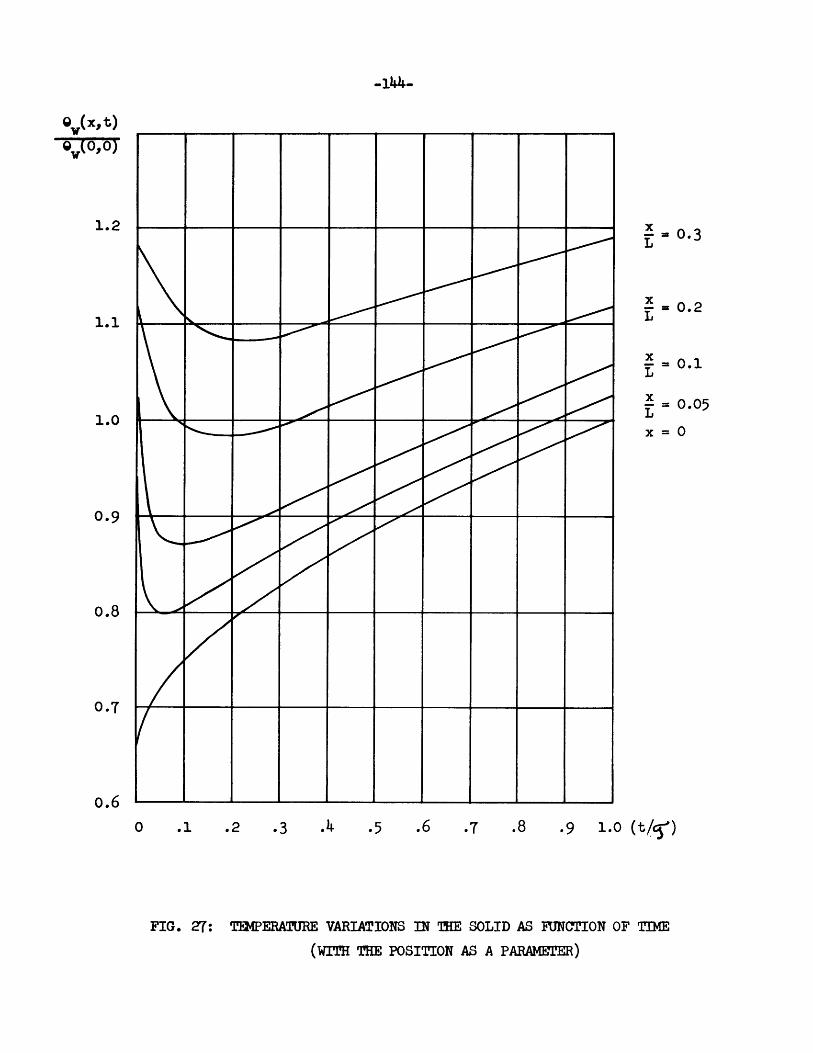
-1 4 4 -
0 .1 .2 .3 .4 .5 .6 .T .8 .9 1.0 (t/g)
FIG. 27: TEMPERATURE VARIATIONS IN THE SOLID AS FUNCTION OF TIME
(WITH THE POSITION AS A PARAMERER)
Q,(x, t)Q (0,0)
1.2
1.1
1.0
0.9
0.8
0.6
- 0.2
= 0.1
= 0.05
=0
= 0.3

-145-
BwNq ( ft2hr
Cavity Length e= 0.150
Q (Equ. 26)
0 (Equation 31)
@ (Equation 22)
4- - 4+ +N.C.
105 + +
+ E--- . 0 0
0
0 N. C.
+ 9, (O,0), S. B.
(D (o,0), S. B.
Limiting Point
1010 100 (T V - T sat )(F
FIG. 28: MINIMUM HEAT FLUXES M)R STABLE BOILING

Run 14-23/24
q = 86,000 B3TUft2hr
mm Hg
OF
T
(OF)
1340
1320
1300
1280
1260
1240
1220
1200
T (Vapor)
32 t (sec.)
FIG. 29: TRANSITION FROM STABLE BOILING TO NATURAL CONVECTION
P
T t
= 67.0
= 1225
T. C. 7
-

-147-
BTUJq 0 ( ft 2 hr
100 (T, - Tsat) (F)
FIG. 30: MINIUM HEAT FLUXES F)R STABLE BOILING MOR THE CASES OF MARTO (5)
AND HFFMAN (18)

-18-
B'0 Uq0 (-)
10 4 a Marto's(Runs 29,3
10 100 (T v - T sat)(F
FIG. 31: RUN NO. 1
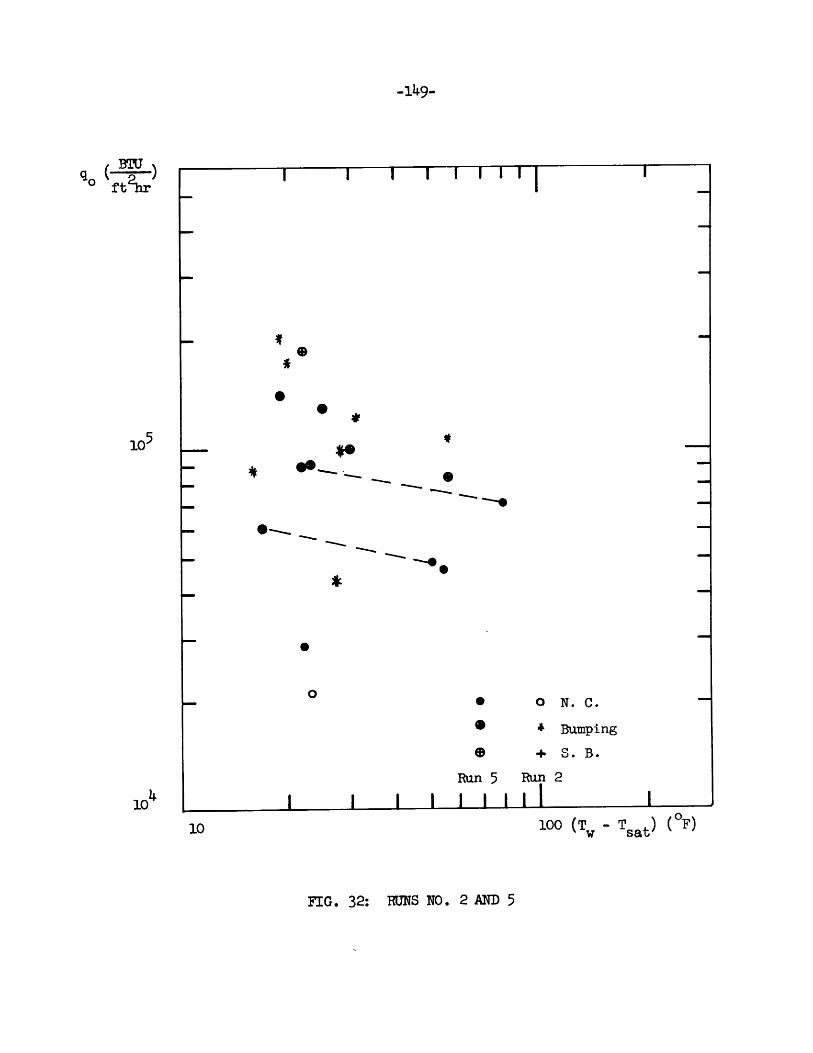
-149-
BTUl_
ft r
105_
1010
FIG. 32: RUNS NO. 2 MD 5
100 (Tw - Tsat) (F)

-150-
BTUq0 (-)t't 2 hr
100 (T - Tsat ) (F)
FIG. 33: RUNS NO. 3 AND 4

-151-
BTUq (-)
S ft 2 hrI I I 111111 I
- ~
1-'
0 0
0
oN. C.
Bumping
* 4S. B.
Run 7
I I | |W LJRun 6
100 (T - T t) (OF)
FIG. 34: RUNS NO. 6 AND 7

-152-
I I I 111111 I
4-
1- *-~
I ~
0
0
0 0 N. C.
0
Run 9
+ S. B.
Run 8
100
FIG. 35: RUNS NO. 8 AND 9
BTU
oft~r
104 a(T w- T sat )(F)

-153-
I I I 111111
4-.
p
0
0
* o N. C.
* Bumping
S+ S. B.
Run 11I I I I i ii
Run 10
0 100 (T, - Tsat) (6F)
FIG. 36: RUNS NO. 10 AND 11
q 0( I
104
s
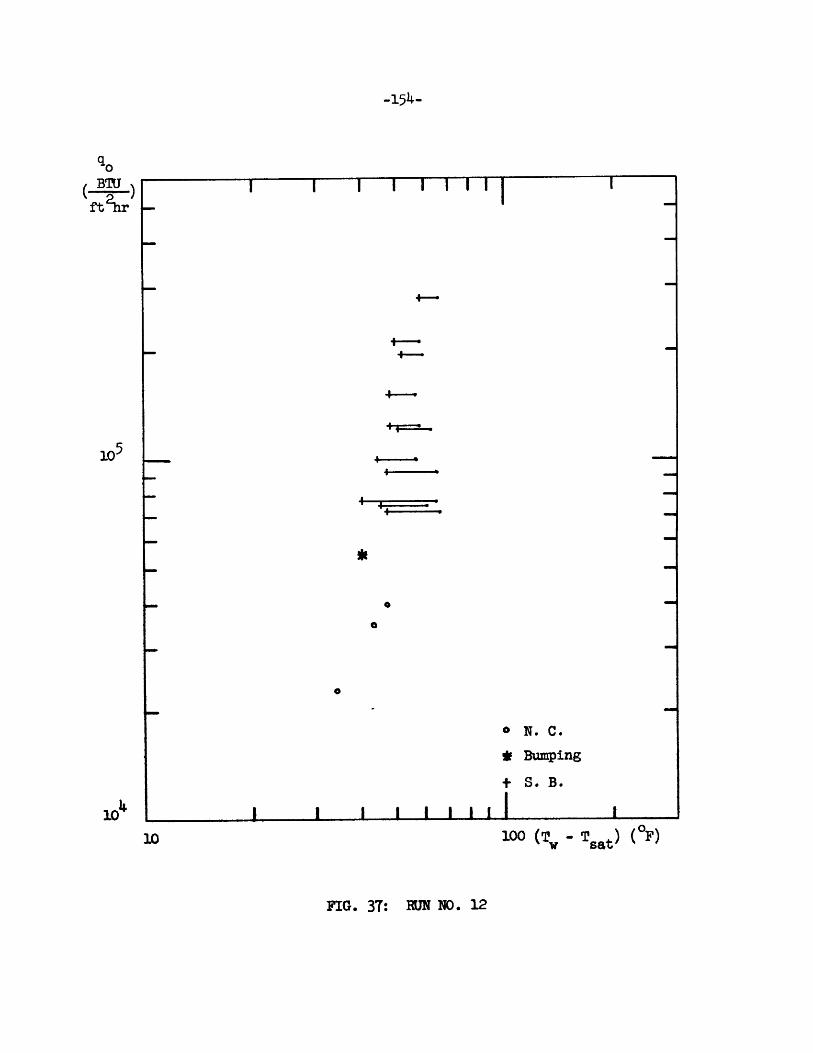
-154-
I I I 11111
-4
a4 --.
o N. C.
* Bumping
+ S. B.
I I I -11111 (
0 100 ( - Tsat) (F)
FIG. 37: 1UN NO. 12
B'IU
ft hr
10

-155-
BTEJ
ft 2hr
o N. C.
v + S. B.
106 65 4o P mnm Hg
100 (T - Tsat) (OF)
FIG. 38: RUN NO. 13
0-
|3D
pO0
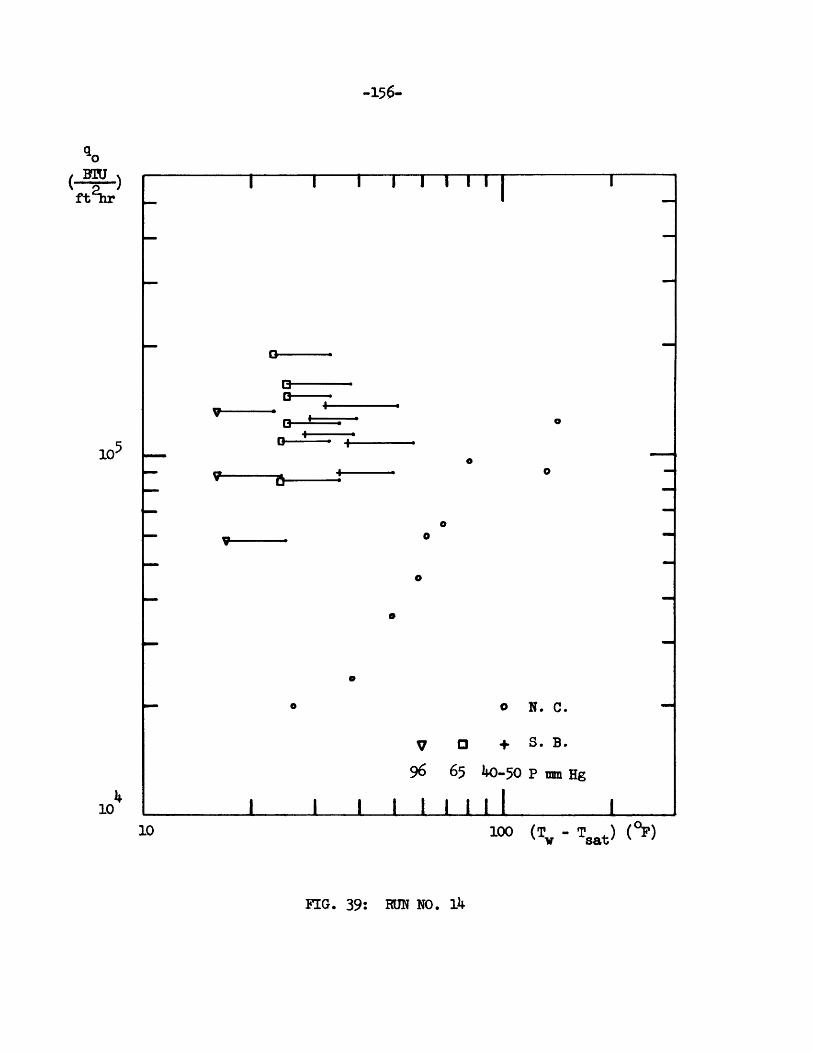
-156-
I I I 111111 I
0-
0-0-
4-
0-0- +-
- o N. C.
V O + S. B.
96 65 40-50 P un Hg
I I I I iii (OF0 100 (T- Tt) ("F)
FIG. 39: RUN NO. 14
ft2 hr
1410

-157-
I I I I II I I I 111111 I I I I~0 ,(0,0)
(OF)
100
10
T6o
I I i i i I I I I 1 1111103 r (in.)
FIG. 40: SUPERHEAT IN LIQUID SODIUM
P = 30 mm Hg
I II

z2
(i + g rZ0)e 0 erfc Z
18.4%
0.1 1.0
FIG. 41: THE APPROXIMATED EQUATION (E-10)
2.0
1.0
0.8
o.6
o.4
0.30.01

-159-
0.350 0.550 x (in.) 0.750
FIG. 42: CALICULATED EXAMPLE FOR REIUCING DATA
T
(OF)
1350
1300
1250
1200
11500 0.05 0.150