
The Measure of Success – For Thirty Years · The Measure of Success – For Thirty Years...
82
Natural Resources Canada Ressources naturelles Canada Canadian Industry Program for Energy Conservation 2003/2004 Annual Report The Measure of Success – For Thirty Years Industrial Energy Efficiency
Transcript of The Measure of Success – For Thirty Years · The Measure of Success – For Thirty Years...
Natural ResourcesCanada
Ressources naturellesCanada
Canadian Industry Program for Energy Conservation 2003/2004 Annual Report
The Measure of Success –
For Thirty Years
IndustrialEnergy Efficiency

Recycled Paper
Cover photograph courtesy of Bombardier.
Cataloguing in Publication
Canadian Industry Program for Energy Conservation
2003/2004 annual report
Annual.Issued also in French under title: Rapport annuel 2003–2004.ISBN 0-662-40201-4Cat. No. M141-3/2004EISSN 1485-8789
1. Canadian Industry Program for Energy Conservation – Periodicals.2. Energy conservation – Government policy – Canada – Periodicals.3. Industries – Energy conservation – Canada – Periodicals.4. Energy conservation – Canada – Periodicals.5. Research, Industrial – Energy conservation – Canada – Periodicals.I. Title.
TJ163.4 C3 333.79’16’0971
© Her Majesty the Queen in Right of Canada, 2005
Aussi disponible en français sous le titre : Rapport annuel 2003–2004 du Programmed’économie d’énergie dans l’industrie canadienne.
For more information or to receive additional copiesof this publication, contact
Canadian Industry Program for Energy Conservation Office of Energy EfficiencyNatural Resources Canada580 Booth Street, 18th FloorOttawa ON K1A 0E4
Tel.: (613) 995-6839Fax: (613) 992-3161E-mail: [email protected] site: oee.nrcan.gc.ca/cipec
CIPEC was created three decades ago as the embodiment of a unique vision:
a voluntary partnership between government and business to champion
industrial energy efficiency across Canada. From its inception in 1975,
CIPEC’s mission has been driven by people, companies and associations who
have passionately advanced Canada’s sustainable development agenda.

5 Message from the Chair
8 CIPEC – The First Thirty Years
11 Vision
21 Action
35 Performance
Success Stories
13 Goodyear15 Maple Leaf Foods16 Doubletex19 Ford Motor Company of Canada23 Emco Pont-Rouge 24 Atwood Cheese Company 27 NorskeCanada30 Iron Ore Company of Canada 33 Devon Canada 37 Procter & Gamble
Sector Reports
42 Aluminum43 Brewery44 Cement45 Chemical46 Construction47 Dairy
48 Electrical and Electronics49 Electricity Generation50 Fertilizer51 Food and Beverage52 Foundry53 General Manufacturing54 Lime55 Mining56 Oil Sands57 Petroleum Products58 Pulp and Paper59 Rubber60 Steel61 Textiles62 Transportation Equipment Manufacturing63 Upstream Oil and Gas64 Wood Products
66 How CIPEC Works67 CIPEC Executive Board68 CIPEC Task Force Council70 Industrial Energy Innovators71 Industrial Energy Innovators
by Sector75 Association Members76 Industrial Programs Division Staff77 Glossary of Terms
2003/2004 ANNUAL REPORT
OUR MISSION
To promote effective voluntary action that reduces industrial energy
use per unit of production, thereby improving economic performance
while participating in meeting Canada’s climate change objectives.
The success stories featured in this report exhibit the vision and
perspective that symbolize CIPEC’s mission.
4 2004/2005 CIPEC ANNUAL REPORT
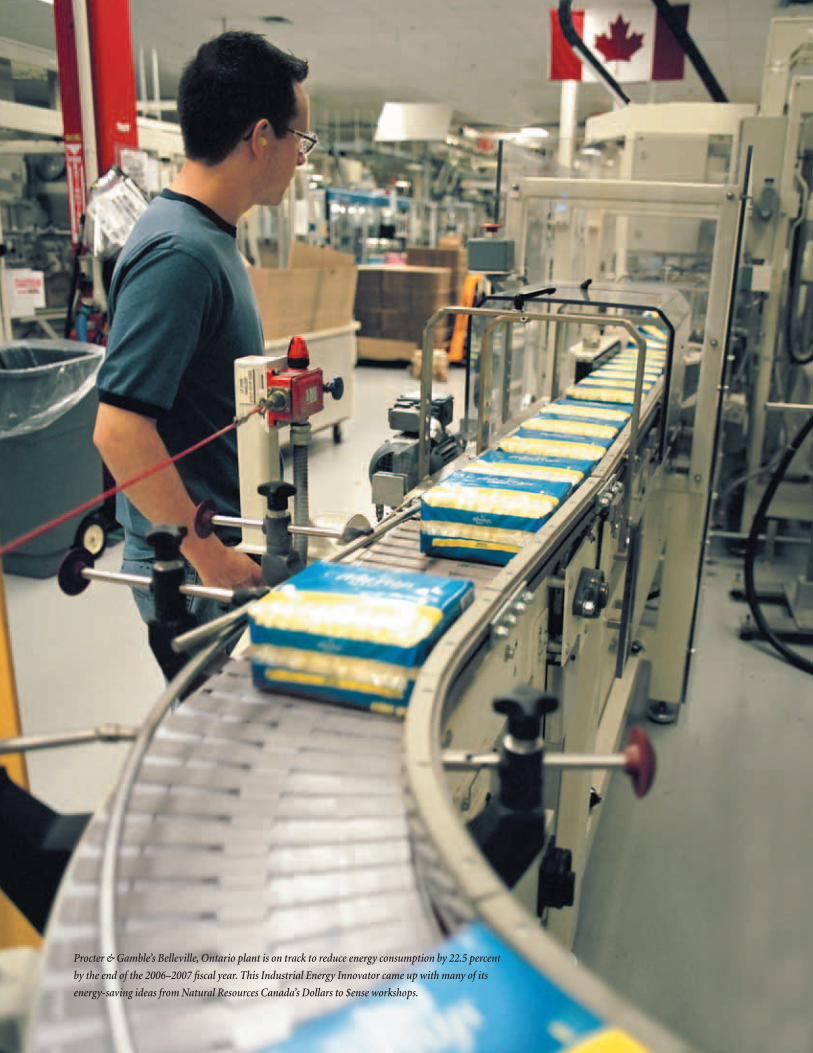
Procter & Gamble’s Belleville, Ontario plant is on track to reduce energy consumption by 22.5 percent
by the end of the 2006–2007 fiscal year. This Industrial Energy Innovator came up with many of its
energy-saving ideas from Natural Resources Canada’s Dollars to $ense workshops.

5 2003/2004 CIPEC ANNUAL REPORT
Douglas E. Speers
Chairman, Emco Corporation
Chair, CIPEC Executive Board
CIPEC owes its well-established reputation as a valuable
industry-government partnership to visionaries who
believed that a successful partnership rests on the ability of
both parties to work together in good faith and achieve
measurable results. Over its 30-year history, CIPEC has
adapted and evolved. When faced with challenges,
imaginative people in both industry and government have
stepped forward to reinvent, refocus and revitalize the
organization. Their efforts established CIPEC’s importance
as an indispensable catalyst for industrial energy efficiency.
Today, with industry leading the agenda and the federal
government providing support, the two partners continue
to work together toward mutually compatible goals.
I urge you to take the opportunity to examine this
2003–2004 annual report. This publication tells the story
of CIPEC’s history and accomplishments, and celebrates
the vision, action and achievements of Canadian industry.
A NOTEWORTHY SUCCESS
Canadian companies are increasingly relying on CIPEC for
the guidance and expertise they need to curtail energy
costs and boost profitability. As a result of CIPEC’s efforts,
the more than 5000 companies that represent over
98 percent of Canadian industry have reduced their
combined energy intensity by 8.7 percent between 1990
and 2003, or an average of 0.7 percent per year. Improved
energy management enabled Canadian industry to
avoid approximately $3.4 billion in purchased energy in
2003, enough energy to meet the energy required to heat
4.8 million Canadian households for one year. Had energy
Founded in 1975 in response to the worldwide oil crisis, CIPEC is based on a clear vision of the vast potential for energy efficiency within Canadian industry.
A Partnership Built for Performance
Message from the Chair
6 2003/2004 CIPEC ANNUAL REPORT
intensity remained constant, industry’s greenhouse gas
emissions would have been 27.8 megatonnes higher.
The mining, manufacturing and construction sectors
improved their energy intensity by an average of 1.7 percent
per year over that period. In 2000, these CIPEC sectors
made a public voluntary commitment to achieve an
average energy intensity improvement of 1 percent per
year for the years 1990 to 2005.
A COST-EFFECTIVE RESOURCE
Although CIPEC is proud of its success, work remains to
be done. In recent years, advances in energy efficiency have
become more difficult to achieve, and the improvement
curve has flattened. Despite this trend, opportunities
remain for CIPEC and its members. To capitalize on these
opportunities, additional resources are needed to enable
CIPEC to engage a wider circle of organizations, broaden
the reach of its highly effective energy management
programs, and lead a resurgence of energy efficiency
activity throughout Canada’s industrial sectors.
We were encouraged to see that the federal government’s
2005 budget announced expanded energy efficiency
funding. Tax incentives such as capital cost allowances for
efficient cogeneration and renewable energy, wind power
production incentives, and Partnership Fund and Climate
Fund spending will all help industry move toward energy
efficiency and the reduction of greenhouse gas emissions.
It is a good start that must be reinforced and strengthened
in the years to come.
CIPEC is an efficient and cost-effective organization.
This is readily evident when you compare the money
spent on the program with the energy efficiency gains
made by participating industries and companies.
Additional investments will enable CIPEC to broaden its
positive impact on energy efficiency within Canadian
industry, extend its reach to small and medium-sized
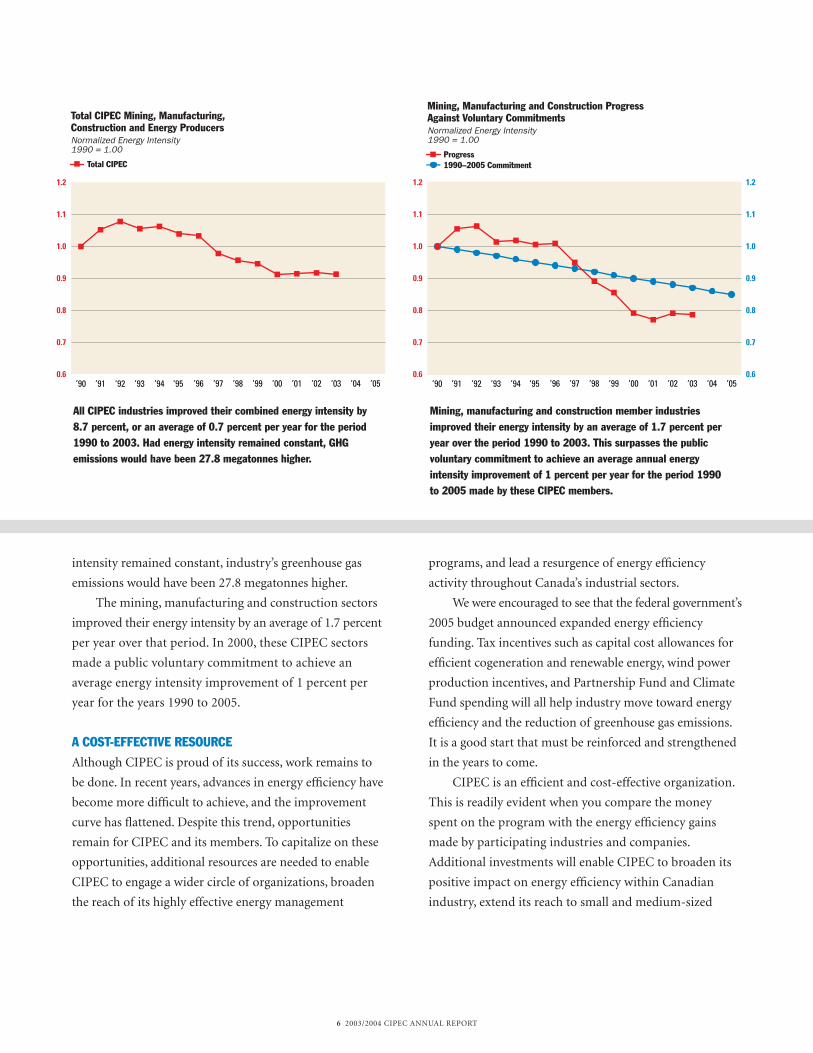
Total CIPEC Mining, Manufacturing, Construction and Energy ProducersNormalized Energy Intensity1990 = 1.00
Total CIPEC
0.6
0.7
0.8
0.9
1.0
1.1
1.2
’05’04’03’02’01’00’99’98’97’96’95’94’93’92’91’90
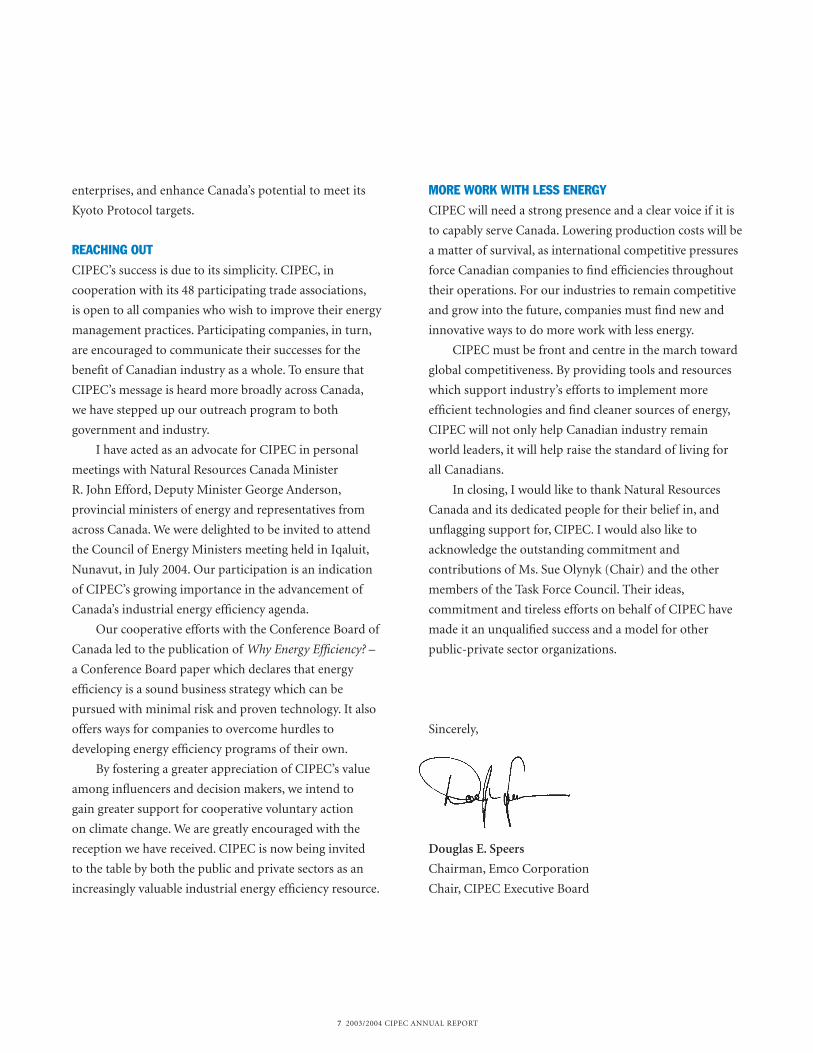
Mining, Manufacturing and Construction Progress Against Voluntary CommitmentsNormalized Energy Intensity1990 = 1.00
Progress 1990–2005 Commitment
’05’04’03’02’01’00’99’98’97’96’95’94’93’92’91’900.6
0.7
0.8
0.9
1.0
1.1
1.2
0.6
0.7
0.8
0.9
1.0
1.1
1.2
All CIPEC industries improved their combined energy intensity by8.7 percent, or an average of 0.7 percent per year for the period1990 to 2003. Had energy intensity remained constant, GHGemissions would have been 27.8 megatonnes higher.
Mining, manufacturing and construction member industriesimproved their energy intensity by an average of 1.7 percent peryear over the period 1990 to 2003. This surpasses the publicvoluntary commitment to achieve an average annual energyintensity improvement of 1 percent per year for the period 1990 to 2005 made by these CIPEC members.
7 2003/2004 CIPEC ANNUAL REPORT
enterprises, and enhance Canada’s potential to meet its
Kyoto Protocol targets.
REACHING OUT
CIPEC’s success is due to its simplicity. CIPEC, in
cooperation with its 48 participating trade associations,
is open to all companies who wish to improve their energy
management practices. Participating companies, in turn,
are encouraged to communicate their successes for the
benefit of Canadian industry as a whole. To ensure that
CIPEC’s message is heard more broadly across Canada,
we have stepped up our outreach program to both
government and industry.
I have acted as an advocate for CIPEC in personal
meetings with Natural Resources Canada Minister
R. John Efford, Deputy Minister George Anderson,
provincial ministers of energy and representatives from
across Canada. We were delighted to be invited to attend
the Council of Energy Ministers meeting held in Iqaluit,
Nunavut, in July 2004. Our participation is an indication
of CIPEC’s growing importance in the advancement of
Canada’s industrial energy efficiency agenda.
Our cooperative efforts with the Conference Board of
Canada led to the publication of Why Energy Efficiency? –
a Conference Board paper which declares that energy
efficiency is a sound business strategy which can be
pursued with minimal risk and proven technology. It also
offers ways for companies to overcome hurdles to
developing energy efficiency programs of their own.
By fostering a greater appreciation of CIPEC’s value
among influencers and decision makers, we intend to
gain greater support for cooperative voluntary action
on climate change. We are greatly encouraged with the
reception we have received. CIPEC is now being invited
to the table by both the public and private sectors as an
increasingly valuable industrial energy efficiency resource.
MORE WORK WITH LESS ENERGY
CIPEC will need a strong presence and a clear voice if it is
to capably serve Canada. Lowering production costs will be
a matter of survival, as international competitive pressures
force Canadian companies to find efficiencies throughout
their operations. For our industries to remain competitive
and grow into the future, companies must find new and
innovative ways to do more work with less energy.
CIPEC must be front and centre in the march toward
global competitiveness. By providing tools and resources
which support industry’s efforts to implement more
efficient technologies and find cleaner sources of energy,
CIPEC will not only help Canadian industry remain
world leaders, it will help raise the standard of living for
all Canadians.
In closing, I would like to thank Natural Resources
Canada and its dedicated people for their belief in, and
unflagging support for, CIPEC. I would also like to
acknowledge the outstanding commitment and
contributions of Ms. Sue Olynyk (Chair) and the other
members of the Task Force Council. Their ideas,
commitment and tireless efforts on behalf of CIPEC have
made it an unqualified success and a model for other
public-private sector organizations.
Sincerely,
Douglas E. Speers
Chairman, Emco Corporation
Chair, CIPEC Executive Board
8 2003/2004 CIPEC ANNUAL REPORT
1973 / OPEC OIL CRISIS
1974 / OFFICE OF ENERGY CONSERVATIONThe Government of Canada establishes theOffice of Energy Conservation to developand recommend a program of energyconservation. The price of oil increases toalmost 2.5 times the 1973 level.
1975 / BIRTH OF CIPECThe Government of Canada and 50 seniorindustry executives meet to deal with theenergy crisis – effectively the beginning of CIPEC.
1976 / GOVERNMENT ANDINDUSTRY FORM PARTNERSHIPEstablishment of the Canadian IndustryEnergy Conservation Task Forces,a voluntary sector-level partnershipbetween industry and the federalgovernment. Initially there were 10 sectortask forces. An energy efficiency goal ofa 12 percent improvement by 1980, with1973 as base year, is established.
1978 / INTERNATIONAL RECOGNITIONCanada’s voluntary Industrial EnergyConservation Program is cited by theInternational Energy Agency as “worthy ofemulation by other member countries.”
1979 / GOAL SURPASSEDParticipating industries meet and exceedthe initial 1976 energy efficiency goal,one year ahead of schedule.
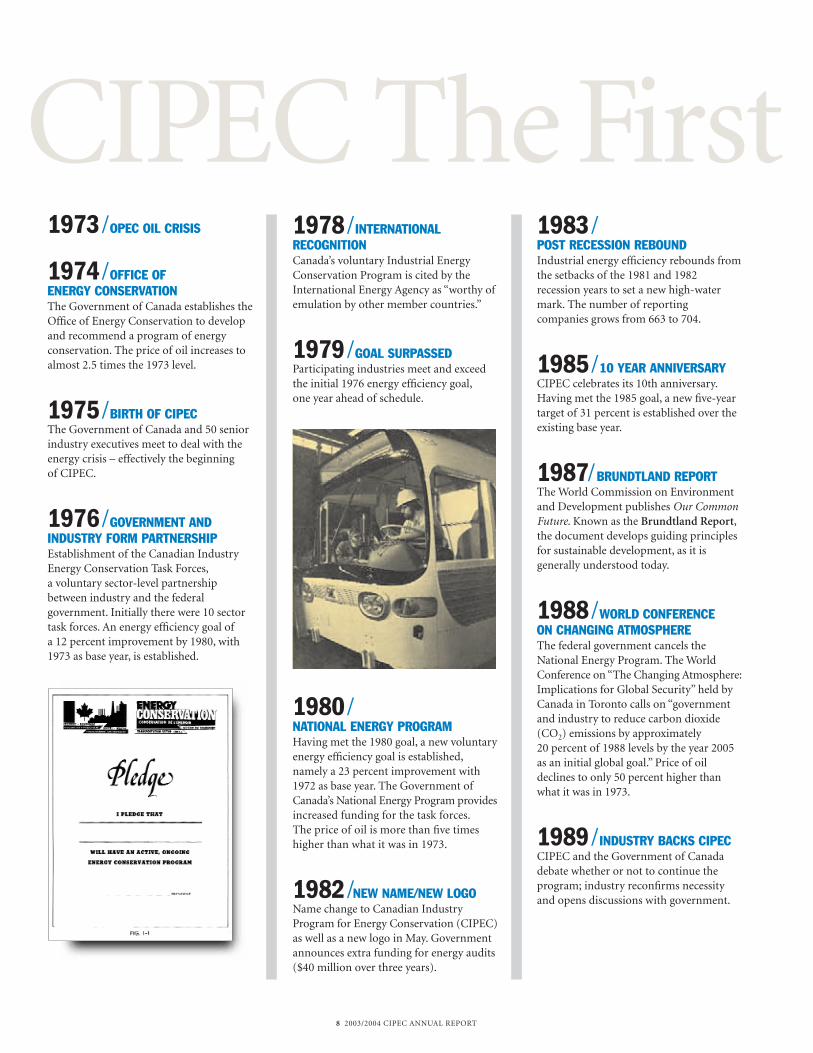
1980 / NATIONAL ENERGY PROGRAMHaving met the 1980 goal, a new voluntaryenergy efficiency goal is established,namely a 23 percent improvement with1972 as base year. The Government ofCanada’s National Energy Program providesincreased funding for the task forces.The price of oil is more than five timeshigher than what it was in 1973.
1982 /NEW NAME/NEW LOGOName change to Canadian IndustryProgram for Energy Conservation (CIPEC)as well as a new logo in May. Governmentannounces extra funding for energy audits($40 million over three years).
1983 / POST RECESSION REBOUNDIndustrial energy efficiency rebounds fromthe setbacks of the 1981 and 1982recession years to set a new high-watermark. The number of reportingcompanies grows from 663 to 704.
1985 / 10 YEAR ANNIVERSARYCIPEC celebrates its 10th anniversary.Having met the 1985 goal, a new five-yeartarget of 31 percent is established over theexisting base year.
1987/BRUNDTLAND REPORTThe World Commission on Environmentand Development publishes Our CommonFuture. Known as the Brundtland Report,the document develops guiding principlesfor sustainable development, as it isgenerally understood today.
1988 / WORLD CONFERENCE ON CHANGING ATMOSPHEREThe federal government cancels theNational Energy Program. The WorldConference on “The Changing Atmosphere:Implications for Global Security” held byCanada in Toronto calls on “governmentand industry to reduce carbon dioxide(CO2) emissions by approximately 20 percent of 1988 levels by the year 2005as an initial global goal.” Price of oildeclines to only 50 percent higher thanwhat it was in 1973.
1989 / INDUSTRY BACKS CIPECCIPEC and the Government of Canadadebate whether or not to continue theprogram; industry reconfirms necessityand opens discussions with government.
CIPEC TheFirst
1990 / THE GREEN PLANGovernment of Canada’s Green Plan for a Healthy Environment renews interest in CIPEC and provides a focus for a renewed voluntary industry-government partnership.
1991 / CIPEC RETOOLSThe industry and the government plan anew organization that includes sector taskforces, a task force council and, for the firsttime, an executive board to provide top-down leadership as well as advice to theMinister of Energy, Mines and Resourceson industrial energy efficiency matters.
1992/ CANADA SIGNS THE RIO ACCORDCanada signs the Rio Accord, committingto stabilizing greenhouse gas (GHG)emissions at 1990 levels by the year 2000.The new CIPEC is officially launched witha new mission statement that combinesenhancing efficiency and economicperformance with meeting Canada’semission objectives.
1994 / CO2 STABILIZATIONCIPEC commits to achieving “industrialCO2 stabilization at 1990 levels by the year2000, on the assumption of an annualindustrial growth rate of no more than 2.0 percent.” Development of new datatracking and reporting process underthe auspices of Statistics Canada and theCanadian Industrial Energy End-UseData and Analysis Centre (CIEEDAC).
1995 / DEBUT OF INDUSTRIALENERGY INNOVATORSOfficial launch of Industrial EnergyInnovators (IEI) and Canada’s ClimateChange Voluntary Challenge and RegistryInc. By December, 178 companies have madea voluntary commitment to implement,review and report on energy efficiencymeasures. CIPEC participation nowincludes 15 industrial trade associations.
1997/ KYOTO PROTOCOL SIGNEDCanada signs the Kyoto Protocol,committing to reducing GHG emissions to 6 percent below 1990 levels. Launch oftwice-a-month newsletter, Heads UpCIPEC. The first issue goes to 55 readers.
1998 / CHARTING A COURSE ON CLIMATE CHANGECIPEC participates in the Climate ChangeIndustry Issue Table process to help theGovernment of Canada develop a climate-change response. The price of oil declinesto approximately 1973 levels.
1999 / GHG EMISSIONS STABILIZEDCIPEC reports that energy-use-relatedGHG emissions are at 1.9 percent below1990 levels, while total energy saved since1990 represents 73 percent of Canada’sresidential heating demand in 1998.
2001 / ENERGY PRODUCERS JOIN CIPECThe CIPEC network expands to includeenergy producers. The Government of Canada Action Plan 2000 on ClimateChange supports new tools and services,including energy audits, sectorbenchmarking and best-practices guides.Forty-five trade associations representingmore than 5000 companies and 95 percentof secondary industrial energy demand arenow involved in CIPEC.
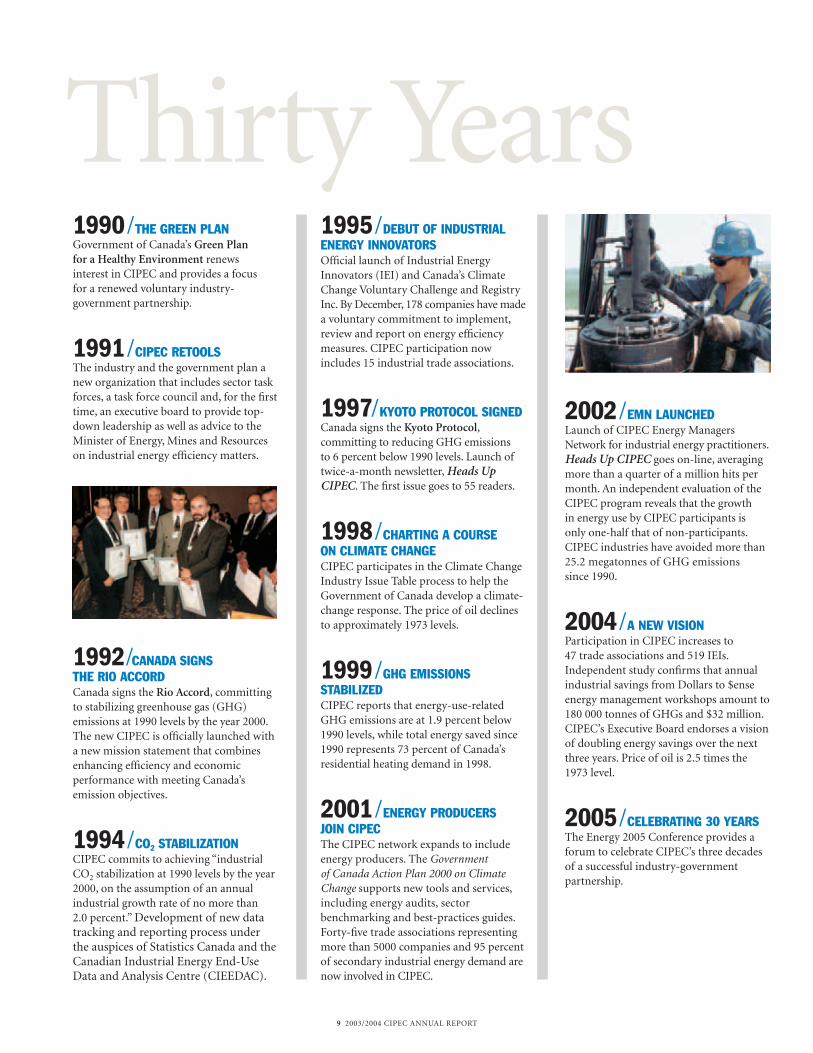
2002 / EMN LAUNCHEDLaunch of CIPEC Energy ManagersNetwork for industrial energy practitioners.Heads Up CIPEC goes on-line, averagingmore than a quarter of a million hits permonth. An independent evaluation of theCIPEC program reveals that the growth in energy use by CIPEC participants is only one-half that of non-participants.CIPEC industries have avoided more than25.2 megatonnes of GHG emissions since 1990.
2004 / A NEW VISIONParticipation in CIPEC increases to 47 trade associations and 519 IEIs.Independent study confirms that annualindustrial savings from Dollars to $enseenergy management workshops amount to180 000 tonnes of GHGs and $32 million.CIPEC’s Executive Board endorses a visionof doubling energy savings over the nextthree years. Price of oil is 2.5 times the1973 level.
2005 / CELEBRATING 30 YEARSThe Energy 2005 Conference provides aforum to celebrate CIPEC’s three decadesof a successful industry-governmentpartnership.
Thirty Years
9 2003/2004 CIPEC ANNUAL REPORT
10 2004/2005 CIPEC ANNUAL REPORT
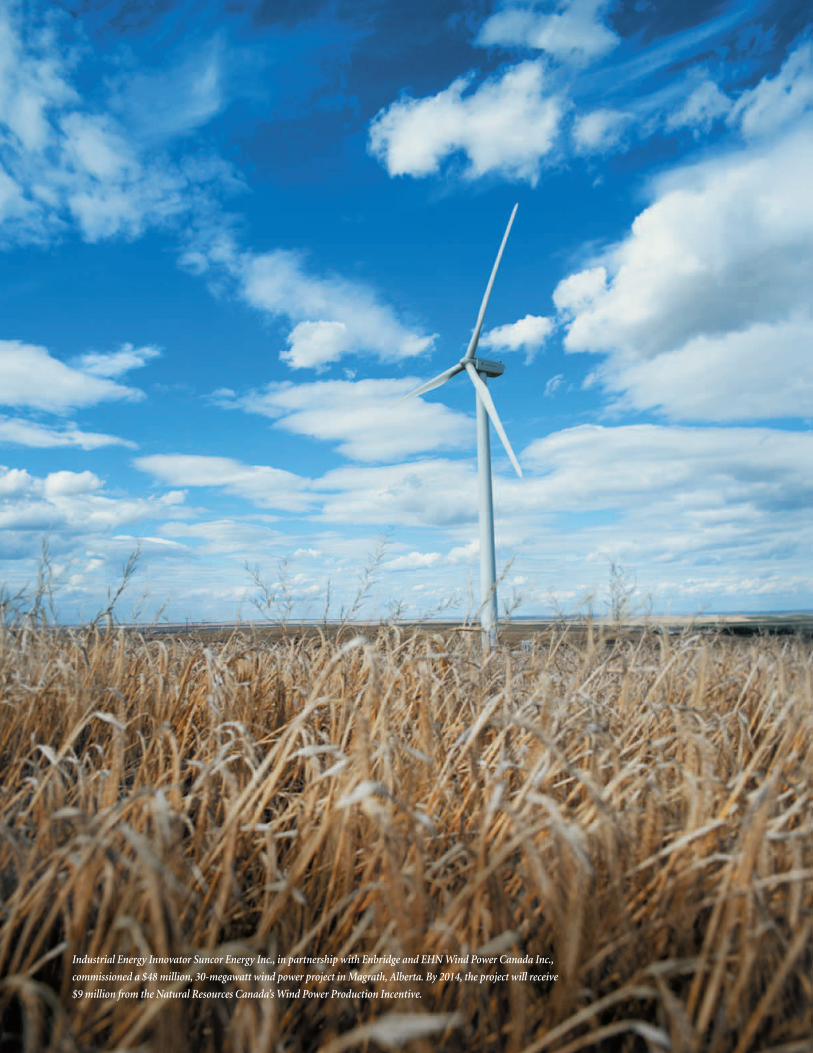
Industrial Energy Innovator Suncor Energy Inc., in partnership with Enbridge and EHN Wind Power Canada Inc.,
commissioned a $48 million, 30-megawatt wind power project in Magrath, Alberta. By 2014, the project will receive
$9 million from the Natural Resources Canada’s Wind Power Production Incentive.

11 2003/2004 CIPEC ANNUAL REPORT
Vision

12 2003/2004 CIPEC ANNUAL REPORT
PARALLEL INTERESTS CONVERGE
In the early 1970s, an unprecedented, worldwide
interruption of oil production, accompanied by rapidly
escalating prices, threw the world economy into turmoil.
Seeking to give Canada greater control over its energy
policy, the Government of Canada launched consultations
with industry to identify ways Canada could improve its
energy efficiency.
Government and industry came to the table with
different perspectives on energy efficiency. The federal
government believed that if Canada was to maintain a
secure supply of energy, it was essential to reduce the
country’s dependency on foreign oil. Projecting energy
demand into the future, it feared that unless demand growth
was curbed, energy costs would total more than $20,000 per
family by 1985. It saw energy efficiency as a key element in
its efforts to thwart this trend and reduce oil imports.
Canadian industry also feared the impact of runaway
energy prices and insecure oil supplies. Rising oil prices
made business planning more complex, and had the
potential to weaken markets and undermine competitiveness.
Industry foresaw that more efficient use of energy had the
potential to reduce uncertainty, enhance competitiveness
and improve the bottom line.
Both parties realized that continuing on the previous
path of rapidly escalating energy consumption was not
an option.
THE CIPEC SOLUTION
Out of these government/industry consultations, the
Canadian Industry Program for Energy Conservation
(CIPEC) was born. Originally named the Canadian
Industry Energy Conservation Task Forces, CIPEC was
established as a voluntary partnership between the federal
government and the private sector. This relationship was
possible because, while the reasons the parties sought
energy efficiency differed, the goal was the same: to
reduce energy consumption in Canada.
From the beginning, the roles were clear: government
would provide tools, support and a policy framework,
and industry would seek out and implement energy
efficiency measures. Industry would set targets and collect
energy data, thereby enabling performance to be tracked
and progress reported.
ago as the embodiment of a unique vision: a voluntary partnership betweengovernment and business to champion industrial energy efficiency. From its inception in 1975, CIPEC’s mission has been driven by people, companiesand associations who have passionately advanced Canada’s sustainabledevelopment agenda.
CIPEC was created three decades

13 2003/2004 CIPEC ANNUAL REPORT
A committed focus on continuous improvement is the driving force behind energy efficiency efforts at GoodyearCanada’s Napanee, Ontario, tire manufacturing facility. This focus has resulted in a reduction in energyconsumption and associated greenhouse gas (GHG) emissions per pound of product of 20 percent over the pastfive years. Goodyear attributes much of its success to an increase in overall energy awareness. Every teammember at the Napanee facility understands their role in the challenge to improve energy efficiency, whether it isby identifying energy savings opportunities or through direct involvement in energy management projects.
In 2003–2004, Goodyear Canada’s Napanee operations completed projects that produced a 5 percentreduction in energy use per pound of product. Initiatives included lighting optimization, a 30 percent reduction incompressed air use, and the use of renewable solar energy captured and distributed through a Solarwall®.Mounted on the facility’s south wall for optimal exposure to the sun, the Solarwall’s dark-coloured aluminumcladding absorbs solar energy, then transfers heat to cool external air as it is drawn through holes in the cladding.The warm air is then distributed throughout the warehouse, reducing the need for fossil-fuel-generated heat. Thecompany achieves additional energy savings by recapturing heat lost through the building wall and by reducing airstratification and exhaust heat loss.
Improving energy efficiency is an integral part of Goodyear’s overall business strategy to remain competitive in a global market. The company continues to strive for improved energy use, and has set a reduction target of anadditional 4 percent in 2005.
Photo courtesy of Goodyear
Continuous Improvement Drives Energy Efficiency at
Goodyear
14 2003/2004 CIPEC ANNUAL REPORT
Speaking to the first Government and Industry
Energy Conservation Conference on May 23, 1975, Energy,
Mines and Resources Minister Donald S. MacDonald
described the relationship simply: “We feel that we can
pool our talents and thereby help each other.”
THE EVOLUTION OF A UNIQUE PARTNERSHIP
Thanks to the convergence of interests, CIPEC became
a nearly instant success. By the end of 1979, companies
participating in CIPEC represented 80 percent of Canada’s
industrial energy consumption. In the first four years of
the program, these organizations exceeded CIPEC’s 1980
target of a 12 percent improvement in energy efficiency
a full year ahead of schedule. In his 1979 annual report
introductory letter to Energy, Mines and Resources
Minister Marc Lalonde, Task Force Coordinating
Committee Chair C. A. Wolf, Jr. of Union Carbide Canada
Inc. proclaimed, “The achievements to date demonstrate
that, with candid co-operation between industry and
government, industry is aggressively practising energy
conservation on a voluntary basis.”
In CIPEC’s first decade, participants focused on the
conservation of crude oil, reducing oil consumption from
32 percent of the total Canadian energy mix to 17.5 percent.
Companies furthered energy management by improving
process design, applying “just-in-time” manufacturing
strategies, adopting CAD/CAM and robotics technologies,
and introducing computer-integrated manufacturing
systems. These activities were enhanced by substituting
fuels and materials, implementing energy conservation
practices, and developing employee awareness programs.
During the recession of 1982–1983, companies shifted
their energy management activities to the shop floor, further
enhancing energy efficiency through closer monitoring
and control of processes, and the adoption of higher
production and maintenance standards. By the mid-1980s,
companies in a number of industries found advantages in
recovering waste products for use as sources of energy.
As CIPEC companies continued to refine their energy
efficiency programs through the late 1980s and early
1990s, government and industry officials were taking
a hard look at CIPEC. Although the partnership had
served both sides well since the mid-1970s, the cancellation
of the National Energy Program in 1988, and a shift
in Canada’s energy policy priorities, caused high-level
CIPEC and government officials to question the
organization’s relevance.
However, Canada’s 1990 Green Plan for a Healthy
Environment sparked a renewed interest in CIPEC and
generated support for the voluntary program. CIPEC was
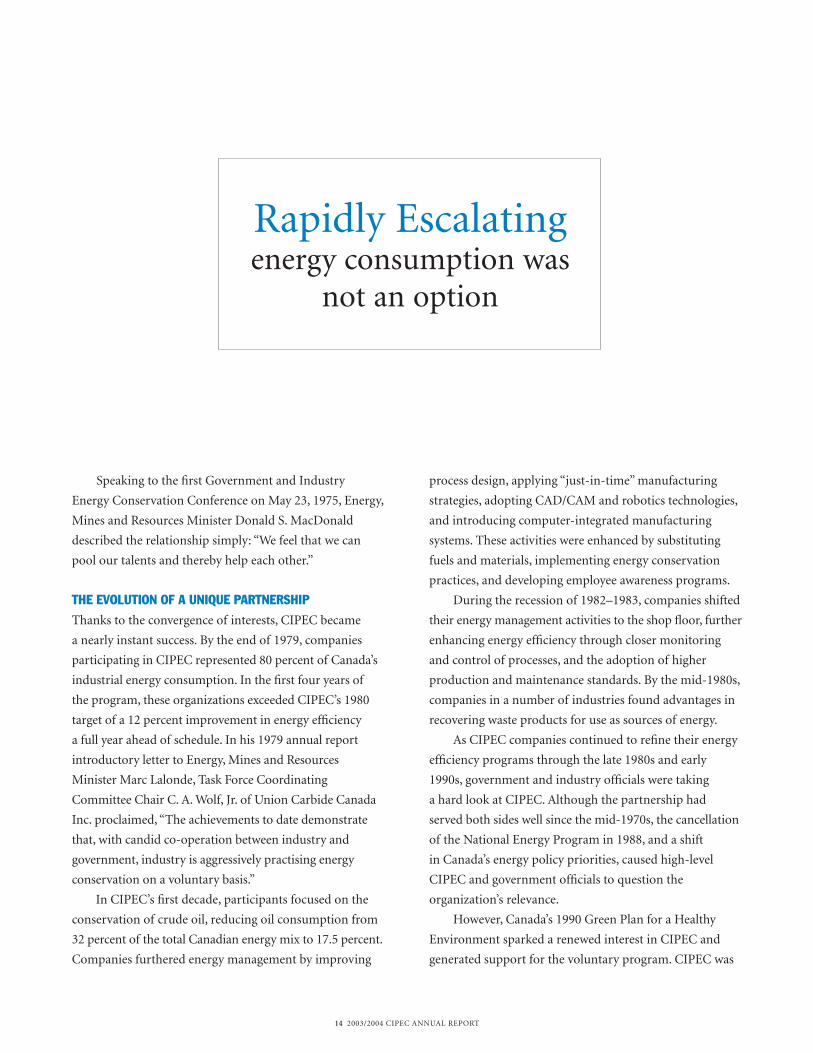
Rapidly Escalatingenergy consumption was
not an option

15 2003/2004 CIPEC ANNUAL REPORT
Two ammonia refrigeration systems cooling and freezing 16 million kilograms of meat each yearat the Maple Leaf Consumer Foods plant in Winnipeg, Manitoba, take a lot of energy. The plant’sprincipal refrigeration system consists of nine compressors totalling 2450 horsepower andeight condensers with a combined capacity of 285 horsepower. To reduce its power use, theplant decided to reduce energy waste by employing an energy-efficient heat recovery system.
The company installed a heat exchanger to recover waste heat from the hot gas dischargedby the compressors, which constantly operate at full load and provide a steady source of heat.The recovered heat is used to reduce steam drawn from the boiler for process water heating.Through heat recovery alone, the company saves enough energy annually to heat 165 Manitobahomes. Maple Leaf Foods Inc. estimates that, based on a 20-year life span for the heatexchanger system, the total equivalent carbon dioxide reduction will be 13 000 tonnes, theequivalent to removing 3300 mid-sized cars from the road for one year. The payback period onthe company’s investment in the project is less than two years.
Heat Recovery Saves Energy at Maple Leaf Foods

16 2003/2004 CIPEC ANNUAL REPORT
Collaborative Approach Weaves Energy Program at
Doubletex With the help of the expertise and resources available through Natural Resources Canada(NRCan), the Canadian Textiles Institute and the CIPEC Energy Managers Network, Doubletexof Montréal, Quebec, is making notable progress in improving its energy efficiency.
Following a plant restructuring, Doubletex conducted a thorough heat and mass balancestudy with NRCan’s help. The study identified a number of measures which, when combined,will save several thousand dollars in wasted energy.
The company is working on projects to capture and reuse vented steam energy from itsboilers, and to use excess hot water recovered from effluent to preheat cold process waterto a constant 27°C. Doubletex is also refurbishing its SOFAME hybrid water heater to enableit to operate solely on heat captured from boiler exhaust, and is evaluating an opportunity to save natural gas by the use of an off-peak electric alternative boiler which would bring theutilization factor for hydro from a meagre 52 percent to about 90 percent. To ensure that it continues to receive the benefits of its energy efficiency programs, the company monitors its daily natural gas and electricity consumption to help it quickly find and correct energywasting malfunctions.

17 2003/2004 CIPEC ANNUAL REPORT
refocused, and its mission statement revised to reflect a
combined focus on energy efficiency, economic performance
and climate change. By 1992, CIPEC was a reinvigorated
organization that included sector task forces, a task force
council and an executive board to provide top-down
leadership as well as advise the Minister of Energy, Mines
and Resources on industrial energy efficiency matters.
Throughout the 1990s, momentum for industrial
energy efficiency continued to build with the unfolding of
Canada’s climate change agenda. CIPEC expanded its
relationship with Canadian industry by encouraging
individual companies to seek win-win solutions – boosting
profit margins and reducing GHG emissions through
effective energy management.
To assist, Natural Resources Canada (NRCan) created the
Industrial Energy Innovators (IEI) initiative in 1995. Closely
aligned with Canada’s Climate Change Voluntary Challenge
and Registry Inc. (VCR Inc.), IEI engaged companies to
voluntarily commit to improving energy efficiency. In
return, companies received enhanced tools, support and
services to meet their energy management objectives.
The Kyoto Protocol to the United Nations Framework
Convention on Climate Change, negotiated in 1997, raised
Canada’s obligation to mitigate climate change. Canada’s
commitments on the world stage sparked a renewed
interest in industrial energy efficiency on the domestic front.
After an extensive consultation process, the Government
of Canada doubled its financial commitment to the
partnership under its Action Plan 2000 on Climate Change.
This increased commitment has provided the means
to expand the program to include the upstream oil and gas
and electricity generating sectors. It further paved the way
for the program to enhance its outreach capabilities and
bring new players to the table.
POWERED BY VISION
The energy efficiency agenda within Canadian industry
has been propelled by people and organizations of vision.
For example, Husky Injection Molding Systems Ltd.
founder Robert Schad made sustainability the cornerstone
of his company’s business philosophy. Husky incorporates
environmental considerations into the design of every
operating system and building plan. Equipment is
purchased and facilities are built to maximize energy
efficiency and minimize greenhouse gas emissions.
Business systems and practices are designed to reduce
travel and shrink the company’s environmental footprint.
In one recent venture, Husky has partnered with the
Moose Deer Point First Nation, located in Ontario, to
establish a model sustainable community. The community
includes a 15-machine injection moulding plant which
generates a large portion of its power requirements using
propane-powered fuel cell technology. The fuel cells use
hydrogen from propane and oxygen from the air to
produce electricity, water and useful heat. By using waste
heat from the fuel cells and implementing the latest
energy-efficient technologies, non-process purchased
energy will be reduced by 72 percent.
At INVISTA (formerly DuPont Canada Inc.) energy
manager and CIPEC champion Peter Chantraine (now
retired) foresaw that to continue making significant gains,
the company would need to find new ways to finance its
energy efficiency investments. He steered the company
toward energy performance contracting, a concept used
extensively in government, but rarely employed in the
private sector. Performance contracting enables
organizations to arrange outside financing for projects
which improve energy efficiency, and pay back the
financing with the savings generated.
Industrial Energy Innovator Bombardier Aerospace’s plant in Downsview,
Toronto, Ontario, is saving $120,000 a year on electricity bills by
upgrading to new energy-efficient air compressors. The payback period
for new equipment is 1.5 years.

18 2003/2004 CIPEC ANNUAL REPORT
Mr. Chantraine and his team began with a model used
in the Government of Canada’s Federal Buildings Initiative,
modifying it to meet the needs of an industrial application.
Finalized in 1999, after two years of negotiation, the energy
performance contract mechanism provided management
with a powerful energy management tool at its facilities in
Kingston and Maitland, Ontario. The initial projects
implemented under this financing strategy are projected
to cut INVISTA’s direct GHG emissions by a total of nearly
75 000 tonnes per year, and reduce the company’s energy
use by about 10 percent.
Interface Flooring Systems (Canada), Inc. of Belleville,
Ontario, takes sustainability one step further: it seeks to
become a net contributor to the environment. The company
thinks outside of the box to develop sources of “green”
energy and minimize energy consumption, and to control
the environmental impact of its products throughout their
life cycle. Interface’s commitment to sustainability is
driving it to invest in new technologies, seek out and adopt
innovative concepts and continuously upgrade practices to
improve its environmental performance.
Industry associations, too, are developing bold energy
efficiency strategies for their sectors. For example, the
Mining Association of Canada (MAC) is a world leader in
the development and promotion of energy efficiency
within its member companies.
MAC monitors energy and environmental performance
and encourages mining companies to continuously improve
energy efficiency through involvement with CIPEC and
the former VCR Inc. To help its members, MAC has
published “Strategic Planning and Action on Climate
Change,” with the help of the Pembina Institute, Stratos
Inc. and NRCan’s Office of Energy Efficiency. The guide
was prepared to help the mining industry devise climate
change principles and strategies that support long-term
GHG reduction efforts.
30 YEARS LATER, REMARKABLY RELEVANT
Despite its age, and the sea of change around it, CIPEC’s
mandate, and the symbiotic relationship it represents,
remains remarkably relevant. Globalization, the explosion
of new technologies, the ongoing transition to an
information economy and other economic and social
trends have served to strengthen CIPEC’s foundations.
Now celebrating its 30th anniversary, CIPEC continues to
set the standards for voluntary public/private sector joint
ventures, serving as a model for other such ventures
around the world.
Industry associations are developing
bold energy efficiencyStrategies

19 2003/2004 CIPEC ANNUAL REPORT
An investment in Big Foot heating systems at its Oakville, Ontario, assembly site has helped FordMotor Company of Canada, Limited record a substantial decrease in energy consumption. Ford installed a total of 13 gas-fired Big Foot rooftop units, each with a large air house containingtwo 100-horsepower fans, creating new ductless heating and ventilation systems. The project hasgenerated significant energy cost savings and lowered GHG emissions. Combined with other energy efficiency initiatives, Ford has reduced energy consumption by 23 percent since its 1995baseline year and eliminated more than 24 000 tonnes of carbon dioxide (CO2) emissions annually. The company is on target to reduce its energy consumption per unit of production by 1 percentevery year between 1995 and 2005, and Ford hopes to achieve a 24 percent reduction in GHGemissions intensity over the same period.
Big Foot Heaters ReduceEnvironmental Footprint for
Ford Motor Company of Canada
20 2004/2005 CIPEC ANNUAL REPORT
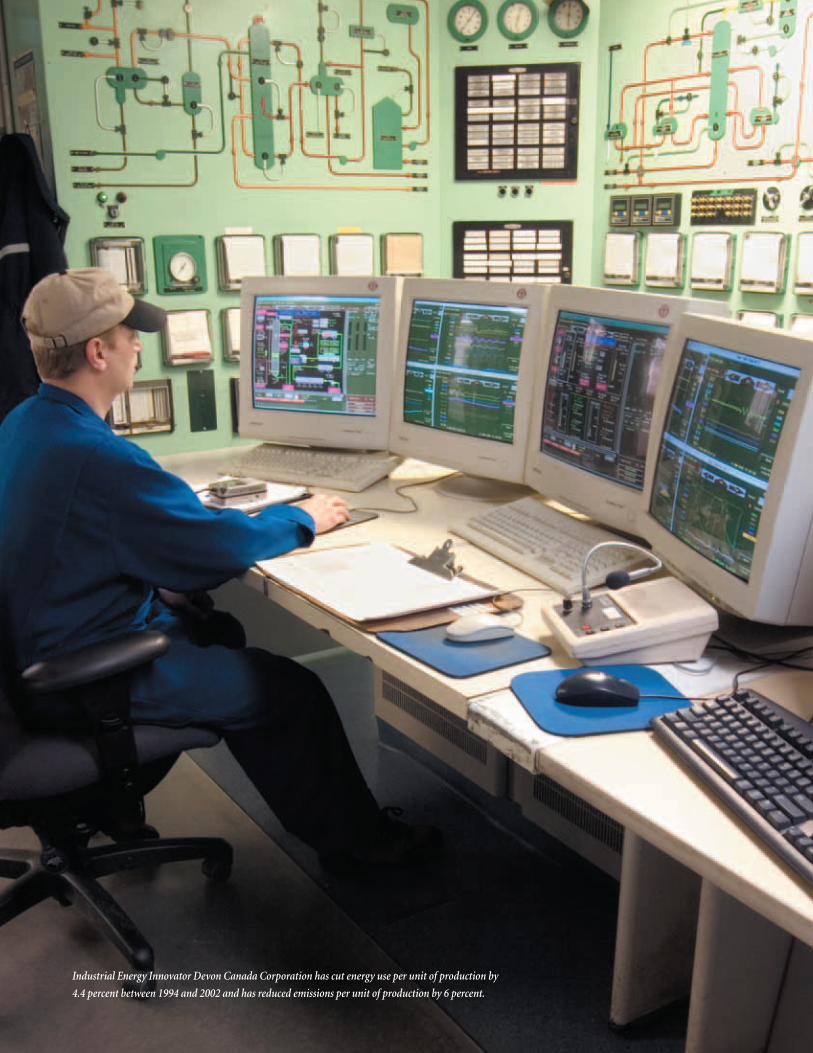
Industrial Energy Innovator Devon Canada Corporation has cut energy use per unit of production by
4.4 percent between 1994 and 2002 and has reduced emissions per unit of production by 6 percent.

21 2003/2004 CIPEC ANNUAL REPORT
Action

practices information and provide them with contextual
information to take steps to elevate their performance.
Energy audits, which uncover energy waste and identify
efficiency opportunities, provide companies with specific
“nuts and bolts” information related to improving the
energy efficiency of their own operations. And publications,
from sectoral energy guides to financial planning,
management and benchmarking guides, provide practical
information on establishing and operating effective energy
management programs.
INNOVATION IN ACTION
Drawing on these resources, and the knowledge, experience
and support of other companies, Canada’s industrial
organizations continue to move ahead by adopting
renewable energy technologies, re-engineering processes
and formalizing energy management systems.
CIPEC was designed to promote and support action.
CIPEC leaders have consistently understood that progress
depends on a clear process: assess where you are, target
where you are going, track results, report on progress and
celebrate success.
From the beginning, the organization’s goal was
to strengthen all steps in this process by connecting
industry with practical knowledge about energy-efficient
technologies, best practices and innovative concepts.
It was established as a conduit for ideas, information,
resources and networking among organizations committed
to energy efficiency.
CIPEC workshops, for example, have brought hundreds
of industrial energy practitioners useful information to
help implement, improve and monitor their energy
efficiency programs. Benchmarking studies, conducted
jointly with sector associations, bring industrial users best
emerges from the willingness of its public and private sector partners to back the pursuit of energy efficiency with ideas, resources andcommitment. Collectively, their actions have created new standards for energy management in Canada.
CIPEC’s ever-growing success
22 2003/2004 CIPEC ANNUAL REPORT
Rubbermaid Canada’s Calgary plant gets organized on energy savings.
The Industrial Energy Innovator took advantage of Natural Resources
Canada’s Industrial Energy Audit Incentive and identified approximately
$155,000 in estimated annual savings with an overall payback period
of 1.2 years.
23 2003/2004 CIPEC ANNUAL REPORT
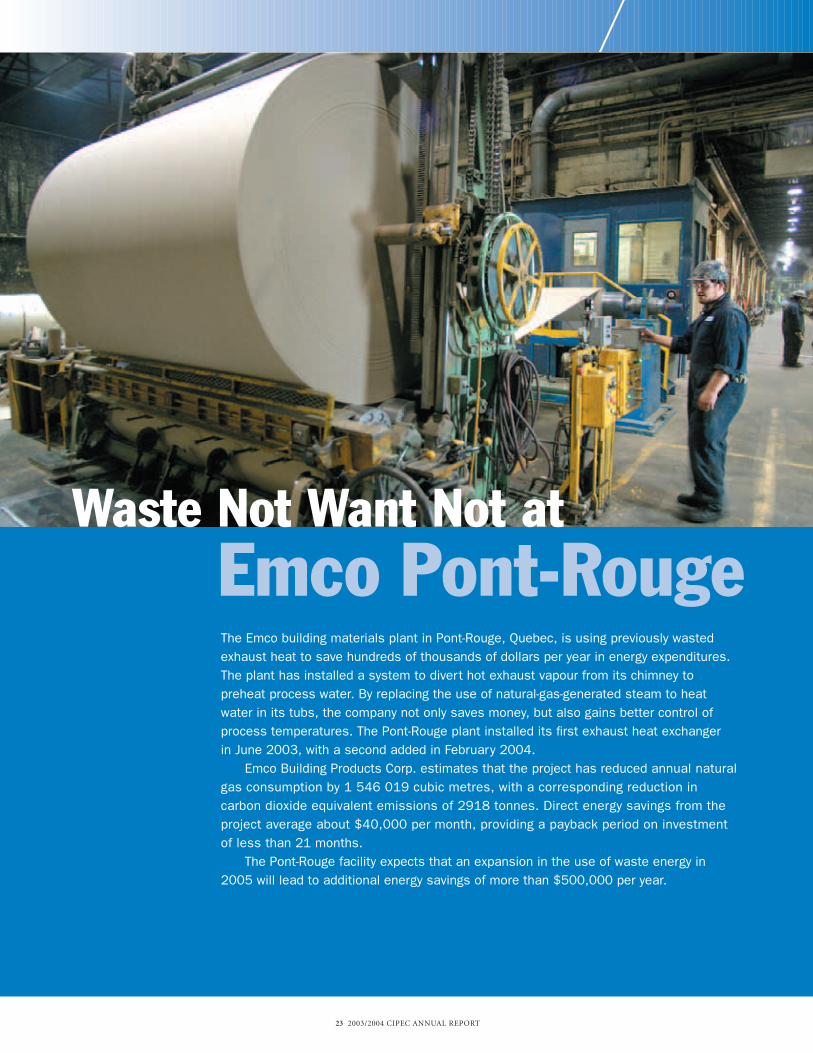
The Emco building materials plant in Pont-Rouge, Quebec, is using previously wastedexhaust heat to save hundreds of thousands of dollars per year in energy expenditures.The plant has installed a system to divert hot exhaust vapour from its chimney topreheat process water. By replacing the use of natural-gas-generated steam to heatwater in its tubs, the company not only saves money, but also gains better control ofprocess temperatures. The Pont-Rouge plant installed its first exhaust heat exchanger in June 2003, with a second added in February 2004.
Emco Building Products Corp. estimates that the project has reduced annual naturalgas consumption by 1 546 019 cubic metres, with a corresponding reduction incarbon dioxide equivalent emissions of 2918 tonnes. Direct energy savings from theproject average about $40,000 per month, providing a payback period on investmentof less than 21 months.
The Pont-Rouge facility expects that an expansion in the use of waste energy in2005 will lead to additional energy savings of more than $500,000 per year.
Waste Not Want Not at Emco Pont-Rouge

24 2003/2004 CIPEC ANNUAL REPORT
At the end of 2001, facing an expected increase in electricity costs due to deregulation, Atwood Cheese Companyof Atwood, Ontario, decided to look for ways to reduce plant energy consumption. Preliminary tests indicated thatthe installation of an ElectroFlow integrated power conditioning system could save Atwood about 5 percent inelectricity costs, while providing additional operating benefits.
Since installing the system at the beginning of 2002, the results have been impressive. The company’sannual electricity demand dropped by 7.8 percent in 2002, while its power factor increased to 94.7 percent – an improvement of nearly 2 percent. Kilowatt hours (kWh) consumed, when adjusted to reflect the previous year’shours of operation, fell by 6.8 percent.
Besides improving electricity consumption efficiency, ElectroFlow enhances power quality throughout the plant,protects equipment, prolongs operating life, reduces downtime and cuts maintenance. It’s a winning combinationof energy efficiency and operating savings with an investment payback period of just two years.
Going with the Flow ElectrifiesAtwood CheeseCompany
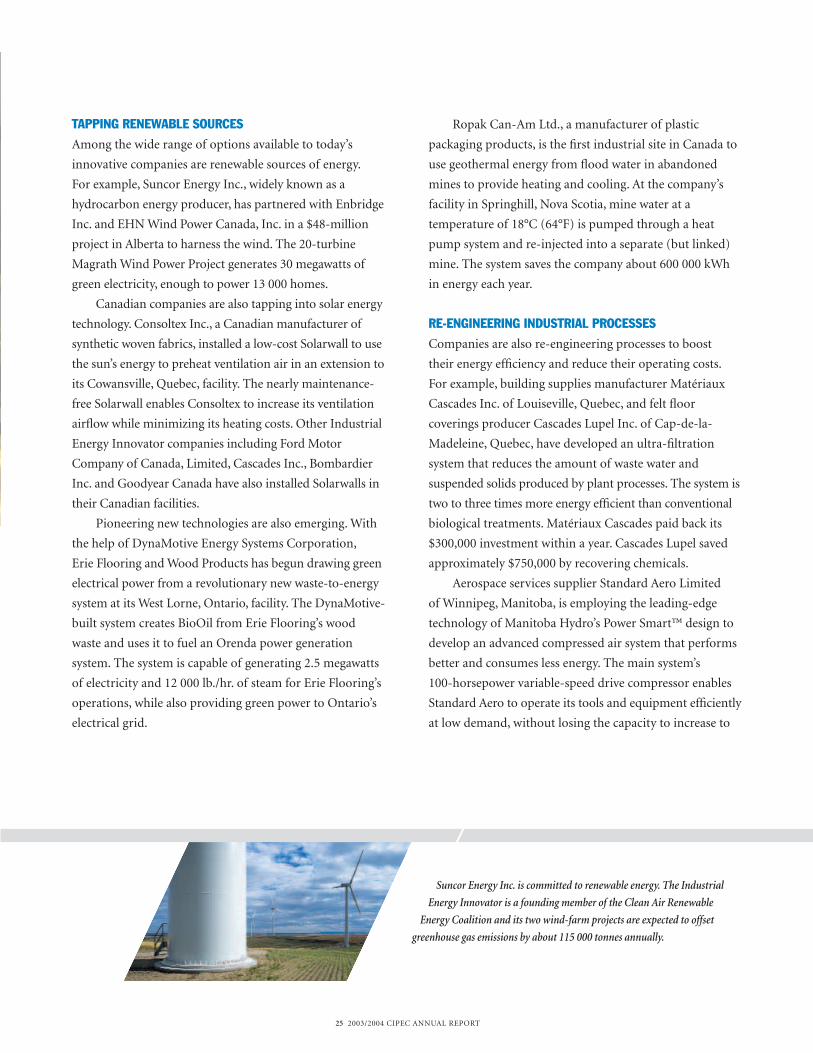
Suncor Energy Inc. is committed to renewable energy. The Industrial
Energy Innovator is a founding member of the Clean Air Renewable
Energy Coalition and its two wind-farm projects are expected to offset
greenhouse gas emissions by about 115 000 tonnes annually.
25 2003/2004 CIPEC ANNUAL REPORT
Ropak Can-Am Ltd., a manufacturer of plastic
packaging products, is the first industrial site in Canada to
use geothermal energy from flood water in abandoned
mines to provide heating and cooling. At the company’s
facility in Springhill, Nova Scotia, mine water at a
temperature of 18°C (64°F) is pumped through a heat
pump system and re-injected into a separate (but linked)
mine. The system saves the company about 600 000 kWh
in energy each year.
RE-ENGINEERING INDUSTRIAL PROCESSES
Companies are also re-engineering processes to boost
their energy efficiency and reduce their operating costs.
For example, building supplies manufacturer Matériaux
Cascades Inc. of Louiseville, Quebec, and felt floor
coverings producer Cascades Lupel Inc. of Cap-de-la-
Madeleine, Quebec, have developed an ultra-filtration
system that reduces the amount of waste water and
suspended solids produced by plant processes. The system is
two to three times more energy efficient than conventional
biological treatments. Matériaux Cascades paid back its
$300,000 investment within a year. Cascades Lupel saved
approximately $750,000 by recovering chemicals.
Aerospace services supplier Standard Aero Limited
of Winnipeg, Manitoba, is employing the leading-edge
technology of Manitoba Hydro’s Power Smart™ design to
develop an advanced compressed air system that performs
better and consumes less energy. The main system’s
100-horsepower variable-speed drive compressor enables
Standard Aero to operate its tools and equipment efficiently
at low demand, without losing the capacity to increase to
TAPPING RENEWABLE SOURCES
Among the wide range of options available to today’s
innovative companies are renewable sources of energy.
For example, Suncor Energy Inc., widely known as a
hydrocarbon energy producer, has partnered with Enbridge
Inc. and EHN Wind Power Canada, Inc. in a $48-million
project in Alberta to harness the wind. The 20-turbine
Magrath Wind Power Project generates 30 megawatts of
green electricity, enough to power 13 000 homes.
Canadian companies are also tapping into solar energy
technology. Consoltex Inc., a Canadian manufacturer of
synthetic woven fabrics, installed a low-cost Solarwall to use
the sun’s energy to preheat ventilation air in an extension to
its Cowansville, Quebec, facility. The nearly maintenance-
free Solarwall enables Consoltex to increase its ventilation
airflow while minimizing its heating costs. Other Industrial
Energy Innovator companies including Ford Motor
Company of Canada, Limited, Cascades Inc., Bombardier
Inc. and Goodyear Canada have also installed Solarwalls in
their Canadian facilities.
Pioneering new technologies are also emerging. With
the help of DynaMotive Energy Systems Corporation,
Erie Flooring and Wood Products has begun drawing green
electrical power from a revolutionary new waste-to-energy
system at its West Lorne, Ontario, facility. The DynaMotive-
built system creates BioOil from Erie Flooring’s wood
waste and uses it to fuel an Orenda power generation
system. The system is capable of generating 2.5 megawatts
of electricity and 12 000 lb./hr. of steam for Erie Flooring’s
operations, while also providing green power to Ontario’s
electrical grid.

26 2003/2004 CIPEC ANNUAL REPORT
The Montupet Ltée. smelter in Rivière-Beaudette,
Quebec, has implemented a project to recycle sand. The
smelter has installed an energy-efficient natural gas
furnace that has enabled it to recycle almost 100 percent of
its sand. This system has resulted in a cash saving of about
90 percent per tonne and a subsequent investment payback
period of less than two years.
Textile producer CookshireTex Inc. of Cookshire,
Quebec, has converted its operations to natural gas, and is
recovering heat by direct contact. The improvement is
saving the plant 5000 MWh a year, and has eliminated the
need to install a new boiler.
Crossley Carpet Mills Limited responded to an
announced increase in power rates by undertaking energy-
saving measures throughout its Truro, Nova Scotia,
manufacturing facility. The company installed a radio
frequency dryer, a closed-loop cooling system and a steam-
coil heater to increase efficiency in major mill processes.
Crossley turned to variable frequency drives, “soft start”
systems and electronic process control to further mitigate
energy costs associated with fluctuating mill loads and the
use of materials, and improved lighting and filtering
systems to reduce warehousing and maintenance expenses.
Timminco Metals’ magnesium reduction and
extrusion plant in Haley, Ontario, installed twin-bed
natural gas heat-reclaimer burners in a retort furnace to
reclaim hot flue gases and use them to preheat combustion
air. The efficient design preheats the combustion air to
within 85 to 95 percent of the flue gas temperature, thus
reducing the fuel input required to heat cold air to furnace
temperature. The twin-bed burners resulted in 38 percent
full power when needed. Large high-pressure air-storage
receivers on a separate short burst, high demand testing
system ensure that the company has adequate air supplies,
while recharging at night, when power is less expensive.
The testing system’s state-of-the-art thermal-mass
refrigerated dryer runs only as required, enabling the dryer
to use much less energy than conventional fixed-cycle
desiccant dryers or conventional refrigerated dryers. Heat-
recovery units recycle waste heat from both systems to
supplement the facility’s heating requirements in winter
months. The enhanced energy efficiency of the systems has
led to substantial operating cost savings and an annual
reduction in GHG emissions of 30 tonnes.
Staff at Aluminerie Lauralco Inc., a subsidiary of
Alcoa Inc., have optimized the Faraday efficiency of the
electrolytic process in the company’s aluminum smelter in
Deschambault, Quebec, to more than 96 percent, resulting
in energy consumption reductions of nearly 13 000 kWh
per tonne of aluminum. Additional efforts include
measures to reduce anode effects and lower fluorocarbon
emissions. The company has also set up an energy
committee to focus on continuing efforts to further
reduce the plant’s energy consumption and lower
fluorocarbon emissions.
Eka Chimie Canada Inc., which manufactures sodium
chlorate for the pulp and paper industry at its Salaberry-
de-Valleyfield, Quebec, plant, now recycles waste hydrogen
from the manufacturing process and uses it to dry sodium
chlorate. The company expects this approach to reduce
its annual electricity bill by $225,000 – or 6400 megawatt
hours (MWh).
Imperial Oil Limited is integrating energy efficiency into its day-to-day
operations. Between 1995 and 2004, the Industrial Energy Innovator has
improved energy efficiency by 15 percent.
27 2003/2004 CIPEC ANNUAL REPORT
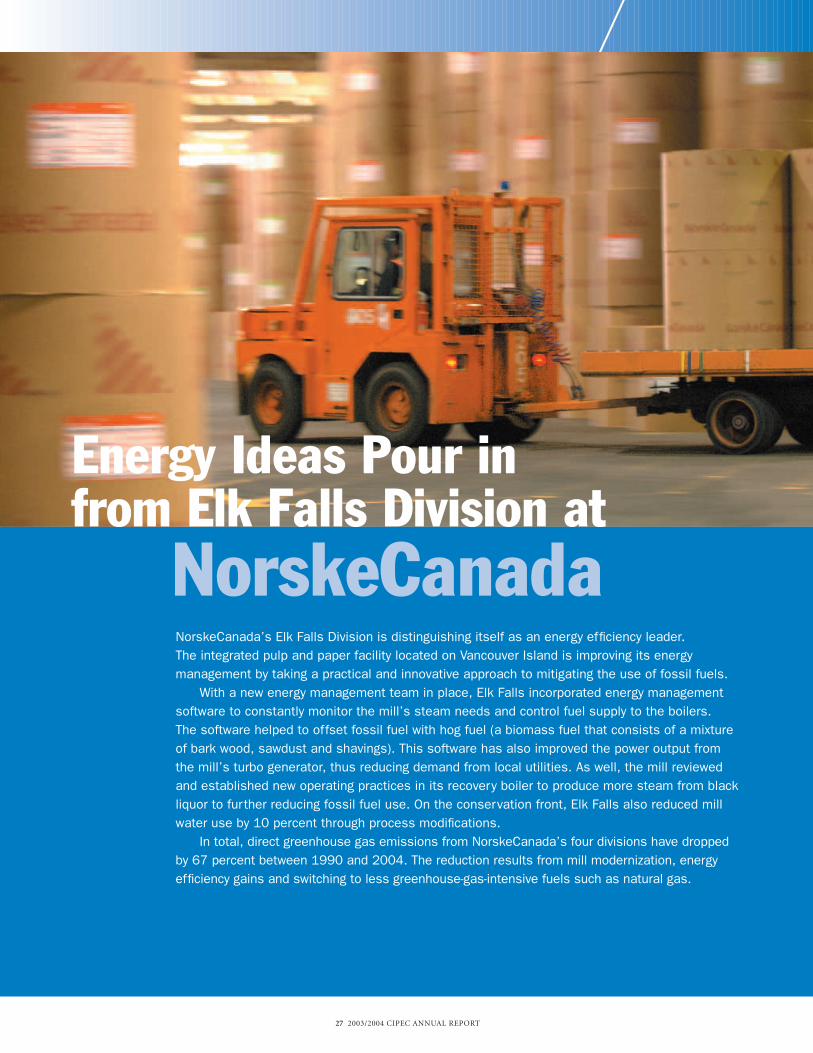
NorskeCanada’s Elk Falls Division is distinguishing itself as an energy efficiency leader. The integrated pulp and paper facility located on Vancouver Island is improving its energymanagement by taking a practical and innovative approach to mitigating the use of fossil fuels.
With a new energy management team in place, Elk Falls incorporated energy managementsoftware to constantly monitor the mill’s steam needs and control fuel supply to the boilers. The software helped to offset fossil fuel with hog fuel (a biomass fuel that consists of a mixtureof bark wood, sawdust and shavings). This software has also improved the power output fromthe mill’s turbo generator, thus reducing demand from local utilities. As well, the mill reviewedand established new operating practices in its recovery boiler to produce more steam from blackliquor to further reducing fossil fuel use. On the conservation front, Elk Falls also reduced millwater use by 10 percent through process modifications.
In total, direct greenhouse gas emissions from NorskeCanada’s four divisions have droppedby 67 percent between 1990 and 2004. The reduction results from mill modernization, energyefficiency gains and switching to less greenhouse-gas-intensive fuels such as natural gas.
Energy Ideas Pour in from Elk Falls Division at
NorskeCanada

28 2003/2004 CIPEC ANNUAL REPORT
Chambly, Quebec, has reduced energy and operating costs
by about $50,000 per year, while improving product quality.
Independent western Canadian oil and gas producer
Penn West Petroleum Ltd. of Calgary, Alberta, focuses on
energy efficiency and natural gas conservation as its
principal means of reducing GHG emissions. The company
has conducted an emission audit program at its 26 facilities,
leading to an extensive equipment repair program. The
company has also made numerous process and equipment
changes to improve its environmental performance. Since
1996, despite rapid growth, Penn West has succeeded in
reducing its energy intensity by 11 percent.
In 1994, textile manufacturer Manoir Inc. installed a
relatively new energy-saving technology at its St. Laurent,
Quebec, facility: a direct-contact economizer. The
economizer, which was further upgraded and expanded in
1999, uses hot waste water leaving the plant to heat cold
water entering the plant. By preheating this fresh water,
less energy is consumed in the manufacturing process.
The device performed so well that the company opted to
install a boiler-stack heat-recovery unit to recover heat
escaping through the boiler chimney. The two installations
have cut the company’s natural gas consumption and
reduced GHG emissions by 1500 tonnes per year.
Stackpole Limited of Oakville, Ontario, is at the
leading edge of the use of metallurgical powders in
lower gas consumption (31 terajoules (TJ)/year), and
annual energy savings from the twin-bed burners amount
to $110,000.
In 1987, the Québec Cartier Mining Company began
installing a unique technology to optimize the use of steam
at its Port-Cartier, Quebec, pellet plant. The Steam-
Condensate Closed System (SCCS) allows condensate to
return in a closed pressurized loop to be reboiled. Since its
installation at Québec Cartier Mining, the SCCS has
reduced energy consumption by 18 percent compared to
a conventional steam-condensate open system.
FRE Composites Inc. designed and manufactured
seven hot-air electric convection ovens at its St-André-
d’Argenteuil, Quebec, manufacturing facility which
incorporate high-power density resistance heating. The
new ovens provide more accurate control over all process
stages and double the production capacity with no increase
in personnel requirements. Because each of the seven
ovens is entirely autonomous, production flexibility is
improved, while reducing energy demand by 80 percent
compared to the previous system.
By replacing an existing conventional furnace with
a natural-gas-fired rapid heater for its forging operations,
MTC Suspension Inc. has demonstrated the efficiency and
profitability of the smaller, more efficient heaters for
metals. The heavy-duty vehicle spring manufacturer from
Pioneering Technologies
are emerging
29 2003/2004 CIPEC ANNUAL REPORT
to 0.93 in 2003, coupled with an increase in production of
9 percent.
MANAGING ENERGY MORE EFFECTIVELY
Many companies are turning to energy management
systems, programs and technologies as a source of energy
savings. For example, Ivaco Rolling Mills Inc. installed a
predictive “smart” demand-side management system to
control electrical energy use at its L’Original, Ontario, steel
plant/rolling mill complex. Two years after installation,
the system has reduced demand by 9894 kW and saved the
company over $846,000 in existing load costs. Over the
same period, productivity has risen 8 percent.
An energy efficiency culture pervades the facilities
and operations of Imperial Oil Limited. The company
has implemented an overall energy management system
designed to create performance improvements, and
sustains them by making energy performance optimization
and improvement a key part of daily work life. A detailed
energy performance survey has enabled Imperial to
benchmark the operations of its refineries against the
company’s own best practices, and those of ExxonMobil.
The company has used the survey’s results to develop a
five-year plan for operational and capital improvements at
its facilities. These improvements will deepen the already
impressive list of energy efficiency successes the company
has recorded in recent years.
At the Petro-Canada Lubricants Centre in
Mississauga, Ontario, Engineering Specialist and Energy
Advisor Tom Latta provides technical support to both
automobile component manufacturing. The company
has received assistance from NRCan’s CANMET Energy
Technology Centre’s Industry Energy Research and
Development Program to produce and improve high-
strength automotive components, allowing powder
metallurgy to break into markets served traditionally by
castings and steel stampings. Since 1982, this collaboration
produced energy savings of 3.6 petajoules, resulting in
a reduction of GHG emissions of 180 000 tonnes.
Calgary, Alberta-based Husky Energy Inc. recently
implemented a series of projects to reduce GHG emissions
at its facilities in Canada and China. The oil and natural
gas company’s efforts include more effective management
of emissions venting, projects to reduce electricity and fuel
gas consumption, and a flare gas conservation program.
These efforts have enabled Husky to reduce its CO2
equivalent emissions by almost 1.4 million tonnes in the
2002–2003 reporting year. The company’s cumulative
emissions reductions now total almost 3.5 million tonnes
of CO2 equivalent per year.
Also headquartered in Calgary, NOVA Chemicals
Corporation employs leading-edge technologies to
increase the energy efficiency of its Canadian chemical
manufacturing facilities. The company now uses
cogeneration and hydroelectric energy as the primary
sources of power for every one of its Canadian
manufacturing sites, and has been a leader in efforts to
track and report energy efficiency performance. In 2003,
the company reported that the total emissions intensity
of its Canadian facilities improved from 1.02 in 2002
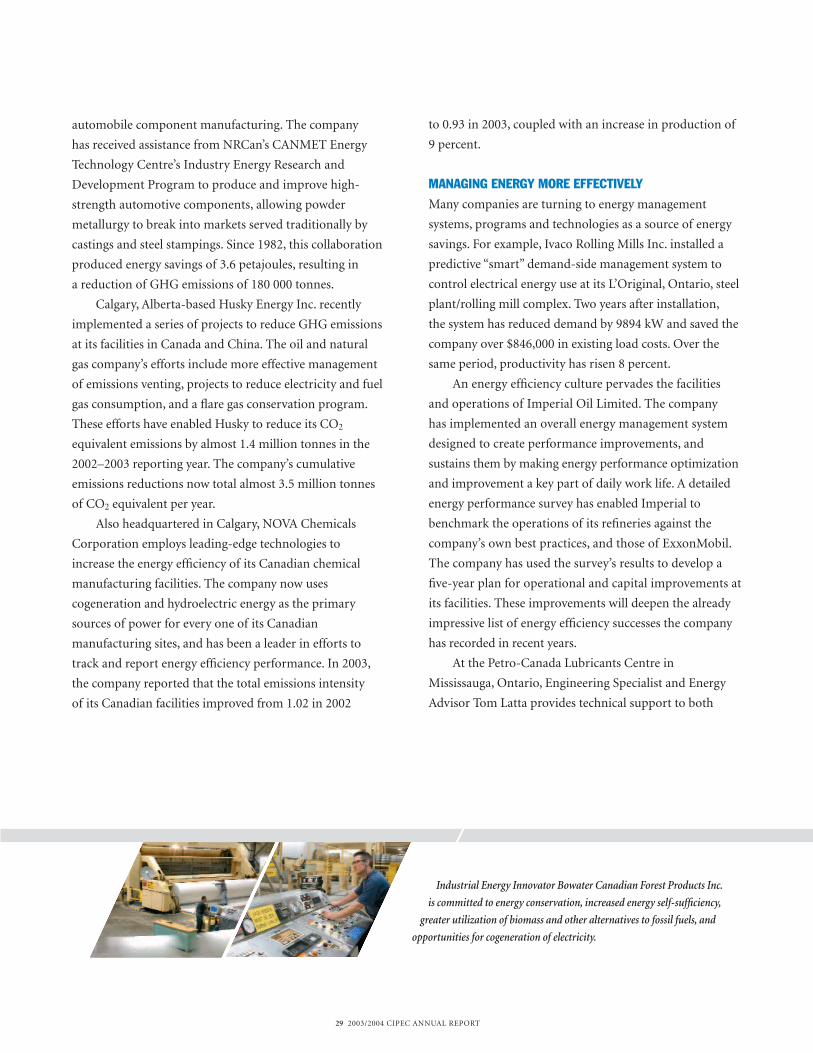
Industrial Energy Innovator Bowater Canadian Forest Products Inc.
is committed to energy conservation, increased energy self-sufficiency,
greater utilization of biomass and other alternatives to fossil fuels, and
opportunities for cogeneration of electricity.
30 2003/2004 CIPEC ANNUAL REPORT
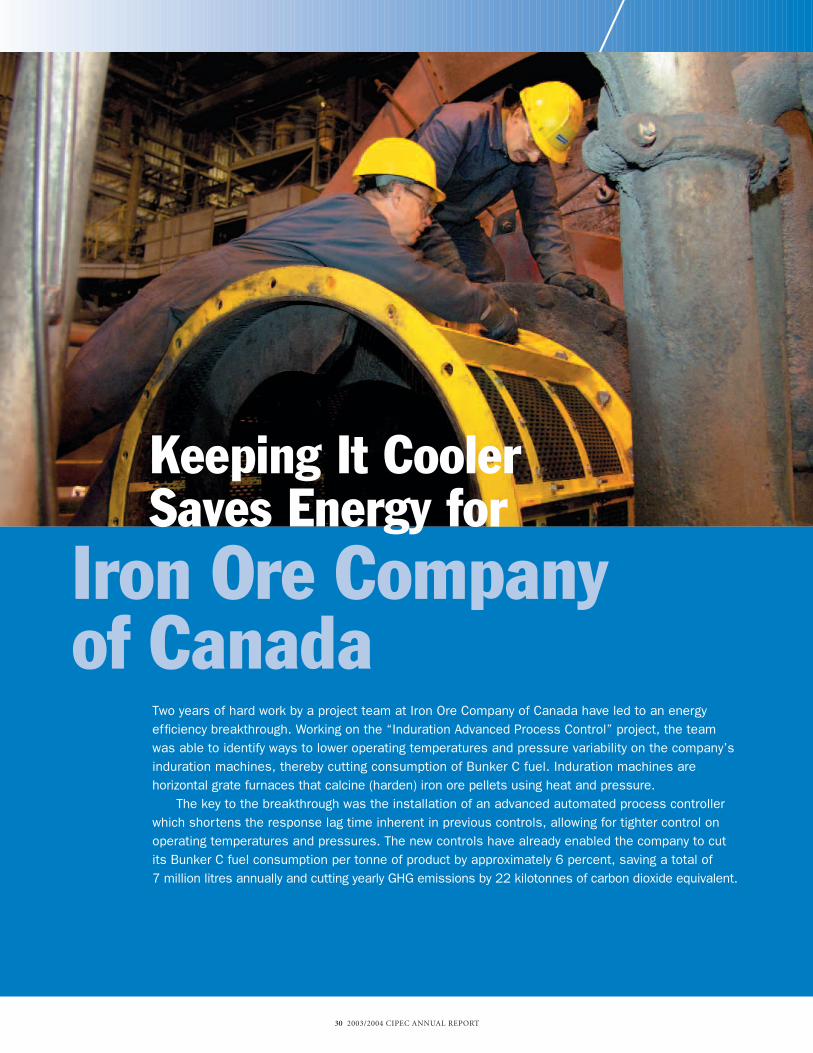
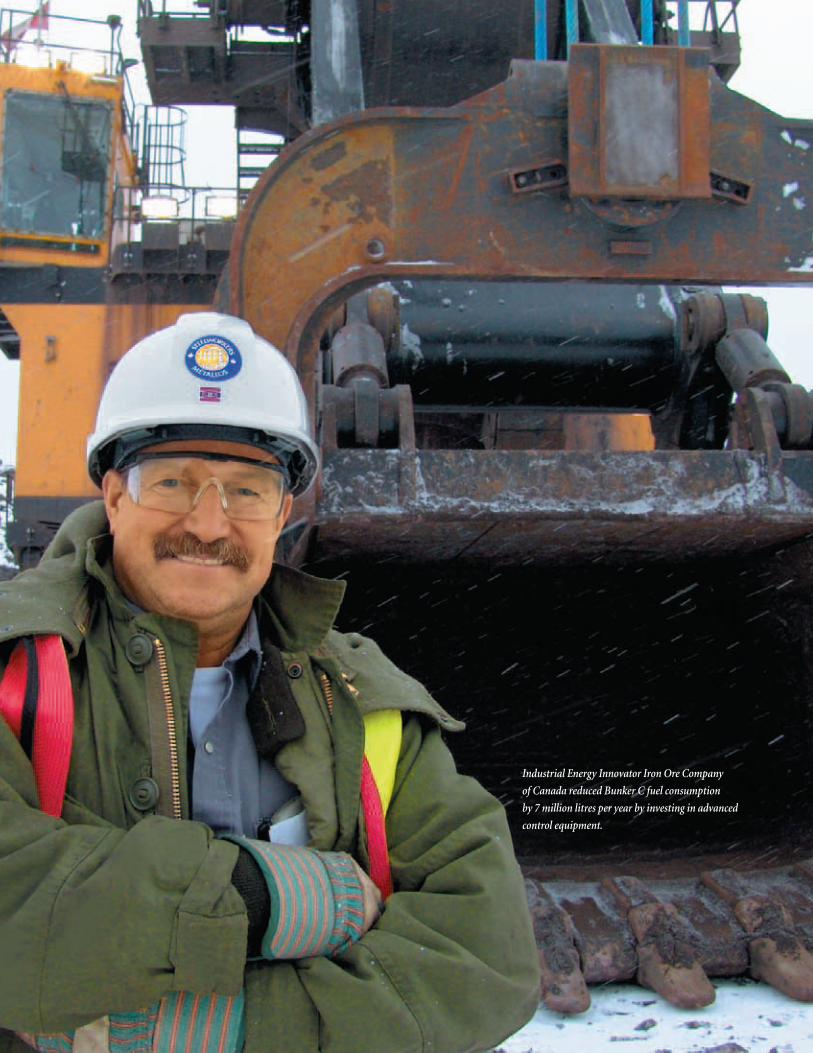
Two years of hard work by a project team at Iron Ore Company of Canada have led to an energyefficiency breakthrough. Working on the “Induration Advanced Process Control” project, the teamwas able to identify ways to lower operating temperatures and pressure variability on the company’sinduration machines, thereby cutting consumption of Bunker C fuel. Induration machines arehorizontal grate furnaces that calcine (harden) iron ore pellets using heat and pressure.
The key to the breakthrough was the installation of an advanced automated process controllerwhich shortens the response lag time inherent in previous controls, allowing for tighter control onoperating temperatures and pressures. The new controls have already enabled the company to cutits Bunker C fuel consumption per tonne of product by approximately 6 percent, saving a total of 7 million litres annually and cutting yearly GHG emissions by 22 kilotonnes of carbon dioxide equivalent.
Keeping It CoolerSaves Energy for
Iron Ore Company of Canada
31 2003/2004 CIPEC ANNUAL REPORT
operational and maintenance personnel to help them
reduce energy waste and improve efficiency. By bringing
a wealth of knowledge resources to the shop floor, and
by leading efforts to develop energy efficiency projects at
the facility, he has helped the refinery save $3.9 million per
year in energy costs and identify another $1 million. His
efforts earned him recognition in 2004 as Energy Engineer
of the Year by the Association of Energy Engineers.
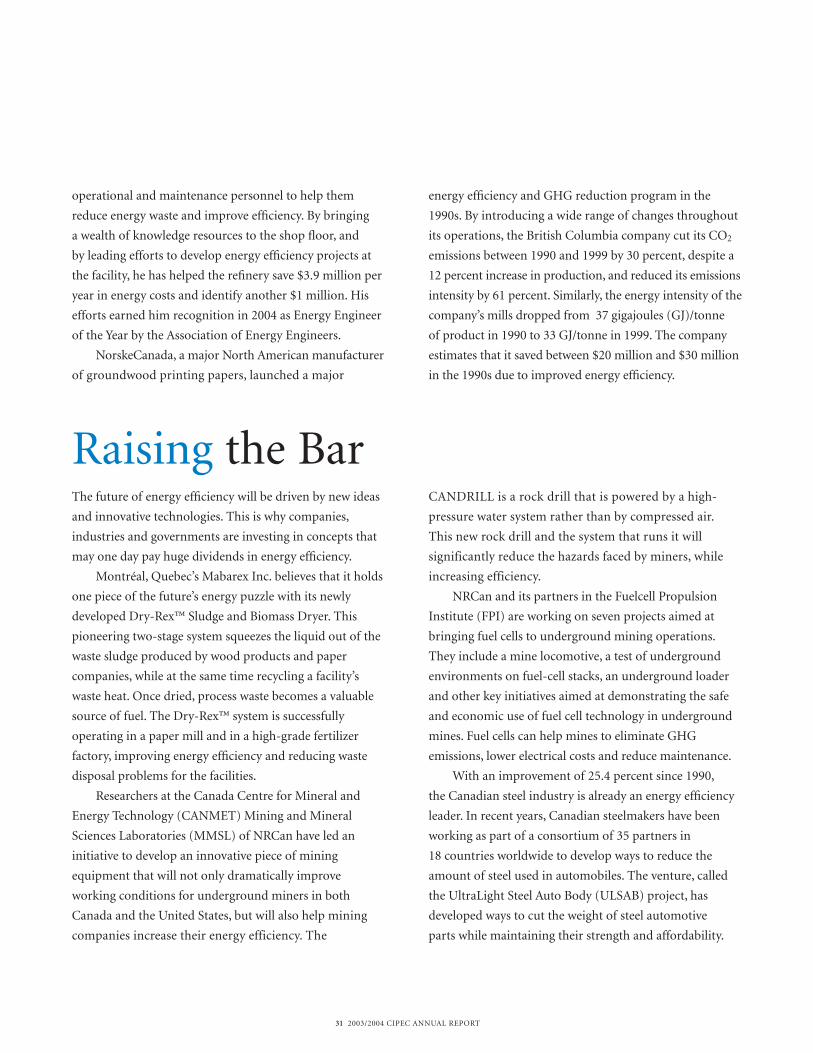
NorskeCanada, a major North American manufacturer
of groundwood printing papers, launched a major
energy efficiency and GHG reduction program in the
1990s. By introducing a wide range of changes throughout
its operations, the British Columbia company cut its CO2
emissions between 1990 and 1999 by 30 percent, despite a
12 percent increase in production, and reduced its emissions
intensity by 61 percent. Similarly, the energy intensity of the
company’s mills dropped from 37 gigajoules (GJ)/tonne
of product in 1990 to 33 GJ/tonne in 1999. The company
estimates that it saved between $20 million and $30 million
in the 1990s due to improved energy efficiency.
The future of energy efficiency will be driven by new ideas
and innovative technologies. This is why companies,
industries and governments are investing in concepts that
may one day pay huge dividends in energy efficiency.
Montréal, Quebec’s Mabarex Inc. believes that it holds
one piece of the future’s energy puzzle with its newly
developed Dry-Rex™ Sludge and Biomass Dryer. This
pioneering two-stage system squeezes the liquid out of the
waste sludge produced by wood products and paper
companies, while at the same time recycling a facility’s
waste heat. Once dried, process waste becomes a valuable
source of fuel. The Dry-Rex™ system is successfully
operating in a paper mill and in a high-grade fertilizer
factory, improving energy efficiency and reducing waste
disposal problems for the facilities.
Researchers at the Canada Centre for Mineral and
Energy Technology (CANMET) Mining and Mineral
Sciences Laboratories (MMSL) of NRCan have led an
initiative to develop an innovative piece of mining
equipment that will not only dramatically improve
working conditions for underground miners in both
Canada and the United States, but will also help mining
companies increase their energy efficiency. The
CANDRILL is a rock drill that is powered by a high-
pressure water system rather than by compressed air.
This new rock drill and the system that runs it will
significantly reduce the hazards faced by miners, while
increasing efficiency.
NRCan and its partners in the Fuelcell Propulsion
Institute (FPI) are working on seven projects aimed at
bringing fuel cells to underground mining operations.
They include a mine locomotive, a test of underground
environments on fuel-cell stacks, an underground loader
and other key initiatives aimed at demonstrating the safe
and economic use of fuel cell technology in underground
mines. Fuel cells can help mines to eliminate GHG
emissions, lower electrical costs and reduce maintenance.
With an improvement of 25.4 percent since 1990,
the Canadian steel industry is already an energy efficiency
leader. In recent years, Canadian steelmakers have been
working as part of a consortium of 35 partners in
18 countries worldwide to develop ways to reduce the
amount of steel used in automobiles. The venture, called
the UltraLight Steel Auto Body (ULSAB) project, has
developed ways to cut the weight of steel automotive
parts while maintaining their strength and affordability.
Raising the Bar

32 2003/2004 CIPEC ANNUAL REPORT
By making vehicles lighter, fuel economy is improved and
emissions are reduced. Moreover, using less steel per part
manufactured also means less energy used in
manufacturing, thereby improving energy intensity.
The steel industry is also using technology such as
vacuum degassing, ladle refining and continuous casting
to create ultra-formable steels for complex automotive
parts and improved electrical steels for electric motors
and transformers. These improved steels are resistant to
breakage and splitting, even when ultra-thin. New processes
have combined to help cut in half, over the past 18 years,
the electrical energy consumed by appliances such as
blenders, clothes dryers, light timers and refrigerators.
As Canadian industry pursues energy efficiency into
the future, ingenuity and innovation will lead the way.
Emerging technologies will enable industry to improve
efficiency by re-engineering, and even replacing processes
with revolutionary new approaches. Bioprocesses such as
metabolic engineering, molecular farming, nanotechnology,
bioremediation and phytoremediation will enable industry
to replace the use of carbon-based energy with biological
action. These technologies will be used to convert
renewable feedstocks and waste into useful products, to
create new biodegradable materials free of petroleum-
based feedstocks, and to purify and minimize waste. They
will enhance and extend industrial processes, simplify the
extraction of materials, synthesize new bioactive ingredients,
slash waste and minimize environmental impact.
In the petroleum sector, processing bitumen and other
heavy oils using biocatalysis and bioprocessing concepts
has the potential to save energy. Compared to current
thermochemical technologies, bio-based technologies have
the potential to reduce the viscosity of heavy oil at lower
temperatures and pressures. The technology, now being
researched by several Canadian organizations including the
University of Alberta, also applies to other sectors. The
technology can be used to provide substitute materials and
feedstocks, reduce energy consumption and slash waste in
the chemical and plastics industry. Mining companies might
be able to replace high temperature roasting and smelting
with ambient temperature bioleaching biooxidation. The
pulp and paper industry could draw upon bioprocesses for
de-inking and bleaching, and to reduce water use.
By taking comprehensive action to improve processes,
systems and practices, Canadian industry has made
substantial progress in reducing energy intensity. But
energy efficiency still holds immense potential. Efficient
leading-edge technologies will bring industries a new array
of tools to advance energy efficiency, improve their
operations and reduce costs.
The Futureof energy efficiency
will be driven by new ideas
33 2003/2004 CIPEC ANNUAL REPORT
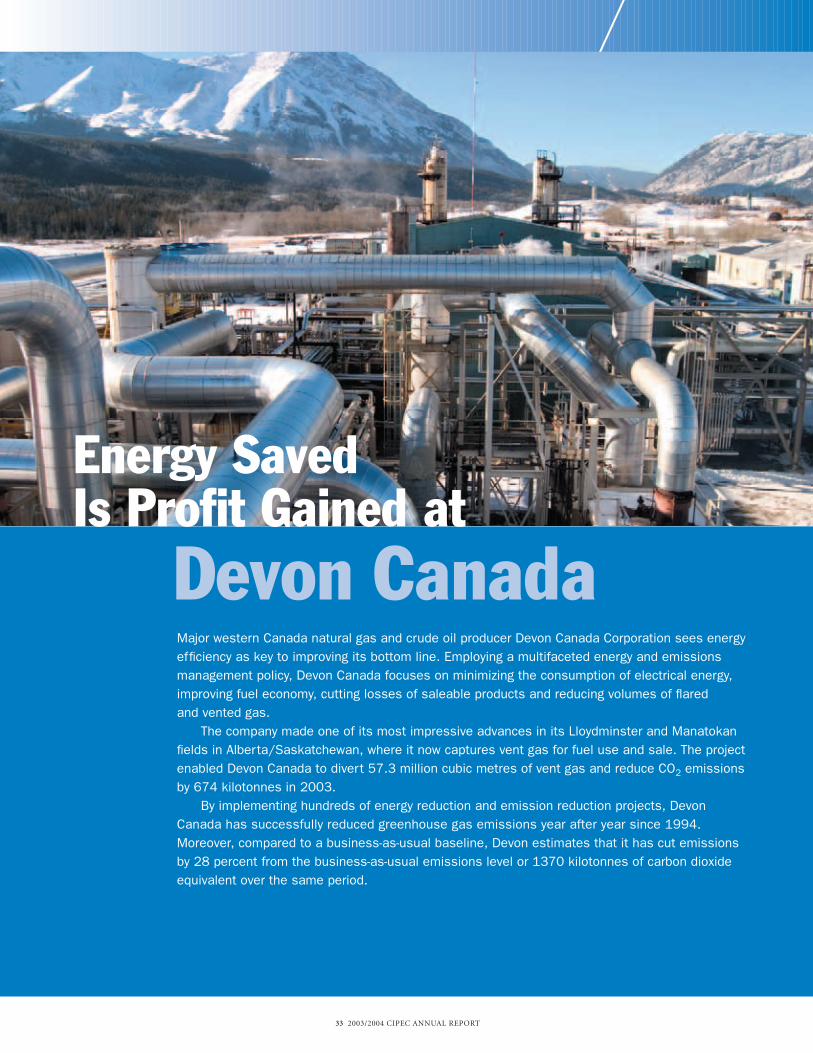
Major western Canada natural gas and crude oil producer Devon Canada Corporation sees energyefficiency as key to improving its bottom line. Employing a multifaceted energy and emissionsmanagement policy, Devon Canada focuses on minimizing the consumption of electrical energy,improving fuel economy, cutting losses of saleable products and reducing volumes of flared and vented gas.
The company made one of its most impressive advances in its Lloydminster and Manatokanfields in Alberta/Saskatchewan, where it now captures vent gas for fuel use and sale. The projectenabled Devon Canada to divert 57.3 million cubic metres of vent gas and reduce CO2 emissionsby 674 kilotonnes in 2003.
By implementing hundreds of energy reduction and emission reduction projects, DevonCanada has successfully reduced greenhouse gas emissions year after year since 1994.Moreover, compared to a business-as-usual baseline, Devon estimates that it has cut emissionsby 28 percent from the business-as-usual emissions level or 1370 kilotonnes of carbon dioxideequivalent over the same period.
Energy Saved Is Profit Gained at
Devon Canada
34 2003/2004 CIPEC ANNUAL REPORT
Industrial Energy Innovator Iron Ore Company
of Canada reduced Bunker C fuel consumption
by 7 million litres per year by investing in advanced
control equipment.

35 2003/2004 CIPEC ANNUAL REPORT
Performance
36 2003/2004 CIPEC ANNUAL REPORT
THE CIPEC TOOLBOX
CIPEC’s first 30 years are notable for the organization’s
remarkable consistency, and its unflagging dynamism,
resiliency and ability to advocate energy efficiency as a
means to a constantly changing end. CIPEC’s continuing
relevance is revealed in its impressive growth. From
a handful of industry participants in 1975, CIPEC has
grown, evolved and adapted to changing times and
circumstances to where it now encompasses 26 task forces
led by 48 trade organizations representing more than
5000 industrial firms from the mining, construction,
manufacturing and energy supply sectors. As of today,
these firms represent nearly 98 percent of Canada’s
secondary industrial energy consumption.
CIPEC helps companies to make intelligent energy
management and investment decisions with an array of
programs and tools geared to their needs. For example,
energy benchmarking enables companies to compare their
energy efficiency performance against “best practices”
facilities in their sectors. This comparative analysis approach
to gauging energy performance helps companies focus their
efforts on opportunities to reduce energy consumption.
Committed to the merits of energy performance
benchmarking, CIPEC works in step with trade associations
primarily by providing expertise and financial support.
Since the CIPEC benchmarking program was launched
in 2001, studies have been carried out within 14 different
industrial sectors representing 265 companies. As well,
some of the early participants are returning to re-examine
their improvement. These studies are beginning to show
significant results, as companies renew their efforts to
keep their energy management practices in line with
world-class practices.
CIPEC’s highly popular energy audits help industrial
facilities to identify areas of energy waste, and develop
priorities to eliminate them. The energy audit program
was introduced in 2001. As of March 31, 2004, 247 audits
have been carried out, 142 of them in fiscal year 2003/2004
alone. Facilities examined in these audits represent
combined energy expenditures of nearly $1 billion per year.
CIPEC’s audit program is expanding. In a new process
integration pilot program supported by NRCan, a team of
engineers and energy experts rigorously and systematically
identify the most effective and efficient energy-saving
opportunities in complex industrial processes. This new
form of audit digs deeper to examine the interaction of
multiple processes, and find sophisticated structural energy
efficiency opportunities. The process integration audit gives
decision makers the detailed information they need to
invest confidently in energy- and material-saving projects.
advanced Canada’s sustainable development agenda by rallying around theCIPEC banner to improve energy intensity and slash GHG emissions. Whilemaking these gains, industry sectors have also lowered production costs and improved process efficiency. When clear vision and decisive action meet,the result is performance.
Canadian industry has significantly

37 2003/2004 CIPEC ANNUAL REPORT
For close to 20 years, Procter & Gamble Inc. has been hard at work identifying energyefficiency opportunities. But it wasn’t until its Belleville, Ontario, facility expanded five years ago that the company began tracking its progress in reducing energy costs. The plant has implemented a series of energy-saving measures and established a formalGHG reduction team. The GHG team is keyed into the site’s decision-making process andis a member of the company’s change management team. The team gathers ideas fromsources such as NRCan’s Dollars to $ense workshops as well as employees who work on the shop floor.
Procter & Gamble’s (P&G’S) team approach has generated close to 150 ideas, of which 80 were adopted. For example, eliminating pre-filter fans produced annual energysavings of $158,000, installing water chiller automation saved $50,000, and shutting off lighting in over-lit areas added another $52,000 per year. Thanks to its renewedenergy efficiency efforts, P&G Belleville cut emissions by 16.6 percent in the first year,and is on track to meet its 22.5 percent target by the end of its 2006–2007 fiscal year.
Putting a Lid on Energy Costs atProcter & Gamble
38 2003/2004 CIPEC ANNUAL REPORT
Not content with the status quo, CIPEC continues to
seek out ways to expand the scope and improve the
effectiveness of its programs. At a workshop held in March
2004, the CIPEC Executive Board and Task Force Council
addressed the challenge of increasing investment in energy
efficiency by launching a financing road map. They
concluded that many business decision makers are still
unaware of the energy savings that are available in their
firms – millions of dollars in low-hanging fruit waiting to
be picked in the industrial sector alone. Despite the obvious
opportunities, energy efficiency investment is generally
outranked by competing priorities for capital.
An action plan composed of two themes emerged from
the workshop: access to capital, and access to information.
One of CIPEC’s basic, yet most effective, tools is its
highly popular Dollars to $ense workshops. Since these
sessions were introduced in 1997, more than 1700 industrial
participants have been introduced to the fundamentals of
energy management specific to their industries and their
companies. By opening people’s eyes to the opportunities
for energy efficiency in their facilities, these workshops are
an inexpensive way for companies to get employees
thinking and participating. In 2003, for example, one
employee attending a Dollars to $ense workshop identified
an opportunity to reduce energy consumption that
immediately saved his company $45,000 per day. According
to an evaluation study, the Dollars to $ense workshops are
having a sizable impact on Canada’s industrial energy use,
as well as contributing to corporate competitiveness.
According to the study, Dollars to $ense participants have
avoided energy costs totaling $32 million since 1997.
CIPEC continues to communicate to thousands of
individuals in hundreds of companies through its
informative Heads Up CIPEC newsletter. Published bi-
weekly and distributed electronically, Heads Up CIPEC
keeps Canada’s industrial energy efficiency community
informed about technological innovations, CIPEC
programs, and company actions which contribute to
energy efficiency. In addition, CIPEC’s Energy Managers
Network provides a forum for discussion and information
sharing which serves energy managers across Canada.
Network members communicate through plant meetings,
as well as through the network’s Web site at
www.oee.nrcan.gc.ca/cipec/ieep/emn.
Road Map for the Future
CIPEC encompasses 98 Percent
of Canada’s secondaryindustrial energy use
39 2003/2004 CIPEC ANNUAL REPORT
Industry needs readily accessible information about the
financing of energy management projects, as well as help to
overcome financial hurdles. Workshop participants agreed
that a task force is needed to investigate the feasibility of
establishing a public-private financing organization to
make energy efficiency investment capital more accessible.
Participants also recommended that an information
clearing house be established to improve industry
awareness and to educate companies, especially small and
medium-sized establishments, about energy management
and financing options and opportunities. They also stated
that governments should establish energy efficiency
incentives which target the uptake of proven, effective
technologies, with fewer incentives earmarked toward
funding research and development.
CIPEC is also pursuing an increasingly active outreach
program to build relationships with industry organizations
currently outside of the CIPEC family. The program seeks
to extend the organization’s reach across the country, and
to engage the vast numbers of small enterprises which
operate in nearly every industrial sector.
WHAT THE NUMBERS SAY ABOUT 2003
In 2003, CIPEC industries contributed almost $289 billion
to the Canadian economy, about 28 percent of the country’s
gross domestic product (GDP), and provided more than
20 percent of Canada’s jobs.
CIPEC’s importance is reflected in the tangible results
achieved by Canadian industry.
While Canada’s GDP rose 36 percent between 1990
and 2003, thanks to energy management measures,
industrial energy consumption rose only 23.8 percent.
As a result of CIPEC’s efforts, the more than
5000 companies that represent over 98 percent of Canadian
industry have reduced their combined energy intensity
by 8.7 percent between 1990 and 2003, or an average
of 0.7 percent per year. Improved energy management
enabled Canadian industry to avoid approximately
$3.4 billion in purchased energy in 2003, enough energy
to heat 4.8 million Canadian households for one year.
Had energy intensity remained constant, industry’s GHG
emissions would have been 27.8 megatonnes higher.
The mining, manufacturing and construction sectors
improved their energy intensity by an average of 1.7 percent
per year over that period, with an accompanying 1.1 percent
annual improvement in energy efficiency. In 2000, these
CIPEC sectors made a public voluntary commitment
to achieve an average energy intensity improvement of
1 percent per year for the years 1990 to 2005.
The energy management actions of CIPEC industries
contributed significantly to the Canadian economy.
In 2002, just over 40 percent of the $1.1-billion
investment made by industry in the reduction of GHG
emissions went to the suppliers and manufacturers of
Canadian equipment.
JUST THE BEGINNING
CIPEC has remained a vital industrial energy efficiency
resource for three decades. It has done so because the
unique public-private sector partnership has been able to
embrace new ideas and evolve to meet a rapidly changing
worldwide energy environment.
The challenges facing industry have never been
greater. The worldwide demand for energy supplies is
growing at the same time as the world’s conventional
reserves have reached, or passed, their peak production
capacity. Over the long term, these trends will force energy
prices upward. At the same time, Canada’s commitment
to reduce GHG emissions requires industry to implement
more comprehensive emissions-focused programs and
practices. In this demanding environment, Canadian
industry has little choice but to increase its investment in
energy-efficient technologies and focus more attention on
energy management.
Fortunately, CIPEC is available to help. The
organization’s unparalleled toolbox brings effective,
advanced energy management tools to the table –
encouraging the development and implementation of new
technologies, spreading information about new ideas and
best practices, and providing mentoring and networking
opportunities for industrial organizations of all sizes.
The first thirty years of achievement form a solid
foundation on which industry will build even greater energy
efficiency as Canada continues to journey into the future.
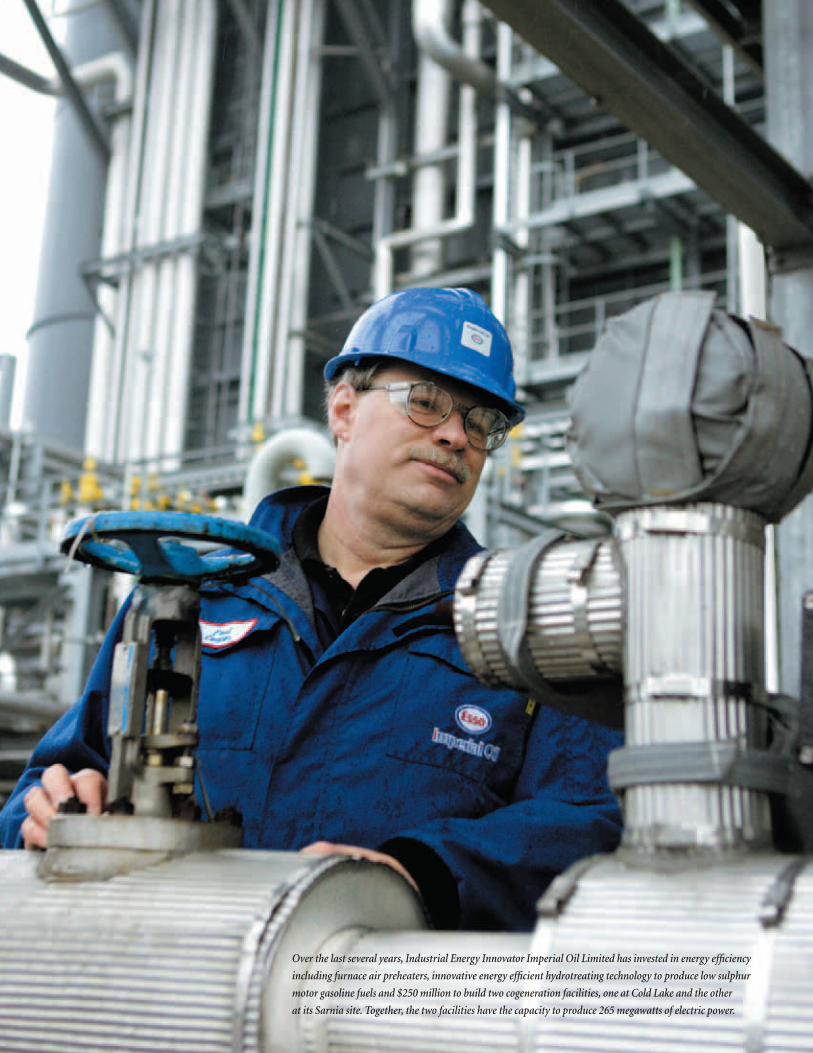
Over the last several years, Industrial Energy Innovator Imperial Oil Limited has invested in energy efficiency
including furnace air preheaters, innovative energy efficient hydrotreating technology to produce low sulphur
motor gasoline fuels and $250 million to build two cogeneration facilities, one at Cold Lake and the other
at its Sarnia site. Together, the two facilities have the capacity to produce 265 megawatts of electric power.

41 2003/2004 CIPEC ANNUAL REPORT
Sector Reports
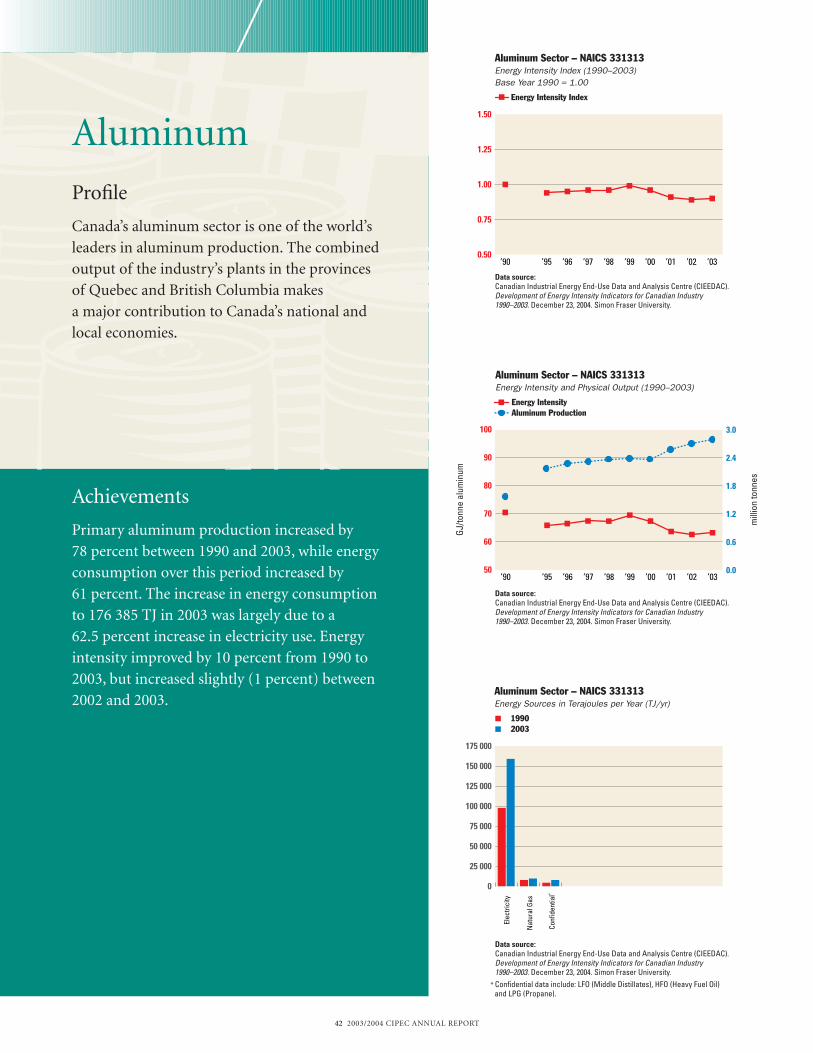
Profile
In 2003, Canada’s aluminum sector ranked third
in the world in annual primary aluminum
production. The combined output of the
industry’s 10 aluminum plants in the province of
Quebec and one in British Columbia is a major
contributor to Canada’s national and local
economies. Although production increases have
forced the industry’s total energy usage upward,
42 2003/2004 CIPEC ANNUAL REPORT
Achievements
Primary aluminum production increased by
78 percent between 1990 and 2003, while energy
consumption over this period increased by
61 percent. The increase in energy consumption
to 176 385 TJ in 2003 was largely due to a
62.5 percent increase in electricity use. Energy
intensity improved by 10 percent from 1990 to
2003, but increased slightly (1 percent) between
2002 and 2003.
Profile
Canada’s aluminum sector is one of the world’s
leaders in aluminum production. The combined
output of the industry’s plants in the provinces
of Quebec and British Columbia makes
a major contribution to Canada’s national and
local economies.
Aluminum Sector – NAICS 331313Energy Sources in Terajoules per Year (TJ/yr)
1990 2003
0
25 000
50 000
75 000
100 000
125 000
150 000
175 000
Conf
iden
tial***
Nat
ural
Gas
Elec
trici
ty
*** Confidential data include: LFO (Middle Distillates), HFO (Heavy Fuel Oil) and LPG (Propane).
50
60
70
80
90
100
’03’02’01’00’99’98’97’96’95’90
Aluminum Sector – NAICS 331313Energy Intensity and Physical Output (1990–2003)
Energy Intensity Aluminum Production
GJ/to
nne
alum
inum
mill
ion
tonn
es
Data source:Canadian Industrial Energy End-Use Data and Analysis Centre (CIEEDAC). Development of Energy Intensity Indicators for Canadian Industry 1990–2003. December 23, 2004. Simon Fraser University.
Data source:Canadian Industrial Energy End-Use Data and Analysis Centre (CIEEDAC). Development of Energy Intensity Indicators for Canadian Industry 1990–2003. December 23, 2004. Simon Fraser University.
Data source:Canadian Industrial Energy End-Use Data and Analysis Centre (CIEEDAC). Development of Energy Intensity Indicators for Canadian Industry 1990–2003. December 23, 2004. Simon Fraser University.
0.50
0.75
1.00
1.25
1.50
’03’02’01’00’99’98’97’96’95’90
Aluminum Sector – NAICS 331313Energy Intensity Index (1990–2003)Base Year 1990 = 1.00
Energy Intensity Index
0.0
0.6
1.2
1.8
2.4
3.0
Aluminum

43 2003/2004 CIPEC ANNUAL REPORT
Achievements
Compared with 1990, the industry now uses
31 percent less energy to produce a hectolitre of
beer. In 2003, the industry consumed 5568 TJ
of energy, 59 percent of which was natural gas
and 26 percent electricity. The brewing industry
is committed to an energy reduction target of
1.5 percent annually from 2004 through 2006.
Brewery
Profile
The Canadian brewing industry prides itself on
its world-class beers, its leadership in educating
consumers to drink responsibly, its three-century
history in Canada, its diversity and its impressive
environmental record.
Brewery Sector – NAICS 312120Energy Sources in Terajoules per Year (TJ/yr)
1990 2003
0
1 000
2 000
3 000
4 000
5 000
6 000
7 000
Conf
iden
tial**
Mid
dle
Dist
illat
es
Nat
ural
Gas
Elec
trici
ty
GJ/h
ecto
litre
mill
ion
hect
olitr
es
Brewery Sector – NAICS 312120Energy Intensity and Physical Output (1990–2003)
Energy Intensity Beer Production
0.6
0.7
0.8
0.9
1.0
1.1
1.2
’03’02’01’00’99’98’97’96’95’90
Brewery Sector – NAICS 312120Energy Intensity Index (1990–2003)Base Year 1990 = 1.00
Energy Intensity Index
Data source:Canadian Industrial Energy End-Use Data and Analysis Centre (CIEEDAC). Development of Energy Intensity Indicators for Canadian Industry 1990–2003. December 23, 2004. Simon Fraser University.
Data source:Canadian Industrial Energy End-Use Data and Analysis Centre (CIEEDAC). Development of Energy Intensity Indicators for Canadian Industry 1990–2003. December 23, 2004. Simon Fraser University.
Data source:Canadian Industrial Energy End-Use Data and Analysis Centre (CIEEDAC). Development of Energy Intensity Indicators for Canadian Industry 1990–2003. December 23, 2004. Simon Fraser University.
** Confidential data include: HFO (Heavy Fuel Oil), LPG (Propane) and Steam.
0.0
0.1
0.2
0.3
0.4
0.5
03’02’01’00’99’98’97’96’95’9020
21
22
23
24
25

44 2003/2004 CIPEC ANNUAL REPORT
Achievements
The cement industry produced 13.2 million
tonnes of clinker in 2003. This represents
a 25.4 percent increase in production since 1990.
Over the same period, energy consumption
increased by only 10.2 percent to 65 006 TJ.
Energy intensity, however, decreased by
12 percent from 5.61 to 4.93 GJ/tonne clinker.
Since 1998, the energy used by the industry to
produce a tonne of clinker has been fairly level,
with slight increases in some years and very
minor decreases in others.
Cement
Profile
The cement industry is the cornerstone of
Canada’s domestic construction industries and a
significant exporter that contributes substantially
to the country’s balance of payments.
’03’02’01’00’99’98’97’96’95’90
Cement Sector – NAICS 327310Energy Sources in Terajoules per Year (TJ/yr)
1990 2003
Cement Sector – NAICS 327310Energy Intensity and Physical Output (1990–2003)
Energy Intensity Clinker Production
GJ/to
nne
clin
ker
mill
ion
tonn
es
Cement Sector – NAICS 327310Energy Intensity Index (1990–2003) Base Year 1990 = 1.00
Energy Intensity Index
*** Note: 2003 data are preliminary. Electricity data reported by ICE/CIEEDAC seem high given the marginal increase in production. The production of a tonne of cement requires an amount of electricity that generally does not vary much and cannot be substituted with another source of energy. These data will be subject to further validation.
0
5 000
10 000
15 000
20 000
25 000
30 000
35 000
Conf
iden
tial**
Elec
trici
ty**
*
Nat
ural
Gas
Heav
yFu
el O
il
Mid
dle
Dist
illat
es
Was
te F
uels
Petro
leum
Coke
Coal
9
12
15
14
13
11
10
’03’02’01‘00’99’98’97’96’95’90
Data source:Canadian Industrial Energy End-Use Data and Analysis Centre (CIEEDAC). Development of Energy Intensity Indicators for Canadian Industry 1990–2003. December 23, 2004. Simon Fraser University.
Data source:Canadian Industrial Energy End-Use Data and Analysis Centre (CIEEDAC). Development of Energy Intensity Indicators for Canadian Industry 1990–2003. December 23, 2004. Simon Fraser University.
Data source:Canadian Industrial Energy End-Use Data and Analysis Centre (CIEEDAC). Development of Energy Intensity Indicators for Canadian Industry 1990–2003. December 23, 2004. Simon Fraser University.
0.50
0.75
1.00
1.25
1.50
4.0
4.5
5.0
5.5
6.0
6.5
7.0
** Confidential data include: LPG (Propane), Coal Coke, and Wood Waste.
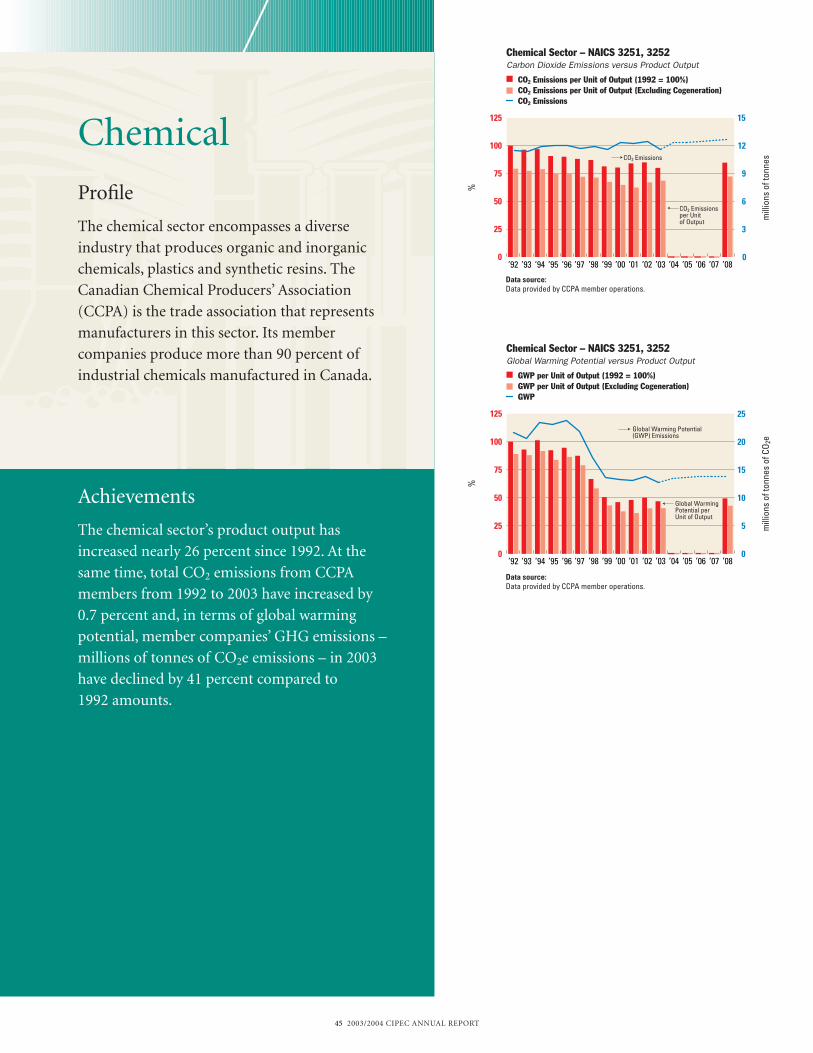
45 2003/2004 CIPEC ANNUAL REPORT
Achievements
The chemical sector’s product output has
increased nearly 26 percent since 1992. At the
same time, total CO2 emissions from CCPA
members from 1992 to 2003 have increased by
0.7 percent and, in terms of global warming
potential, member companies’ GHG emissions –
millions of tonnes of CO2e emissions – in 2003
have declined by 41 percent compared to
1992 amounts.
Chemical
Profile
The chemical sector encompasses a diverse
industry that produces organic and inorganic
chemicals, plastics and synthetic resins. The
Canadian Chemical Producers’ Association
(CCPA) is the trade association that represents
manufacturers in this sector. Its member
companies produce more than 90 percent of
industrial chemicals manufactured in Canada.
Chemical Sector – NAICS 3251, 3252Carbon Dioxide Emissions versus Product Output
CO2 Emissions per Unit of Output (1992 = 100%) CO2 Emissions per Unit of Output (Excluding Cogeneration) CO2 Emissions
CO2 Emissions
CO2 Emissionsper Unit of Output
%
mill
ions
of t
onne
s
%
mill
ions
of t
onne
s of
CO 2
e
0
25
50
75
100
125
’08’07’06’05’04’03’02’01’00’99’98’97’96’95’94’93’920
3
6
9
12
15
Global Warming Potential (GWP) Emissions
Global WarmingPotential per Unit of Output
0
5
10
15
20
25
0
25
50
75
100
125
’08’07’06’05’04’03’02’01’00’99’98’97’96’95’94’93’92
Chemical Sector – NAICS 3251, 3252Global Warming Potential versus Product Output
GWP per Unit of Output (1992 = 100%) GWP per Unit of Output (Excluding Cogeneration) GWP
Data source:Data provided by CCPA member operations.
Data source:Data provided by CCPA member operations.
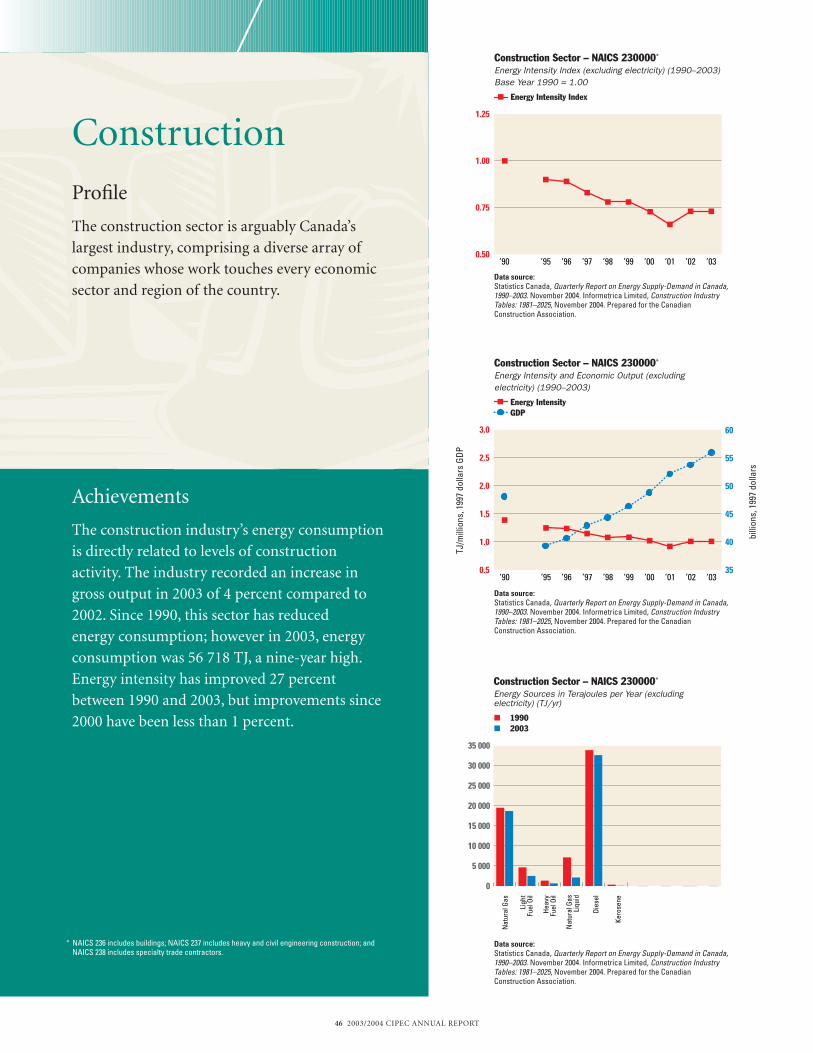
46 2003/2004 CIPEC ANNUAL REPORT
Achievements
The construction industry’s energy consumption
is directly related to levels of construction
activity. The industry recorded an increase in
gross output in 2003 of 4 percent compared to
2002. Since 1990, this sector has reduced
energy consumption; however in 2003, energy
consumption was 56 718 TJ, a nine-year high.
Energy intensity has improved 27 percent
between 1990 and 2003, but improvements since
2000 have been less than 1 percent.
Aluminum
Profile
In 2003, Canada’s aluminum sector ranked third
in the world in annual primary aluminum
production. The combined output of the
industry’s 10 aluminum plants in the province of
Quebec and one in British Columbia is a major
contributor to Canada’s national and local
economies. Although production increases have
forced the industry’s total energy usage upward,
Construction
Profile
The construction sector is arguably Canada’s
largest industry, comprising a diverse array of
companies whose work touches every economic
sector and region of the country.
Construction Sector – NAICS 230000*
Energy Sources in Terajoules per Year (excluding electricity) (TJ/yr)
1990 2003
0
5 000
10 000
15 000
20 000
25 000
30 000
35 000
Kero
sene
Dies
el
Nat
ural
Gas
Liqu
id
Heav
yFu
el O
il
Ligh
tFu
el O
il
Nat
ural
Gas
’03’02’01’00’99’98’97’96’95’90
0.50
0.75
1.00
1.25
’03’02’01’00’99’98’97’96’95’90
Construction Sector – NAICS 230000*
Energy Intensity Index (excluding electricity) (1990–2003)Base Year 1990 = 1.00
Energy Intensity Index
Data source: Statistics Canada, Quarterly Report on Energy Supply-Demand in Canada, 1990–2003. November 2004. Informetrica Limited, Construction Industry Tables: 1981–2025, November 2004. Prepared for the Canadian Construction Association.
Data source: Statistics Canada, Quarterly Report on Energy Supply-Demand in Canada, 1990–2003. November 2004. Informetrica Limited, Construction Industry Tables: 1981–2025, November 2004. Prepared for the Canadian Construction Association.
Data source: Statistics Canada, Quarterly Report on Energy Supply-Demand in Canada, 1990–2003. November 2004. Informetrica Limited, Construction Industry Tables: 1981–2025, November 2004. Prepared for the Canadian Construction Association.
Construction Sector – NAICS 230000*
Energy Intensity and Economic Output (excluding electricity) (1990–2003)
Energy Intensity GDP
0.5
1.0
1.5
2.0
2.5
3.0
35
40
45
50
55
60
TJ/m
illio
ns, 1
997
dolla
rs G
DP
billi
ons,
199
7 do
llars
* NAICS 236 includes buildings; NAICS 237 includes heavy and civil engineering construction; and NAICS 238 includes specialty trade contractors.

47 2003/2004 CIPEC ANNUAL REPORT
Achievements
In 2003, Canada’s dairies produced 70.1 million
hectolitres of milk and cream, about 4.5 percent
less than in 1990. Between 1990 and 2003,
energy intensity in the dairy sector has increased
by 11 percent. In 2003, compared to 2002,
however, there has been over 5 percent less
energy used to produce a hectolitre of milk and
cream, while production actually increased
3.5 percent.
Dairy
Profile
Canada’s dairy product manufacturing sector
spans Canada from coast to coast, operating
facilities and employing people across the country.
0
1 000
2 000
3 000
4 000
5 000
6 000
7 000
8 000
Liqu
idPe
trole
umGa
s/Pr
opan
e
Heav
yFu
el O
il
Mid
dle
Dist
illat
es
Elec
trici
ty
Nat
ural
Gas
Dairy Sector – NAICS 311500Energy Sources in Terajoules per Year (TJ/yr)
1990 2003
64
68
66
70
72
76
74
GJ/k
l milk
and
cre
am
mill
ion
hect
olitr
es
Dairy Sector – NAICS 311500Energy Intensity and Physical Output (1990–2003)
Energy Intensity Milk and Cream Production
1.4
1.5
1.6
1.7
1.8
1.9
2.0
’03’02’01’00’99’98’97’96’95’90
0.50
0.75
1.00
1.25
1.50
’03’02’01’00’99’98’97’96’95’90
Dairy Sector – NAICS 311500Energy Intensity Index (1990–2003)Base Year 1990 = 1.00
Energy Intensity Index
Data source:Canadian Industrial Energy End-Use Data and Analysis Centre (CIEEDAC). Development of Energy Intensity Indicators for Canadian Industry 1990–2003. December 23, 2004. Simon Fraser University.
Data source:Canadian Industrial Energy End-Use Data and Analysis Centre (CIEEDAC). Development of Energy Intensity Indicators for Canadian Industry 1990–2003. December 23, 2004. Simon Fraser University.
Data source:Canadian Industrial Energy End-Use Data and Analysis Centre (CIEEDAC). Development of Energy Intensity Indicators for Canadian Industry 1990–2003. December 23, 2004. Simon Fraser University.

48 2003/2004 CIPEC ANNUAL REPORT
Achievements
In nearly equal proportions, natural gas,
electricity and a combination of heavy fuel oil,
middle distillates and propane satisfy virtually all
of the electrical and electronics industry’s energy
requirements. In 2003, the industry consumed
11 542 TJ of energy, nearly the same as in the
previous two years. Between 1990 and the end of
2003, the sector’s overall energy consumption
decreased despite substantial growth in
production. These factors have combined to
decrease energy intensity by nearly 51 percent
over this period. Since 2000, however, energy
intensity has risen about 12.5 percent while
production has dropped materially.
Electrical andElectronics
Profile
The electrical and electronics sector includes
a diverse array of companies that produce
electrical appliances, lighting, consumer
electronics, communications and electronic
equipment, cabling, office equipment, industrial
equipment and other electrical products. The
industry is a major exporter and a vital, growing
contributor to the national economy.
0
2 000
4 000
6 000
8 000
10 000
12 000
Conf
iden
tial**
Nat
ural
Gas
Stea
m
Elec
trici
ty
TJ/m
illio
n, 1
997
dolla
rs G
DP
mill
ions
, 199
7 do
llars
Electrical and Electronics Sector – NAICS 334335Energy Sources in Terajoules per Year (TJ/yr)
1990 2003
Electrical and Electronics Sector – NAICS 334335Energy Intensity and Economic Output (1990–2003)
Energy Intensity GDP
0.00
0.25
0.50
0.75
1.00
1.25
1.50
’03’02’01‘00’99’98’97’96’95’90
Electrical and Electronics Sector – NAICS 334335Energy Intensity Index (1990–2003)Base Year 1990 = 1.00
Energy Intensity Index
Data source:Canadian Industrial Energy End-Use Data and Analysis Centre (CIEEDAC). Development of Energy Intensity Indicators for Canadian Industry 1990–2003. December 23, 2004. Simon Fraser University.
Data source:Canadian Industrial Energy End-Use Data and Analysis Centre (CIEEDAC). Development of Energy Intensity Indicators for Canadian Industry 1990–2003. December 23, 2004. Simon Fraser University.
Data source:Canadian Industrial Energy End-Use Data and Analysis Centre (CIEEDAC). Development of Energy Intensity Indicators for Canadian Industry 1990–2003. December 23, 2004. Simon Fraser University.
0.0
0.5
1.0
1.5
2.0
2.5
3.0
’03’02’01’00’99’98’97’96’95’900
5 000
10 000
15 000
20 000
25 000
30 000
** Confidential data include: HFO (Heavy Fuel Oil), LFO (Middle Distillates) and LPG (Propane).
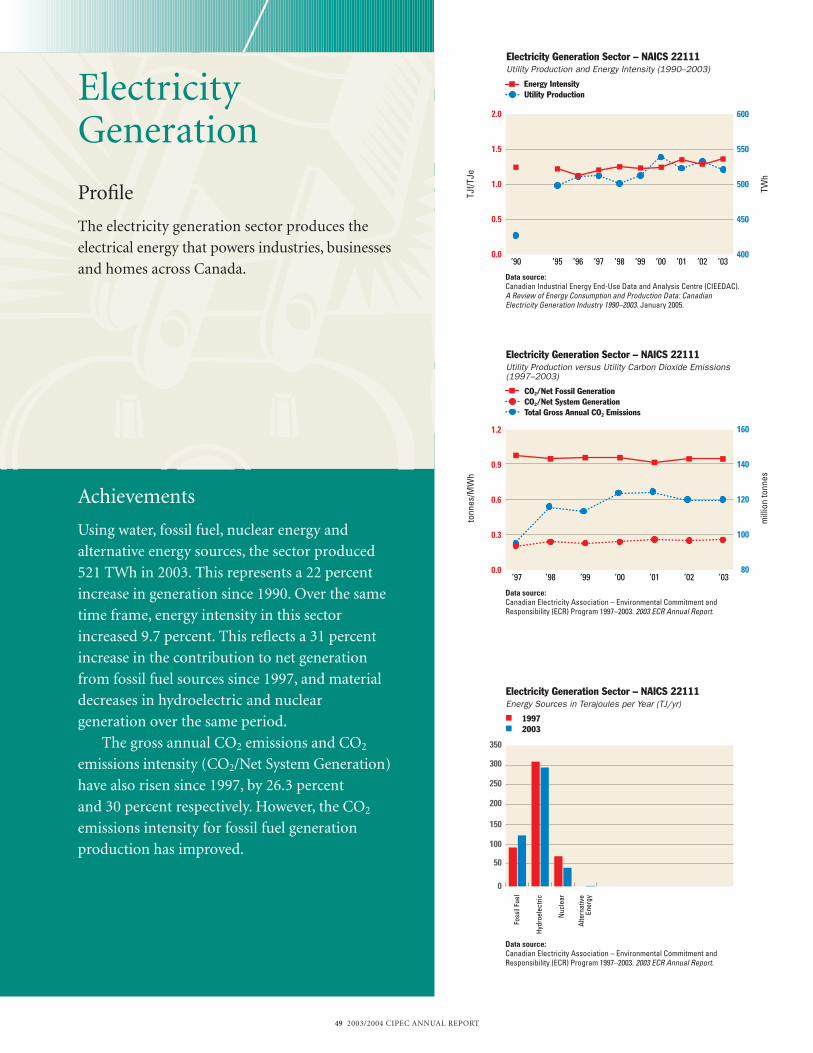
49 2003/2004 CIPEC ANNUAL REPORT
Achievements
Using water, fossil fuel, nuclear energy and
alternative energy sources, the sector produced
521 TWh in 2003. This represents a 22 percent
increase in generation since 1990. Over the same
time frame, energy intensity in this sector
increased 9.7 percent. This reflects a 31 percent
increase in the contribution to net generation
from fossil fuel sources since 1997, and material
decreases in hydroelectric and nuclear
generation over the same period.
The gross annual CO2 emissions and CO2
emissions intensity (CO2/Net System Generation)
have also risen since 1997, by 26.3 percent
and 30 percent respectively. However, the CO2
emissions intensity for fossil fuel generation
production has improved.
ElectricityGeneration
Profile
The electricity generation sector produces the
electrical energy that powers industries, businesses
and homes across Canada.
Electricity Generation Sector – NAICS 22111Utility Production versus Utility Carbon Dioxide Emissions(1997–2003)
CO2/Net Fossil Generation CO2/Net System Generation Total Gross Annual CO2 Emissions
Data source: Canadian Electricity Association – Environmental Commitment and Responsibility (ECR) Program 1997–2003. 2003 ECR Annual Report.
Data source: Canadian Industrial Energy End-Use Data and Analysis Centre (CIEEDAC).A Review of Energy Consumption and Production Data: Canadian Electricity Generation Industry 1990–2003. January 2005.
Data source: Canadian Electricity Association – Environmental Commitment and Responsibility (ECR) Program 1997–2003. 2003 ECR Annual Report.
Electricity Generation Sector – NAICS 22111Utility Production and Energy Intensity (1990–2003)
Energy Intensity Utility Production
’03’02’01’00’99’98’97’96’95’90
0
50
100
150
200
250
300
350
Alte
rnat
ive
Ene
rgy
Nuc
lear
Hydr
oele
ctric
Foss
il Fu
el
mill
ion
tonn
es
tonn
es/M
Wh
TWh
TJf/T
Je
Electricity Generation Sector – NAICS 22111Energy Sources in Terajoules per Year (TJ/yr)
1997 2003
400
450
500
550
600
0.0
0.5
1.0
1.5
2.0
0.0
0.3
0.6
0.9
1.2
’03’02’01’00’99’98 ’9780
100
120
140
160
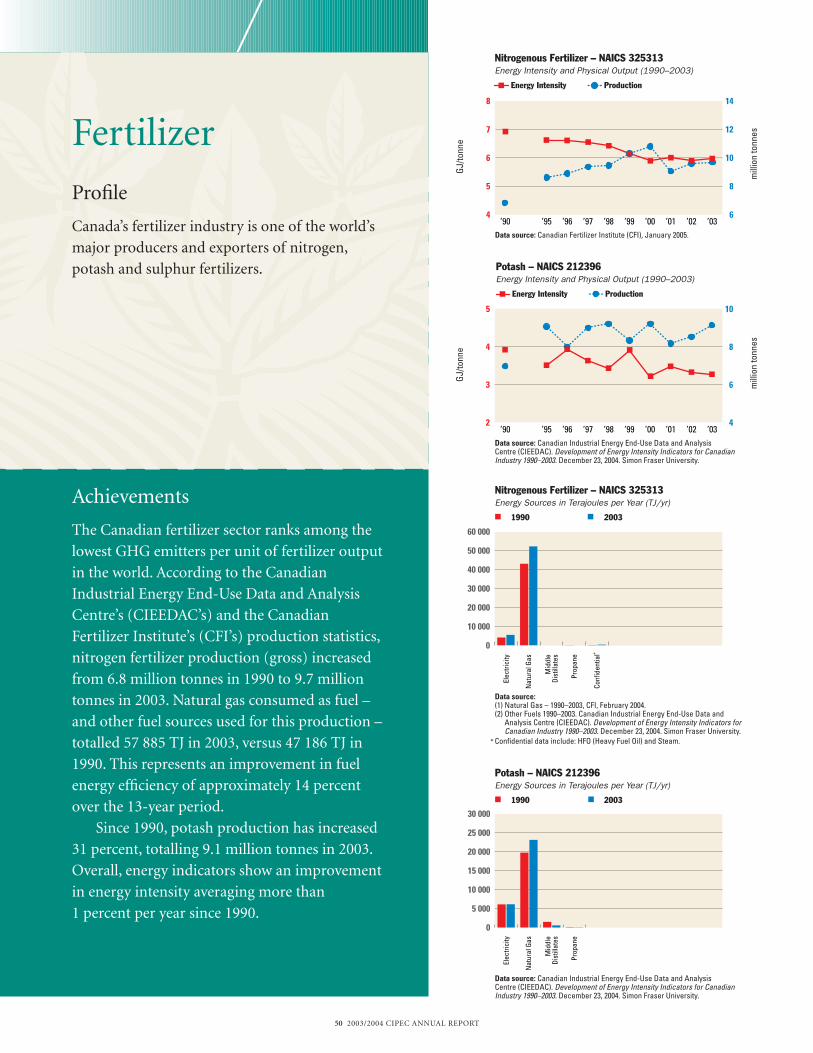
50 2003/2004 CIPEC ANNUAL REPORT
Achievements
The Canadian fertilizer sector ranks among the
lowest GHG emitters per unit of fertilizer output
in the world. According to the Canadian
Industrial Energy End-Use Data and Analysis
Centre’s (CIEEDAC’s) and the Canadian
Fertilizer Institute’s (CFI’s) production statistics,
nitrogen fertilizer production (gross) increased
from 6.8 million tonnes in 1990 to 9.7 million
tonnes in 2003. Natural gas consumed as fuel –
and other fuel sources used for this production –
totalled 57 885 TJ in 2003, versus 47 186 TJ in
1990. This represents an improvement in fuel
energy efficiency of approximately 14 percent
over the 13-year period.
Since 1990, potash production has increased
31 percent, totalling 9.1 million tonnes in 2003.
Overall, energy indicators show an improvement
in energy intensity averaging more than
1 percent per year since 1990.
Fertilizer
Profile
Canada’s fertilizer industry is one of the world’s
major producers and exporters of nitrogen,
potash and sulphur fertilizers.
Mid
dle
Dist
illat
es
Nat
ural
Gas
Elec
trici
ty
Data source: Canadian Industrial Energy End-Use Data and Analysis Centre (CIEEDAC). Development of Energy Intensity Indicators for Canadian Industry 1990–2003. December 23, 2004. Simon Fraser University.
Prop
ane
0
5 000
10 000
15 000
20 000
25 000
30 000
Mid
dle
Dist
illat
es
Nat
ural
Gas
Elec
trici
ty
Data source: (1) Natural Gas – 1990–2003, CFI, February 2004.(2) Other Fuels 1990–2003. Canadian Industrial Energy End-Use Data and Analysis Centre (CIEEDAC). Development of Energy Intensity Indicators for Canadian Industry 1990–2003. December 23, 2004. Simon Fraser University.
Prop
ane
Conf
iden
tial**
0
10 000
20 000
30 000
40 000
50 000
60 000
Data source: Canadian Industrial Energy End-Use Data and Analysis Centre (CIEEDAC). Development of Energy Intensity Indicators for Canadian Industry 1990–2003. December 23, 2004. Simon Fraser University.
GJ/to
nne
Potash – NAICS 212396Energy Intensity and Physical Output (1990–2003)
Energy Intensity Production
mill
ion
tonn
es
’03’02’01’00’99’98’97’96’95’90
** Confidential data include: HFO (Heavy Fuel Oil) and Steam.
Potash – NAICS 212396Energy Sources in Terajoules per Year (TJ/yr)
1990 2003
Nitrogenous Fertilizer – NAICS 325313Energy Sources in Terajoules per Year (TJ/yr)
1990 2003
4
6
8
10
Data source: Canadian Fertilizer Institute (CFI), January 2005.
GJ/to
nne
mill
ion
tonn
es
’03’02’01’00’99’98’97’96’95’90
Nitrogenous Fertilizer – NAICS 325313Energy Intensity and Physical Output (1990–2003)
Energy Intensity Production
6
8
10
12
14
2
3
4
5
4
5
6
7
8

51 2003/2004 CIPEC ANNUAL REPORT
Achievements
Canada’s food processing industry continued to
increase its gross output in 2003, and its energy
use actually increased slightly in 2003 compared
with the previous year. The sector’s total energy
consumption rose to 108 520 TJ in 2003
compared with 107 295 TJ in 2002 – an increase
of 1.1 percent. Over the past 13 years, the
sector’s total energy consumption increased
by 14.2 percent, from 95 001 TJ in 1990, due
largely to a significant increase in electricity
consumption. The food industry has made long-
term progress toward better energy efficiency.
From 1990 to 2003, food processors improved
their collective energy intensity by 10.4 percent.
Food and Beverage
Profile
Canada’s food and beverage sector includes
manufacturers that produce a diverse range
of products, including meat, poultry, fish, fruit
and vegetables, flour and bakery products,
oils and sugars, coffee, snack foods, soft drinks
and confections.
0
10 000
20 000
30 000
40 000
50 000
60 000
70 000
80 000
Conf
iden
tial**
Elec
trici
ty
Nat
ural
Gas
’03’02’01’00’99’98’97’96’95’90
TJ/m
illio
n, 1
997
dolla
rs G
DP
mill
ions
, 199
7 do
llars
GDP
0.50
0.75
1.00
1.25
1.50
’03’02’01’00’99’98’97’96’95’90
Food and Beverage Sector – NAICS 311000, 312100*
Energy Sources in Terajoules per Year (TJ/yr)
1990 2003
Food and Beverage Sector – NAICS 311000, 312100*
Energy Intensity and Economic Output (1990–2003)
Energy Intensity GDP
Food and Beverage Sector – NAICS 311000, 312100*
Energy Intensity Index (1990–2003)Base Year 1990 = 1.00
Energy Intensity Index
Data source:Canadian Industrial Energy End-Use Data and Analysis Centre (CIEEDAC). Development of Energy Intensity Indicators for Canadian Industry 1990–2003. December 23, 2004. Simon Fraser University.
Data source:Canadian Industrial Energy End-Use Data and Analysis Centre (CIEEDAC). Development of Energy Intensity Indicators for Canadian Industry 1990–2003. December 23, 2004. Simon Fraser University.
Data source:Canadian Industrial Energy End-Use Data and Analysis Centre (CIEEDAC). Development of Energy Intensity Indicators for Canadian Industry 1990–2003. December 23, 2004. Simon Fraser University.
** Confidential data include: HFO (Heavy Fuel Oil), LFO (Middle Distillates), LPG (Propane), Steam and Wood.
3
4
5
6
7
8
9
15 000
16 000
17 000
18 000
19 000
20 000
21 000
* NAICS 311000 – Food manufacturing NAICS 312100 – Beverage and Tobacco Product Manufacturing, Beverage Product Manufacturing.
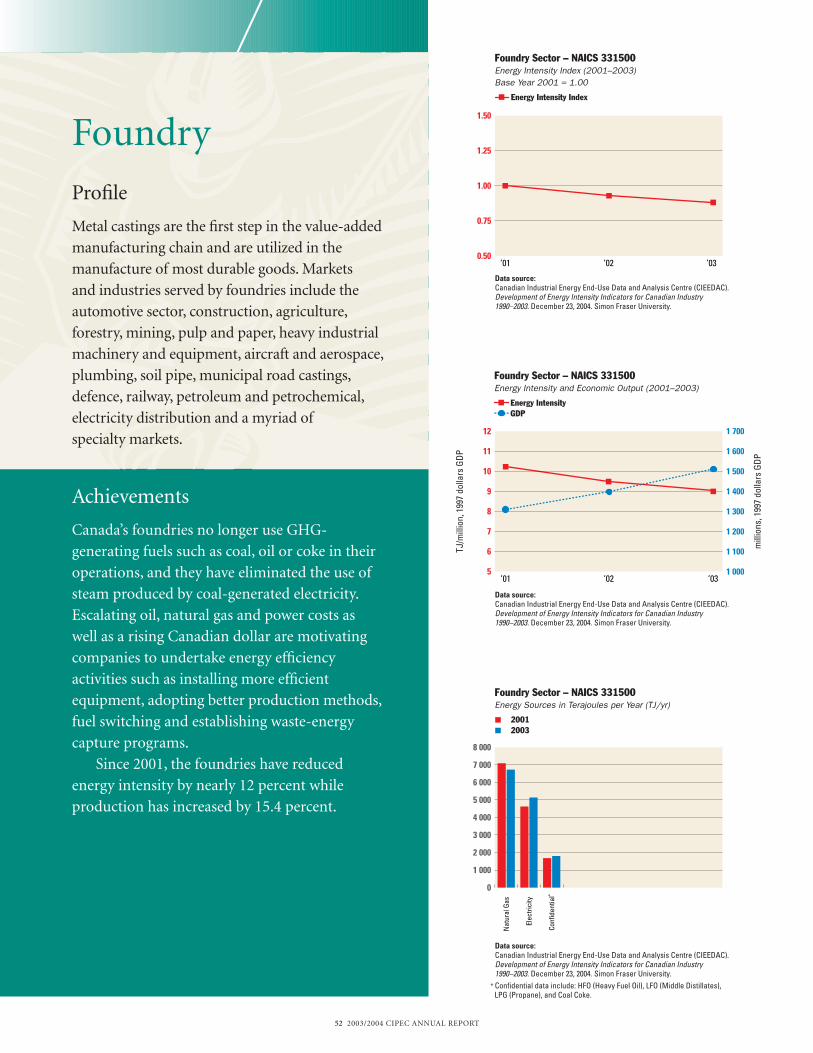
52 2003/2004 CIPEC ANNUAL REPORT
Achievements
Canada’s foundries no longer use GHG-
generating fuels such as coal, oil or coke in their
operations, and they have eliminated the use of
steam produced by coal-generated electricity.
Escalating oil, natural gas and power costs as
well as a rising Canadian dollar are motivating
companies to undertake energy efficiency
activities such as installing more efficient
equipment, adopting better production methods,
fuel switching and establishing waste-energy
capture programs.
Since 2001, the foundries have reduced
energy intensity by nearly 12 percent while
production has increased by 15.4 percent.
Foundry
Profile
Metal castings are the first step in the value-added
manufacturing chain and are utilized in the
manufacture of most durable goods. Markets
and industries served by foundries include the
automotive sector, construction, agriculture,
forestry, mining, pulp and paper, heavy industrial
machinery and equipment, aircraft and aerospace,
plumbing, soil pipe, municipal road castings,
defence, railway, petroleum and petrochemical,
electricity distribution and a myriad of
specialty markets.
0
1 000
2 000
3 000
4 000
5 000
6 000
7 000
8 000
Conf
iden
tial**
Elec
trici
ty
Nat
ural
Gas
5
6
7
8
9
10
11
12
’03’02’011 000
1 100
1 200
1 300
1 400
1 500
1 600
1 700
TJ/m
illio
n, 1
997
dolla
rs G
DP
mill
ions
, 199
7 do
llars
GDP
0.50
0.75
1.00
1.25
1.50
’03’02’01
Foundry Sector – NAICS 331500Energy Sources in Terajoules per Year (TJ/yr)
2001 2003
Foundry Sector – NAICS 331500Energy Intensity and Economic Output (2001–2003)
Energy Intensity GDP
Foundry Sector – NAICS 331500Energy Intensity Index (2001–2003)Base Year 2001 = 1.00
Energy Intensity Index
Data source:Canadian Industrial Energy End-Use Data and Analysis Centre (CIEEDAC). Development of Energy Intensity Indicators for Canadian Industry 1990–2003. December 23, 2004. Simon Fraser University.
Data source:Canadian Industrial Energy End-Use Data and Analysis Centre (CIEEDAC). Development of Energy Intensity Indicators for Canadian Industry 1990–2003. December 23, 2004. Simon Fraser University.
Data source:Canadian Industrial Energy End-Use Data and Analysis Centre (CIEEDAC). Development of Energy Intensity Indicators for Canadian Industry 1990–2003. December 23, 2004. Simon Fraser University.
** Confidential data include: HFO (Heavy Fuel Oil), LFO (Middle Distillates), LPG (Propane), and Coal Coke.
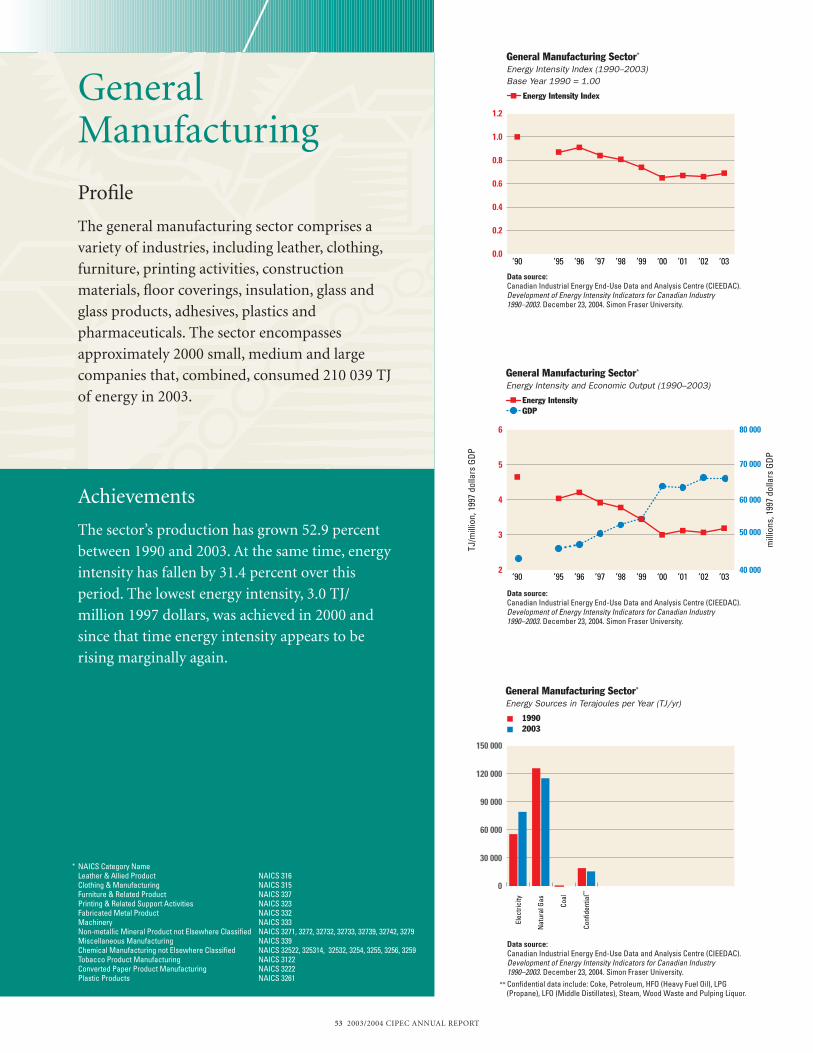
Achievements
The sector’s production has grown 52.9 percent
between 1990 and 2003. At the same time, energy
intensity has fallen by 31.4 percent over this
period. The lowest energy intensity, 3.0 TJ/
million 1997 dollars, was achieved in 2000 and
since that time energy intensity appears to be
rising marginally again.
GeneralManufacturing
Profile
The general manufacturing sector comprises a
variety of industries, including leather, clothing,
furniture, printing activities, construction
materials, floor coverings, insulation, glass and
glass products, adhesives, plastics and
pharmaceuticals. The sector encompasses
approximately 2000 small, medium and large
companies that, combined, consumed 210 039 TJ
of energy in 2003.
0.0
0.2
0.4
0.6
0.8
1.0
1.2
** Confidential data include: Coke, Petroleum, HFO (Heavy Fuel Oil), LPG (Propane), LFO (Middle Distillates), Steam, Wood Waste and Pulping Liquor.
Data source:Canadian Industrial Energy End-Use Data and Analysis Centre (CIEEDAC). Development of Energy Intensity Indicators for Canadian Industry 1990–2003. December 23, 2004. Simon Fraser University.
Data source:Canadian Industrial Energy End-Use Data and Analysis Centre (CIEEDAC). Development of Energy Intensity Indicators for Canadian Industry 1990–2003. December 23, 2004. Simon Fraser University.
Data source:Canadian Industrial Energy End-Use Data and Analysis Centre (CIEEDAC). Development of Energy Intensity Indicators for Canadian Industry 1990–2003. December 23, 2004. Simon Fraser University.
’03’02’01‘00’99’98’97’96’95’90
General Manufacturing Sector*
Energy Intensity Index (1990–2003) Base Year 1990 = 1.00
Energy Intensity Index
40 000
60 000
80 000
70 000
50 000
General Manufacturing Sector*
Energy Intensity and Economic Output (1990–2003)
Energy Intensity GDP
’03’02’01‘00’99’98’97’96’95’90
TJ/m
illio
n, 1
997
dolla
rs G
DP
mill
ions
, 199
7 do
llars
GDP
General Manufacturing Sector*
Energy Sources in Terajoules per Year (TJ/yr)
1990 2003
0
30 000
60 000
90 000
120 000
150 000
Conf
iden
tial**
Coal
Nat
ural
Gas
Elec
trici
ty
2
3
4
5
6
* NAICS Category NameLeather & Allied Product NAICS 316Clothing & Manufacturing NAICS 315Furniture & Related Product NAICS 337Printing & Related Support Activities NAICS 323Fabricated Metal Product NAICS 332Machinery NAICS 333Non-metallic Mineral Product not Elsewhere Classified NAICS 3271, 3272, 32732, 32733, 32739, 32742, 3279Miscellaneous Manufacturing NAICS 339Chemical Manufacturing not Elsewhere Classified NAICS 32522, 325314, 32532, 3254, 3255, 3256, 3259Tobacco Product Manufacturing NAICS 3122Converted Paper Product Manufacturing NAICS 3222Plastic Products NAICS 3261
53 2003/2004 CIPEC ANNUAL REPORT

54 2003/2004 CIPEC ANNUAL REPORT
Achievements
Companies in the merchant lime sector
represented by the Canadian Lime Institute
continue to work actively to improve the energy
efficiency of their operations. According to
energy data available in 2003, it took 13 642 TJ
of energy to produce 2050 kilotonnes of lime.
This compares with 14 813 TJ and 2073 kilotonnes
in 2002 and 15 526 TJ and 1848 kilotonnes in
1990. Total energy consumption decreased
by 1884 TJ between 1990 and 2003, and energy
intensity decreased by 20.7 percent.
Lime
Profile
Canada’s merchant lime sector supplies
essential raw materials for the steel and mining
industry, the pulp and paper industry, water
treatment, environmental management and
other basic industries.
** Confidential data include: HFO (Heavy Fuel Oil), LFO (Middle Distillates), LPG (Propane) and Coal Coke.
0
1 000
2 000
3 000
4 000
5 000
6 000
7 000
8 000
9 000
Conf
iden
tial**
Petro
leum
Cok
e
Coal
Elec
trici
ty
Nat
ural
Gas
GJ/to
nne
lime
kilo
tonn
es li
me
0.50
0.75
1.00
1.25
1.50
’03’02’01’00’99’98’97’96’95’90
Lime Sector – NAICS 327410Energy Sources in Terajoules per Year (TJ/yr)
1990 2003
Data source:Canadian Industrial Energy End-Use Data and Analysis Centre (CIEEDAC). Development of Energy Intensity Indicators for Canadian Industry 1990–2003. December 23, 2004. Simon Fraser University.
Data source:Canadian Industrial Energy End-Use Data and Analysis Centre (CIEEDAC). Development of Energy Intensity Indicators for Canadian Industry 1990–2003. December 23, 2004. Simon Fraser University.
Data source:Canadian Industrial Energy End-Use Data and Analysis Centre (CIEEDAC). Development of Energy Intensity Indicators for Canadian Industry 1990–2003. December 23, 2004. Simon Fraser University.
Lime Sector – NAICS 327410Energy Intensity and Physical Output (1990–2003)
Energy Intensity Lime Production
Lime Sector – NAICS 327410Energy Intensity Index (1990–2003)Base Year 1990 = 1.00
Energy Intensity Index
1 500
1 700
1 900
2 100
2 300
2 500
6.0
6.5
7.0
7.5
8.0
8.5
’03’02’01’00’99’98’97’96’95’90
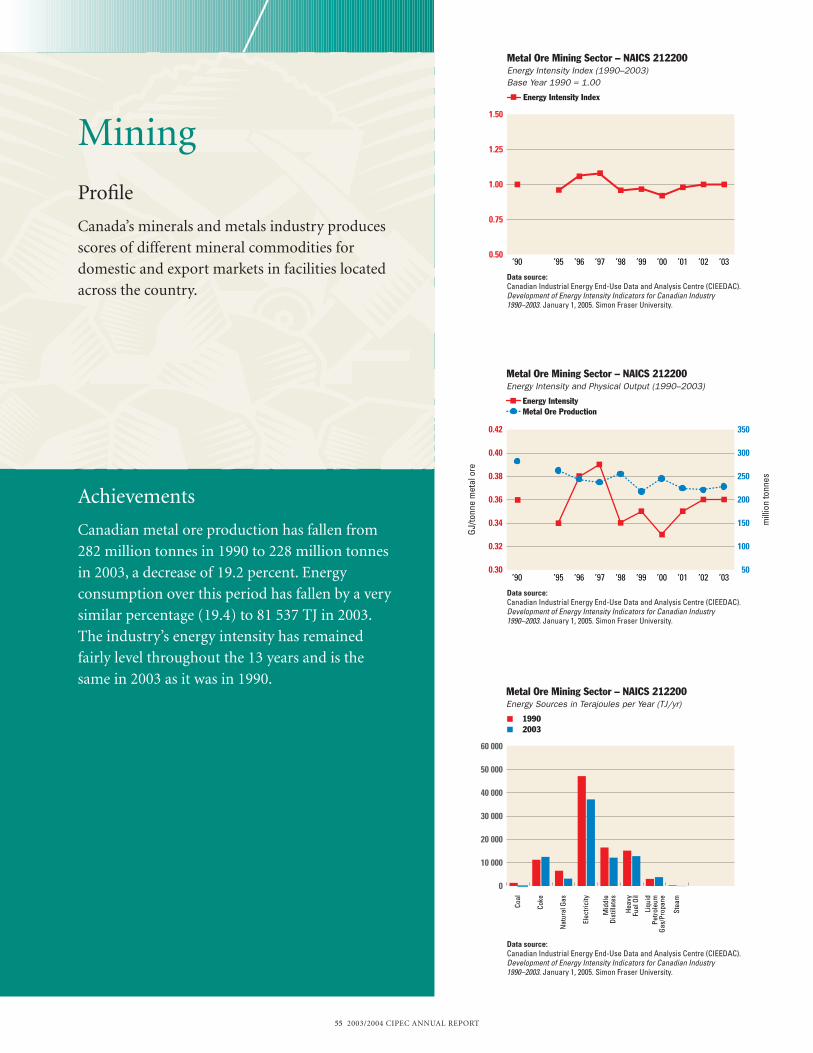
55 2003/2004 CIPEC ANNUAL REPORT
Achievements
Canadian metal ore production has fallen from
282 million tonnes in 1990 to 228 million tonnes
in 2003, a decrease of 19.2 percent. Energy
consumption over this period has fallen by a very
similar percentage (19.4) to 81 537 TJ in 2003.
The industry’s energy intensity has remained
fairly level throughout the 13 years and is the
same in 2003 as it was in 1990.
Mining
Profile
Canada’s minerals and metals industry produces
scores of different mineral commodities for
domestic and export markets in facilities located
across the country.
0
10 000
20 000
30 000
40 000
50 000
60 000
Stea
m
Liqu
idPe
trole
umGa
s/Pr
opan
e
Heav
yFu
el O
il
Mid
dle
Dist
illat
es
Elec
trici
ty
Nat
ural
Gas
Coke
Coal
50
100
150
200
250
300
350
0.30
0.32
0.34
0.36
0.38
0.40
0.42
’03’02’01’00’99’98’97’96’95’90
GJ/to
nne
met
al o
re
mill
ion
tonn
es
0.50
0.75
1.00
1.25
1.50
’03’02’01’00’99’98’97’96’95’90
Metal Ore Mining Sector – NAICS 212200Energy Sources in Terajoules per Year (TJ/yr)
1990 2003
Metal Ore Mining Sector – NAICS 212200Energy Intensity and Physical Output (1990–2003)
Energy Intensity Metal Ore Production
Metal Ore Mining Sector – NAICS 212200Energy Intensity Index (1990–2003)Base Year 1990 = 1.00
Energy Intensity Index
Data source:Canadian Industrial Energy End-Use Data and Analysis Centre (CIEEDAC). Development of Energy Intensity Indicators for Canadian Industry 1990–2003. January 1, 2005. Simon Fraser University.
Data source:Canadian Industrial Energy End-Use Data and Analysis Centre (CIEEDAC). Development of Energy Intensity Indicators for Canadian Industry 1990–2003. January 1, 2005. Simon Fraser University.
Data source:Canadian Industrial Energy End-Use Data and Analysis Centre (CIEEDAC). Development of Energy Intensity Indicators for Canadian Industry 1990–2003. January 1, 2005. Simon Fraser University.
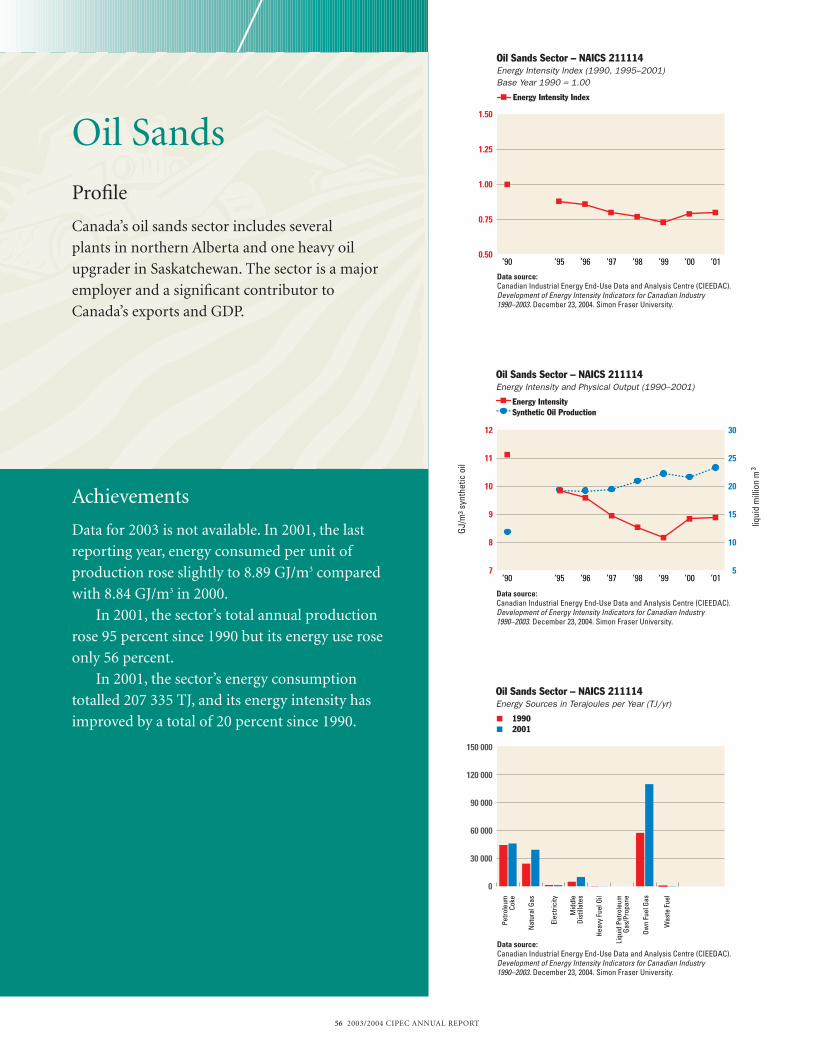
56 2003/2004 CIPEC ANNUAL REPORT
Achievements
Data for 2003 is not available. In 2001, the last
reporting year, energy consumed per unit of
production rose slightly to 8.89 GJ/m3 compared
with 8.84 GJ/m3 in 2000.
In 2001, the sector’s total annual production
rose 95 percent since 1990 but its energy use rose
only 56 percent.
In 2001, the sector’s energy consumption
totalled 207 335 TJ, and its energy intensity has
improved by a total of 20 percent since 1990.
Oil Sands
Profile
Canada’s oil sands sector includes several
plants in northern Alberta and one heavy oil
upgrader in Saskatchewan. The sector is a major
employer and a significant contributor to
Canada’s exports and GDP.
Data source: Canadian Industrial Energy End-Use Data and Analysis Centre (CIEEDAC). Development of Energy Intensity Indicators for Canadian Industry 1990–2003. December 23, 2004. Simon Fraser University.
Data source: Canadian Industrial Energy End-Use Data and Analysis Centre (CIEEDAC). Development of Energy Intensity Indicators for Canadian Industry 1990–2003. December 23, 2004. Simon Fraser University.
Data source: Canadian Industrial Energy End-Use Data and Analysis Centre (CIEEDAC). Development of Energy Intensity Indicators for Canadian Industry 1990–2003. December 23, 2004. Simon Fraser University.
Oil Sands Sector – NAICS 211114Energy Intensity Index (1990, 1995–2001)Base Year 1990 = 1.00
Energy Intensity Index
Oil Sands Sector – NAICS 211114Energy Intensity and Physical Output (1990–2001)
Energy Intensity Synthetic Oil Production
GJ/
m3 s
ynth
etic
oil
liqui
d m
illio
n m
Oil Sands Sector – NAICS 211114Energy Sources in Terajoules per Year (TJ/yr)
1990 2001
3
0.50
0.75
1.00
1.25
1.50
’01’00’99’98’97’96’95’90
7
8
9
10
11
12
’01’00’99’98’97’96’95’905
10
15
20
25
30
0
30 000
60 000
90 000
120 000
150 000
Was
te F
uel
Ow
n Fu
el G
as
Liqu
id P
etro
leum
G
as/P
ropa
ne
Hea
vy F
uel O
il
Mid
dle
Dis
tilla
tes
Elec
tric
ity
Nat
ural
Gas
Petr
oleu
mCo
ke
48279_guts_eng 5/13/05 10:55 AM Page 56
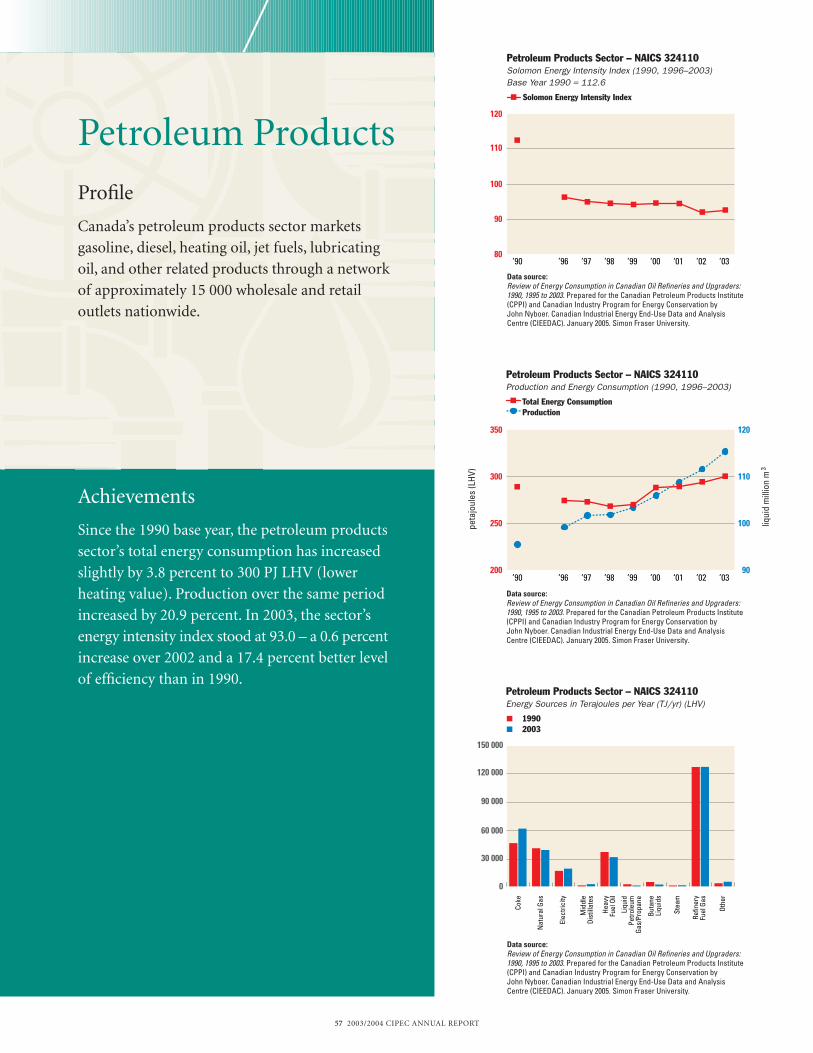
57 2003/2004 CIPEC ANNUAL REPORT
Achievements
Since the 1990 base year, the petroleum products
sector’s total energy consumption has increased
slightly by 3.8 percent to 300 PJ LHV (lower
heating value). Production over the same period
increased by 20.9 percent. In 2003, the sector’s
energy intensity index stood at 93.0 – a 0.6 percent
increase over 2002 and a 17.4 percent better level
of efficiency than in 1990.
Petroleum Products
Profile
Canada’s petroleum products sector markets
gasoline, diesel, heating oil, jet fuels, lubricating
oil, and other related products through a network
of approximately 15 000 wholesale and retail
outlets nationwide.
Data source: Review of Energy Consumption in Canadian Oil Refineries and Upgraders: 1990, 1995 to 2003. Prepared for the Canadian Petroleum Products Institute (CPPI) and Canadian Industry Program for Energy Conservation by John Nyboer. Canadian Industrial Energy End-Use Data and Analysis Centre (CIEEDAC). January 2005. Simon Fraser University.
Data source: Review of Energy Consumption in Canadian Oil Refineries and Upgraders: 1990, 1995 to 2003. Prepared for the Canadian Petroleum Products Institute (CPPI) and Canadian Industry Program for Energy Conservation by John Nyboer. Canadian Industrial Energy End-Use Data and Analysis Centre (CIEEDAC). January 2005. Simon Fraser University.
Data source: Review of Energy Consumption in Canadian Oil Refineries and Upgraders: 1990, 1995 to 2003. Prepared for the Canadian Petroleum Products Institute (CPPI) and Canadian Industry Program for Energy Conservation by John Nyboer. Canadian Industrial Energy End-Use Data and Analysis Centre (CIEEDAC). January 2005. Simon Fraser University.
80
100
120
Petroleum Products Sector – NAICS 324110Solomon Energy Intensity Index (1990, 1996–2003) Base Year 1990 = 112.6
Solomon Energy Intensity Index
Petroleum Products Sector – NAICS 324110Production and Energy Consumption (1990, 1996–2003)
Total Energy Consumption Production
0
30 000
60 000
90 000
120 000
150 000
peta
joul
es (L
HV)
liqui
d m
illio
n m
Petroleum Products Sector – NAICS 324110Energy Sources in Terajoules per Year (TJ/yr) (LHV)
1990 2003
3
Othe
r
Refin
ery
Fue
l Gas
Stea
m
Buta
ne L
iqui
ds
Heav
yFu
el O
il
Mid
dle
Dist
illat
es
Elec
trici
ty
Nat
ural
Gas
Coke
Liqu
idPe
trole
umGa
s/Pr
opan
e
110
90
’03’02‘01’00’99’98’97’96’90
’03’02‘01’00’99’98’97’96’9090
100
110
120
200
250
300
350
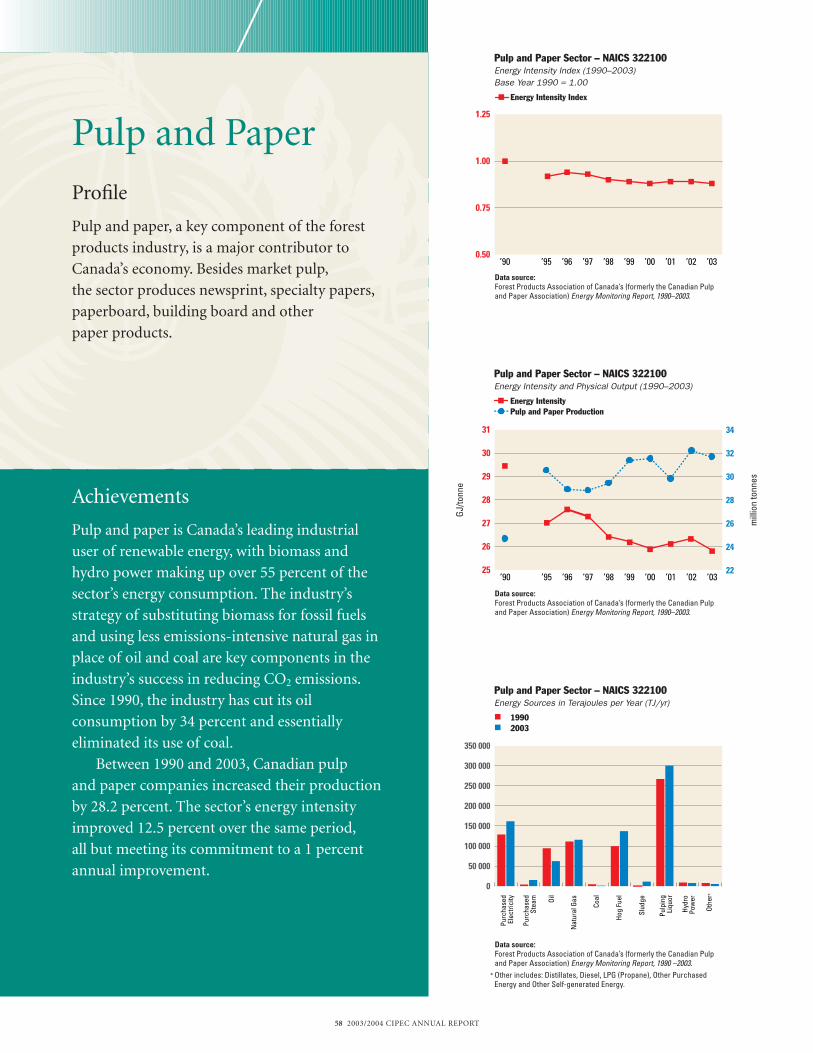
58 2003/2004 CIPEC ANNUAL REPORT
Achievements
Pulp and paper is Canada’s leading industrial
user of renewable energy, with biomass and
hydro power making up over 55 percent of the
sector’s energy consumption. The industry’s
strategy of substituting biomass for fossil fuels
and using less emissions-intensive natural gas in
place of oil and coal are key components in the
industry’s success in reducing CO2 emissions.
Since 1990, the industry has cut its oil
consumption by 34 percent and essentially
eliminated its use of coal.
Between 1990 and 2003, Canadian pulp
and paper companies increased their production
by 28.2 percent. The sector’s energy intensity
improved 12.5 percent over the same period,
all but meeting its commitment to a 1 percent
annual improvement.
Pulp and Paper
Profile
Pulp and paper, a key component of the forest
products industry, is a major contributor to
Canada’s economy. Besides market pulp,
the sector produces newsprint, specialty papers,
paperboard, building board and other
paper products.
** Other includes: Distillates, Diesel, LPG (Propane), Other Purchased Energy and Other Self-generated Energy.
Pulp and Paper Sector – NAICS 322100Energy Sources in Terajoules per Year (TJ/yr)
1990 2003
0
50 000
100 000
150 000
200 000
250 000
300 000
350 000
Othe
r**
Hydr
oPo
wer
Pulp
ing
Liqu
or
Slud
ge
Hog
Fuel
Coal
Nat
ural
GasO
il
Purc
hase
dSt
eam
Purc
hase
dEl
ectri
city
25
26
27
28
29
30
31
’03’02’01’00’99’98’97’96’95’90
Pulp and Paper Sector – NAICS 322100Energy Intensity and Physical Output (1990–2003)
Energy Intensity Pulp and Paper Production
GJ/to
nne
mill
ion
tonn
es
Data source: Forest Products Association of Canada’s (formerly the Canadian Pulp and Paper Association) Energy Monitoring Report, 1990 –2003.
Data source: Forest Products Association of Canada’s (formerly the Canadian Pulp and Paper Association) Energy Monitoring Report, 1990–2003.
Data source: Forest Products Association of Canada’s (formerly the Canadian Pulp and Paper Association) Energy Monitoring Report, 1990–2003.
0.50
0.75
1.00
1.25
’03’02’01’00’99’98’97’96’95’90
Pulp and Paper Sector – NAICS 322100Energy Intensity Index (1990–2003)Base Year 1990 = 1.00
Energy Intensity Index
22
24
26
28
30
32
34
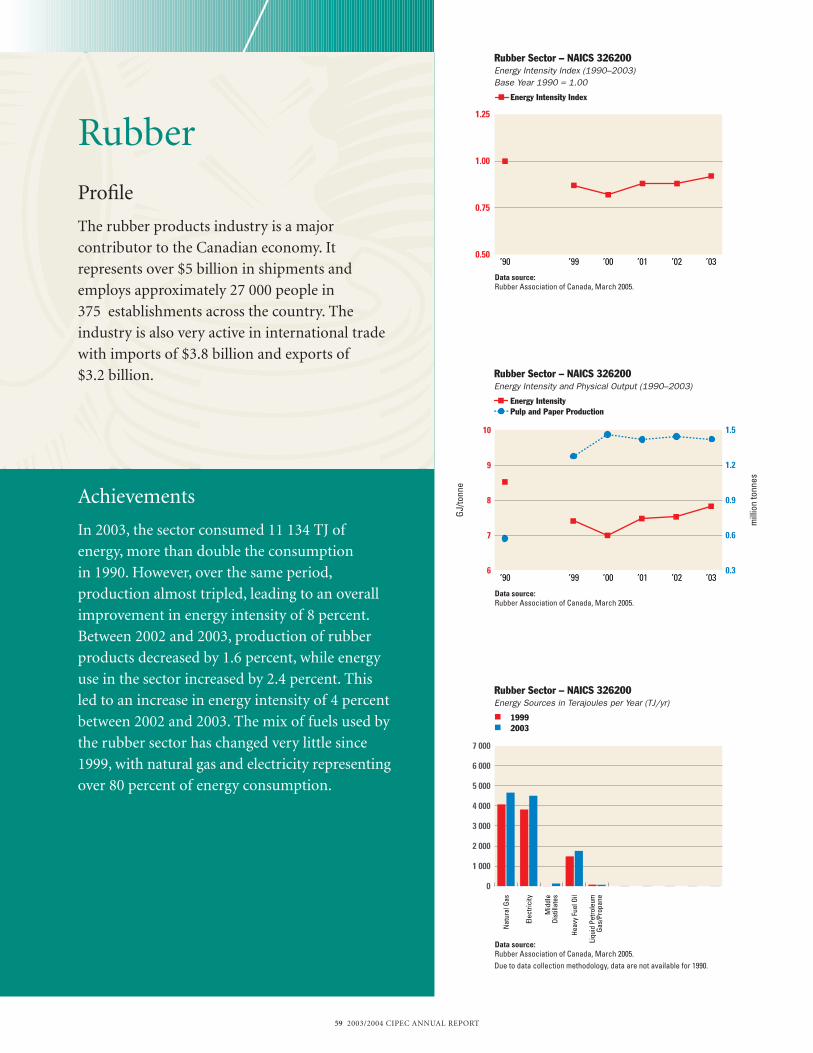
59 2003/2004 CIPEC ANNUAL REPORT
Achievements
In 2003, the sector consumed 11 134 TJ of
energy, more than double the consumption
in 1990. However, over the same period,
production almost tripled, leading to an overall
improvement in energy intensity of 8 percent.
Between 2002 and 2003, production of rubber
products decreased by 1.6 percent, while energy
use in the sector increased by 2.4 percent. This
led to an increase in energy intensity of 4 percent
between 2002 and 2003. The mix of fuels used by
the rubber sector has changed very little since
1999, with natural gas and electricity representing
over 80 percent of energy consumption.
Rubber
Profile
The rubber products industry is a major
contributor to the Canadian economy. It
represents over $5 billion in shipments and
employs approximately 27 000 people in
375 establishments across the country. The
industry is also very active in international trade
with imports of $3.8 billion and exports of
$3.2 billion.
Due to data collection methodology, data are not available for 1990.
Rubber Sector – NAICS 326200Energy Sources in Terajoules per Year (TJ/yr)
1999 2003
Rubber Sector – NAICS 326200Energy Intensity and Physical Output (1990–2003)
Energy Intensity Pulp and Paper Production
GJ/to
nne
mill
ion
tonn
es
Data source: Rubber Association of Canada, March 2005.
Data source: Rubber Association of Canada, March 2005.
Data source: Rubber Association of Canada, March 2005.
0.50
0.75
1.00
1.25
’03’02’01’00’99’90
Rubber Sector – NAICS 326200Energy Intensity Index (1990–2003)Base Year 1990 = 1.00
Energy Intensity Index
6
7
8
9
10
0.3
0.6
0.9
1.2
1.5
’03’02’01’00’99’90
0
1 000
2 000
3 000
4 000
5 000
6 000
7 000
Liqu
id P
etro
leum
Ga
s/Pr
opan
e
Heav
y Fu
el O
il
Mid
dle
Dist
illat
es
Elec
trici
ty
Nat
ural
Gas
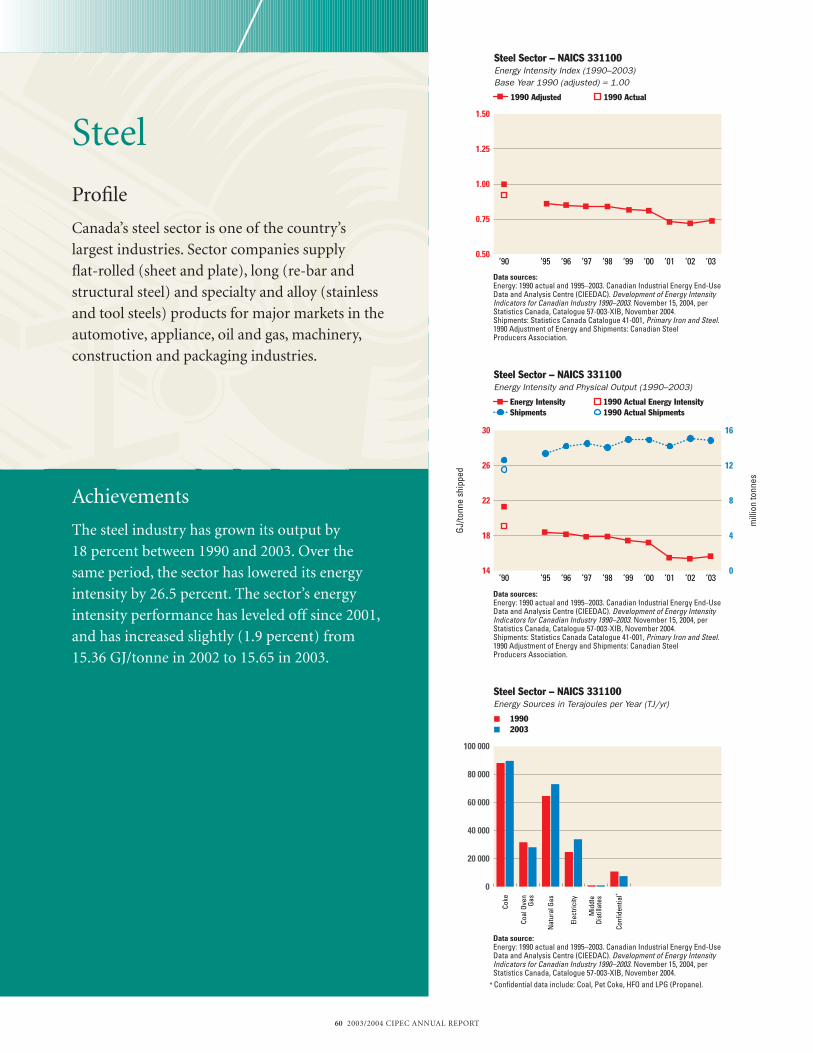
60 2003/2004 CIPEC ANNUAL REPORT
Achievements
The steel industry has grown its output by
18 percent between 1990 and 2003. Over the
same period, the sector has lowered its energy
intensity by 26.5 percent. The sector’s energy
intensity performance has leveled off since 2001,
and has increased slightly (1.9 percent) from
15.36 GJ/tonne in 2002 to 15.65 in 2003.
Steel
Profile
Canada’s steel sector is one of the country’s
largest industries. Sector companies supply
flat-rolled (sheet and plate), long (re-bar and
structural steel) and specialty and alloy (stainless
and tool steels) products for major markets in the
automotive, appliance, oil and gas, machinery,
construction and packaging industries.
Steel Sector – NAICS 331100Energy Sources in Terajoules per Year (TJ/yr)
1990 2003
Mid
dle
Dist
illat
es
Elec
trici
ty
Nat
ural
Gas
Coal
Ove
nGa
s
Coke
14
18
22
26
30
’03’02’01’00’99’98’97’96’95’90
Steel Sector – NAICS 331100Energy Intensity and Physical Output (1990–2003)
Energy Intensity 1990 Actual Energy Intensity Shipments 1990 Actual Shipments
GJ/to
nne
ship
ped
mill
ion
tonn
es
Data source: Energy: 1990 actual and 1995–2003. Canadian Industrial Energy End-Use Data and Analysis Centre (CIEEDAC). Development of Energy Intensity Indicators for Canadian Industry 1990–2003. November 15, 2004, per Statistics Canada, Catalogue 57-003-XIB, November 2004.
Data sources: Energy: 1990 actual and 1995–2003. Canadian Industrial Energy End-Use Data and Analysis Centre (CIEEDAC). Development of Energy Intensity Indicators for Canadian Industry 1990–2003. November 15, 2004, per Statistics Canada, Catalogue 57-003-XIB, November 2004.Shipments: Statistics Canada Catalogue 41-001, Primary Iron and Steel. 1990 Adjustment of Energy and Shipments: Canadian Steel Producers Association.
Data sources: Energy: 1990 actual and 1995–2003. Canadian Industrial Energy End-Use Data and Analysis Centre (CIEEDAC). Development of Energy Intensity Indicators for Canadian Industry 1990–2003. November 15, 2004, per Statistics Canada, Catalogue 57-003-XIB, November 2004.Shipments: Statistics Canada Catalogue 41-001, Primary Iron and Steel. 1990 Adjustment of Energy and Shipments: Canadian Steel Producers Association.
0.50
0.75
1.00
1.25
1.50
’03’02’01’00’99’98’97’96’95’90
Steel Sector – NAICS 331100Energy Intensity Index (1990–2003)Base Year 1990 (adjusted) = 1.00
1990 Adjusted 1990 Actual
0
20 000
40 000
60 000
80 000
100 000
Conf
iden
tial**
0
4
8
12
16
** Confidential data include: Coal, Pet Coke, HFO and LPG (Propane).

Textiles
Profile
Canada’s textile industry produces the fibres,
yarns, fabrics and textile articles purchased by
users and customers as diverse as automotive
manufacturing, clothing, construction,
environmental protection, road building
and retail.
** Confidential data include: LFO (Middle Distillates), LPG (Liquid Propane), and Steam.
Textiles Sector – NAICS 313, 314*
Energy Sources in Terajoules per Year (TJ/yr)
1990 2003
0
3 000
6 000
9 000
12 000
15 000
Conf
iden
tial**
Heav
yFu
el O
il
Elec
trici
ty
Nat
ural
Gas
Textiles Sector – NAICS 313, 314*
Energy Intensity and Economic Output (1990–2003)
Energy Intensity Output GDP
TJ/m
illio
n, 1
997
dolla
rs G
DP
mill
ions
, 199
7 do
llars
Data source: Canadian Industrial Energy End-Use Data and Analysis Centre (CIEEDAC). Development of Energy Intensity Indicators for Canadian Industry 1990–2003. December 23, 2004. Simon Fraser University.
Data source: Canadian Industrial Energy End-Use Data and Analysis Centre (CIEEDAC). Development of Energy Intensity Indicators for Canadian Industry 1990–2003. December 23, 2004. Simon Fraser University.
Data source: Canadian Industrial Energy End-Use Data and Analysis Centre (CIEEDAC). Development of Energy Intensity Indicators for Canadian Industry 1990–2003. December 23, 2004. Simon Fraser University.
0.50
0.75
1.00
1.25
1.50
’03’02’01’00’99’98’97’96’95’90
Textiles Sector – NAICS 313, 314*
Energy Intensity Index (1990–2003)Base Year 1990 = 1.00
Energy Intensity Index
1 000
1 500
2 000
2 500
3 000
4
6
8
10
12
’03’02’01’00’99’98’97’96’95’90
* The new North American Industry Classification System (NAICS) classifies textile producers underArtificial and Synthetic Fibres/Filaments Manufacturing (NAICS 32522), Textile Mills (NAICS 313) andTextile Product Mills (NAICS 314). NAICS sub-group 32522 includes producers of synthetic fibres andfilaments. NAICS Group 313 comprises establishments that are primarily engaged in manufacturing,finishing or processing yarn or fabrics. NAICS Group 314 includes establishments primarily engagedin manufacturing textile products (except clothing) such as carpets, household textiles, etc. Changesto the classification of industries by Statistics Canada from the Standard Industrial Classification (SIC)to NAICS mean that energy data for the synthetic fibre and filament yarn industries are no longeravailable separately. The statistics contained in this profile cover only NAICS Groups 313 and 314 asdescribed above.
61 2003/2004 CIPEC ANNUAL REPORT
Achievements
The textile industry improved its energy intensity
by 35 percent between 1990 and 2003. The
sector’s actual energy use dropped by 36 percent
during the same period, with a slight decrease
in the industry’s GDP. Since 2000, when the
sector’s energy intensity reached a 13-year low
of 5.53 TJ/million 1997 dollars, it has again risen
by nearly 5 percent to 6.03 TJ/million in 2003.
The Textiles Sector Task Force remains committed
to an energy intensity reduction target of
1 percent per year through 2010. To meet this
goal, the industry will build on its significant
success in improving energy efficiency in recent
years and will continue its ongoing consultations
with governments and other stakeholders to
help Canada meet its Kyoto Protocol goals.
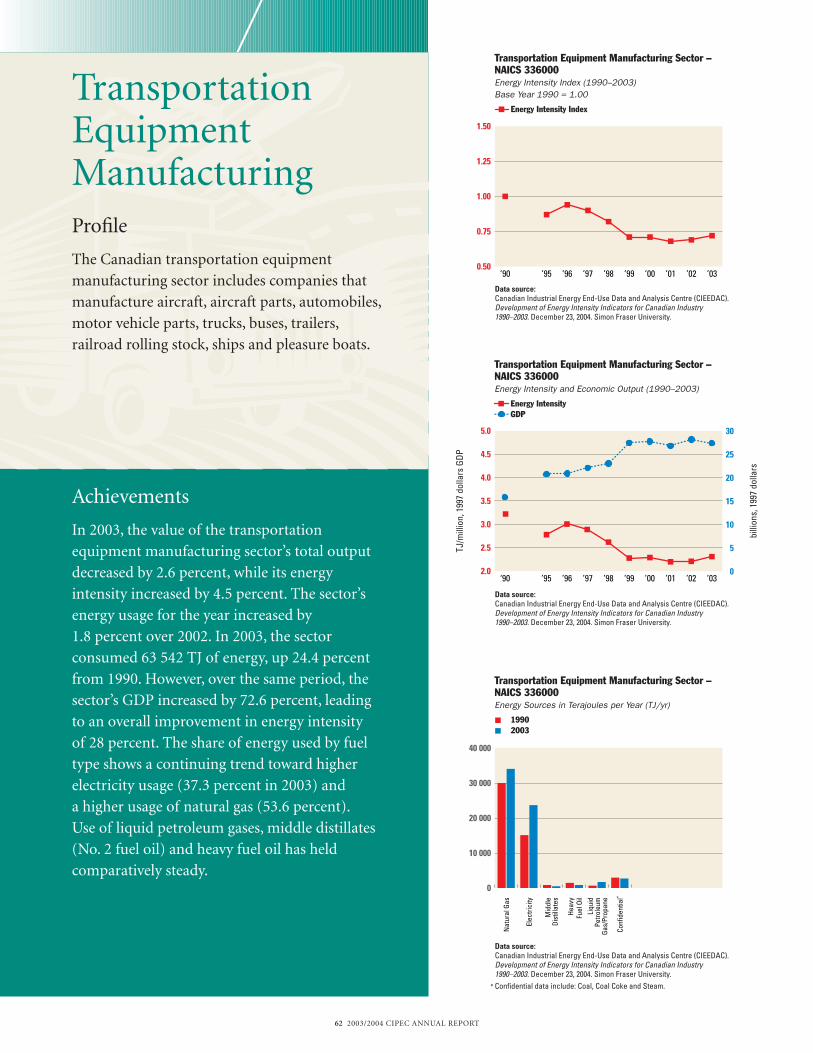
62 2003/2004 CIPEC ANNUAL REPORT
Achievements
In 2003, the value of the transportation
equipment manufacturing sector’s total output
decreased by 2.6 percent, while its energy
intensity increased by 4.5 percent. The sector’s
energy usage for the year increased by
1.8 percent over 2002. In 2003, the sector
consumed 63 542 TJ of energy, up 24.4 percent
from 1990. However, over the same period, the
sector’s GDP increased by 72.6 percent, leading
to an overall improvement in energy intensity
of 28 percent. The share of energy used by fuel
type shows a continuing trend toward higher
electricity usage (37.3 percent in 2003) and
a higher usage of natural gas (53.6 percent).
Use of liquid petroleum gases, middle distillates
(No. 2 fuel oil) and heavy fuel oil has held
comparatively steady.
Transportation Equipment ManufacturingProfile
The Canadian transportation equipment
manufacturing sector includes companies that
manufacture aircraft, aircraft parts, automobiles,
motor vehicle parts, trucks, buses, trailers,
railroad rolling stock, ships and pleasure boats.
0
10 000
20 000
30 000
40 000
Conf
iden
tial**
Liqu
idPe
trole
umGa
s/Pr
opan
e
Heav
yFu
el O
il
Mid
dle
Dist
illat
es
Elec
trici
ty
Nat
ural
Gas
2.0
2.5
3.0
3.5
4.0
4.5
5.0
’03’02’01’00’99’98’97’96’95‘90
TJ/m
illio
n, 1
997
dolla
rs G
DP
billi
ons,
199
7 do
llars
Transportation Equipment Manufacturing Sector – NAICS 336000Energy Sources in Terajoules per Year (TJ/yr)
1990 2003
0.50
0.75
1.00
1.25
1.50
’03’02’01’00’99’98’97’96’95’90
Transportation Equipment Manufacturing Sector – NAICS 336000Energy Intensity Index (1990–2003)Base Year 1990 = 1.00
Energy Intensity Index
Transportation Equipment Manufacturing Sector – NAICS 336000Energy Intensity and Economic Output (1990–2003)
Energy Intensity GDP
Data source:Canadian Industrial Energy End-Use Data and Analysis Centre (CIEEDAC). Development of Energy Intensity Indicators for Canadian Industry 1990–2003. December 23, 2004. Simon Fraser University.
Data source:Canadian Industrial Energy End-Use Data and Analysis Centre (CIEEDAC). Development of Energy Intensity Indicators for Canadian Industry 1990–2003. December 23, 2004. Simon Fraser University.
Data source:Canadian Industrial Energy End-Use Data and Analysis Centre (CIEEDAC). Development of Energy Intensity Indicators for Canadian Industry 1990–2003. December 23, 2004. Simon Fraser University.
0
5
10
15
20
25
30
** Confidential data include: Coal, Coal Coke and Steam.
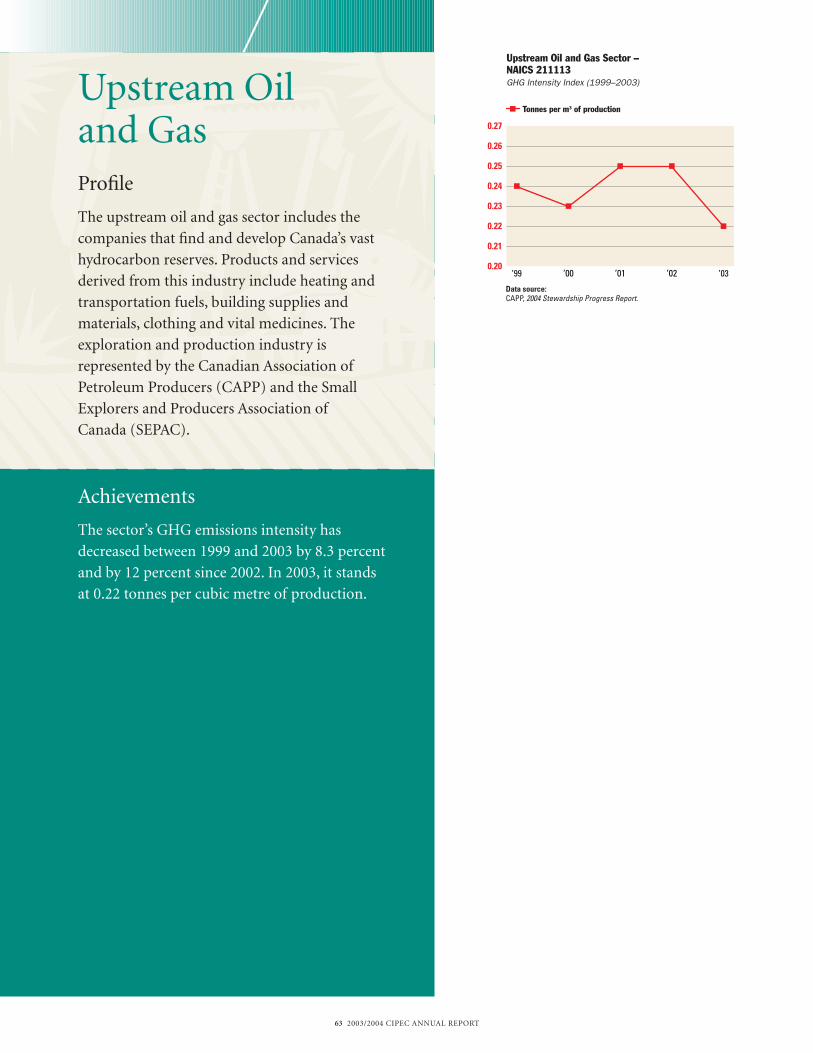
63 2003/2004 CIPEC ANNUAL REPORT
Achievements
The sector’s GHG emissions intensity has
decreased between 1999 and 2003 by 8.3 percent
and by 12 percent since 2002. In 2003, it stands
at 0.22 tonnes per cubic metre of production.
Upstream Oil and GasProfile
The upstream oil and gas sector includes the
companies that find and develop Canada’s vast
hydrocarbon reserves. Products and services
derived from this industry include heating and
transportation fuels, building supplies and
materials, clothing and vital medicines. The
exploration and production industry is
represented by the Canadian Association of
Petroleum Producers (CAPP) and the Small
Explorers and Producers Association of
Canada (SEPAC).
Data source: CAPP, 2004 Stewardship Progress Report.
0.20
0.21
0.22
0.23
0.24
0.25
0.26
0.27
’02’01’00
Upstream Oil and Gas Sector – NAICS 211113GHG Intensity Index (1999–2003)
Tonnes per m3 of production
’03’99
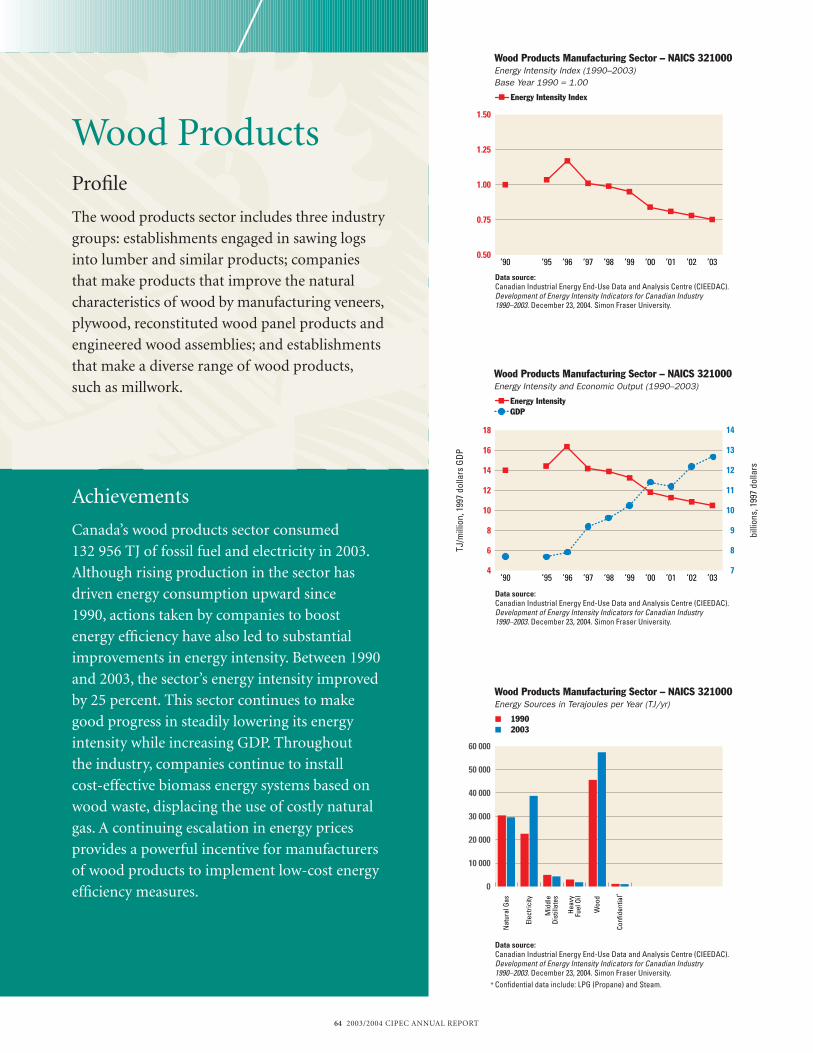
64 2003/2004 CIPEC ANNUAL REPORT
Achievements
Canada’s wood products sector consumed
132 956 TJ of fossil fuel and electricity in 2003.
Although rising production in the sector has
driven energy consumption upward since
1990, actions taken by companies to boost
energy efficiency have also led to substantial
improvements in energy intensity. Between 1990
and 2003, the sector’s energy intensity improved
by 25 percent. This sector continues to make
good progress in steadily lowering its energy
intensity while increasing GDP. Throughout
the industry, companies continue to install
cost-effective biomass energy systems based on
wood waste, displacing the use of costly natural
gas. A continuing escalation in energy prices
provides a powerful incentive for manufacturers
of wood products to implement low-cost energy
efficiency measures.
Wood ProductsProfile
The wood products sector includes three industry
groups: establishments engaged in sawing logs
into lumber and similar products; companies
that make products that improve the natural
characteristics of wood by manufacturing veneers,
plywood, reconstituted wood panel products and
engineered wood assemblies; and establishments
that make a diverse range of wood products,
such as millwork.
** Confidential data include: LPG (Propane) and Steam.
7
8
9
10
11
12
13
14
TJ/m
illio
n, 1
997
dolla
rs G
DP
billi
ons,
199
7 do
llars
0.50
0.75
1.00
1.25
1.50
’03’02’01’00’99’98’97’96’95’90
Wood Products Manufacturing Sector – NAICS 321000Energy Sources in Terajoules per Year (TJ/yr)
1990 2003
Wood Products Manufacturing Sector – NAICS 321000Energy Intensity and Economic Output (1990–2003)
Energy Intensity GDP
Wood Products Manufacturing Sector – NAICS 321000Energy Intensity Index (1990–2003)Base Year 1990 = 1.00
Energy Intensity Index
Data source:Canadian Industrial Energy End-Use Data and Analysis Centre (CIEEDAC). Development of Energy Intensity Indicators for Canadian Industry 1990–2003. December 23, 2004. Simon Fraser University.
Data source:Canadian Industrial Energy End-Use Data and Analysis Centre (CIEEDAC). Development of Energy Intensity Indicators for Canadian Industry 1990–2003. December 23, 2004. Simon Fraser University.
Data source:Canadian Industrial Energy End-Use Data and Analysis Centre (CIEEDAC). Development of Energy Intensity Indicators for Canadian Industry 1990–2003. December 23, 2004. Simon Fraser University.
4
6
8
10
12
14
16
18
’03’02’01’00’99’98’97’96’95’90
0
10 000
20 000
30 000
40 000
50 000
60 000
Conf
iden
tial**
Woo
d
Heav
yFu
el O
il
Mid
dle
Dist
illat
es
Elec
trici
ty
Nat
ural
Gas
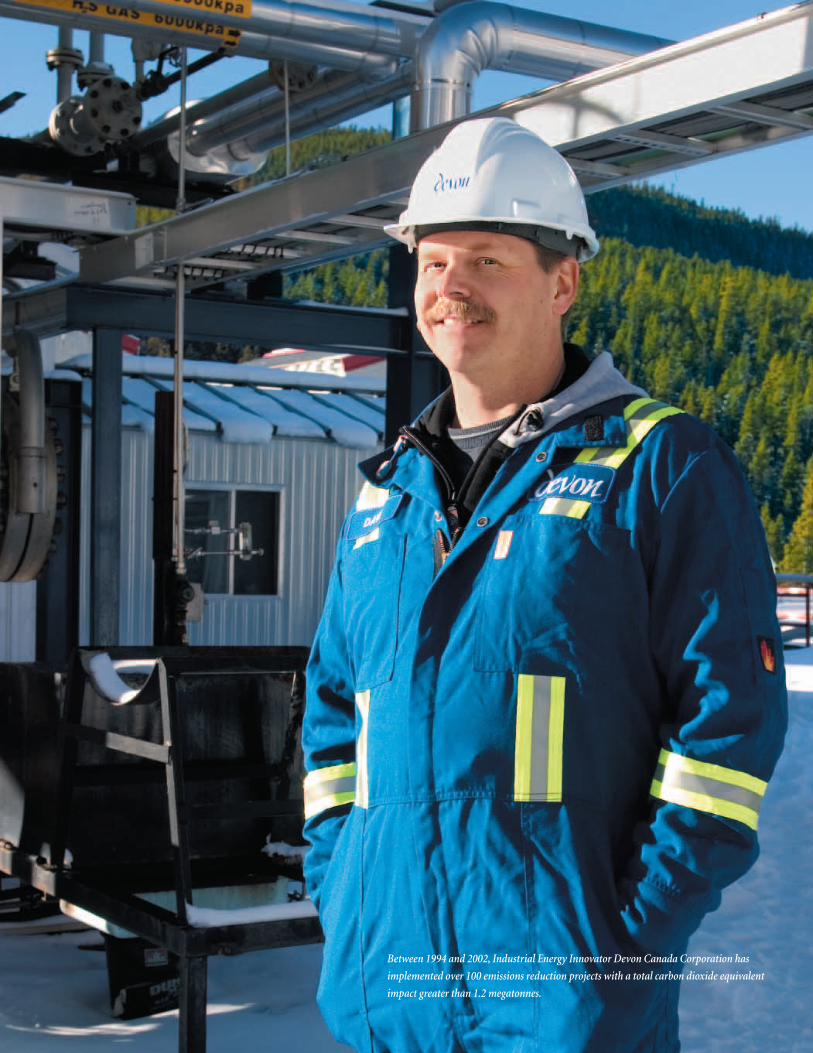
Between 1994 and 2002, Industrial Energy Innovator Devon Canada Corporation has
implemented over 100 emissions reduction projects with a total carbon dioxide equivalent
impact greater than 1.2 megatonnes.
CIPEC is an umbrella organization overseeing a partnership between government and private industry aimed at improving
Canada’s industrial energy efficiency. CIPEC comprises sectoral task forces, each of which represents companies engaged in
similar industrial activities, that participate through their trade associations. The Task Force Council, with representatives
from each CIPEC sector, provides a common forum for sectors to share ideas and recommends ways to address common
needs. Overall direction is provided by an Executive Board, which is made up of private sector leaders who are champions of
industrial energy efficiency within their sectors and who provide advice on industrial energy efficiency programs and related
issues to the Government of Canada.
In the CIPEC partnership, change emerges from consensus and joint action built through open and honest
communication. CIPEC continues to be the focal point for industry’s response to Canada’s climate change efforts. Our role is
to promote the evolution of energy efficiency and to recognize and reward those who lead the way.
We carry out this mandate in part through a strong communications and awareness program anchored in our twice-
monthly Heads Up CIPEC newsletter and in regular features in selected trade magazines. There are now close to 10 000
regular readers of this publication.
CIPEC also raises awareness of the goals and benefits of improved energy use in other ways. The Task Force Council and
individual sectors are constantly at work to broaden participation, encourage the sharing of information and bolster
awareness of the role and achievements of CIPEC industries. The frequency of CIPEC meetings and other gatherings
continues to increase, with an average of three CIPEC events occurring per week during the past reporting period.
CIPEC volunteers include successful business leaders and others recognized on the national stage. The profile of these
leaders and their strong belief in CIPEC’s principles give us a strong edge in attracting new industry participants and in
continuing the successful partnership between industry and government.
The Evolution of CIPEC Data
CIPEC sectors in this report are organized in accordance with the North American Industry Classification System (NAICS).
NAICS replaces the Standard Industrial Classification (SIC) system used in previous years. The switch was made to bring
Canada’s classification system in line with Mexico and the United States, its partners in the North American Free Trade
Agreement, and involved sub-sector realignment. In addition, the GDP dollar values reported here have been updated to
reflect a 1997 base year. CIPEC annual reports for 2000/2001 and earlier were based on a 1986 base year.
Accurate measurement and meaningful data are fundamental to measuring energy efficiency improvements. Data used
in this report are collected primarily by Statistics Canada and supplemented by information from associations participating in
CIPEC and from other government bodies. The information is interpreted by the Canadian Industrial Energy End-Use Data
and Analysis Centre (CIEEDAC) at Simon Fraser University in Burnaby, British Columbia. CIEEDAC then produces energy
intensity indicators for each sector based on production and GDP.
The cooperative CIEEDAC system is internationally recognized for its methodologies, data integrity and cooperation with
CIPEC. Primary funding for CIEEDAC comes from NRCan, with additional contributions from industry associations that
participate in CIPEC and from the province of Quebec.
How CIPEC Works
66 2003/2004 CIPEC ANNUAL REPORT

67 2003/2004 CIPEC ANNUAL REPORT
CIPEC Executive Board
Douglas E. SpeersChairmanEmco Corporation620 Richmond StreetLondon ON N6A 5J9Tel.: (519) 645-3900Fax: (519) 645-1634E-mail: [email protected]
Ron AelickPresident, Canada and UK OperationsInco Limited145 King Street West, Suite 1500Toronto ON M5H 4B7Tel.: (416) 361-7756Fax: (416) 361-7734E-mail: [email protected]
Mike CassadayDirector, Refining and Supply SupportPetro-Canada3275 Rebecca StreetOakville ON L6L 6N5Tel.: (905) 469-3999Fax: (905) 469-4040E-mail: [email protected]
Peter H. CookeSenior ConsultantLafarge Canada Inc.606 Cathcart Street, 8th FloorMontréal QC H3B 1L7Tel.: (514) 861-1411, Ext. 4232E-mail: [email protected]
T. Reginald DriscollPresidentAlbarrie Canada Limited85 Morrow RoadBarrie ON L4N 3V7Tel.: (705) 737-0551Fax: (705) 737-4044E-mail: [email protected]
J.D. HolePresident and Chief Executive OfficerLockerbie & Hole Industrial Inc. 10320 – 146 StreetEdmonton AB T5N 3A2Tel.: (780) 452-1250Fax: (780) 452-1284E-mail: [email protected]
Wayne KenefickDirector of Sustainable DevelopmentGraymont Western Canada Inc.3025 – 12th Street North East, Suite 190Calgary AB T2E 7J2Tel.: (403) 219-1320Fax: (403) 291-1303E-mail: [email protected]
Richard LamarcheVice-PresidentEnergy DivisionAlcoa Canada1 Place Ville-Marie, Suite 2310Montréal QC H3B 5J1Tel.: (514) 904-5195Fax: (514) 904-5029E-mail: [email protected]
Yves LerouxVice-PresidentRegulatory & Government AffairsParmalat Dairy & Bakery Inc.405 The West MallToronto ON M9C 5J1Tel.: (416) 620-3010Fax: (416) 620-3538E-mail: [email protected]
David LewinSenior Vice-PresidentEPCOR10065 Jasper AvenueEdmonton AB T5J 3B1Tel.: (780) 412-3196Fax: (780) 412-3192E-mail: [email protected]
J. Norman LockingtonVice-President, TechnologyDofasco Inc.P.O. Box 24601330 Burlington Street EastHamilton ON L8N 3J5Tel.: (905) 548-7200, Ext. 3422Fax: (905) 548-4667E-mail: [email protected]
Brenda MacDonaldPresidentCoyle & Greer Awards Canada Ltd.P.O. Box 2474189 Mossley DriveMossley ON N0L 1V0Tel.: 1 800 265-7083, Ext. 233Fax: 1 800 823-0566E-mail: [email protected]
C.A. (Chris) MicekEnvironment Manager CanadaAgrium Inc.11751 River RoadFort Saskatchewan AB T8L 4J1Tel.: (780) 998-6959Fax: (780) 998-6677E-mail: [email protected]
Geoffrey MoorePresident Fibrex Insulations Inc.P.O. Box 2079561 Scott RoadSarnia ON N7T 7L4Tel.: (519) 336-4080, Ext. 232Fax: (519) 336-1634E-mail: [email protected]
Ronald C. MorrisonTreasurer of the BoardCanadian Manufacturers & Exporters1377 Hazelton BoulevardBurlington ON L7P 4V2Tel.: (905) 464-5887Fax: (905) 335-0523E-mail: [email protected]
John D. RedfernChairman of the BoardLafarge Canada Inc.606 Cathcart Street, 8th FloorMontréal QC H3B 1L7Tel.: (514) 861-1411, Ext. 3202Fax: (514) 876-8900E-mail: [email protected]
Michael SchnekenburgerPresident and CEONRI Industries Inc.394 Symington AvenueToronto ON M6N 2W3Tel.: (416) 652-4230Fax: (416) 652-4211E-mail: [email protected]
Lori Shalhoub Director of Government RelationsDaimlerChrysler Canada Inc.One Riverside Drive West – CIMS 240-15-01Windsor ON N9A 4H6Tel.: (519) 973-2101Fax: (519) 973-2226E-mail: [email protected]
Tor Eilert SutherPresident and General ManagerStora Enso Port Hawkesbury Ltd.P.O. Box 9500Port Hawkesbury NS B9A 1A1Tel.: (902) 625-2460, Ext. 4232Fax: (902) 625-2595E-mail: [email protected]
John R. VickersVice-President and General ManagerWabtec Foundry40 Mason StreetWallaceburg ON N8A 4M1Tel.: (519) 627-3314Fax: (519) 627-1768E-mail: [email protected]

68 2003/2004 CIPEC ANNUAL REPORT
CIPEC Task Force Council ChairSusan OlynykSenior Energy SpecialistDofasco Inc.P.O. Box 2460 – 1330 Burlington Street EastHamilton ON L8N 3J5Tel.: 1 800 363-2726, Ext. 6107Fax: (905) 548-4267E-mail: [email protected]
Aluminum Sector Task ForceChristian Van HouttePresidentAluminium Association of Canada1010 Sherbrooke Street West, Suite 1600Montréal QC H3A 2R7Tel.: (514) 288-4842Fax: (514) 288-0944E-mail: [email protected]
Brewers Sector Task ForceMargo DewarVice-President, Economic Policy and ProgramsBrewers Association of Canada100 Queen Street, Suite 650Ottawa ON K1P 1J9Tel.: (613) 232-9601Fax: (613) 232-2283E-mail: [email protected]
Cement Sector Task ForceChristian DouvreVice-President, Performance and Technical AssistanceLafarge Canada Inc. 6150 Royalmount AvenueMontréal QC H4P 2R3Tel.: (514) 736-3565 Fax: (514) 738-1124E-mail: [email protected]
Chemical Sector Task ForceDavid F. PodruznySenior Project ManagerBusiness & DevelopmentCanadian Chemical Producers’ Association350 Sparks Street, Suite 805Ottawa ON K1R 7S8Tel.: (613) 237-6215, Ext. 229Fax: (613) 237-4061E-mail: [email protected]
CIPEC Communications CommitteeEd GregoryLibrarian, Information SpecialistBrewers Association of Canada100 Queen Street, Suite 650Ottawa ON K1P 1J9Tel.: (613) 232-9106Fax: (613) 232-2283E-mail: [email protected]
Construction Sector Task ForceJeff MorrisonDirector of Public RelationsCanadian Construction Association75 Albert Street, Suite 400Ottawa ON K1P 5E7Tel.: (613) 236-9455Fax: (613) 236-9526E-mail: [email protected]
Dairy Sector Task ForceJeffrey RawlinsCorporate Energy ManagerParmalat Dairy & Bakery Inc. 25 Rakely CourtToronto ON M9C 5G2Tel.: (416) 641-2985Fax: (416) 622-0106E-mail: [email protected]
Electrical and Electronics Sector Task ForceSteve HorvathVice-President of Manufacturing & EngineeringLincoln Electric179 Wicksteed AvenueToronto ON M4G 2B9 Tel.: (416) 467-4292Fax: (416) 421-3065E-mail: [email protected]
Electricity Generation Sector Task ForceValerie SnowECR Program ManagerCanadian Electricity Association1155 Metcalfe Street, Room 1120Montréal QC H3B 2V6Tel.: (514) 290-0242Fax: (514) 489-7406E-mail: [email protected]
Fertilizer Sector Task ForceDavid FinlaysonVice-President, Science and RiskManagementCanadian Fertilizer Institute350 Sparks Street, Suite 802Ottawa ON K1R 7S8Tel.: (613) 230-2597Fax: (613) 230-5142E-mail: [email protected]
Food and Beverage Sector Task ForceDoug Dittburner, CETChief EngineerUnilever Canada195 Belfast RoadRexdale ON M9W 1G8Tel.: (416) 240-4746Fax: (416) 247-8677E-mail: [email protected]
Foundry Sector Task ForceJudith ArbourExecutive DirectorCanadian Foundry Association1 Nicholas Street, Suite 1500Ottawa ON K1N 7B7Tel.: (613) 789-4894Fax: (613) 789-5957E-mail: [email protected]
General Manufacturing Sector Task Force – CentralRahumathulla Marikkar (Co-Chair)Director, Technology & EnvironmentInterface Flooring Systems (Canada) Inc.233 Lahr DriveBelleville ON K8N 5S2Tel.: (613) 966-8090, Ext. 2115Fax: (613) 966-8817E-mail:[email protected]
Victor Salvador (Co-Chair)Manufacturing EngineerOwens-Corning Canada Inc.3450 McNicoll AvenueScarborough ON M1V 1Z5Tel.: (416) 332-7831Fax: (416) 412-6723E-mail: [email protected]
CIPEC Task Force Council

69 2003/2004 CIPEC ANNUAL REPORT
General Manufacturing Sector Task Force – EastAndré DesrochesVice-President, Fabrication, Eastern CanadaEmco Limited – Building Products9510 Saint-Patrick StreetLa Salle QC H8R 1R9Tel.: (514) 364-7528Fax: (514) 364-4487E-mail: [email protected]
General Manufacturing Sector Task Force – WestSteve HertzogPlant ManagerEmco Building Products LimitedP.O. Box 576Edmonton AB T5J 2K8Tel.: (780) 440-7321Fax: (780) 465-1181E-mail: [email protected]
Lime Sector Task ForceChristopher MartinRegional Environmental ManagerCarmeuse Lime (Beachville) Ltd.P.O. Box 190, Oxford County Road #6Ingersoll ON N5C 3K5Tel.: (519) 423-6283, Ext. 273Fax: (519) 423-6135E-mail: [email protected]
Mining Sector Task ForceLauri GreggDirector of Energy ManagementFalconbridge Limited207 Queen’s Quay West, Suite 800Toronto ON M5J 1A7Tel.: (416) 982-7076Fax: (416) 982-3543E-mail: [email protected]
Oil Sands Sector Task ForceC.L.L. (Kees) VersfeldEnergy Management Team Leader SyncrudeSyncrude Canada Ltd.P.O. Bag 4009, Mail Drop #2030Fort McMurray AB T9H 3L1Tel.: (780) 790-8605Fax: (780) 790-4875E-mail: [email protected]
Petroleum Refining Task ForceAdolfo SilvaNational Director, Environmental AffairsCPPI NationalCanadian Petroleum Products Institute20 Adelaide Street East, Suite 901Toronto ON M5C 2T6Tel.: (416) 492-5677Fax: (416) 492-2514E-mail: [email protected]
Pulp and Paper Sector Task Force Paul LansbergenDirector, Taxation and Business IssuesForest Products Association of Canada 99 Bank Street, Suite 410Ottawa ON K1P 6B9Tel.: (613) 563-1441, Ext. 306Fax: (613) 563-4720E-mail: [email protected]
Rubber Sector Task ForceGlenn MaidmentPresidentThe Rubber Association of Canada2000 Argentia Road – Plaza 4, Suite 250Mississauga ON L5N 1W1Tel.: (905) 814-1714Fax: (905) 814-1085E-mail: [email protected]
Steel Sector Task ForceBob DownieEnvironmental Co-ordinatorGerdau Ameristeel Corporation160 Orion Place – P.O. Box 1734Cambridge ON N1T 1R9Tel.: (519) 740-2488, Ext. 1306Fax: (519) 740-2601E-mail: [email protected]
Textiles Sector Task ForceSophie TourangeauProject DirectorCanadian Textiles Institute 222 Somerset Street West, Suite 500Ottawa ON K2P 2G3Tel.: (613) 232-7195, Ext. 108Fax: (613) 232-8722E-mail: [email protected]
Transportation Equipment ManufacturingSector Task ForcePaul L. HansenManager, Environmental AffairsDaimlerChrysler Canada Inc.4510 Rhodes Drive, Suite 210Windsor ON N8W 5K5Tel.: (519) 973-2864Fax: (519) 973-2613E-mail: [email protected]
Upstream Oil and Gas Sector Task ForceRick HyndmanSenior Policy Advisor, Climate ChangeCanadian Association of Petroleum Producers350 – 7th Avenue Southwest, Suite 2100Calgary AB T2P 3N9Tel.: (403) 267-1168Fax: (403) 266-3214E-mail: [email protected]
Wood Products Sector Task ForcePaul LansbergenDirector, Taxation and Business IssuesForest Products Association of Canada 99 Bank Street, Suite 410Ottawa ON K1P 6B9Tel.: (613) 563-1441, Ext. 306Fax: (613) 563-4720E-mail: [email protected]
CIPEC Energy Managers NetworkNick Ciappa, P. Eng.IOL Energy AdvisorImperial Oil Limited90 Wynford DriveToronto ON M3C 1K5Tel.: (416) 968-5822Fax: (416) 968-8007E-mail: [email protected]
Through NRCan’s Office of Energy Efficiency (OEE), the Industrial Energy Innovators initiative focuses
on transforming sector-level commitments made by task forces into company-level action by helping
to overcome obstacles to energy efficiency at the company level.
As of February 28, 2005, 643 industrial companies from the manufacturing, mining, construction
and energy-producing sectors have signed on as Industrial Energy Innovators.
For information on the benefits of becoming an Industrial Energy Innovator, contact the OEE
by e-mail at [email protected] or visit the Web site at oee.nrcan.gc.ca/cipec.
Industrial Energy Innovators
70 2003/2004 CIPEC ANNUAL REPORT
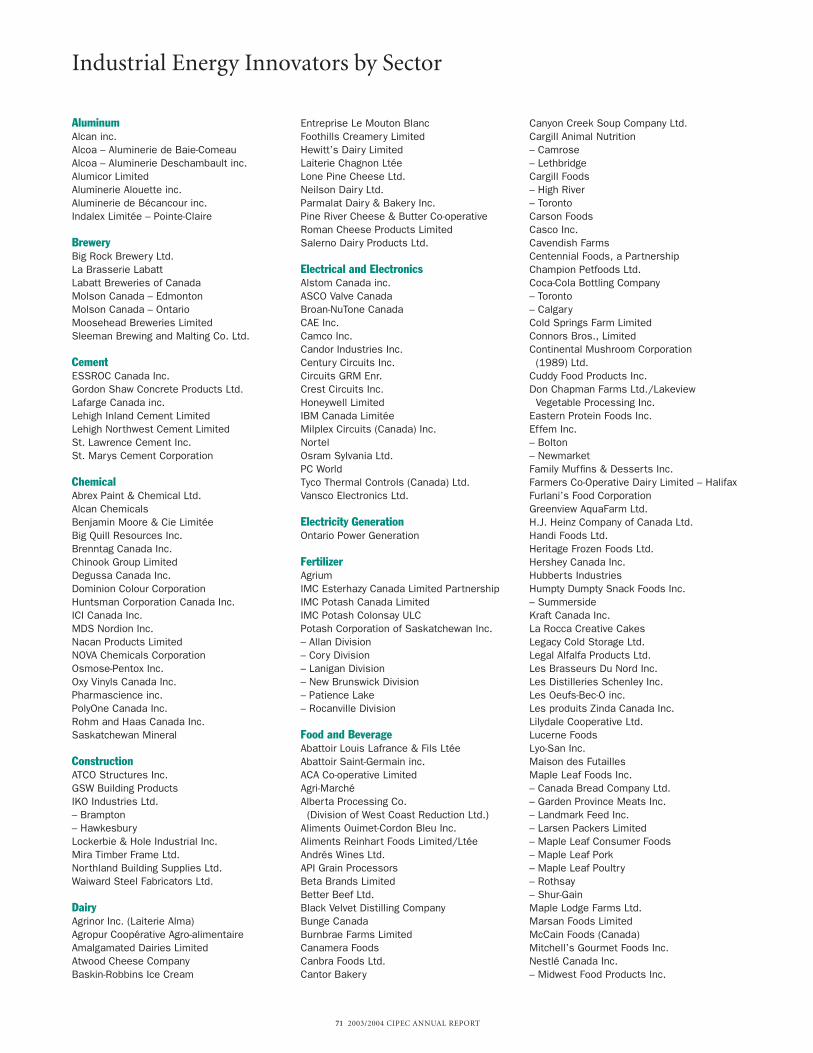
71 2003/2004 CIPEC ANNUAL REPORT
AluminumAlcan inc.Alcoa – Aluminerie de Baie-ComeauAlcoa – Aluminerie Deschambault inc.Alumicor LimitedAluminerie Alouette inc.Aluminerie de Bécancour inc.Indalex Limitée – Pointe-Claire
BreweryBig Rock Brewery Ltd.La Brasserie LabattLabatt Breweries of CanadaMolson Canada – EdmontonMolson Canada – OntarioMoosehead Breweries LimitedSleeman Brewing and Malting Co. Ltd.
CementESSROC Canada Inc.Gordon Shaw Concrete Products Ltd.Lafarge Canada inc.Lehigh Inland Cement LimitedLehigh Northwest Cement LimitedSt. Lawrence Cement Inc.St. Marys Cement Corporation
ChemicalAbrex Paint & Chemical Ltd.Alcan ChemicalsBenjamin Moore & Cie LimitéeBig Quill Resources Inc.Brenntag Canada Inc.Chinook Group LimitedDegussa Canada Inc.Dominion Colour CorporationHuntsman Corporation Canada Inc.ICI Canada Inc.MDS Nordion Inc.Nacan Products LimitedNOVA Chemicals CorporationOsmose-Pentox Inc.Oxy Vinyls Canada Inc.Pharmascience inc.PolyOne Canada Inc.Rohm and Haas Canada Inc.Saskatchewan Mineral
ConstructionATCO Structures Inc.GSW Building ProductsIKO Industries Ltd. – Brampton– HawkesburyLockerbie & Hole Industrial Inc.Mira Timber Frame Ltd.Northland Building Supplies Ltd. Waiward Steel Fabricators Ltd.
DairyAgrinor Inc. (Laiterie Alma)Agropur Coopérative Agro-alimentaireAmalgamated Dairies LimitedAtwood Cheese CompanyBaskin-Robbins Ice Cream
Entreprise Le Mouton BlancFoothills Creamery LimitedHewitt’s Dairy LimitedLaiterie Chagnon LtéeLone Pine Cheese Ltd.Neilson Dairy Ltd.Parmalat Dairy & Bakery Inc.Pine River Cheese & Butter Co-operativeRoman Cheese Products LimitedSalerno Dairy Products Ltd.
Electrical and ElectronicsAlstom Canada inc.ASCO Valve CanadaBroan-NuTone CanadaCAE Inc.Camco Inc.Candor Industries Inc.Century Circuits Inc.Circuits GRM Enr.Crest Circuits Inc.Honeywell LimitedIBM Canada LimitéeMilplex Circuits (Canada) Inc.NortelOsram Sylvania Ltd.PC WorldTyco Thermal Controls (Canada) Ltd.Vansco Electronics Ltd.
Electricity GenerationOntario Power Generation
FertilizerAgriumIMC Esterhazy Canada Limited PartnershipIMC Potash Canada LimitedIMC Potash Colonsay ULCPotash Corporation of Saskatchewan Inc. – Allan Division – Cory Division– Lanigan Division– New Brunswick Division– Patience Lake– Rocanville Division
Food and BeverageAbattoir Louis Lafrance & Fils LtéeAbattoir Saint-Germain inc.ACA Co-operative LimitedAgri-MarchéAlberta Processing Co. (Division of West Coast Reduction Ltd.)
Aliments Ouimet-Cordon Bleu Inc.Aliments Reinhart Foods Limited/LtéeAndrés Wines Ltd.API Grain ProcessorsBeta Brands LimitedBetter Beef Ltd.Black Velvet Distilling CompanyBunge CanadaBurnbrae Farms LimitedCanamera FoodsCanbra Foods Ltd.Cantor Bakery
Canyon Creek Soup Company Ltd.Cargill Animal Nutrition – Camrose– LethbridgeCargill Foods– High River– TorontoCarson FoodsCasco Inc.Cavendish FarmsCentennial Foods, a PartnershipChampion Petfoods Ltd.Coca-Cola Bottling Company– Toronto– CalgaryCold Springs Farm LimitedConnors Bros., LimitedContinental Mushroom Corporation (1989) Ltd.
Cuddy Food Products Inc.Don Chapman Farms Ltd./LakeviewVegetable Processing Inc.
Eastern Protein Foods Inc.Effem Inc. – Bolton– NewmarketFamily Muffins & Desserts Inc.Farmers Co-Operative Dairy Limited – HalifaxFurlani’s Food CorporationGreenview AquaFarm Ltd.H.J. Heinz Company of Canada Ltd.Handi Foods Ltd.Heritage Frozen Foods Ltd.Hershey Canada Inc.Hubberts IndustriesHumpty Dumpty Snack Foods Inc.– SummersideKraft Canada Inc.La Rocca Creative CakesLegacy Cold Storage Ltd.Legal Alfalfa Products Ltd.Les Brasseurs Du Nord Inc.Les Distilleries Schenley Inc.Les Oeufs-Bec-O inc.Les produits Zinda Canada Inc.Lilydale Cooperative Ltd.Lucerne FoodsLyo-San Inc.Maison des FutaillesMaple Leaf Foods Inc. – Canada Bread Company Ltd.– Garden Province Meats Inc.– Landmark Feed Inc.– Larsen Packers Limited – Maple Leaf Consumer Foods– Maple Leaf Pork– Maple Leaf Poultry– Rothsay– Shur-GainMaple Lodge Farms Ltd.Marsan Foods LimitedMcCain Foods (Canada)Mitchell’s Gourmet Foods Inc.Nestlé Canada Inc.– Midwest Food Products Inc.
Industrial Energy Innovators by Sector
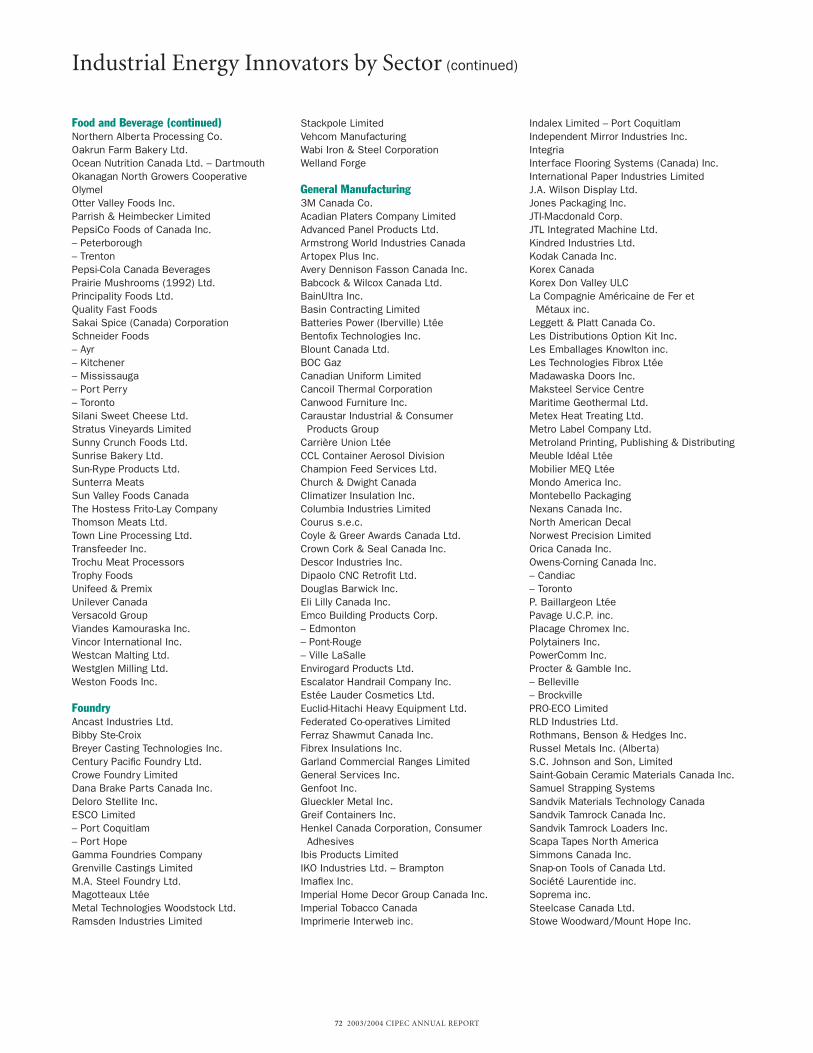
72 2003/2004 CIPEC ANNUAL REPORT
Industrial Energy Innovators by Sector (continued)
Food and Beverage (continued)Northern Alberta Processing Co.Oakrun Farm Bakery Ltd.Ocean Nutrition Canada Ltd. – DartmouthOkanagan North Growers CooperativeOlymelOtter Valley Foods Inc.Parrish & Heimbecker LimitedPepsiCo Foods of Canada Inc.– Peterborough– TrentonPepsi-Cola Canada BeveragesPrairie Mushrooms (1992) Ltd.Principality Foods Ltd.Quality Fast FoodsSakai Spice (Canada) CorporationSchneider Foods– Ayr– Kitchener– Mississauga– Port Perry– TorontoSilani Sweet Cheese Ltd.Stratus Vineyards LimitedSunny Crunch Foods Ltd.Sunrise Bakery Ltd.Sun-Rype Products Ltd.Sunterra MeatsSun Valley Foods CanadaThe Hostess Frito-Lay CompanyThomson Meats Ltd.Town Line Processing Ltd.Transfeeder Inc.Trochu Meat ProcessorsTrophy FoodsUnifeed & PremixUnilever CanadaVersacold GroupViandes Kamouraska Inc.Vincor International Inc.Westcan Malting Ltd.Westglen Milling Ltd.Weston Foods Inc.
FoundryAncast Industries Ltd.Bibby Ste-CroixBreyer Casting Technologies Inc.Century Pacific Foundry Ltd.Crowe Foundry LimitedDana Brake Parts Canada Inc.Deloro Stellite Inc.ESCO Limited – Port Coquitlam– Port HopeGamma Foundries CompanyGrenville Castings LimitedM.A. Steel Foundry Ltd.Magotteaux LtéeMetal Technologies Woodstock Ltd.Ramsden Industries Limited
Stackpole LimitedVehcom ManufacturingWabi Iron & Steel CorporationWelland Forge
General Manufacturing3M Canada Co.Acadian Platers Company LimitedAdvanced Panel Products Ltd.Armstrong World Industries CanadaArtopex Plus Inc. Avery Dennison Fasson Canada Inc.Babcock & Wilcox Canada Ltd.BainUltra Inc.Basin Contracting LimitedBatteries Power (Iberville) LtéeBentofix Technologies Inc.Blount Canada Ltd.BOC GazCanadian Uniform LimitedCancoil Thermal CorporationCanwood Furniture Inc.Caraustar Industrial & Consumer Products Group
Carrière Union LtéeCCL Container Aerosol DivisionChampion Feed Services Ltd.Church & Dwight CanadaClimatizer Insulation Inc.Columbia Industries LimitedCourus s.e.c.Coyle & Greer Awards Canada Ltd.Crown Cork & Seal Canada Inc.Descor Industries Inc.Dipaolo CNC Retrofit Ltd.Douglas Barwick Inc.Eli Lilly Canada Inc.Emco Building Products Corp. – Edmonton– Pont-Rouge– Ville LaSalleEnvirogard Products Ltd.Escalator Handrail Company Inc.Estée Lauder Cosmetics Ltd.Euclid-Hitachi Heavy Equipment Ltd.Federated Co-operatives LimitedFerraz Shawmut Canada Inc.Fibrex Insulations Inc.Garland Commercial Ranges LimitedGeneral Services Inc.Genfoot Inc.Glueckler Metal Inc.Greif Containers Inc.Henkel Canada Corporation, ConsumerAdhesives
Ibis Products LimitedIKO Industries Ltd. – BramptonImaflex Inc.Imperial Home Decor Group Canada Inc.Imperial Tobacco CanadaImprimerie Interweb inc.
Indalex Limited – Port CoquitlamIndependent Mirror Industries Inc.IntegriaInterface Flooring Systems (Canada) Inc.International Paper Industries LimitedJ.A. Wilson Display Ltd.Jones Packaging Inc.JTI-Macdonald Corp.JTL Integrated Machine Ltd.Kindred Industries Ltd.Kodak Canada Inc.Korex CanadaKorex Don Valley ULCLa Compagnie Américaine de Fer et Métaux inc.
Leggett & Platt Canada Co.Les Distributions Option Kit Inc.Les Emballages Knowlton inc.Les Technologies Fibrox LtéeMadawaska Doors Inc.Maksteel Service CentreMaritime Geothermal Ltd.Metex Heat Treating Ltd.Metro Label Company Ltd.Metroland Printing, Publishing & DistributingMeuble Idéal LtéeMobilier MEQ LtéeMondo America Inc.Montebello PackagingNexans Canada Inc.North American DecalNorwest Precision LimitedOrica Canada Inc.Owens-Corning Canada Inc. – Candiac– TorontoP. Baillargeon LtéePavage U.C.P. inc.Placage Chromex Inc.Polytainers Inc.PowerComm Inc.Procter & Gamble Inc. – Belleville– BrockvillePRO-ECO LimitedRLD Industries Ltd.Rothmans, Benson & Hedges Inc.Russel Metals Inc. (Alberta)S.C. Johnson and Son, LimitedSaint-Gobain Ceramic Materials Canada Inc.Samuel Strapping SystemsSandvik Materials Technology CanadaSandvik Tamrock Canada Inc.Sandvik Tamrock Loaders Inc.Scapa Tapes North AmericaSimmons Canada Inc.Snap-on Tools of Canada Ltd.Société Laurentide inc.Soprema inc.Steelcase Canada Ltd.Stowe Woodward/Mount Hope Inc.
73 2003/2004 CIPEC ANNUAL REPORT
Suntech Heat Treating Ltd.Superior Radiant Products Ltd.Systèmes et Câbles d’Alimentation Pirelli Canada
Teknion CorporationTeknion Roy & Breton Inc.– RBLogistek – St-Romuald, QC– RBTek – St-Romuald, QC– Roy & Breton – St-Vallier, QC– Teknion Concept – Lévis, QC– Teknion Québec – Montmagny, QCTekWoodThermetco Inc.Transcontinental GagnéTranscontinental Interweb TorontoTuyaux Wolverine (Canada) inc.Unifiller Systems Inc.V.N. Custom Metal Inc.VA TECH Ferranti-Packard Transformers Ltd.VicWest SteelWabash Alloys MississaugaWescam Inc.Wheeltronic Ltd.Wyeth-Ayerst Canada Inc.Zenon Environmental Inc.
Lime Carmeuse Beachville (Spragge Operations) Limited
Carmeuse Lime (Beachville) LimitedCarmeuse Lime (Dundas) LimitedChemical Lime Company of Canada Inc.Graymont (NB) inc.Graymont (QC) Inc. Graymont Western Canada Inc.
Mining Aur Resources Inc.Barrick Gold Corporation – Mine DoyonBHP Billiton Diamonds Inc.Boliden LimitedEcho Bay Mines Ltd.Falconbridge LimitedHillsborough Resources LimitedHudson Bay Mining & Smelting Co., LimitedINCO LimitedIron Ore Company of CanadaLa Compagnie Minière Québec CartierMétallurgie Noranda inc. – Fonderie HorneMines WabushNewmont Canada Limited, Golden Giant MineNoranda inc. – Matagami Mines Noranda Inc. – Brunswick MiningNoranda Inc. – Brunswick SmelterNoranda Metallurgy Inc. – Canadian CopperRefinery
Placer Dome Canada LimitedSifto Canada Inc.Syncrude Canada Ltd.Teck Cominco LimitedWilliams Operating CorporationZinc Électrolytique du Canada Ltée.
Petroleum ProductsBitumar Inc.Canadian Tire PetroleumChevron Canada ResourcesHusky Energy Inc.Imperial Oil LimitedIrving Oil LimitedNorthrock Resources Ltd.Parkland Refining Ltd.Petro-CanadaPound-Maker Agventures Ltd.Rider Resources Ltd.Safety-Kleen Canada Inc.Shell Canada LimitedSuncor Energy Inc.Ultramar Ltd.
PlasticsADS Groupe Composites Inc.Atlantic Packaging Products Ltd.Bérou International inc.D&V Plastics Inc.Downeast Plastics Ltd.Emballage St-Jean LtéeHusky Injection Molding Systems Ltd.IPEX Inc.Kord Products Inc.Matrix Packaging Inc.Par-Pak Ltd.Reid Canada Inc.Richards Packaging Inc.Rubbermaid Canada Inc.Silgan Plastics Canada Inc.The Clorox Company of Canada, Ltd.W. Ralston (Canada) Inc.Wedco Produits MoulésWinpak Portion Packaging Ltd.
Pulp and PaperAbitibi-Consolidated Inc.Bowater Canadian Forest Products Inc.Cariboo Pulp and Paper Company LimitedCascades inc.– Cascades Boxboard Inc./Cascades Carton
Plat inc.– Cascades Fine Papers Group Inc./
Cascades Groupe Papiers Fins inc.– Cascades Tissue Group Inc./
Cascades Groupe Tissu inc.Daishowa-Marubeni International Ltd.Domtar inc.– Espanola– Lebel-sur-Quévillon– Ottawa/HullEmballages Mitchel-Lincoln LtéeEmballages Smurfit-Stone Canada inc.Eurocan Pulp and Paper Company LimitedF.F. Soucy Inc.Georgia-Pacific Canada, Inc. – ThoroldInterlake PaperKruger Inc.Lake Utopia Paper
Marathon Pulp Inc.Maritime Paper Products LimitedNeenah Paper Company of CanadaNorampac Inc.NorskeCanadaPapiers Scott Limitée – Crabtree– LennoxvillePapiers StadaconaPope & Talbot Ltd.Sac Drummond inc.Smurfit-StoneSt. Anne-Nackawic Pulp CompanySt. Marys Paper Ltd.Standard Paper BoxStora Enso Port Hawkesbury Ltd.Tembec Paper Group – Spruce FallsOperations
Tolko Manitoba Kraft PaperUPM-Kymmene Miramichi Inc.Weldwood of Canada LimitedWest Fraser Timber Co. Ltd.
RubberAirBoss Rubber CompoundingGDX Canada Inc.Goodyear Canada Inc.Hamilton Kent Canada Ltd.Michelin North America (Canada) Inc.NRI Industries Inc.Trent Rubber Corp.
SteelAbraham Steel & Services Ltd.Algoma Steel Inc.AltaSteel Ltd.Atlas Specialty SteelsCHT Steel Company Inc.Dofasco Inc.Gerdau Ameristeel Corporation – Cambridge– WhitbyIvaco Inc. – Ivaco Rolling MillsLaurel SteelNamasco LimitedNorambar inc.Ontario Chromium Plating Inc.QIT – Fer et Titane inc.Slater Steel Inc. – Hamilton Specialty BarDivision
Stelco HamiltonStelco Inc.Stelco Lake ErieStelfil LtéeStelpipe Ltd.Stelwire Ltd.
74 2003/2004 CIPEC ANNUAL REPORT
Industrial Energy Innovators by Sector (continued)
TextilesAlbany International Canada Inc.Albarrie Canada LimitedAmerican & Efird Canada, inc.AYK Socks Inc.Barrday Inc.Beaulieu Canada Inc. – Acton ValeBennett Fleet (Quebec) Inc.C.S. Brooks Canada Inc.Cavalier TextilesCoats BellCollingwood Fabrics Inc.Collins & Aikman Canada Inc.Colorama Dyeing and Finishing Inc.Consoltex Inc.CookshireTex inc.Denim SwiftDentexDomfoam International Inc.Doubletex Inc.DuPont Canada Inc.Fabrene Inc.J.L. de Ball Canada Inc.Jack Spratt Mfg Inc.LaGran Canada Inc.Lainages Victor LtéeLanart Rug Inc.Lincoln Fabrics Ltd.Manoir Inc.Manufacturier de bas de nylon Doris LtéeMondor LtéeMorbern Inc.Nova Scotia Textiles, LimitedPGI-DIFCO Tissus Performance Inc.Spinrite Inc.St. Lawrence CorporationStanfields Ltd. Stedfast Inc.Teinturiers Concorde inc.Textiles Monterey (1996) inc.The Cambridge Towel CorporationTri-Tex Co Inc.Velcro Canada Inc.Vitafoam Products Canada Ltd.VOA Colfab Inc.Waterloo Textiles Limited
Transportation Equipment ManufacturingABC Group Inc.– ABC Air Management Systems Inc.
(Multi-Flex)– ABC Climate Control Systems Inc.– ABC Flexible Engineered Products Inc.
(Extrusion)– ABC Group Exterior Systems– ABC Group Interior Systems– ABC Group Product Development– ABC Metal Products Inc.– ABC Plastic Moulding
– Brydon– Orlando
– LCF Manufacturing Ltd. – Rexdale– Weston
– MSB Plastics Manufacturing Ltd.– PDI Plastics Inc. – Polybottle Group Limited
– Edmonton – Vancouver
– Salflex Polymers Ltd.– Salga Associates– Supreme Tooling GroupAccuride Canada Inc.Active Burgess Mould & DesignAdvanced Brake Products Ltd.Air Canada Technical ServicesBoeing Toronto LimitedBombardier AerospaceBombardier Inc.Bovern Enterprises Inc.Burlington Technologies Inc. – BurlingtonCami Automotive Inc.Canadian General-Tower LimitedCanadian Pacific RailwayDaimlerChrysler Canada Inc.Dresden Industrial – Rodney– StratfordDura Automotive Systems (Canada), Ltd.Dura-Lite Heat Transfer Products Ltd.DynaPlas Ltd.Équipement Labrie LtéeF & P Mfg., Inc.Faurecia Automotive SeatingFord Motor Company of Canada, LimitedFreightliner of Canada Ltd. – Sterling TrucksDivision
General Motors of Canada LimitedHonda of Canada Mfg.Iafrate Machine Works Ltd.International Truck and Engine CorporationCanada
Lear CorporationLitens Automotive Parnership – WoodbridgeMontupet LtéeNational Steel Car LimitedNemak of Canada – WindsorNiagara Piston Inc.Oetiker LimitedOmron Dualtec Automotive Electronics Inc.Orenda Aerospace CorporationOrion Bus Industries Inc.Oxford Automotive Inc.Polywheels Manufacturing LimitedPortec Produits Ferroviaires LtéePratt & Whitney Canada Inc.Presstran IndustriesPrévost Car Inc.Production Paint Stripping Ltd.R. Reininger & Son LimitedRemtec Inc.
Rockwell Automation Canada Inc. – Cambridge– StratfordRussel Metals Inc.Siemens VDO Automotive Inc.Simcoe Parts Service Inc.The Butcher Engineering Enterprises LimitedToyota Motor Manufacturing Canada Inc.TRW AutomotiveTS Tech Canada Inc.Volvo Cars of Canada Ltd.Waterville TG Inc.Woodbridge Foam CorporationZF Heavy Duty Steering Inc.
Upstream Oil and GasAltaGas Services Inc. – WabascaBP Canada Energy CompanyCrescent Point Energy Trust – ProvostConnacher Oil and Gas LimitedConocoPhillips Canada (North) LimitedDevon Canada CorporationEnbridge Pipelines Inc.Husky Oil Operations Ltd.Keyspan Energy CanadaNewalta CorporationNexen Canada Ltd.Paramount Resources Ltd.Pengrowth CorporationPenn West Petroleum Ltd.Taurus Exploration LtdTrans World Oil & Gas Ltd.
Wood ProductsCanfor CorporationErie Flooring and Wood ProductsFinewood Flooring & Lumber LimitedFiready Inc.Flakeboard Company LimitedGroupe Savoie Inc.Industries Maibec inc. – St-PamphileK&C Silviculture Ltd.Les Ateliers Blais & Simard ÉbénisterieLes Entreprises Interco inc.Louisiana Pacific Canada Ltd.Marcel Lauzon Inc.MDF La Baie inc.New Skeena Forest Products Inc.Nexfor Inc.North Atlantic Lumber Inc.Rip-O-Bec inc.Riverside Forest Products LimitedTembec Inc.Weyerhaeuser Canada Ltd.
75 2003/2004 CIPEC ANNUAL REPORT
Aerospace Industries Association of Canada
Alberta Food Processors Association
Aluminium Association of Canada
Automotive Parts Manufacturers’ Association
Baking Association of Canada
Brewers of Canada
Canadian Association of Metal Finishers
Canadian Association of Petroleum Producers
Canadian Chamber of Commerce
Canadian Chemical Producers’ Association
Canadian Construction Association
Canadian Council of Grocery Distributors
Canadian Electricity Association
Canadian Fertilizer Institute
Canadian Foundry Association
Canadian Gas Association
Canadian Lime Institute
Canadian Manufacturers & Exporters (CME)
– CME Alberta Division
– CME British Columbia Division
– CME Manitoba Division
– CME New Brunswick Division
– CME Newfoundland Division
– CME Nova Scotia Division
– CME Ontario Division
– CME Prince Edward Island Division
Canadian Meat Council
Canadian Petroleum Products Institute
Canadian Plastics Industry Association
Canadian Steel Environmental Committee (Canadian Steel Producers Association)
Canadian Textiles Institute
Canadian Vehicle Manufacturers’ Association
Cement Association of Canada
Council of Forest Industries
Electro-Federation Canada
Fisheries Council of Canada
Food and Consumer Products Manufacturers of Canada
Forest Products Association of Canada
Forintek Canada Corporation
Mining Association of Canada
North American Insulation Manufacturers Association
Ontario Agri Business Association
Ontario Food Producers’ Association
Packaging Association of Canada
Québec Forest Industries Association
Rubber Association of Canada
Small Explorers and Producers Association of Canada
Association Members

76 2003/2004 CIPEC ANNUAL REPORT
Michael BurkeDirectorTel.: (613) 996-6872E-mail: [email protected]
Philip B. JagoAssistant DirectorTel.: (613) 995-6839E-mail: [email protected]
Catriona ArmstrongSenior Industry Officer, Heavy Industry Tel.: (613) 992-3286E-mail: [email protected]
Jean-Marc BerrouardIndustry OfficerTel.: (613) 943-2224E-mail: [email protected]
Julie BourgeoisProgram Assistant, Dollars to $ense WorkshopsTel.: (613) 947-2047E-mail: [email protected]
Kimberly BoyerAdministrative Assistant Tel.: (613) 944-4765 E-mail: [email protected]
Beryl BroomfieldProgram Assistant, Heavy Industry Tel.: (613) 947-4828E-mail: [email protected]
Micheline BrownSenior Engineering Officer Class 43.1, Technical and Research TeamTel.: (613) 996-0890 E-mail: [email protected]
Monique CaouetteActing Senior Program Manager, Energy Audits and InnovatorsTel.: (613) 943-2361E-mail: [email protected]
Richard CoxfordIndustry Officer, Heavy Industry Tel.: (613) 944-6739 E-mail: [email protected]
Hydie Del CastilloPublications and Database SupportTel.: (613) 996-6891E-mail: [email protected]
Suzanne Forget-LauzonActing Program Support Officer, Energy Audits and Innovators Tel.: (613) 992-3254E-mail: [email protected]
Eric GingrasSenior Industry Officer, Light Industry Tel.: (613) 943-5326E-mail: [email protected]
Richard JaneckyWriter/EditorTel.: (613) 944-6135E-mail: [email protected]
Patricia LieuSenior Industry Officer, Marketing and Partnerships Tel.: (613) 995-3737E-mail: [email protected]
Vaughn MunroeChief, Engineering, Technical and Research Team Tel.: (613) 947-1594E-mail: [email protected]
Jessica NorupActing Senior Industry Officer, Light Industry Tel.: (613) 994-4782 E-mail: [email protected]
Melanie PhillipsChief, Industrial Audit and Internal ServicesTel.: (613) 995-3504E-mail: [email protected]
Andrew PowersProgram Assistant, Light IndustryTel.: (613) 996-5125E-mail: [email protected]
Keith QuachActing Senior Engineer, Engineering, Technical and Research Team Tel.: (613) 992-3288E-mail: [email protected]
Johanne RenaudActing Program Manager, Dollars to $ense WorkshopsTel.: (613) 996-6585E-mail: [email protected]
Patrick Roy Senior Industry Officer, Light Industry Tel.: (613) 944-4641 E-mail: [email protected]
Stéphanie RoyProgram Assistant, Dollars to $ense WorkshopsTel.: (613) 996-0763E-mail: [email protected]
Jeff SwardIndustry Officer, Light IndustryTel.: (613) 996-6780 E-mail: [email protected]
Glenda TaylorChief, Light IndustryTel.: (613) 992-3422E-mail: [email protected]
Miranda WilliamsonSenior Industry Officer, Heavy IndustryTel.: (613) 996-7744E-mail: [email protected]
Industrial Programs Division Staff
77 2003/2004 CIPEC ANNUAL REPORT
Annual Census of Mines NRCan survey that collects information on NAICS 2122 (Metal Mining)and NAICS 2123 (Non-Metal Mineral Mining and Quarrying). Full nameis Annual Census of Mines, Quarries and Sand Pits.
Annual Survey of Manufactures (ASM) Statistics Canada survey. Provides information on the consumption ofpurchased fuels and electricity (CPFE) for approximately 230 sub-sectors at four-digit NAICS code levels.
Base Year A reference year. For the Framework Convention on Climate Change,1997 is the base year.
Canada’s Climate Change Voluntary Challenge and Registry Inc.(VCR Inc.) VCR Inc. encourages the private and public sectors to take voluntarysteps to limit or reduce GHG emissions. As a first step, participantsare encouraged to submit a letter of intent confirming a commitmentto limit or reduce GHGs from their operations. This is followed by anaction plan and subsequent progress reports.
Carbon Dioxide (CO2)A compound of carbon and oxygen that in its normal gaseous state isclear and colourless. CO2 is formed whenever carbon-bearing fuelsare burned. It can also be formed via other reactions that do notinvolve combustion.
Carbon Dioxide Equivalent (CO2e)A metric measure used to compare the emissions of the differentGHGs based upon their global warming potential. Global warmingpotentials are used to convert GHGs to CO2e.
Economic Energy IntensityEnergy consumption per unit of economic output.
Embodied Energy The energy consumed to transform all upstream raw materials into thefinal product; in a life-cycle approach, it would be the “cradle to grave”energy burden.
Energy Intensity Energy consumption per unit of output.
Energy Intensity Indicator A dimensionless ratio equal to the energy intensity in a particular yeardivided by the energy intensity of the base year. The energy intensityindicator for the base year equals 1.0.
Energy Performance MeasuresAny of a variety of metrics that would indicate an aspect of energyperformance.
Framework Convention on Climate Change United Nations convention to address climate change, signed by morethan 150 countries at the United Nations Conference on Environmentand Development in Rio de Janeiro in June 1992. Canada becamethe eighth country to ratify the Convention, which entered into forceon March 21, 1994, thereby committing to work toward stabilizingGHG emissions at 1990 levels by the year 2000.
Greenhouse Gas (GHG) A GHG absorbs and radiates heat in the lower atmosphere thatotherwise would be lost in space. The greenhouse effect is essentialfor life on this planet since it keeps average global temperatures highenough to support plant and animal growth. The main GHGs are carbondioxide (CO2), methane (CH4), chlorofluorocarbons (CFCs) and nitrousoxide (N2O). By far the most abundant GHG is CO2, accounting for 70 percent of the greenhouse effect.
Gross Domestic Product (GDP) The total value of goods and services produced by the nation’seconomy before deduction of depreciation charges and other allowancesfor capital consumption, labour and property located in Canada. Itincludes the total output of goods and services by private consumersand government, gross private domestic capital investment and netforeign trade. GDP figures are reported in real 1986 dollars.
Higher Heating Value The amount of heat that is obtained when a specified amount of fuel is combusted with its stoichiometrically correct amount of air,both being at 15˚C when combustion starts, and the products ofcombustion being cooled to 15˚C before the heat release is measured(also called gross calorific value or gross heating value).
Industrial Consumption of Energy Survey (ICE)Statistics Canada survey on energy use. Covers purchased and non-purchased energy for approximately 24 industrial sub-sectors.
Large Final Emitters Large final emitters are companies that produce goods in emissions-intensive sectors, including primary energy production, electricityproduction and selected areas of mining and manufacturing production.The Climate Change Plan for Canada defines sectors as large finalemitters using the following criteria:• annual average emissions of 8 kilotonnes of CO2e per establishment
or more; and • annual average emissions of 20 kilograms of CO2e per $1,000 gross
production or more.
Large Final Emitters GroupThe Large Final Emitters Group of NRCan was established in late 2002and is responsible for working with key industry sectors to reduceannual GHG emissions. Projections show that large industrial emitterscould produce about half of Canada’s total GHG emissions by 2010.In accordance with the Climate Change Plan for Canada, largeindustrial emitters are to reduce their emissions by 55 megatonnesof CO2e. Through its discussions with industry, provinces andterritories and other stakeholders, the Large Final Emitters Group willdesign policies and measures that encourage reductions of thismagnitude, are administratively efficient and clear, and help tomaintain the competitiveness of Canadian industry.
Lower Heating Value The higher heating value minus the latent heat of vaporization of thewater vapour formed by the combustion of any hydrogen present in the fuel. For a fuel with no hydrogen, the higher and lower heatingvalues are the same (also called the lower calorific value or the netheating value).
Glossary of Terms
78 2003/2004 CIPEC ANNUAL REPORT
Natural Resources Canada (NRCan) The predominant natural resource department of the Government of Canada, NRCan has a mandate to promote the sustainabledevelopment and responsible use of Canada’s mineral, energy andforestry resources and to develop an understanding of Canada’s land mass.
Nitrogen Dioxide (NO2)One of a group of gases called nitrogen oxides, which are composedof nitrogen and oxygen. Like sulphur dioxide, nitrogen oxides can reactwith other chemicals in the atmosphere in the presence of sunlight toform acidic pollutants, including nitric acid.
Nitrogen Oxides (NOx)The sum of nitric oxide (NO) and nitrogen dioxide (NO2). Nitrogen oxidesreact with volatile organic compounds in the presence of sunlight toform ground-level ozone.
North American Industry Classification System (NAICS)A classification system that categorizes establishments into groupswith similar economic activities. The structure of NAICS, adopted byStatistics Canada in 1997 to replace the 1980 Standard IndustrialClassification (SIC) system, has been developed by the statisticalagencies of Canada, Mexico and the United States.
Physical Energy IntensityEnergy consumption per unit of physical output.
Quarterly Report on Energy Supply and Demand (QRESD) Provides an energy balance of all energy consumption in Canada.QRESD data on the manufacturing industries are gathered principallyby the Industrial Consumption of Energy (ICE) survey. These data aresupplemented by other surveys on the disposition of energy (fromutilities) and the production of petroleum products.
Specific Energy (Consumption)Energy consumption per physical unit of output (also called physicalenergy intensity).
Standard Industrial Classification (SIC) A classification system that categorizes establishments into groupswith similar economic activities.
Statistics CanadaStatistics Canada is the country’s national statistical agency, withprograms organized into three broad subject areas: demographic andsocial, socio-economic and economic. Under the Statistics Act,Statistics Canada is required to collect, compile, analyze, abstractand publish statistical information on virtually every aspect of thenation’s society and economy. All information given to StatisticsCanada through surveys, the census or any other source isconfidential. Statistics Canada does not release any information thatidentifies an individual or organization.
Sulphur Oxides (SOx)A product of combustion of fuels that contain sulphur. Sulphur oxidesare a major component of acid rain.
Tier IInformal designation by CIPEC of industries that are major energy-consuming industries. The seven designated Tier I industries are pulpand paper, petroleum refining, cement, mining, steel, chemicals andaluminum. The Tier I industries account for approximately 80 percentof total Canadian industrial energy consumption.
Tier IIInformal designation by CIPEC of industries that are minor energy-consuming industries (relative to Tier I industries) but contributesubstantially to Canadian industrial GDP. Tier II industries account for60 percent of Canadian industrial GDP.
Glossary of Terms (continued)


For more information or to receive additional copies of this publication, contact
Canadian Industry Program for Energy Conservation
Office of Energy EfficiencyNatural Resources Canada580 Booth Street, 18th FloorOttawa ON K1A 0E4
Tel.: (613) 995-6839Fax: (613) 992-3161E-mail: [email protected] site: oee.nrcan.gc.ca/cipec
Natural Resources Canada’s Office of Energy Efficiency
Leading Canadians to Energy Efficiency at Home, at Work and on the Road
Canadian Industry Program for Energy Conservation (CIPEC)
2003/2004 Annual Report