The Maternal and Child Health Program - mchlibrary.org · maternal and child health assistance...
152
1935-2000 A Review of Federal Appropriations and Allocations to States for Maternal and Child Health Programs Under Title V of the Social Security Act of 1935 (FY1936-FY1981) and the Omnibus Reconciliation Act of 1981 (Maternal and Child Health Block Grant, FY1982-FY1999) 65 Celebrating 65 Years of Title V The Maternal and Child Health Program
Transcript of The Maternal and Child Health Program - mchlibrary.org · maternal and child health assistance...

Maternal and Child Health BureauMaternal and Child Health BureauMaternal and Child Health BureauMaternal and Child Health BureauMaternal and Child Health Bureau5600 Fishers Lane5600 Fishers Lane5600 Fishers Lane5600 Fishers Lane5600 Fishers LaneParklawn BuildingParklawn BuildingParklawn BuildingParklawn BuildingParklawn BuildingRockville, MD 20857Rockville, MD 20857Rockville, MD 20857Rockville, MD 20857Rockville, MD 20857tel. 301.443.0205tel. 301.443.0205tel. 301.443.0205tel. 301.443.0205tel. 301.443.0205fax. 301.443.1797fax. 301.443.1797fax. 301.443.1797fax. 301.443.1797fax. 301.443.1797
1935-2000A Review of FederalAppropriations andAllocations to Statesfor Maternal and ChildHealth Programs UnderTitle V of the SocialSecurity Act of 1935(FY1936-FY1981)and the OmnibusReconciliation Act of1981 (Maternal andChild Health BlockGrant, FY1982-FY1999)
65
Published February 2001Published February 2001Published February 2001Published February 2001Published February 2001
Celebrating65 Years of Title V
The Maternal and ChildHealth Program
i
Celebrating 65 Years of Title VCelebrating 65 Years of Title VCelebrating 65 Years of Title VCelebrating 65 Years of Title VCelebrating 65 Years of Title VThe Maternal and Child Health ProgramThe Maternal and Child Health ProgramThe Maternal and Child Health ProgramThe Maternal and Child Health ProgramThe Maternal and Child Health Program
1935–2000
A Review of Federal Appropriations and Allocations to States forMaternal and Child Health Programs Under Title V of the
Social Security Act
February 2001

ii
The following members of the Maternal and Child Health Bureau participated in the preparation of this report:
Peter C. van DyckAssociate Administrator for Maternal and Child Health
Kerry P. NesselerDeputy Associate Administrator for Programs
Michael MucciExecutive Officer
Lynn SquireLegislative Officer, Office of Program Development
Michelle BassaniBudget Analyst
Carol O’TooleProgram Analyst
This document is an update of “50 Years of U.S. Federal Support to Promote the Health of Mothers, Childrenand Handicapped Children in America 1935–1985” prepared by the Information Sciences Research Institute,through support by HRSA grant #MCJ-240459. Information presented in this document prior to 1985 isderived from that document.

iii
ForewordForewordForewordForewordForewordhe publication of this volume is a celebration of 65 years of growth and development. Title V ofthe Social Security Act created the Federal-State Maternal and Child Health (MCH) Partnership—
the foundation of America’s maternal and child health infrastructure.
Since 1935, the achievements of the Title V Federal-State Partnership have been integrated into theongoing care system for children and families. A few of the Partnership’s major contributions to dateinclude:
• Provided a safety net of last resort for children and families with no financial means for accessingmedical care.
• Brought the concerns of children with special health care needs and their families to the attentionof the health professions.
• Initiated professional training for needed MCH specialty and subspecialty areas such as adolescentmedicine, neurodevelopmental disabilities, and behavioral pediatrics.
• Made Title V the first Federal program to implement a State “match” for Federal Block Grant funds,producing an additional $2 billion for maternal and child health annually.
• Inaugurated a national Title V Information System (TVIS) that provides easy access to evidence-based results of MCH practice nationwide.
Today, as one of the largest Federal block grant programs, Title V leads the Nation in assuring thehealth of all America’s pregnant women, infants, children, adolescents, and their families—includingwomen of reproductive age, fathers, and children with special health care needs.
The Maternal and Child Health Bureau’s (MCHB) mission is to provide national leadership and to workin partnership with States, communities, public-private partners, and families to strengthen the MCHinfrastructure, assure the availability and use of medical homes, and build knowledge and humanresources to assure continued improvement in the health, safety, and well-being of the maternal andchild population. MCHB provides leadership to improve access to comprehensive, culturally sensitive,quality health care for all pregnant women, infants, children, adolescents, and their families, includingwomen of reproductive age, fathers, and children with special health care needs.
MCHB envisions a future America in which the right to grow to one’s full potential is universally assuredthrough attention to the comprehensive physical, psychological, and social needs of the MCH population. Itstrives for a society in which children are wanted and are born with optimal health, receive quality care, andare nurtured lovingly and sensitively as they mature into healthy, productive adults. Bureau programs helpus become a Nation that provides equal access for all to quality health care in a supportive, culturallycompetent, family, and community setting.
Peter C. van Dyck, M.D., M.P.H.Associate Administrator for Maternal and Child HealthMaternal and Child Health BureauHealth Resources and Services Administration
T

v
Foreword ........................................................................................................................................................... iiiIntroduction ........................................................................................................................................................ 1 Title V Components ......................................................................................................................................... 1 Historical Background ...................................................................................................................................... 2Title V of the Social Security Act of 1935 ........................................................................................................... 3 Early Funding ................................................................................................................................................... 3 Early Allocation Formulas ................................................................................................................................ 4OBRA 1981 and Title V: 1981–1985 ................................................................................................................. 12Title V of the Social Security Act: 1986–1999 .................................................................................................. 14Trends in MCH Appropriations: 1936–2000 ....................................................................................................... 20Sources ........................................................................................................................................................... 21 Figures Figure 1. Trends in United States Infant Mortality Rates by Race, 1930–1998 ................................................ 3 Figure 2. Trends in United States Maternal Mortality Rates by Race, 1930–1998 ........................................... 4 Figure 3. United States Title V and MCH Block Grant Allocations to States in Current DHHS Regions
in FY1937–FY2000 ......................................................................................................................................... 8 Figure 4. Trends in United States Title V and MCH Block Grant Annual Appropriations and the
Constant Dollars Based on the Consumer Price Index (CPI), FY1936–FY2001 ............................................. 10 Figure 5. Trends in United States Low Birthweight Ratios by Race, 1950–1999 ........................................... 12AppendixTable 1. United States Title V Health and Related Programs and MCH Block Grant Appropriations by
Program Components, FY1936–FY2001 ....................................................................................................... 24Table 2. United States Title V Uniform and Minimum Grants to Each State, FY1936–FY2001 .......................... 26Table 3. United States Title V Project Grant (Reserve B, Research, Training, Hemophilia and
Genetics Funds), and MCH Block SPRANS Grant Funding, FY1936–FY2001 .............................................. 28Table 4. United States Title V or MCH Block Grant Total Annual Appropriations and Constant
Dollars Based on the Consumer Price Index (CPI) with 1967 as the Base Year, FY1936–FY2001 ................. 30Tables 5–61. United States Title V or MCH Block Grant Allocations to Each State
(showing Constant Dollars for Total Amounts) by Program Components, FY1936–FY2001Table 5. Alabama ............................................................................................................................................. 32Table 6. Alaska................................................................................................................................................. 34Table 7. Arizona ............................................................................................................................................... 36Table 8. Arkansas ............................................................................................................................................. 38Table 9. California ............................................................................................................................................. 40Table 10. Colorado ........................................................................................................................................... 42Table 11. Connecticut ....................................................................................................................................... 44Table 12. Delaware ........................................................................................................................................... 46Table 13. District of Columbia ........................................................................................................................... 48Table 14. Florida ............................................................................................................................................... 50Table 15. Georgia ............................................................................................................................................. 52Table 16. Hawaii ............................................................................................................................................... 54Table 17. Idaho ................................................................................................................................................. 56Table 18. Illinois ............................................................................................................................................... 58Table 19. Indiana .............................................................................................................................................. 60Table 20. Iowa .................................................................................................................................................. 62Table 21. Kansas ............................................................................................................................................. 64Table 22. Kentucky .......................................................................................................................................... 66
ContentsContentsContentsContentsContents

vi
Table 23. Louisiana .......................................................................................................................................... 68Table 24. Maine ................................................................................................................................................ 70Table 25. Maryland ........................................................................................................................................... 72Table 26. Massachusetts ................................................................................................................................. 74Table 27. Michigan ........................................................................................................................................... 76Table 28. Minnesota ......................................................................................................................................... 78Table 29. Mississippi ........................................................................................................................................ 80Table 30. Missouri ............................................................................................................................................ 82Table 31. Montana ............................................................................................................................................ 84Table 32. Nebraska .......................................................................................................................................... 86Table 33. Nevada .............................................................................................................................................. 88Table 34. New Hampshire ................................................................................................................................. 90Table 35. New Jersey ....................................................................................................................................... 92Table 36. New Mexico ...................................................................................................................................... 94Table 37. New York .......................................................................................................................................... 96Table 38. North Carolina ................................................................................................................................... 98Table 39. North Dakota ................................................................................................................................... 100Table 40. Ohio ................................................................................................................................................ 102Table 41. Oklahoma ....................................................................................................................................... 104Table 42. Oregon ............................................................................................................................................ 106Table 43. Pennsylvania ................................................................................................................................... 108Table 44. Puerto Rico ..................................................................................................................................... 110Table 45. Rhode Island ................................................................................................................................... 112Table 46. South Carolina ................................................................................................................................ 114Table 47. South Dakota .................................................................................................................................. 116Table 48. Tennessee....................................................................................................................................... 118Table 49. Texas .............................................................................................................................................. 120Table 50. Utah ................................................................................................................................................ 122Table 51. Vermont .......................................................................................................................................... 124Table 52. Virgin Islands .................................................................................................................................. 126Table 53. Virginia ............................................................................................................................................ 128Table 54. Washington ..................................................................................................................................... 130Table 55. West Virginia .................................................................................................................................. 132Table 56. Wisconsin ....................................................................................................................................... 134Table 57. Wyoming ........................................................................................................................................ 136Table 58. American Samoa ............................................................................................................................ 138Table 59. Guam .............................................................................................................................................. 140Table 60. Mariana Islands ............................................................................................................................... 142Table 61. Trust Territories ............................................................................................................................... 144

1
Introductionith roots going back to the formation of theChildren’s Bureau in 1912, Title V of the Social
Security Act provides a foundation for ensuring the healthof our Nation’s mothers and children. Enacted by Con-gress in 1935, Title V authorized the Maternal and ChildHealth Services Programs that are now administered bythe Maternal and Child Health Bureau (MCHB) as part ofthe Health Resources and Services Administration, Pub-lic Health Service, U.S. Department of Health and HumanServices. More than 65 years later, Title V continues toprovide leadership, performance, and accountability toensure the delivery of health care services to all moth-ers, infants, children, adolescents, and children with spe-cial health care needs in the Nation—including those withlow incomes, diverse ethnic or racial backgrounds, or iso-lated populations with limited access to care.
This report chronicles the development and evolution ofTitle V from its inception through 65 years of develop-ment and change. The resulting history shines acelebratory light on Title V’s first 65 years, as the unfold-ing story clearly shows the depth and scope of theprogress made toward improving the health of mothersand children in this country. Such a retrospective look atTitle V on its anniversary truly demonstrates its stronghistory, solid present, and promising future. Title V today:
• remains the only Federal program that focuses solelyon improving the health of all mothers and children;
• is a partnership with State Maternal and Child Health(MCH) and Children with Special Health Care Needs(CSHCN) programs, reaching across economic linesto support such core public health functions as re-source development, capacity and systems building,population-based functions such as public informationand education, knowledge development, outreach andprogram linkage, technical assistance to communities,and provider training;
• makes a special effort to build community capacity todeliver such enabling services as care coordination,transportation, home visiting, and nutrition counseling,which complement and help ensure the success of StateMedicaid and the State Children’s Health InsuranceProgram (SCHIP) medical assistance programs;
• supports programs providing gap-filling prenatal healthservices to more than 2 million women and primaryand preventive health care to more than 17 millionchildren, including almost 1 million children with spe-cial health needs;
• conducts special projects to target underserved urbanand rural areas with efforts at the community level thatpromote collaboration between public and private sectorprofessionals, leaders, and health care providers; and
W• ensures that trained pediatric emergency specialists
and emergency equipment suited to the special needsof children are widely available, and that protocols toensure that more young lives can be saved in emer-gency situations are properly in place.
Title V ComponentsTitle V ComponentsTitle V ComponentsTitle V ComponentsTitle V ComponentsUnder Title V of the Social Security Act, the Maternal andChild Health Program has three components: formulablock grants to 59 States and territories, Special Projectsof Regional and National Significance (SPRANS), andCommunity Integrated Service Systems (CISS) grants.
The Title V Maternal and Child Health Block Grant isdesigned to assist States in building a service infrastruc-ture that ensures the provision of needed services tovulnerable MCH populations—hard-to-reach, low-income,and minority populations and children with special healthcare needs and their families—to assist these popula-tions in accessing available services. Title V Maternal andChild Health Block Grant requirements include:• Reducing infant mortality and incidence of handicap-
ping conditions among children;• Increasing the number of children appropriately im-
munized against disease;• Increasing the number of low-income children receiv-
ing health assessments and follow-up diagnostic andtreatment services;
• Providing and ensuring access to comprehensiveperinatal care for women; preventive and child careservices; comprehensive care, including long-termcare services for children with special health careneeds; and rehabilitation services for blind and dis-abled children under 16 years of age who are eligiblefor Supplemental Security Income (SSI); and
• Facilitating the development of comprehensive, fam-ily centered, community-based, culturally competent,coordinated systems of care for children with specialhealth care needs and their families.
Activities supported under Special Projects of Regionaland National Significance (SPRANS) include MCH re-search, training, genetic services, hemophilia diagnosticand treatment centers, and maternal and child healthimprovement projects that support a broad range of in-novative strategies. In addition, SPRANS funds supportthe Traumatic Brain Injury (TBI) Demonstration Grant Pro-gram, which provides grants to States to implement sys-tems that ensure access to comprehensive and coordi-nated TBI services.The Community Integrated Service Systems (CISS)program seeks to reduce infant mortality and improvethe health of mothers and children by funding projectsfor the development and expansion of integrated servicesat the community level.

2
Historical BackgroundHistorical BackgroundHistorical BackgroundHistorical BackgroundHistorical BackgroundThe early organizational unit in the United States FederalGovernment concerned with maternal and child healthwas the Children’s Bureau established in 1912 in the De-partment of Commerce and Labor. Its purpose was “toserve all children, to try to work out the standards of careand protection which shall give to every child his fair chancein the world.” The Bureau’s initial role was as a fact-find-ing agency.
The Bureau selected infant mortality as the first subjectit studied because of its “fundamental social importance,the popular interest it aroused” and because, as eachsegment of the study was completed, it could be issued.The study was conducted in selected areas throughoutthe country (because no national birth or death registryexisted) and found great variations in infant mortalityrates between States, in different areas of the sameState, or individual communities and between towns andrural districts. The variations were related to:
• Differences in social and economicconditions identified.
• Differences in the quality of prenataland infant care and the availability offacilities to provide such care.
The Children’s Bureau also assembledand disseminated evidence of the meth-ods used in successful efforts to reduceinfant mortality:
• Instruction of mothers through infant welfare cen-ters using public health nurses.
• Bulletins on proper care of children and the valueof breast-feeding.
• Public information programs on the importance ofconsulting a physician upon the first evidence of ahealth problem during pregnancy.
These efforts, widely implemented throughout the Na-tion, contributed to the substantial reductions in infantmortality between 1915 and 1921 from 99.9 to 75.6deaths per 1,000 live births.
The studies and education activities of the Children’sBureau addressed a broad spectrum of problems of moth-ers and children and resulted in many laws and programsand development of many organizations:
• Development of a U.S. Birth (and Death) Registry(which by 1922 included 30 States and the District ofColumbia and included 72.2 percent of newborns).
• Laws addressing use of children in the labor market.
The Children’sBureau funding wasfor $25,640 a yearinitially and did notincrease very muchfor several years.
• Laws for juvenile courts.
• Laws concerned with mothers’ pensions.
• Laws concerned with sex offenses against children.
• Laws concerned with importation and exportation ofchildren.
Another early study comparing the U.S. infant mortalityrates with those of other nations showed that the U.S.rates were worse than those of five countries with compa-rable economic development. This finding and the forma-tion of the birth and death registry led to a study analyz-ing vital records, which showed that the reduction in in-fant mortality mentioned above made little progress in re-ducing deaths in the period of early infancy—most of whichwere defined as having “maternal causes.” This analysisand the fact that the maternal mortality rate in the U.S.was actually increasing led inevitably to concern for careof mothers before, during, and after childbirth.
In 1917, the annual report of the Children’s Bureau calledattention to a cooperative effort between national and lo-
cal governments in Great Britain to pro-vide grants-in-aid for maternal and infant“welfare.” The report suggested the useof U.S. Federal-aid grants to States as abasis for national and State cooperationto reduce the high mortality rates amongU.S. mothers and babies.
This approach was adopted under theSheppard-Towner Act of 1921. The act
called for a “State-initiated plan” for the program to be un-dertaken by each State and provided for:
• $5,000 unmatched to each State, and
• an additional $5,000 to each State if the State matchedthe money $1 State (or local) for $1 Federal.
The balance of each appropriation was to be allotted onthe basis of population and was granted only if matchedas described above.
The Sheppard-Towner Act was funded at $1,240,000 an-nually for its first 5 years and limited the amount theChildren’s Bureau could use for administration to $50,000per year. The Act ended in 1929.
The purpose of this very brief description of the begin-nings of the Maternal and Child Health Program is to callattention to the fact that from the very outset, this pro-gram operated quite differently from many other govern-ment programs.
• It provided leadership at the Federal level by furnish-ing facts that identified problems and methods of deal-

3
ing with them and it focused national attention on theproblems of mothers and children.
• It helped to develop legislation and it built support inthe Executive branch and the Congress and amongprofessional, women’s, church, and other groupsthroughout the Nation for the efforts designed to ad-dress the many health and welfare needs of mothersand children.
• It helped to develop a Federal program which requiredState initiation of a plan for the State and, while pro-viding a small grant to start the effort, encouragedStates by providing Federal monies to match moniesthat States would commit.
Title V of the SocialSecurity Act of 1935
he ending of the Sheppard-Towner Act and the im-pact of the Great Depression eroded the States’
abilities to continue useful child health work. One resultof the cutbacks in promoting health care and reducedquality of nutrition was an increase in the infant mortalityrate in 1933. (See Figure 1 which depicts infant mortalityrates by race in the U.S. from 1930 to 1998 and Figure 2which depicts maternal mortality rates by race for the sameperiod.) The Children’s Bureau response to this situationwas a new and stronger plan based on the Sheppard-Towner Act, presented by Frances Perkins, Secretary ofLabor, in her Annual Report of 1934. A principal advisoron the health portions of the new bill was Dr. Martha M.Eliot who was head of the Bureau’s Division of Child andMaternal Health at the time and later a Chief of theChildren’s Bureau. The bill was enacted in 1935 as TitleV of the Social Security Act–Grants to States for Mater-nal and Child Welfare. Part 1 was for Maternal and ChildHealth (MCH) Services, Part 2 was for Services forCrippled Children (CCS), and Part 3 was for Child Wel-fare Services (CWS). There were also two other parts:Part 4, Vocational Rehabilitation, and Part 5, Administra-tion. Geographic areas included in the original legisla-tion were the 48 contiguous States, the District of Colum-bia, and the territories of Alaska and Hawaii.
The Act made very clear that it was not intended simply to“pay for” services for the groups identified. In each pro-gram, the purpose was to “extend and improve” servicesavailable in each State for the target group, “especially inrural areas and in areas suffering from severe economicdistress.” For the CCS Program, an additional goal for theState was to ensure “services for locating crippled chil-dren” as well as to provide services and facilities for diag-nosis, hospitalization, and aftercare for “children who are
T
MCH Program $1,580,000CCS Program $1,187,000
The authorizations1 for FY1936 and FY1937 and the ap-propriation1 for FY1937 (see Appendix Table 1) were:
MCH Program $3,800,000CCS Program $2,850,000CWS Program $1,500,000
crippled or suffering from conditions which lead to crip-pling.” The CWS Program was intended to help States es-tablish, extend, and strengthen services for the protectionand care of homeless, dependent, and neglected children,and children in danger of becoming delinquent.
Early FundingEarly FundingEarly FundingEarly FundingEarly FundingThe initial appropriations1 in February 1936 (for a 5-monthperiod only) were as follows:
1Authorization levels are the “ceilings” set by the Con-gress on amounts which can be spent on a program.Appropriations are the amounts authorized to be spenteach year by the Congress. They may be the same but theappropriation is often less than the authorization. In atleast one instance, FY1982, the appropriation was greaterthan the authorization limit. The appropriation could beused because of agreements between the congressionalcommittees and the language used in the appropriationbill.
FIGURE 1. Trends in United States Infant MortalityRates by Race, 1930–1998
Sources: Vital Statistics Rates in the United States: 1900–1940, Bu-reau of the Census, United States Department of Commerce. VitalStatistics Rates in the United States: 1940–1960, National Center forHealth Statistics (NCHS), Public Health Service (PHS). Vital Statistics ofthe United States: Mortality, Part A. 1961–1980, NCHS, PHS. NCHSMonthly Vital Statistics Report: Final Data, NCHS.

4
States were required tosubmit State plans foreach program and pay-ments could be made onlyto States with approvedplans. Following the basicpattern defined in theSheppard-Towner Act of1921, the Congress stipu-lated allotments to Statesfor each program. The Actrequired, among otherprovisions intended to en-sure compliance with theintent of the Act, that Statesparticipate financially andthat each one should as-sign supervision of the ad-
ministration of its plans for each program to the healthdepartment (for MCH programs) or another State agency.The States were required to match $2,820,000 of the$3,800,000 appropriated for the MCH Program and allof the $2,850,000 appropriated for the CCS Program.The “match” requirement from the beginning of the TitleV Health Programs (MCH and CCS) has been $1 State(or local) for each $1 Federal Fund A portion. Within 9months of the time funds were appropriated, all autho-rized areas were participating.
FIGURE 2. Trends in United States MaternalMortality Rates by Race, 1930–1998
Sources: Vital Statistics Rates in the United States: 1900–1940,Bureau of the Census, United States Department of Commerce. VitalStatistics Rates in the United States: 1940–1960, National Center forHealth Statistics (NCHS), Public Health Service (PHS). Vital Statisticsof the United States: Mortality, Part A, 1961–1980, NCHS, PHS. NCHSMonthly Vital Statistics Report: Final Data, NCHS.
Early Allocation FormulasEarly Allocation FormulasEarly Allocation FormulasEarly Allocation FormulasEarly Allocation FormulasThe early legislation was explicit in some respects re-garding the way monies would be allotted for respond-
2 Since the numbers of these have never been known, the proportionsof the population under 21 years in each State have been used toestimate the proportion of crippled children on the assumption that theincidence of crippling conditions is the same in each State.
ing to the legislation’s concern for rural populations andeconomically distressed areas were adjusted by admin-istrative action fairly frequently. Funds appropriatedearly in 1936 were for a partial year (5 months) andwere generally seen as “start-up” money. The initial leg-islation stipulated distribution of the authorized monieson the following bases:
MCH Program
• Allocation of $2,820,000 by giving a uniform grant or“base” of $20,000 to each State (see Appendix Table2) and apportioning the remaining $1,800,000 to Stateson the basis of each State’s percent of all U.S. livebirths (in the latest calendar year for which such dataare available). This apportionment [defined in Section502 (a) of the Act] became known as Fund A monies,which were awarded if matched as described above.
• Apportionment of $980,000 by the Secretary of Laboron the basis of each State’s need for financial assis-tance in carrying out its plan. This apportionment [de-fined in Section 502 (b) of the Act] became known asFund B monies. The funds initially allocated under theFund B allotment were available only to State agen-cies and never had a requirement for State matchingmonies. They were awarded based on the following:
- $255,000 distributed as a minimum grant of $5,000to each State;
- $240,000 on the basis of the State’s proportion ofexcess infant deaths (deaths that would not haveoccurred if the U.S. infant mortality rate existed inthe State);
- $240,000 on the basis of the State’s proportion ofexcess maternal deaths;
- $245,000 on the basis of scarcity of population(rurality).
• The act provided for carry-over of “A” funds for up to 2years.
CCS Program
Allotments to States with an approved plan for this program(see Appendix Table 1) called for the uniform $20,000 grantallotment (see Appendix Table 2) with the rest to be appor-tioned on the basis of the numbers of crippled children2.There was no Fund B initially in the appropriation of CCSProgram monies so all of the CCS appropriation requiredState matching monies. However, even before a CCS FundB was established, reference was made to an “S-Fund” set
The activities of theChildren’s Bureauduring its firstdecade (1912–1921)resulted in anincrease in thenumber of Stateswith special unitsconcerned withchild health from 1to 46. Forty Statesparticipated with theFederal governmentunder the Sheppard-Towner Act.

5
aside from the CCS appropriation to go to States where thenumber of crippled children and costs of services were“above average.”
CWS Program
For this program the basic allotment to each State with anapproved plan was $10,000. The remainder was to be al-located on the basis of the State plan, not to exceed theproportion of the State’s rural population to the rural U.S.population. Expenditures were to be made to encourageand assist development of State services in areas that werepredominantly rural or were areas of special need. Thisreport will not deal further with this type of Title V funding,but includes the initial instructions on allotments to Statesbecause they provide another example of the conceptsused in apportioning the Title V monies.
From the outset, the leadership group in the Children’sBureau recognized the importance of special kinds of sup-port for their efforts. One of these involved developmentof research studies to document the need for improvedhealth care for mothers and children and the usefulnessof various efforts to make an impact on health status mea-sures. This was seen for some time as an “in-house” re-sponsibility. Another involved the need for training for thevarious types of health professionals to manage healthprograms for mothers and children and to provide ser-vices. Initially, training was focused on State program em-ployee needs for “in-service training.” Finally, there wasthe need for demonstration projects to show how to orga-nize and provide services. These were viewed as “specialprojects” and monies were awarded based on requestsfor funding of individual activities.
The following is a summary of changes, to aid in under-standing the Title V health programs funding picture. Theyinclude changes in the basic coverage of the programs orin the formulas used to allocate the appropriations to States,as well as procedures used to distribute the appropriationsto various program components. In all cases, the table ofU.S. annual appropriations data (Appendix Table 1) andtables of State allocations (Appendix Tables 5 through 61)reflect these changes.
Over the years, the ceilings placed on the amounts autho-rized for the Title V appropriation have increased. The au-thorization ceilings are generally not covered in this report.
Changes in Funding Levels and AllocationFormulas
1939 —1949
In 1939, several important changes occurred in the legis-lation:
•The annual total fiscal-year Federal appropriations forTitle V Health and Related Programs (FY1936–FY1981)and for the MCH Block Grant and for its components(FY1982–FY2000) are shown in Appendix Table 1.
• The “uniform and minimum” grants to States as part ofthe allocation formulas for both Fund A and Fund B(non-reserved portion) are shown for FY1936–FY1981in Appendix Table 2.
• The amounts “set aside” or “reserved” for project grantsto address specific purposes were stated in the agency’sreport to Congress each year, but there is almost noinformation after 1952 on how these funds wereawarded to States. Estimates of U.S. totals for theseamounts (reserve B funds) are shown in AppendixTable 3.
• Appendix Table 4 shows the U.S. appropriation(FY1936–FY2000) and the constant dollars as definedusing the Consumer Price Index.
• The information in the individual State Allocation Tables(Appendix Tables 5 through 61) reflects MCH and CCSProgram monies (Fund A and Fund B) reported in allo-cation tables submitted to Congress.
• Prior to 1952, the State Allocation Tables include mon-ies from Fund A and all of Fund B and monies for aspecial World War II program described on the nextpage. After 1952, these tables show Fund A and non-reserve Fund B monies along with monies for someother components.
• A “Fund B” was approved for the CCS Program and anauthorization for $1,000,000 was added to provide mon-ies for this. The first reference to an appropriation andallocation of this fund was in 1941.
• A new special program concerned with heart diseasewas assigned to the CCS Program to administer andnew funding was provided to support services to chil-dren with rheumatic fever and heart disease. In time,29 States had projects caring for children with theseproblems.
• The “required” elements of the State plans for MCHand CCS Programs were changed to include a newprovision for “establishment and maintenance of per-sonnel standards on a merit basis.”
In 1941, the concept of “reserved” monies from the CCSFund B to be spent on specified “priority areas of program
6
concern” appeared in the allocation tables. Other or “non-reserved” Fund B monies were allocated to States on thebasis of defined formulas.
In 1943, the Emergency Maternal and Infant Care (EMIC)Program was funded to be administered by the Children’sBureau (at the Federal level) and the State MCH Programs.This program awarded grants to States toprovide maternity and infant care servicesto wives and infants of enlisted men of theU.S. Armed Forces (4th, 5th, 6th and 7thgrades); it ended in 1949. The EMIC Pro-gram initiated the principle that paymentby the program to hospitals and physiciansrepresented “full payment” for services pro-vided to the EMIC patient. The program also developed aper diem cost formula for payment to hospitals for deliveryservices, which stipulated that no additional payment wasto be made, e.g., for any surgery needed.
In 1946, the Children’s Bureau was moved from the De-partment of Labor to the Federal Security Agency. Also,beginning in 1946, the total amounts authorized for theMCH and CCS Programs were divided equally betweenFund A, which had to be matched, and Fund B, which didnot have to be matched. Prior to this time, as mentionedabove, the concept of reserve and non-reserve B fundswas defined, with the non-reserve funds going directly toState programs to be responsive to the legislation’s con-cerns for ensuring the availability of care and services toeach State’s rural population and economically distressedareas. The formulas were adjusted periodically to reflectchanging program emphases and funding levels. The re-serve B funds were used only in response to funding re-quests for projects of “regional and national (as well asState and local) significance” for the development or ex-pansion of MCH and CCS Programs.
An example of a relatively early effort to develop a moresensitive measure of need is an allocation procedure ofthe MCH Program to distribute an “increased” amount ap-propriated for the non-reserve Fund B in 1946.
• States were arrayed by Per Capita Income (PCI).Eighty percent of the increase wasallotted to the two-thirds (34 States)with the lowest PCIs as follows:
- The PCI was weighted by theratio of children (defined as un-der 21 years) to adults.
• The number of live births wasweighted by the proportion of ru-ral births.
Puerto Rico was definedas eligible for coverageunder Title V of theSocial Security Act as ofJanuary 1, 1940.
In 1953, the newDepartment of Health,Education, and Welfare(DHEW) absorbed theFederal Security Agency,and the Children’s Bureaubecame part of the SocialSecurity Administration.
- The State apportionment varied inversely withthe weighted PCI and directly with the weightednumber of live births.
• The remaining 20 percent of the increase was ap-portioned among 23 States which had 1944 infantand maternal mortality rates above the U.S. rates and
PCIs less than that for the United Statesas a whole. The distribution was baseddirectly on the State’s proportion of the“excess” infant deaths in all 23 selectedStates. “Excess” was defined as the num-ber of deaths in the State less the num-ber that would have occurred in the Stateif the U.S. rate had obtained.
The CCS Program developed a similar approach to al-locating its increase in “non-reserve” B funds.
• Eighty percent of the increase was allocated as forthe MCH Program, except that the population groupfor weighting the rural proportion of the populationwas children (under 21 years).
• The 20 percent was allocated to the 34 States with thelowest PCIs, based on the numbers of crippled chil-dren on State program registers and admissions tocrippled children’s clinics weighted for the proportionof children in rural areas.
The Virgin Islands became eligible for coverage under TitleV of the Social Security Act as of January 1, 1947.
1950–1959
In 1950, the MCH and CCS Programs’ unbudgeted andunpaid Fund A monies from 1948 and 1949 could be in-cluded in the current fiscal year budget. In 1951, provi-sions for automatic carryover of unpaid Fund A monieswere eliminated.
The 1950 MCH Program allocation table referred to Fund Aas having a $35,000 uniform grant base for the allocation toeach State plus an amount apportioned on the basis of eachState’s proportion of the U.S. live birth population by Stateof residence. For Territories, the same uniform grant basewas awarded, but the proportion of live births was by place
of occurrence. For non-reserved FundB, each State/Territory received a mini-mum grant of $20,000 plus an amountcomputed by developing an adjustedpopulation base using two times the ru-ral live births plus urban births, whichwas further adjusted by a factor basedon each State’s PCI divided by twice theU.S. PCI. The State’s proportion of theU.S. total of this adjusted population basewas used to distribute non-reserve B

7
funds to each State. Thisprocess gave addedweight in computing theState’s proportion of thenew “total” to areas withlarge rural populationsand reduced the State’sproportion of the new “to-tal” based on its PCI.States with higher PCIshad the new “total” re-duced more than Stateswith lower PCIs. These
materials also referred to the obligation for continued fund-ing support for “special projects” funded by reserve Fund Bmonies and specified that monies were set aside for contin-ued funding for these projects.
The CCS Program in 1950 had a $30,000 uniform grantbase for the Fund A allocation to each State plus a portionbased on each State’s proportion of the U.S. child popula-tion. The CCS Fund B non-reserved portion had a $10,000minimum grant for each State. Here also rurality and fi-nancial need were defined by doubling the rural child popu-lation in the population base and adjusting it by the PCIfactor described above.
Improvements in medications available to treat infections inobstetrical procedures, and in surgical procedures stem-ming from the war, had been reflected in improved infantand maternal mortality rates during the 1940s. Nonethe-less, in the 1950s, infant mortality, which had been decliningsteadily since the late 1930s, slowed its rate of decline andfinally reflected an increase. (See Figure 1.) The studies ofmaternal, infant, and child mortality had, since the initiationof the Children’s Bureau, been very useful in assessing thehealth status and needs of mothers and children. Studiesof infant mortality and natality characteristics of the 1950sidentified several “high risk groups,” notably low birthweightinfants, babies born to mothers with a poor childbearinghistory (a prior fetal loss) and other-than-white infants. Theanalyses to identify causes for the infant mortality rate prob-lems in the 1950s were used to define new program initia-tives for mothers and children. A major finding in theseanalyses (completed in the early 1960s) was that providersand facilities to provide health care were moving to the sub-urbs as blacks began moving from the rural south to majorurban centers. By the mid-1950s, black ghetto populationsin major cities, and poor whites as well, were not receivingadequate maternal, infant, and child care.
Unlike mortality information, information on morbidity of chil-dren had never been so readily available (the NationalHealth Survey was finally undertaken in 1956) nor so com-prehensive. (It is based on a very small national sample.)
However, the National Health Survey of 1956 did provide,for the first time, a national estimate of levels of acute ill-nesses, selected chronic conditions, hospitalizations, den-tal care and special services such as X-rays, for use in healthplanning. There was a new national concern and focus onhandicapping conditions of children, stemming from the threatposed by poliomyelitis (infantile paralysis) and from the infor-mation on numbers of children with a broad range of handi-capping conditions defined by the National Health Survey andthe work of voluntary agencies.
1960 —1969
In 1960, major new changes defined distribution and useof Fund B monies. The appropriation for each Program(MCH and CCS) had been defined in 1946 as dividedequally between Fund A and Fund B. The following de-scribes the 1960 changes:
• From the Fund A half of each program’s appropria-tion, a uniform grant base of $70,000 was awarded toeach State with an approved plan, with the balanceawarded on the basis of each State’s proportion of theU.S. live birth and child populations, if matched. (Thisis only a change in the uniform grant level.)
• The other half of the appropriation (Fund B) was to beawarded in two portions: the same “reserve” and “non-reserve” portions defined earlier. The non-reserve por-tion was awarded on the basis of the minimum grant,the rurality factor, and PCI definition of a State’s eco-nomic need already described. For the reserve B funds,not more than 25 percent of this part of the appropria-tion (Fund B) for both programs or 12½ percent of theFund B part of each program’s appropriation could beawarded as grants to State health agencies, other pub-lic (State or local) agencies, and nonprofit institutionsof higher learning for “special projects of regional ornational significance.” (This is a major change sinceuntil this time, such grants could be given only to Stateagencies administering a Title V Program.)
In 1963, the Children’s Bureau was one of five units movedfrom the Social Security Administration to the Welfare Ad-ministration of DHEW. In October 1963, two major new de-velopments occurred:
• A new 5-year program of project grants to Statesor local health agencies was authorized for pro-jects to provide necessary health care for expect-ant mothers who have, or are likely to have,conditions associated with childbearing that in-crease hazards to the health of the mothers or theirinfants and who, because of income or other rea-sons beyond their control, will not receive such care.These grants, which came to be known as Mater-
In 1958, for the firsttime, a portion ofthe Title V funds wasearmarked for useonly for specialprojects for mentallyretarded children.These were oftenreferred to in lateryears as MR funds.

8
In August 1958 (FY1959), there was aspecial appropriationof $1,500,000 forsurgical correction ofcongenital heartdefects. This is part ofthe CCS totalappropriation in 1959and is also reflectedin State CCSallocations for 1959.
FIGURE 3. United States Title V and MCH Block Grant Allocations toStates in Current DHHS Regions in FY1937—FY2000
8
In July 1959, Guambecame eligible forcoverage underTitle V of the SocialSecurity Act.
Total MCH Block Grant Dollars Allocated to StatePrograms by DHHS Regions in FY2000
U.S. Total = $582,674,920
3 Includes also American Samoa, Guam, the Mariana Islands, and the Trust Territories.4 Includes also Puerto Rico and the Virgin Islands.
Source: Maternal and Child Health Bureau.
Region 6$72,874,758
Region 8$22,236,635
Region 10$20,039,960
Region 93
$56,794,678
Region 7$29,406,815
Region 5$103,010,278
Region 4$113,739,802
Region 3$66,462,225
Region 24
$72,362,506
Region 1$25,747,263
Total Title V Dollars Allocated to State Programs by DHHSRegions1 in FY19372
U.S. Total = $6,644,460
1 Monies are shown based on 1985 definitions of Regions.2 FY1937 was the first full year of Title V Program funding.
Region 6$828,313
Region 8$472,477
Region 10$302,912
Region 9$381,087
Region 7$424,481
Region 5$1,084,896
Region 4$1,326,921
Region 3$828,730
Region 2$494,586
Region 1$500,057

9
nal and Infant Care (M&I or M&IC) Projects, requireda matching of $1 State or local for each $3 Fed-eral. In the 1960s the project grants which, in time,became known as the “Program of Projects” werecalled “Special Projects.” [See Appendix Tables 1and 5–61 (Special Projects).] The initial authorizedfunding levels and appropriations were for:
1964 $5,000,0001965 $15,000,0001966-1968 $30,000,000 each year
• A new research program was authorized with$8,000,000 to be used for grants, contracts, orjointly financed cooperative arrangements which“can provide a substantial contribution toward im-proving maternal and child health and crippledchildren’s services.” Funding for this program beganin 1964. Appropriation levels were less than the amountauthorized.
In 1965, another group of changes was enacted:
• A new training program was authorized to award grantsto institutions of higher learning for training professionalpersonnel for health and related care of crippled chil-dren, particularly mentally retarded children and chil-dren with multiple handicaps. Initial authorized fundinglevels were:
1967 $5,000,0001968 $10,000,0001969 and later $17,500,000 each year
Appropriations were substantially less than these ceilings.
• A new requirement was that States demonstrate a sat-isfactory effort to extend MCH and CCS Program ser-vices to children in all parts of the State. This came tobe referred to as the requirement to demonstrate “state-wideness” of Title V MCH and CCS Programs.
• A new schedule of project grants was established tofund projects to State health departments, or, with theirapproval, to local health departments or various insti-tutions of higher learning or teaching hospitals, to pro-vide diagnostic services, preventive services,treatment services, correction of defects, and after-care for children and youth who would not otherwisereceive it because they are from low-income familiesor for other reasons beyond their control. The projectswere to provide comprehensive care and services inboth medical and dental areas. These projects be-came known as Children and Youth (C&Y) Projects.The legislation required an evaluation of the projectsby 1969. They also were funded on the basis of $1
In 1967, furtherreorganizations ofthe DHEW resultedin the Children’sBureau being as-signed to the Socialand RehabilitationService.
State/local for $3 Federal. The initial authorized fund-ing levels for these projects were:
1966 $15,000,0001967 $35,000,0001968 $40,000,0001969 $50,000,000
Appropriations were included in the Special Projects totalon Appendix Tables 1 and 5–61.
In 1968, major changes appeared in the program legislation:
• The Child Welfare Services were moved from Title V,Part 3 to Title IV, Part B of the Social Security Act.
• The funding levels for all ofthe Title V Health and Re-lated Programs were putinto a combined authoriza-tion and use of the monieswas defined as follows:
- Fifty percent of the ap-propriation was for MCHand CCS Programs un-til 1972. These fundswere still divided into Aand B fund portions and were to be allotted to Stateson the basis of the formulas for these programs.
- Forty percent of the appropriation was for M&IC,C&Y and Dental, and Other (Special) Projects asauthorized in later years until 1972.
- Ten percent of the appropriation was for trainingand research grants as described earlier.
- One half of one percent of the appropriation couldbe used by the Secretary’s Office for evaluation.
After FY1972, 90 percent of the appropriation would be forthe MCH and CCS Programs, envisioning incorporation ofthe Special Projects into the State program framework aspart of the “Program of Projects” and 10 percent would befor training and research grants. In fact, the 50/40/10 dis-tribution formula was continued through FY1974 as de-scribed below.
• The Secretary was given leeway to transfer up to5 percent of Title V funds from one unit to another.
• New requirements for “early identification and treat-ment” of crippled children and special attention to de-velopment of demonstration projects for family planningand dental care were provided and the “State-wide-ness” requirement was extended to these program ar-eas. Title V funds for “family planning services” were

10
nally came to pass. The administering agency was a gov-ernment unit that was known, over the years, as the Of-fice for Maternal and Child Health, and later, as the Divisionof Maternal and Child Health (DMCH), and now as theMaternal and Child Health Bureau.
By the late 1960s and throughout the 1970s, the Infantmortality rates declined steadily and at a much fasterrate than in the 1950s and early 1960s. (See Figure 1.)The combination of new programs, especially Medic-aid funding and the Program of Projects models for qual-ity care, and new medical practice, seemed to be hav-ing the “hoped-for” impact.
FIGURE 4. Trends in United States Title V andMCH Block Grant Annual Appropriations andthe Constant Dollars Based on the ConsumerPrice Index (CPI), FY1936–FY2001
Note: See Table 4 in the Appendix
1970 —1981
In 1970, a program for special projects to develop Inten-sive Infant Care Units (IICs or ICUs) was authorized. Theseprojects were the fourth category funded from the 40 per-cent of the appropriation for Special (Program of) Projects.The initial authorized funding level was $450,000 a year.
Dental Projects were authorized as part of the “40 percent”monies in 1971. The initial authorized funding level for theseprojects was $500,000 a year. These were the final projectsdefined as part of the Program of Projects.
In 1972, among other actions, implemen-tation of a number of decisions on Title Vfunding was delayed:
• In July of 1972, the separate funding (40percent of the appropriation) of SpecialProjects was extended for one year. In fact,the separate funding was extended year by
required to be no less than 6 per-cent of the monies for the “MCH Pro-gram.”
• State plans were required (as acondition to approval) by FY1972 toprovide for a “Program of Projects”(one each of a specified set ofprojects which, in time, included M&I,C&Y, Family Planning, Dental and In-tensive Infant Care Projects) and toplan to “take over” responsibility forexisting Special Projects in the Stateby FY1972. Plans were also requiredby FY1969 to provide for training anduse of subprofessionals.
• Various changes were made in theemphasis of training programs to re-flect interest in undergraduate training.
• A new requirement was for main-tenance of the 1968 level of fi-nancial support for MCH andCCS activities by State and localagencies. This became knownas the “maintenance of effort”requirement.
• Payment by the Title XIX (Med-icaid) Agency to Title V orga-nizations providing services toTitle XIX eligible patients wasauthorized.
By 1969, a major reorganization inthe Department of Health, Educa-tion, and Welfare moved the Medi-cal Services component of theChildren’s Bureau, which involvedmedical and health program effortsfor mothers and children, from theadministrative control of theChildren’s Bureau to the PublicHealth Service, Health Services andMental Health Administration. Ad-ministrative control of the health ser-vices for mothers andchildren by the PublicHealth Service, whichhad been suggestedrepeatedly since theearliest days of theChildren’s Bureau, fi-
A program of specialfamily planningprojects wasauthorized in 1969.This program was tobe funded from the40 percent of theTitle V appropriationdefined in 1968 forSpecial Projects. In1969, the portionauthorized forFamily Planning (FP)Projects was$12,000,000. In lateryears (FY1970 –FY1972), Title Vmonies weretransferred to theNational Center forFamily PlanningServices to fundthese projects. ForFY1971 and FY1972,the allocations forFamily PlanningProjects in theSpecial Projectsfunding totals forStates are notincluded in theappendix tables. InFY1973 and FY1974,the family planningmonies wereincluded again indefinitions of Title VSpecial Projectsfunding and werepart of the base forthe Title V of Section516 funding levels.FY1969, FY1970,FY1973, and FY1974family planningproject monies areincluded inAppendix Tables 1, 3and 5–61.
In 1978, coveragefor the Title VPrograms wasextended to theCommonwealthof the NorthernMariana Islands.

11
year until FY1975 when a compromise was workedout which protected (held harmless) the existence andfunding of the projects already in existence fromchanges that it was believed some States planned tomake. The arrangement was that the total Title V allo-cation for the MCH and CCS Programs and the Spe-cial (Program of) Projects which a State would receivecould be no smaller than it had been in FY1973, asdefined in the FY1973 State “base” for Title V funding.The monies, defined in Section 516 of Title V of theSSA and shown as “Section 516” monies on the ap-propriation and allocation tables, reflect the moniesdefined for protection of the Special Projects. In lateryears, complaints were made that since CCS Programmonies were included in the total and since the alloca-tions reflected the formula’s rurality bias, the MCH Pro-gram in large urban States (those with the most 516monies) were, in fact, being penalized. As a result ofthese issues, a number of analyses were performedto assess what might be involved in trying to modifythe Title V formulas. It soon became clear that changesin the allocation formula would mean one of two prob-lems: either there would be a new group of “gainers”and “losers” under the new formulas (and while allStates agree with the need for a new and better for-mula, no State wants that formula to mean that it wouldlose funding) or the basic “inequity” (as perceived bysome States) of the distributions would remain, if Con-gress again tried to “hold harmless” the funding levelsof some States. The formula was not changed.
• In October of 1972, a number of stipulations were maderelating to “charge levels,” development and monitor-ing of charge schedules and prohibitions of paymentsto persons under certain circumstances.
• Also in 1972, coverage under Title V of the Social Se-curity Act was extended to American Samoa and theTrust Territories of the Pacific.
In 1974, a small amount of Section 516 money was givento selected States to plan for the “Program of Projects,”including takeover of existing Special Projects.
Finally, in FY1975, the State MCH Programs assumed re-sponsibility for the Program of Projects, including the earlySpecial Projects. The Special Projects funding shown inAppendix Tables 1 and 5–61 for 1975 was the $10,472,000appropriated in 1973 and impounded by President Nixonuntil released by a court order and distributed in 1975.Materials developed for this publication also include theallocations for the so-called “transition quarter” in 1976when the Federal Government redefined its Fiscal Year,but in most analyses this information is ignored.
Although not directly related to Title V Program funding, anumber of new programs were authorized during the 1970son the basis of separate or categorical funding with mostbeing assigned to be administered by the Division of Ma-ternal and Child Health. These included: lead-based paintpoisoning prevention, sudden infant death syndrome(SIDS), hemophilia, genetic disease, and the adolescentpregnancy program. Another program, transferred to theDMCH in 1977, was the Supplemental Security Income Pro-gram for Disabled Children (SSI/DC). Monies for programsnot appropriated under Title V of the SSA, even if adminis-tered by the Federal MCH Program, are generally notshown on the Appendix Tables, but the genetic diseaseprogram and hemophilia program funding are shown onAppendix Table 3. Renewed emphasis within the Title VPrograms was given to preventive health programs suchas inoculations for preventable diseases, child accidentprevention, monitoring the health status of pre-school chil-dren (0–3 years), and adolescent health programs. Major
Last Formula Used Prior to OmnibusLast Formula Used Prior to OmnibusLast Formula Used Prior to OmnibusLast Formula Used Prior to OmnibusLast Formula Used Prior to OmnibusReconciliation Act of 1981Reconciliation Act of 1981Reconciliation Act of 1981Reconciliation Act of 1981Reconciliation Act of 1981
POP = Live Births (for MCH), orChildren <21 years (for Children <21 years (for Children <21 years (for Children <21 years (for Children <21 years (for CCS)
Compute Rural Weighting Factor (RWF) =Rural Weighting Factor (RWF) =Rural Weighting Factor (RWF) =Rural Weighting Factor (RWF) =Rural Weighting Factor (RWF) =US POP - DC POP
2(US Rural POP) + US Urban POP - DC POP
ComputeState Rural Weighted POP Base (RWB) =State Rural Weighted POP Base (RWB) =State Rural Weighted POP Base (RWB) =State Rural Weighted POP Base (RWB) =State Rural Weighted POP Base (RWB) =RWF x [2(State Rural POP) + State Urban POP]
Compute State Financial Need Factor (FN) =State Financial Need Factor (FN) =State Financial Need Factor (FN) =State Financial Need Factor (FN) =State Financial Need Factor (FN) =State 3-yr Avg PCI
2 (US 3-Yr Avg PCI)
Compute State Weighted Financial NeedState Weighted Financial NeedState Weighted Financial NeedState Weighted Financial NeedState Weighted Financial NeedAdjustment (WFN) =State FN x State POP
Compute Adjusted State POP Base (ASB) =Adjusted State POP Base (ASB) =Adjusted State POP Base (ASB) =Adjusted State POP Base (ASB) =Adjusted State POP Base (ASB) =State RWB - State WFN
Compute US Adjusted Births (Total AB) =Adjusted Births (Total AB) =Adjusted Births (Total AB) =Adjusted Births (Total AB) =Adjusted Births (Total AB) =Sum of all ASB’s
Compute $ per AB per AB per AB per AB per AB =US Fund A or non-reserved US Fund BFund A or non-reserved US Fund BFund A or non-reserved US Fund BFund A or non-reserved US Fund BFund A or non-reserved US Fund B
Total AB
Compute State Fund A or non-reserved Fund B =State Fund A or non-reserved Fund B =State Fund A or non-reserved Fund B =State Fund A or non-reserved Fund B =State Fund A or non-reserved Fund B =$ per AB x State’s ASB

12
new efforts to monitor cost of care saw development andimplementation of regionalized care programs to improvepregnancy outcome and for persons with hemophilia aswell as efforts to develop innovative approaches to financ-ing or arranging for care of handicapped children.These programs are mentioned because in some cases thefunding levels were included in the MCH Block Grant fundingbase under the Omnibus Reconciliation Act of 1981 or theyare categories of grants funded under the “new” SpecialProjects of Regional and National Significance (SPRANS).These are reflected in Appendix Table 3.
A review of the Federal appropriations and the uniformand minimum grants allocated by the formulas during the1970s shows that the funding levels were such that the$70,000 base for each program’s A and B funds becamea smaller and smaller part of the total allocated to someStates. The following example (using live births for MCHallocations and persons under 21 years for CCS alloca-tions) was the last formula used prior to the implementa-tion of the Omnibus Reconciliation Act of 1981. As can beseen, it subtracted the uniform grant base for each Statefrom Fund A and allocated the remainder of Fund A. Theprocess was repeated for the non-reserve Fund B, usingthe minimum grant base.
If this calculation generated at least $70,000 for eachState’s MCH and CCS Programs for Fund A and for thenon-reserved Fund B, this was the final calculation. If thiswas not the case, all States under $70,000 were adjustedup to $70,000 and the difference was subtracted from thetotal to be allocated, and their population base and $70,000were subtracted from the appropriate figures. By the sametoken, the other figures were adjusted so there was a new“dollars per adjusted population unit” amount that woulddistribute the new pool of dollars available for allocation tothe remaining States based on their adjusted State (popu-lation) base (ASB).
Another reorganization in the Federal government in thelate 1970s resulted in the dissolution of DHEW and estab-lishment of a new Department of Health and Human Ser-vices (DHHS) to manage the MCH and CCS Programs.
OBRA 1981 andTitle V: 1981—1985
he changes in the legislation and regulations begin-ning in 1969 and continuing through 1981 granted a
great deal of leeway to States in the use of Federal mon-ies. The concept of block grants in the Omnibus Budget
Reconciliation Act of 1981 (OBRA) (P.L. 97-35) extendedeven further this freedom to define how Federal funds formothers and children would be used in each State.
The block grant concept grew out of a new political phi-losophy, new legislation, and a new reorganization. TheReagan administration proposed to create a generic blockgrant composed of up to 40 categorical health and socialwelfare programs. The inclusion of programs in the MCHServices Block Grant that ultimately resulted was far lessextensive. The new MCH Block Grant replaced then-exist-ing authorities for maternal and child health services andcrippled children’s services under Title V; supplementalsecurity income for disabled children under Title XVI of theSocial Security Act; and related categorical Public HealthService Act programs for lead-based paint poisoning pre-vention, genetic diseases, sudden infant death syndrome,hemophilia, and adolescent pregnancy.
One important feature of the MCH Block Grant—thestrengthening of State authority—represented a recogni-tion of the century-long evolution in Federal-State rela-tions. The previous Title V requirement for submission of a“State Plan” in order to receive Federal funds was replacedby a “Report of Intended Expenditures (RIE),” whose ma-jor requirements included: (1) a needs assessment; (2) astatement of goals and objectives; (3) a description of ser-vices to be provided and characteristics of those to beserved; and (4) a statement of proposed data collection,
T
�
�
�
�
��
��
��
��
���� ���� ���� ���� ���� ���� ��� ��� ���� ���� ����
���
���� �!���������"�������
�� �
�����
�� ��
Sources: Vital Statistics Rates in the United States: 1900–1940, Bureau ofthe Census, United States Department of Commerce. Vital Statistics Ratesin the United States: 1940–1960, National Center for Health Statistics (NCHS),Public Health Service (PHS). Vital Statistics of the United States: Mortality,Part A, 1961–1980, NCHS, PHS. NCHS Monthly Vital Statistics Report:Final Data, NCHS.
FIGURE 5. Trends in United States LowBirthweight Ratios by Race, 1950–1999
13
analysis, and use. The legislation imposed no uniformityon States for the RIE, but a continuing Federal leadershiprole in improving the health status of mothers and childrenwas recognized through the mandate of “an identifiableadministrative unit with expertise in maternal and child healthwithin DHHS” to carry out designated national activities.
While States were given more discretion in the administra-tion of State Title V programs, the budget was severelycut. The permanent authorization for the MCH Block Grantwas set at $373 million. Under the Block’s matching re-quirements, States were required to spend $3 for every$4 Federal dollars. The Secretary of HHS was authorizedto set aside 15 percent of the Block’s appropriation inFY1982 and between 10 and 15 percent of its appropria-tion in succeeding fiscal years for special projects of re-gional and national significance (SPRANS).
The legislation also called for a review of the formulas usedto allocate the monies to States and cited a list of factors toconsider, including populations-at-risk and availability ofservices. It did not cite explicitly two items in the Title Vlegislation, “rurality” or “economically depressed areas,”but put an open-end on the list by mentioning “any otherfactors.” This part of the legislation raised again the manycomplaints about the formulas, and the DMCH undertookanother major review of the formulas and possible modifi-cations of them as the basis for allocating the new MCHBlock Grant to States. This review was undertaken with anadvisory group selected from the Association of MCH andCCS Directors, the Association of State and Territorial HealthOfficers, and the Association of Teachers of Maternal andChild Health. More than 300 formula models were exam-ined during this review.
In the end, the Congress decided that the MCH Block Grantwould be allocated on the following bases:
• 85 percent of the total to be awarded to States on thebasis of their 1981 proportion of the amount of desig-nated types of funds included in the MCH Block Grant,e.g., Fund A (MCH and CCS), non-reserved Fund B(MCH and CCS), SIDS, SSI/DC, adolescent pregnancyand lead-based paint poisoning prevention programs.No separate awards to be made for CCS; most Statesvoluntarily retained their pre-existing apportionment offunds between the two programs.
• 15 percent of the total MCH Block Grant to be awardedto authorized entities for SPRANS. See Appendix Table3, which depicts the evolution of reserve B funds, re-search and training funds, genetics funds, and hemo-philia funds into the new SPRANS discretionaryprojects program.
Ironically, one outcome of the administration’s enthusiasmfor block granting Title V in 1981 was an energizing of thenational maternal and child health constituency; advocatesrepeatedly petitioned during the 1980s to “elevate” theFederal MCH administrative unit to a higher level of orga-nizational visibility. In 1982, the Bureau of Community HealthServices was reorganized to elevate the MCH administra-tive unit from an office to a Division of Maternal and ChildHealth in a reorganized Bureau of Health Care Deliveryand Assistance (BHCDA). This Bureau, in turn, became acomponent of the Health Resources and Services Admin-istration (HRSA), a new agency of the Public Health Ser-vice which resulted from the consolidation of the HealthServices Administration and the Health Resources Admin-istration. In 1987, the Bureau of Maternal and Child Healthand Resources Development (MCHRD) was establishedwithin HRSA, but the name change notwithstanding, MCHwas only one of three co-equal units in MCHRD (alongwith a new AIDS program unit and another containing theremnants of the Health Planning and Hill-Burton programs).
The years immediately following the transition of Title V tothe MCH Block Grant witnessed several more legislativechanges affecting program direction. The ConsolidatedOmnibus Budget Reconciliation Act (COBRA) of 1965changed the traditional term “crippled children” to “chil-dren with special health care needs.” The following year,P. L. 99-509 increased the authorization to $533 million forFY1987, $557 million for FY1988, and $561 million in suc-ceeding fiscal years. The law further required that a speci-fied percentage of the newly authorized and appropriatedamount was to be set aside for projects for screening new-borns for sickle cell anemia and other genetic disorders(7 percent in FY1987; 8 percent in FY1988; and 9 percentin FY1989). Of the remaining new amounts, one-third wasdesignated for use in developing primary health servicesfor children and to promote community-based service net-works and case management services for children with spe-cial health care needs.
The early 1980s also witnessed other significant trends inthe evolution of the MCH program into a strengthened part-ner for improving the health of children and their families.Collaboration with other Federal agencies was expanded.Joint projects were funded with the National Institutes ofChild Health and Human Development (NICHD) and theNational Center for Health Statistics. An MCH-NICHD LowBirthweight Prevention Workgroup was founded. An inter-agency agreement with Head Start provided consultationand training to local Head Start agencies in mental health,nutrition, and dental services. An agreement with the U.S.Department of Agriculture was initiated to promote breast-feeding. In 1985, MCH became an essential partner to the

14
Department of Education in implementing the “Part H” earlyintervention program under P. L. 99-457. Partnerships withorganizations in the private sector, such as Healthy Moth-ers, Healthy Babies, also began to be strengthened dur-ing this period.
Title V of the SocialSecurity Act:1986–1999
rom 1986 to 1999, major changes were effected inthe MCH authorizing legislation, in other MCH-related
legislation, and in implementation of these by the FederalMCH Bureau. Fundamental changes to Title V containedin the Omnibus Budget Reconciliation Act (OBRA) of 1989(P. L. 101-239) required major reformulation of the appli-cation and annual reporting guidance for State funding aswell as significant adjustments to the implementation of theTitle at both the Federal and State program levels. How-ever, while the 1989 amendments represent the most com-prehensive changes to the Federal law since its inception,several other laws, initiatives, and socioeconomic trendsradically affected program implementation at the national,State, and local levels.
Viewed from either a national or local perspective, the evolv-ing central themes during this time period have been ex-pansion of coverage and service access for affectedpopulations—particularly those with low incomes—linkedto increased accountability, outcomes measurement, re-sults, increased interagency and Federal/State collabora-tion, and concern for customer satisfaction. From a Title Vperspective, these broad themes were made concrete inthe OBRA ‘89 amendments to Title V and in the Govern-ment Performance and Results Act (GPRA) of 1993, bothof which formalized Congress’ increasing desire for dataand information that related outputs to outcomes and couldjustify continued major investment of Federal, State, andlocal matching dollars for the program.
National infant mortality rates have been a traditional ba-rometer of progress for health and related programs inimproving the health status of mothers and children. Trendsnoted in the mid-1980s indicated a slowing in the reduc-tion in U.S. infant mortality rates. Of equal concern at thattime was the failure of reductions in infant mortality rates toreflect any similar reductions in low birthweight ratios. Al-though not formally part of Title V, the Healthy Start Pro-gram, initiated in 1991 to target comprehensive perinatalservices to areas in the Nation with the highest rates ofinfant mortality, is linked intrinsically to Title V and man-
aged by the MCHBureau. The pro-gram has enabledlocal areas to ad-dress unaccept-ably high rates ofinfant mortality andhas marshaled theskills and re-sources of provid-ers and managersto that end. Be-tween 1985 and1996, infant deathsfor the Nation de-creased from 10.6to 7.3 deaths per1,000 live births.However, the ratefor black infantscontinues to lagsignificantly behindthat of white infants. Reducing this discrepancy has beenand continues to be a mutual goal of the Healthy Start andTitle V programs.
Taken in chronological order, but bearing in mind that theycontinue to have major effects on the implementation ofMCH programs, the pivotal amendments to Title V and rel-evant initiatives affecting Federal and State MCH programimplementation include:
1. The Healthy People 2000 National HealthPromotion and Disease Prevention Objectives
This initiative grew out of a health strategy initiated in 1979with the publication Healthy People: The Surgeon General‘sReport on Health Promotion and Disease Prevention, andexpanded with publication in 1980 of Promoting Health/Preventing Disease: Objectives for the Nation, which setout an agenda for achievement of vital national health goalsfor the 10 years leading up to 1990. Healthy People 2000brought together in 1987 a consortium of organizationsthat has grown to include almost 300 national member-ship organizations and all State health departments. TheHealthy People Consortium, facilitated by the Institute ofMedicine of the National Academy of Sciences, assistedthe Office of Health and Science, DHHS, in formulating healthobjectives through review of the testimony of over 750 in-dividuals and organizations.
These nationally visible and promulgated health objectiveswere addressed in the amendments to Title V resultingfrom OBRA ‘89. Section 501 of Title V states the generalpurpose of the law as:
A new concept – theSurgeon General’s Work-shop – was developed anda number of emergingMCH concerns becametopics for these Workshops,beginning with thegroundbreaking 1982Surgeon General’s Work-shop on Technology-Dependent Children.Pediatric AIDS became aconcern to MCH in themid-1980s; the 1988 Pedi-atric/Family AIDS Demon-stration Program, laterenacted as Title IV (theRyan White Act) grew outof this early concern.
F

15
“To improve the health of all mothers and children con-sistent with the applicable health status goals and na-tional health objectives established by the Secretaryunder the Public Health Service Act for the year 2000.”
This statement of purpose recognized the vital role thatthe “Year 2000” objectives were expected to play in na-tional MCH programs supported under Title V. In recogni-tion of this, MCH Federal program managers developedprogram guidance and emphases, which addressed thepriority areas of Healthy People 2000 in Health Promotion,Health Protection, and Preventive Services, all of whichencompassed activities affecting the MCH population.Three of the four age-related objectives identified in theinitiative had implications for MCH. These were Children,Adolescents and Young Adults, and Adults. The develop-ment, refinement, and evolution of health objectives hascontinued in various forms up to the present time and theseare addressed later in this document.
2. The Omnibus Budget ReconciliationAct of 1989
This Act increased the authorization level for Title V fromthe previous $561 million to $686 million for 1990 and eachyear thereafter. The Act was amended in 1994 by P.L.103-432 Social Security Act Ammendments of 1994 toincrease the authorization from $686 million to $705 mil-lion. In addition to specifying how appropriated funds wereto be allocated between State block awards and discre-tionary grants, the law initiated a range of major changesaffecting the State’s receipt and utilization of funds.
While continuing to classify the MCH program as a “blockgrant,” the statutory language of the amended law sug-gested a considerably less flexible approach to the require-ments associated with the submission of State requests tothe MCH Bureau for Federal allocation of MCH Block Grantfunds and mandated specific program components anddetailed reporting elements. While continuing to provideStates a degree of latitude in their implementation of thelaw, it nevertheless required that the Federal agency de-velop and implement a more rigorous system of guidance,compliance, and reviews than had been in effect prior tothe passage of OBRA ‘89. The content of the new law isdescribed below:
a. Block Grant Application and RelatedRequirements
The specific funding provisions included:
• For any fiscal year that the appropriation does notexceed $600 million, States shall receive a block grantbased on the amount received in 1983 under the con-solidated health programs calculations.
• For amounts that exceed $600 million in a fiscal year,the Secretary shall retain 12 3/4 percent for six newcategories of projects, described later in this section.
• For the remaining amount above the $600 million level,after the Secretary has retained the 12 3/4 percentamount, these funds will be distributed through the 85percent State allocation and the federally administered15 percent project grant program.
• Any amounts remaining in the State block grant allo-cation that are not allotted to States (based, for ex-ample, on lack of matching funds), may be allottedamong the remaining States in proportion to the amountotherwise allotted to each State.
A fundamental change in Title V was the removal of theformer Report of Intended Expenditures (RIE) requirementof the law and its replacement with a State Application forfunding. This change was indicative of the Congressionalperception that improved program planning, management,measurement of progress towards achievement of pro-gram goals linked to improved data, and information onprogram components and expenditures were critical.
Specific provisions relating to the application content in-cluded:
• A statewide needs assessment to be conducted every5 years that shall identify, consistent with national healthobjectives, the need for:
- preventive and primary care services for children;and
- family-centered, community-based services forchildren with special health care needs and theirfamilies.
• A review of the data items to be used in the needsassessment.
• A plan for meeting the needs identified by the state-wide needs assessment.
• A description of how the funds allotted to States will beused for the provision and coordination of services inthe plan to include: goals and objectives for activitiesto address needs; identification of areas in the Statewhere services are to be provided and coordinated;identification of types of services to be provided andthe categories or characteristics of individuals to beserved; and information the State will collect in orderto prepare required reports.
• A set of requirements regarding State use of fundsallotted, as follows:

16
- At least 30 percent of allotted funds must be used forpreventive and primary care services for children.
- At least 30 percent of allotted funds must be usedfor services for children with special health careneeds.
- No more than 10 percent of the funds may be usedfor administrative purposes.
- The State must maintain the level of funds beingprovided solely by the State for maternal and childhealth programs at a level at least equal to thelevel provided in Federal Fiscal Year 1989.
- A fair method (as determined by the State) mustbe used for allocation of block funds within theState.
- Assurances must be made that funds will be usedsolely to carry out the purpose of Title V or con-tinue activities previously conducted under theconsolidated health programs in 1981 as definedin P.L. 97-35.
- Any charges made for services provided will bethose cited in a public schedule of charges for suchservices, will not be imposed on low income moth-ers and children, and will be adjusted to reflectthe income, resources, and family size of individu-als receiving services.
• Other requirements:
- Guidelines must exist for frequency and contentof health care assessments/services and meth-ods of assuring quality of such assessments/ser-vices.
- A toll-free number (and other appropriate meth-ods) must be provided to make information abouthealth care providers and practitioners who pro-vide services under Title V and Title XIX (as well asother relevant information) available to parents.
- The agency must participate in coordinating ac-tivities of the Title V programs with those of theEarly Periodic Screening, Diagnosis and TreatmentProgram (EPSDT), supplemental food programs,related education programs and other health, de-velopmental disability, and family planning pro-grams, to avoid duplication of effort and to ensureeffectiveness of all programs.
To ensure the State’s Maternal and Child Health Agencya continuing role in relation to the application, languagewas included by the Congress to the effect that the appli-cation “shall be developed by or in coordination with that
agency.” Also, the application must be made public withinthe State in such a manner as to facilitate comment fromany person. A waiver provision was included to allow theSecretary of HHS to waive the requirement that the appli-cation provide information on the amount of funds to beused for specific activities. This waiver provision was linkedto the annual reporting requirements of the law so that aState seeking waiver of the 30 percent funding require-ment relating to CSHCN, for example, would be requiredto document the need for decreased spending in thatarea as compared with other program areas such asmaternal and infant care. The waiver provisions havebeen infrequently invoked by States in the years follow-ing passage of the amended law.
b. Discretionary Grant Program Provisions
OBRA ‘89 continued the Federal SPRANS set-aside pro-gram for the five categories of training, research, hemo-philia, genetics, and other demonstrations. SPRANSfunding has grown from $57.6 million in 1982 to $107.4million in 1999.
An entirely new category of special projects was enacted,encompassing six subcategories of demonstrations: ma-ternal and infant health home visiting; increased participa-tion of obstetricians and pediatricians; integrated MCHservices delivery systems; MCH perinatal services provi-sion centers; MCH rural health projects; and outpatient andcommunity-based service programs. These projects werecollectively titled “Community Integrated Service Systems”or “CISS” projects. The law provided that the new CISSprojects would be initiated in any year in which the appro-priation exceeded $600 million. They were funded initiallyin 1992 at a level of $6,375,000.
Since inception, CISS allocations have nearly doubled, reach-ing a level of $12,084,323 in 1999. Projects funded underthis authority have been dedicated to strengthening Stateand local systems of care and have been effectively utilizedto build solid partnerships between Title V and other Fed-eral and non-Federal community-based programs for moth-ers and children. For example, a major initiative under CISSwas directed to working with child care programs supportedby the Administration for Children, Youth, and Families. Thiscollaboration resulted in a 10-point national blueprint for ac-tion to improve safety and health in out-of-home child caresettings.
c. Reports and Audits
In addition to the application and program implementa-tion requirements of OBRA ‘89, Congress added detailedannual reporting specifications, requiring county-leveldata on providers, service types, and recipients, includ-ing racial and ethnic characteristics. Included were mor-
17
tality and morbidity rates and proportions for types of in-dividuals, such as the proportion of infants born with drugdependence within the total population of the State. Theradically changed reporting requirements necessitatedconcentrated review and formulation of guidance and in-tensive technical assistance on the part of Federal MCHadministrators.
Reporting to Congress was expanded to include detailedresults of SPRANS-funded projects, a compilation of na-tional MCH data by health status indicators, and assess-ment of progress toward national goals and objectives.The two-year audit requirement bound States to have theirexpenditures under the block audited not less than onceevery two years by an entity independent of the State MCHagency. Standard State maintenance of reports and auditdocumentation language was added to ensure State com-pliance with accounting and audit provisions affecting Fed-eral grants to States.
d. Administration of the Program
The law specifies that the health agency of each Stateshall be responsible for administering or supervising theadministration of programs carried out with Title V allot-ments, with a “grandfather” clause providing for continuedseparate functioning of any CSHCN units (formerly CrippledChildren’s units) located outside the State health agency.
At the Federal level, the law requires that the Secretarydesignate an identifiable administrative unit with expertisein MCH within the Department of Health and Human Ser-vices with a broad range of responsibilities. Included arepromoting coordination of Title V and related Federal pro-grams; disseminating information to the States; providingtechnical assistance; providing information relating to thehealth status and health services needs of mothers andchildren in the United States; and assisting in the prepara-tion of mandated reports to Congress. A final responsibilityis developing and making available to State agencies anational directory listing by State of toll-free numbers. TheMaternal and Child Health Bureau (MCHB) is the adminis-trative unit designated under the law.
e. Other Provisions of the OBRA ‘89 AffectingMCH Programs and Populations
OBRA ‘89 included several additional mandates for activi-ties of substantial importance to women and children servedby Title V programs:
• Development of a model application form for a preg-nant woman or a child under 6 years of age to enablesimultaneous application for assistance under anymaternal and child health assistance program, definedto include the Title V MCH Block Program, the Title XIXMedicaid Program, migrant and community health cen-
ters under sections 329 and 330 of the PHS Act, thegrant program for the homeless under section 340 ofthe PHS Act, the WIC program under Section 17 of theChild Nutrition Act of 1996, and the Head Start pro-gram under the Head Start Act.
• Development, field testing, evaluation, availability, anddistribution of a maternal and child health handbookto pregnant women and families with young children.
• Conduct (by the Health Care Financing Administra-tion) of demonstration projects to provide healthinsurance coverage through an eligible plan to medi-cally uninsurable children under 19 years of age.
All of these activities were carried out in the early 1990swith substantial interagency collaboration.
3. Creation of a Federal Maternal and ChildHealth Bureau
OBRA ’89 called for increased leadership and program-matic responsibility at the Federal level, especially in thearea of national policy development and policy coordina-tion. These expectations were finally recognized with theMay 1990 elevation of the MCH organization to Bureaustatus within HRSA. Subsequently, in February 1995, anew Office of State and Community Health (OSCH) wasestablished to bring a defined focus and managementcapability to MCHB in support of State-funded programs.Since then, OSCH has functioned as an effective focal pointfor sustaining State accountability.
4. The Government Performance and ResultsAct (GPRA) of 1992
Passed on August 3, 1993, GPRA (P. L. 103-62) resultedin government-wide action to establish and track measur-able performance goals. DHHS moved quickly to imple-ment the provisions of the new law, directing administeringagencies and programs to develop strategic plans, per-formance plans with measurable goals and objectives, andannual reports on actual performance compared with per-formance goals. MCHB’s OSCH designated a Block GrantGuidance External Committee, comprised of State Title Vprogram representatives and other stakeholders in ma-ternal and child health and related communities, to act inan advisory capacity for developing the Title V Block GrantPerformance Measurement System.
Following agreement on a conceptual framework, the Com-mittee developed core and negotiated performance mea-sures that represent Block Grant activities. Briefly stated,four levels of the service pyramid, namely basic, enabling,population-based, and capacity/infrastructure serviceswere to be measured by capacity, process, and risk factor

18
performance measures. This system has already yieldeddata and information of great utility.
5. The Title V Information System
Closely allied to the GPRA-related performance measure-ment system instituted by MCHB, the Title V InformationSystem, a collaborative effort between MCHB and the Na-tional Center for Education in Maternal and Child Health,was designed to capture much of the financial and pro-gram data contained in MCH Block Grant applications forboth national and State MCH program managers. With theinitiation of online internet service in late 1999, the systemprovides an indispensable base for the evaluation of Stateand local program technical assistance needs and is thebasis for oversight of priority needs, objectives, perfor-mance, and financing. No less critical an aspect of the re-porting system is that it provides States with a simplifiedelectronic means of submitting the forms required underthe block grant application and reportingguidance. The outcomes of these effortsare captured as evidence of progressiveimprovement and provide accountability tothe States and the Nation as a whole.
6. The 1994 Formula Study
In 1994, MCHB commissioned a new studyof the Title V formula for allocating funds tothe States. State concern about the equityof the formula had been a recurring themesince the 1970s, last addressed followingenactment of OBRA ‘81. The 1994 studyfocused on the fact that census data usedto calculate a major portion of the formulaallotment lagged behind actual data andcircumstances in individual States. Thestudy group was composed of State direc-tors, experts from national MCH-related or-ganizations, and the General Accounting Office (GAO).The group reviewed various options for change in the for-mula, and, as had been the case in the past, concludedthat without a major increase in appropriated funds, theapparent inequity could not be resolved. In its own reviewof the formula, GAO also recommended no change.
7. Block Grant, Annual Report Guidance, and Technical Assistance
Following passage of OBRA ‘89, major management andprogram resources of MCHB were devoted to the devel-opment (and subsequent clearance by the Office of Man-agement and Budget) of guidance materials for both theapplication and the annual report from States. Previousguidance developed to implement the OBRA ‘8l block grantlegislation required major revision with the passage of
OBRA ‘89. Beginning in 1990, a process of review of Stateapplications on-site in the DHHS field offices was instituted.Field review proved an effective mechanism for Federalmanagers and State officials to interact in monitoring Stateprograms.
The year 1996 saw the development by MCHB and clear-ance by the Office of Management and Budget (OMB) ofInterim Guidance packages for the application and annualreport. This was followed by the publication of more com-plete guidance in 1997, and culminated for the 1999 appli-cation cycle in the provision to States of a formatted diskettefor completion of their applications. Technical assistancewas made readily available to States through MCHB’s Om-nibus Budget Reconciliation Act as they entered this newand more streamlined phase of the MCH Block Grant ap-plication process. States welcomed this new approach andthe opportunity it afforded to Federal and State partnersto build a national database focusing on State MCH pro-
grams and the populations they serve.
Also in 1996, MCHB published a compila-tion of legislative documents (with accom-panying CD-Rom) entitled LegislativeBase: Maternal and Child Health BlockGrant. These materials provided an his-torical compendium of the Title V authoriz-ing legislation, regulations, and relatedlaws affecting maternal and child healthprograms in the United States since 1912.The Legislative Base was intended as auseful resource for Title V managers at alllevels. It has also been widely distributedto the public.
In 1997, in one of a number of efforts toassist State MCH managers, OSCH pre-pared and disseminated a Legal Compen-
dium of Interpretations of Title V of the Social Security Act,which included substantially all responses provided to Statesand others inquiring about the meaning and legal implica-tions of provisions of Title V, as amended by the OBRA ‘89.While States continued to be provided much flexibility underTitle V, questions regarding the more complex provisions ofthe law still arise from time to time, principally relating tomatching of Federal funds with State monies, allocation offunds according to the law’s percentage distributions, the1989 “hold harmless” stipulation, and other fiscal issues.
8. The Traumatic Brain Injury (TBI) Program
The TBI program, authorized under section 1252 of thePHS Act in 1996, was initially funded by Congress throughthe addition of funds to the Title V SPRANS authority. Thiswas accomplished through bill language added to the ap-propriation for the MCH Block Grant in fiscal years 1997
These efforts repre-sented a seriousattempt on the partof the “Federaladministrativeagency” to resumemajor responsibilityfor its own archivalMCH programpolicies and recordsafter a number ofyears when theywere dispersed inlarger organizations.

19
through 2000. The TBI program is administered by MCHBand authorizes grants to States to develop infrastructurefor providing comprehensive services to individuals suf-fering from traumatic brain injuries and their families.
9. Managed Care and Medicaid ReimbursementImpact
The widespread implementation of systems of managedcare in the 1990s, coupled with radical changes in theMedicaid reimbursement system in the same period, re-quired major re-evaluation and restructuring of State andlocal organizational frameworks for service delivery as wellas adjustments in the scope and functioning of their healthcare and related programs. By June 1997, the Health CareFinancing Administration (HCFA) reported that nearly 50percent of all State Medicaid enrollees, about 15.3 millionpersons, were enrolled in managed care programs. Onlythree States had enrolled no eligibles—Alaska, Virgin Is-lands, and Wyoming. Nine States had enrolled 80 to 100percent of their eligibles.
To address the effect managed care was having on the ser-vices provided by State MCH agencies, MCHB developed aprocess for managed care consultation and technical as-sistance that included collaborative efforts with HRSA’s man-aged care staff and on-site presentations in several States.This process offered a forum to State managers for inputinto Federal planning and technical assistance developmenttargeted to managed care concerns. Particular attention wasdirected to assisting States in addressing the needs of chil-dren with special health care needs; services for these chil-dren appeared to be at particular risk of disruption as aresult of the rise in managed care.
Recognizing the need for interagency collaboration andpartnership between Federal and State programs servinga common population as welfare reform was becoming areality, MCHB and Administration for Children and Families(ACF) established the ACF Technical Assistance Group(TAG) in 1995. Composed of five Federal agencies—MCHB, ACF, Head Start, WIC, and HCFA/Medicaid —andaugmented by State representatives from each of the keycontent areas—this TAG provided a forum for interaction,communication, and program prioritization that was vital toongoing mutual child health and welfare program plan-ning and implementation efforts at all levels.
10. The State Children’s Health Insurance Program (SCHIP)
In a 1996 report on key facts about uninsured children, theChildren’s Defense Fund (CDF) indicated that 11.3 millionchildren under age 18 were uninsured, the largest numberever reported by the Census Bureau. The report noted thatmore than 90 percent of uninsured children have one or
more parents who work. Lack of insurance results in thesechildren being at risk for preventable illness, resultant mor-bidity, costly remedial care, and conditions that result inlost or unproductive school days.
Subtitle J of the 1997 Balanced Budget Act (P. L. 105-33)authorized the new State Children’s Health Insurance Pro-gram (SCHIP), which targeted the bulk of the uninsuredchildren identified by CDF. The law added a new Title XXIto the Social Security Act to enable States to initiate andexpand child health assistance, through Medicaid or a sepa-rate program, to uninsured, low-income children. The pro-gram was a capped entitlement for States, with paymentsfor child assistance beginning October 1, 1997. Implemen-tation of SCHIP at the State level was primarily assigned tothe State Medicaid agency. The dollar size, some $40 bil-lion between 1998 and 2007, and the scope of the newentitlement program required that States develop compre-hensive Child Health Plans for establishing and implement-ing SCHIP provisions. Title V State agency staff workedcollaboratively with State Medicaid staff to ensure that plan-ning for this program was coordinated effectively with TitleV program efforts in all the States. At the Federal level,HRSA and HCFA jointly oversaw initial implementation andmonitoring of the program.
11. State Health Agency Reviews
In 1997, the National Governors Association (NGA) re-leased a report entitled Transforming State Health Agen-cies to Meet Current and Future Challenges. The NGArecognized that States were fundamentally changing theway health services are organized, administered, financed,and delivered by the State health agency. Changes influ-encing States included the increased use of managed care,an increased demand for accountability, a focus on cus-tomer satisfaction, and a shift by some States from directservice to the performance of core public health functions.
In the same year, MCHB commissioned a study entitledState Maternal and Child Health Organization Placementand Leadership. Based on review of Block Grant applica-tion and annual reports, coupled with interviews of MCHdirectors in all 50 States, this study revealed that over80 percent of the State Title V Directors indicated that or-ganizational change had occurred, or that they were in theimplementation phase of such change, and/or that suchchange was under consideration.
In response to both reports, MCHB intensified its efforts, inconjunction with the Association of Maternal and Child HealthPrograms (AMCHP), to provide technical assistance andsupport to the State directors faced with varying degrees oforganizational restructuring and streamlining, to ensureminimal disruption to services, and to ensure continuedcompliance with the requirements of Title V.

20
F
12. The Abstinence Education Program
Beginning in FY1998 and continuing each year through2002, $50 million became available under a new Section510 of Title V for a “separate program for Abstinence Edu-cation.” Authorized under the Personal Responsibility andWork Opportunity Reconciliation Act of 1966 (P. L. 104-193), Section 510 is a capped entitlement that requireseach State to apply specifically for abstinence education-only funds in order to receive their allotment under the law.The primary purpose of this program is to enable States toprovide abstinence education—and where appropriate,mentoring, counseling, and adult supervision—to promoteabstinence from sexual activity, with a focus on thosegroups most likely to bear children out of wedlock. A highlyspecific definition of “abstinence education” is included inthe law. Legislation enacted in 1997 authorized an inde-pendent evaluation of State Title V-funded abstinence edu-cation programs to be sponsored by DHHS’ AssistantSecretary for Planning and Evaluation.
13. Strengthening MCH’s Partnership withthe Association of Maternal and Child HealthPrograms
Throughout the 1990s, MCH Bureau efforts were directedtoward strengthening its partnership with AMCHP, the pro-fessional organization representing State Title V directors.These efforts included the contribution of Federal finan-cial support for the AMCHP organizational structure. Theinstitution of annual meetings planned and implementedby AMCHP has resulted in major advances in sharing in-novative program approaches and resolving challengesfacing the MCH community at all levels stemming from theneed to implement myriad changes to Title V as well asfrom fundamental system-wide changes in health care andits financing. Through regular meetings and close com-munications, MCHB and AMCHP maintain a vigilant andresponsive hub for the MCH community as a whole.
The partnership with AMCHP was mirrored by importantMCHB partnerships with other national membership or-ganizations with a variety of professional concerns af-fecting mothers and children. The many “Partnership inCommunication” or “PIC” partners have included the Na-tional Governors Association; the Washington BusinessGroup on Health; Family Voices; and Healthy Mothers,Healthy Babies.
Trends in MCHAppropriations:1936-2000
ederal funds to support efforts to improve the healthof mothers and children and handicapped children
increased significantly between 1936 and 2000. This isshown both on Appendix Tables 1 and 4 (showing the dif-ferences in allocations to current DHHS Regions in FY1937and FY2000). Of special concern during this period, how-ever, was the major increase in the Consumer Price Index,which rose by 153 percent between 1975 and 1991.
To keep pace with inflation, program spending should haveincreased by the same amount. While the increases infunding were fairly substantial in terms of annual dollars,the amounts in constant dollars reflected much smaller in-creases and, finally, beginning in the mid-1970s, amountedto a net loss in purchasing power. See Appendix Table 4,which shows the difference between actual dollars appro-priated and constant dollars defined by the CPI, and Fig-ure 4 for the trend in Title V and MCH Block Grant fundingin actual and constant dollars, for fiscal years 1936–2001.
After some fluctuation in appropriations levels betweenFY1982 and FY1986 accompanying the 1991 shift to theBlock Grant, and with the exception of almost level fundingin FY1990, the MCH Block Grant showed a rate of growthof between 5 percent and 8 percent a year betweenFY1986 and FY1991. Exclusive of the additional funds pro-vided for the Abstinence Education program, the increasein funding available for Title V State and Federal programsbetween the years 1986 and 1999 was significant, evenas it leveled off again during the deficit reduction years ofthe 1990s:
In addition, the Community Integrated Service System(CISS) program, which began at a level of $6,375,000 in1992, increased to $12,084,323 in 1999, an increase of90 percent in the 7-fiscal-year period.
Block Grants SPRANS Total1986 $388,829,100 $68,616,900 $457,446,000
1999 586,781,920 109,071,690 695,853,610
Increase 191,461,375 38,785,302 230,246,677
Percent +49% +57% +50%

21
SourcesKey Facts About Uninsured Children, Children’s Defense Fund, March 1998.
Children’s Health Insurance Program, Health Care Financing Administration, 1997.
Medicaid Managed Care Enrollment, Health Care Financing Administration, 1997.
Infant Mortality Rates, 1950–1996, Based on the National Vital Statistics System, National Center for Health Statistics,Center for Disease Control, Updated 9/30/98.
Healthy People 2000, National Health Promotion and Disease Prevention Objectives, U.S. Department of Health andHuman Services, Public Health Service, September 1990.
Legislative Base: Maternal and Child Health Service Block Grant, Health Resources and Services Administration,1996.
Transforming State Health Agencies to Meet Current and Future Challenges, National Governors Association, 1997.
Understanding Title V of the Social Security Act, Maternal and Child Health Bureau, 2000.
Guidance and Forms for the Title V Application/Annual Report, Maternal and Child Health, Revised June 4, 1998.
The Government Performance and Results Act of 1997, Public Law 103-62.
The State Children’s Health Insurance Program (Balanced Budget Act of 1997), P.L. 105-33.
Unpublished ORCH Compendium of Training Materials, November 1997.
Unpublished ORCH Study of State Maternal and Child Health Organizational Placement and Leadership, 1997.
Unpublished ORCH Compendium of Legal Interpretations of Title V of the Social Security Act, 1997.
Unpublished Budget Tables, 1999, MCHB.
Unpublished ORCH Meeting Agenda and Material, 1996.
Unpublished miscellaneous Administrative Documents, Maternal and Child Health Bureau, 1986 to 1999.
21

22

23
Appendix

24
19361937193819391940
19411942194319441945
19461947194819491950
19511952195319541955
19561957195819591960
19611962196319641965
19661967196819691970
19711972197319741975
197619768
197719781979
TABLE 1United States Title V Health and Related Programs and MCH Block Grant Appropriations by ProgramComponents, FY1936 - FY2001.Year Title V Health MCH (A&B) CCS (A&B) EMIC Special Section Research Training SPRANS CISS Abstinence
or MCH Program or Program Program Projects 5164 Grants Grants Grants2 Projects EducationBlock Grant MCH Block Total3 Sec. 5108
Totals1 Grant (85%)Totals2
2,767,000 1,580,000 1,187,0006,650,000 1,800,000 2,850,0006,650,000 3,800,000 2,850,0006,650,000 3,800,000 2,850,0008,150,000 4,800,000 3,350,000
9,690,000 5,820,000 3,870,0009,690,000 5,820,000 3,870,000
10,890,000 5,820,000 3,870,000 1,200,00039,390,000 5,820,000 3,870,000 29,700,00054,690,000 5,820,000 3,870,000 45,000,000
47,740,000 5,820,000 3,870,000 38,050,00029,400,000 11,000,000 7,500,000 10,900,00020,650,000 11,000,000 7,500,000 2,150,00019,250,000 11,000,000 8,250,00018,500,000 11,000,000 7,500,000
23,175,000 13,200,000 9,975,00023,909,600 12,524,100 11,385,50024,229,077 12,746,579 11,482,49822,771,100 11,927,700 10,843,40022,771,100 11,927,700 10,843,400
26,927,700 11,927,700 15,000,00031,000,000 16,000,000 15,000,00031,500,000 16,500,000 15,000,00033,000,000 16,500,000 16,500,00033,500,000 17,500,000 16,000,000
38,167,000 18,167,000 20,000,00050,000,000 25,000,000 25,000,00050,000,000 25,000,000 25,000,00066,500,000 30,000,000 30,000,000 5,000,000 1,500,00088,000,000 35,000,000 35,000,000 15,000,000 3,000,000
139,000,000 45,000,000 45,000,000 45,000,000 4,000,000173,900,000 50,000,000 50,000,000 65,000,000 4,900,000 4,000,000179,900,000 50,000,000 50,000,000 67,000,000 5,900,000 7,000,000209,200,000 50,000,000 57,000,000 87,000,000 6,200,000 9,000,000221,510,000 50,000,000 58,000,000 98,625,000 5,885,000 9,000,000
218,285,000 59,250,000 58,600,000 83,350,000 5,885,000 11,200,000234,636,000 59,250,000 62,272,000 92,008,000 6,035,000 15,071,000258,868,000 60,778,000 64,900,000 111,273,000 6,035,000 15,882,000267,868,000 60,778,000 64,900,000 111,273,000 7,000,000 6,035,000 17,882,000303,340,000 177,051,000 64,900,000 10,472,0005 25,000,000 8,035,000 17,882,000
319,408,000 192,059,717 76,500,000 27,140,283 5,300,000 18,408,000102,329,000 54,742,540 26,251,390 6,785,070 750,000 13,800,000345,708,000 203,035,524 91,500,000 22,464,476 5,300,000 23,408,000361,854,000 214,370,030 97,500,000 20,629,970 5,300,000 24,054,000377,677,000 224,300,430 102,100,000 19,099,570 5,300,000 26,877,000

25
Year Title V Health MCH (A&B) CCS (A&B) EMIC Special Section Research Training SPRANS CISS Abstinenceor MCH Program or Program Program Projects 5164 Grants Grants Grants2 Projects Education
Block Grant MCH Block Total3 Sec. 5108
Totals1 Grant (85%)Totals2
1980 376,343,000 224,571,530 102,100,000 18,828,470 4,800,000 26,043,0001981 387,400,000 235,095,118 105,700,000 16,604,882 4,800,000 25,200,0001982 373,750,000 316,200,000 57,550,0001983 478,000,0007422,050,0007 55,950,0001984 399,000,000 339,150,000 59,850,0001985 478,000,000 406,300,000 71,700,000
1986 457,446,000 388,829,100 68,616,9001987 496,750,000 421,121,875 75,628,1251988 526,570,000 444,281,740 82,288,2601989 554,268,000 465,293,300 88,974,7001990 553,627,000 470,582,950 83,044,050
1991 587,302,365 499,207,010 88,095,3551992 649,570,000 547,081,250 96,113,750 6,375,0001993 664,534,000 557,938,640 98,366,760 8,228,6001994 687,034,000 574,546,590 101,390,575 11,096,8351995 683,950,000 572,259,419 100,986,956 10,703,625
1996 678,204,000 567,998,041 100,234,949 9,971,0101997 681,000,000 567,952,802 103,083,966 9,963,2321998 681,079,404 567,911,894 103,211,310 9,956,200 50,000,0001999 699,777,000 580,290,475 107,402,202 12,084,323 50,000,000
20009 709,130,000 586,781,920 109,147,750 13,200,300 50,000,000200110 709,130,000 586,781,920 109,147,750 13,200,300 50,000,000
1 Totals of amounts shown each year on the table are for MCH Program, CCS Program, the Emergency Maternal and Infant Care Program,Special Projects, Section 516, Research and Training, or MCH Block allocations for States, Special Projects of Regional and NationalSignificance (SPRANS Grants), Community Integrated Service Systems (CISS), and Abstinence Education.
2 Beginning in 1982 only two categories of money are shown, i.e., the 85 percent of the MCH Block Grant of the Omnibus ReconciliationAct of 1981 allocated to state programs, the 15 percent allocated to SPRANS Grants, and beginning in FY1992 a third category, the12.75 percent of the amount over $600 million allocated to CISS.
3 These are monies appropriated for M&I, C&Y, Family Planning (FP), Dental and Intensive Infant Care Projects (later the Program ofProjects), except that appropriations for Family Planning Projects in 1971 and 1972 (transferred to the National Center for FamilyPlanning Services) are not included. FP monies for 1969, 1970, 1973, and 1974 are included.
4 The Section 516 monies were appropriated to maintain the FY1973 level of Title V funding for the MCH and CCS Programs and Special(Program of) Projects in each State. Monies shown for 1974 were allocated to enable States to plan the takeover of existing SpecialProjects.
5 The $10,472,000 shown for Special Projects in 1975 are monies impounded by President Nixon in 1973 and released by court order in1975.
6 These monies are those used to fund the “transition” quarter in 1976 (July-September) when the Federal Fiscal Year changed from July-June to October-September.
7 The total for 1983 and the MCH Block Grant amount include $105 million from the “Jobs Bill” designated as being for the care of mothersand children.
8 The Personal Responsibility, and Work Opportunity Reconciliation Act of 1996 created a new section, Section 510 to Title V of the SSA forproviding formula grant funds to the States for Abstinence Education. This Act provided a separate appropriation of $50 million for eachof the fiscal years 1998-2002. This is a permanent appropriation and is counted as mandatory funding under the Budget EnforcementAct.
9 Represents the amount included in the FY2000 Appropriations as of February 2000.
10 The President’s Budget request for FY2000. Does not include Healthy Start, which is proposed for inclusion in the Title V in FY2001 ($90million).

26
TABLE 2
United States Title V Uniform and Minimum Grants to Each State, FY 1936 - FY2001.
Years MCH A MCH B CCS A CCS BUniform Minimum Uniform MinimumGrants Grants Grants Grants
1936-1946 20,0001 5,0002 20,0001 2,3
1947-1949 35,000 2 30,000 2
1950-1951 35,000 20,000 30,000 10,0001952 45,542 25,000 45,542 20,0001953 47,695 25,000 47,558 20,000
1954-1955 43,373 25,000 43,373 20,0001956 43,373 25,000 60,000 20,0001957 58,182 30,000 60,000 25,000
1958-1960 60,000 30,000 60,000 25,0001961 70,000 30,000 70,0001 35,000
1962-1963 70,000 35,000 70,000 35,0001964 70,000 40,000 70,000 40,0001965 70,000 45,000 70,000 45,0001966 70,000 55,000 70,000 55,000
1967-1968 70,000 60,000 70,000 60,0001969 70,000 60,000 70,000 65,000
1970-1981 70,000 70,000 70,000 70,000 1982-20014 B L O C K
1 These amounts were defined by statute.2 Minimum grant amounts were not available for most of these years.3 CCS Program Fund B was not authorized until 1939.4 There are no uniform and minimum grants in the MCH Block Grant allocations.

27

28
TABLE 3
United States Title V Project Grant and MCH Block SPRANS Grant Funding, FY 1936 - FY2001.
Year Total1 Reserve B Research Training Hemophilia Genetics Traumatic SPRANSFunds2 Grants Grants Grants3 Grants3 Brain Injury6 Grants4
1936193719381939 196,000 196,0001940 196,000 196,000
1941 700,000 700,0001942 720,000 720,0001943 796,000 796,0001944 598,000 598,0001945 648,000 648,000
1946 698,000 698,0001947 2,073,000 2,073,0001948 3,375,000 3,375,0001949 3,375,000 3,375,0001950 3,375,000 3,375,000
1951 3,657,000 3,657,0001952 3,478,400 3,478,4001953 3,214,500 3,214,5001954 2,846,000 2,846,0001955 2,846,000 2,846,000
1956 3,366,000 3,366,0001957 4,625,000 4,625,0001958 4,687,500 4,687,5001959 4,687,500 4,687,5001960 4,937,500 4,937,500
1961 5,520,875 5,520,8751962 7,000,000 7,000,0001963 7,000,000 7,000,0001964 11,625,000 10,125,000 1,500,0001965 16,250,000 13,250,000 3,000,000
1966 21,625,000 17,625,000 4,000,0001967 27,775,000 18,875,000 4,900,000 4,000,0001968 31,775,000 18,875,000 5,900,000 7,000,0001969 35,887,500 20,687,500 6,200,000 9,000,0001970 35,697,500 20,812,500 5,885,000 9,000,000
1971 38,172,500 21,087,500 5,885,000 11,200,0001972 42,652,500 21,546,500 6,035,000 15,071,0001973 43,983,000 22,066,000 6,035,000 15,882,0001974 45,983,000 22,066,000 6,035,000 17,882,0001975 50,883,000 24,966,000 8,035,000 17,882,000
1976 55,207,717 28,499,717 5,300,000 18,408,000 3,000,00019765 35,528,930 20,978,930 750,000 13,800,0001977 65,531,024 33,823,024 5,300,000 23,408,000 3,000,0001978 76,661,930 40,307,930 5,300,000 24,054,000 3,000,000 4,000,0001979 84,277,430 45,100,430 5,300,000 26,877,000 3,000,000 4,000,000
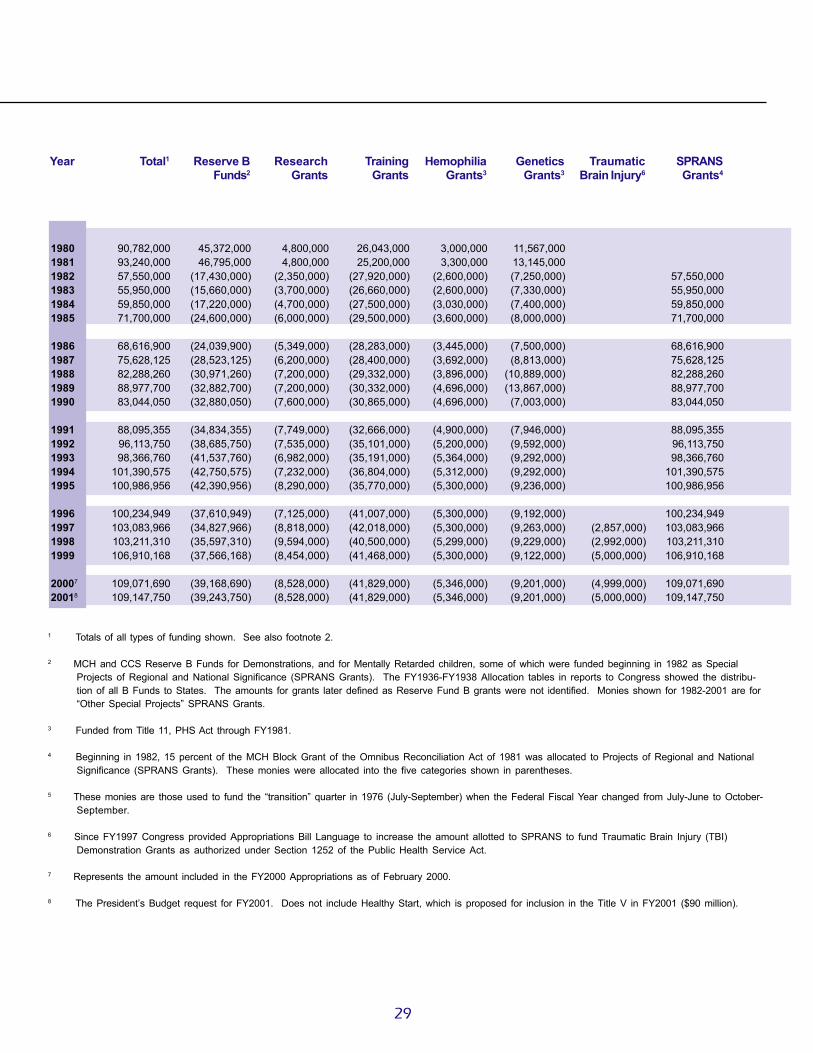
29
1980 90,782,000 45,372,000 4,800,000 26,043,000 3,000,000 11,567,0001981 93,240,000 46,795,000 4,800,000 25,200,000 3,300,000 13,145,0001982 57,550,000 (17,430,000) (2,350,000) (27,920,000) (2,600,000) (7,250,000) 57,550,0001983 55,950,000 (15,660,000) (3,700,000) (26,660,000) (2,600,000) (7,330,000) 55,950,0001984 59,850,000 (17,220,000) (4,700,000) (27,500,000) (3,030,000) (7,400,000) 59,850,0001985 71,700,000 (24,600,000) (6,000,000) (29,500,000) (3,600,000) (8,000,000) 71,700,000
1986 68,616,900 (24,039,900) (5,349,000) (28,283,000) (3,445,000) (7,500,000) 68,616,9001987 75,628,125 (28,523,125) (6,200,000) (28,400,000) (3,692,000) (8,813,000) 75,628,1251988 82,288,260 (30,971,260) (7,200,000) (29,332,000) (3,896,000) (10,889,000) 82,288,2601989 88,977,700 (32,882,700) (7,200,000) (30,332,000) (4,696,000) (13,867,000) 88,977,7001990 83,044,050 (32,880,050) (7,600,000) (30,865,000) (4,696,000) (7,003,000) 83,044,050
1991 88,095,355 (34,834,355) (7,749,000) (32,666,000) (4,900,000) (7,946,000) 88,095,3551992 96,113,750 (38,685,750) (7,535,000) (35,101,000) (5,200,000) (9,592,000) 96,113,7501993 98,366,760 (41,537,760) (6,982,000) (35,191,000) (5,364,000) (9,292,000) 98,366,7601994 101,390,575 (42,750,575) (7,232,000) (36,804,000) (5,312,000) (9,292,000) 101,390,5751995 100,986,956 (42,390,956) (8,290,000) (35,770,000) (5,300,000) (9,236,000) 100,986,956
1996 100,234,949 (37,610,949) (7,125,000) (41,007,000) (5,300,000) (9,192,000) 100,234,9491997 103,083,966 (34,827,966) (8,818,000) (42,018,000) (5,300,000) (9,263,000) (2,857,000) 103,083,9661998 103,211,310 (35,597,310) (9,594,000) (40,500,000) (5,299,000) (9,229,000) (2,992,000) 103,211,3101999 106,910,168 (37,566,168) (8,454,000) (41,468,000) (5,300,000) (9,122,000) (5,000,000) 106,910,168
20007 109,071,690 (39,168,690) (8,528,000) (41,829,000) (5,346,000) (9,201,000) (4,999,000) 109,071,69020018 109,147,750 (39,243,750) (8,528,000) (41,829,000) (5,346,000) (9,201,000) (5,000,000) 109,147,750
Year Total1 Reserve B Research Training Hemophilia Genetics Traumatic SPRANSFunds2 Grants Grants Grants3 Grants3 Brain Injury6 Grants4
1 Totals of all types of funding shown. See also footnote 2.
2 MCH and CCS Reserve B Funds for Demonstrations, and for Mentally Retarded children, some of which were funded beginning in 1982 as SpecialProjects of Regional and National Significance (SPRANS Grants). The FY1936-FY1938 Allocation tables in reports to Congress showed the distribu-tion of all B Funds to States. The amounts for grants later defined as Reserve Fund B grants were not identified. Monies shown for 1982-2001 are for“Other Special Projects” SPRANS Grants.
3 Funded from Title 11, PHS Act through FY1981.
4 Beginning in 1982, 15 percent of the MCH Block Grant of the Omnibus Reconciliation Act of 1981 was allocated to Projects of Regional and NationalSignificance (SPRANS Grants). These monies were allocated into the five categories shown in parentheses.
5 These monies are those used to fund the “transition” quarter in 1976 (July-September) when the Federal Fiscal Year changed from July-June to October-September.
6 Since FY1997 Congress provided Appropriations Bill Language to increase the amount allotted to SPRANS to fund Traumatic Brain Injury (TBI)Demonstration Grants as authorized under Section 1252 of the Public Health Service Act.
7 Represents the amount included in the FY2000 Appropriations as of February 2000.
8 The President’s Budget request for FY2001. Does not include Healthy Start, which is proposed for inclusion in the Title V in FY2001 ($90 million).
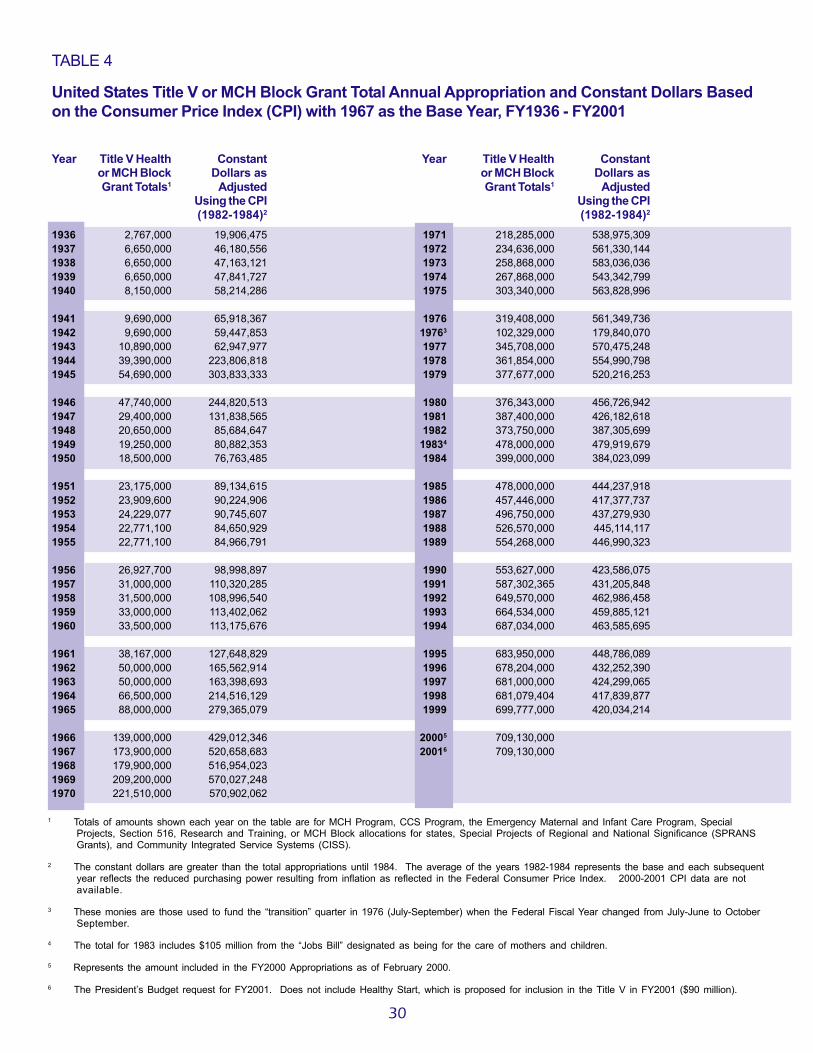
30
TABLE 4
United States Title V or MCH Block Grant Total Annual Appropriation and Constant Dollars Basedon the Consumer Price Index (CPI) with 1967 as the Base Year, FY1936 - FY2001
Year Title V Health Constant Year Title V Health Constantor MCH Block Dollars as or MCH Block Dollars asGrant Totals1 Adjusted Grant Totals1 Adjusted
Using the CPI Using the CPI(1982-1984)2 (1982-1984)2
1936 2,767,000 19,906,475 1971 218,285,000 538,975,3091937 6,650,000 46,180,556 1972 234,636,000 561,330,1441938 6,650,000 47,163,121 1973 258,868,000 583,036,0361939 6,650,000 47,841,727 1974 267,868,000 543,342,7991940 8,150,000 58,214,286 1975 303,340,000 563,828,996
1941 9,690,000 65,918,367 1976 319,408,000 561,349,7361942 9,690,000 59,447,853 19763 102,329,000 179,840,0701943 10,890,000 62,947,977 1977 345,708,000 570,475,2481944 39,390,000 223,806,818 1978 361,854,000 554,990,7981945 54,690,000 303,833,333 1979 377,677,000 520,216,253
1946 47,740,000 244,820,513 1980 376,343,000 456,726,9421947 29,400,000 131,838,565 1981 387,400,000 426,182,6181948 20,650,000 85,684,647 1982 373,750,000 387,305,6991949 19,250,000 80,882,353 19834 478,000,000 479,919,6791950 18,500,000 76,763,485 1984 399,000,000 384,023,099
1951 23,175,000 89,134,615 1985 478,000,000 444,237,9181952 23,909,600 90,224,906 1986 457,446,000 417,377,7371953 24,229,077 90,745,607 1987 496,750,000 437,279,9301954 22,771,100 84,650,929 1988 526,570,000 445,114,1171955 22,771,100 84,966,791 1989 554,268,000 446,990,323
1956 26,927,700 98,998,897 1990 553,627,000 423,586,0751957 31,000,000 110,320,285 1991 587,302,365 431,205,8481958 31,500,000 108,996,540 1992 649,570,000 462,986,4581959 33,000,000 113,402,062 1993 664,534,000 459,885,1211960 33,500,000 113,175,676 1994 687,034,000 463,585,695
1961 38,167,000 127,648,829 1995 683,950,000 448,786,0891962 50,000,000 165,562,914 1996 678,204,000 432,252,3901963 50,000,000 163,398,693 1997 681,000,000 424,299,0651964 66,500,000 214,516,129 1998 681,079,404 417,839,8771965 88,000,000 279,365,079 1999 699,777,000 420,034,214
1966 139,000,000 429,012,346 20005 709,130,0001967 173,900,000 520,658,683 20016 709,130,0001968 179,900,000 516,954,0231969 209,200,000 570,027,2481970 221,510,000 570,902,062
1 Totals of amounts shown each year on the table are for MCH Program, CCS Program, the Emergency Maternal and Infant Care Program, SpecialProjects, Section 516, Research and Training, or MCH Block allocations for states, Special Projects of Regional and National Significance (SPRANSGrants), and Community Integrated Service Systems (CISS).
2 The constant dollars are greater than the total appropriations until 1984. The average of the years 1982-1984 represents the base and each subsequentyear reflects the reduced purchasing power resulting from inflation as reflected in the Federal Consumer Price Index. 2000-2001 CPI data are notavailable.
3 These monies are those used to fund the “transition” quarter in 1976 (July-September) when the Federal Fiscal Year changed from July-June to OctoberSeptember.
4 The total for 1983 includes $105 million from the “Jobs Bill” designated as being for the care of mothers and children.
5 Represents the amount included in the FY2000 Appropriations as of February 2000.
6 The President’s Budget request for FY2001. Does not include Healthy Start, which is proposed for inclusion in the Title V in FY2001 ($90 million).
31

19361937193819391940
19411942194319441945
19461947194819491950
19511952195319541955
19561957195819591960
19611962196319641965
19661967196819691970
19711972197319741975
197619768
197719781979
Year Title V Health Constant MCH CCS EMIC Special Section Abstinenceor MCH Block Dollars Program Program Projects4 5165 EducationGrant Totals1 (per CPI)2 or MCH Sec. 51013
Block Total3
32
TABLE 5United States Title V or MCH Block Grant Allocations to Each State (showing Constant Dollarsfor Total Amounts) By Program Components, FY 1936 - FY 2001: ALABAMA
68,879 495,532 45,101 23,778160,313 1,113,285 103,217 57,096164,933 1,169,738 107,837 57,096175,169 1,260,209 105,855 69,314253,251 1,808,936 162,486 90,765
307,314 2,090,571 220,682 86,632356,726 2,188,503 229,098 127,628361,086 2,087,202 235,012 106,074 20,000624,015 3,545,540 213,930 95,147 314,938955,128 5,306,267 175,486 109,702 669,940
744,960 3,820,308 197,169 112,741 435,050732,617 3,285,278 365,120 230,648 136,849680,984 2,825,660 372,023 286,564 22,397762,655 3,204,433 476,331 286,324709,650 2,944,606 453,053 256,597
814,525 3,132,788 490,201 324,324683,330 2,578,604 359,544 323,786755,231 2,828,581 392,956 362,275665,425 2,473,699 341,913 323,512638,471 2,382,354 328,525 309,946
758,489 2,788,563 321,741 436,748786,447 2,798,744 379,627 406,820788,815 2,729,464 381,550 407,265789,014 2,711,388 369,865 419,149797,143 2,693,051 384,008 413,135
911,398 3,048,154 396,683 514,7151,193,857 3,953,169 553,788 640,0691,155,793 3,777,101 542,052 613,7411,334,555 4,305,016 630,560 703,995 01,510,147 4,794,117 714,802 795,345 0
1,879,263 5,800,194 895,312 983,951 (1,452,279)2,089,871 6,257,099 984,173 1,105,698 (1,731,530)2,076,450 5,966,810 971,578 1,104,872 (2,746,053)2,208,469 6,017,627 977,061 1,231,408 (3,023,371)2,254,916 5,811,639 1,005,118 1,249,798 (3,079,584)
2,472,037 6,103,795 1,238,285 1,233,752 (3,165,348)2,509,185 6,002,835 1,238,285 1,270,900 (3,478,117)2,599,2006 5,854,054 1,266,200 1,333,000 (3,478,100)2,551,900 5,176,268 1,220,100 1,331,800 (3,391,000) 05,576,136 10,364,565 4,065,800 1,307,500 (84,965)7 202,836
6,058,757 10,648,079 4,509,600 1,527,500 21,6571,514,689 2,662,019 1,127,400 381,875 5,4146,406,800 10,572,277 4,562,300 1,844,500 06,682,800 10,249,693 4,736,400 1,946,400 06,924,100 9,537,328 4,865,500 2,058,600 0

1980198119821983198310
19841985
19861987198819891990
19911992199319941995
1996199719981999
200011
200112
Year Title V Health Constant MCH CCS EMIC Special Section Abstinenceor MCH Block Dollars Program Program Projects4 5165 EducationGrant Totals1 (per CPI)2 or MCH Sec. 51013
Block Total3
33
6,811,300 8,266,141 4,742,200 2,069,100 06,934,300 7,628,493 4,797,600 2,136,7006,855,216 7,103,851 6,855,2169
6,873,644 6,901,249 6,873,6442,276,400 2,285,542 2,276,4007,352,772 7,076,778 7,352,7728,808,584 8,186,416 8,808,584
8,429,815 7,691,437 8,429,8159,129,922 8,036,903 9,129,9229,726,041 8,221,505 9,726,041
10,270,425 8,282,601 10,270,42510,407,474 7,962,872 10,407,474
11,149,111 8,185,838 11,149,11112,389,452 8,830,686 12,389,45212,088,272 8,365,586 12,088,27212,447,374 8,399,038 12,447,37412,397,920 8,135,118 12,397,920
12,277,651 7,825,144 12,277,65112,231,944 7,621,149 12,231,94412,217,575 7,495,445 12,217,575 $1,081,05812,483,544 7,493,124 12,487,088 $1,081,058
12,622,957 12,487,088 $1,081,05812,622,957 $1,081,058
1 Total of amounts shown on the table for each year; does not include Special Projects (Program of Projects), Research, Training, or Special Projects ofRegional and National Significance (SPRANS Grants), and Community Integrated Service Systems monies.
2 These are Constant Dollars for the Title V Health Program totals or the MCH Block Grant totals based on adjustments using the Consumer Price Index(CPI) which defined the average of 1982-1984 as the base year of 100%. 2000-2001 CPI data are not available.
3 Prior to 1952, State Program totals include all of Fund A and most of Fund B, including “Reserved” Funds. For later years, various reserved funds are notincluded in the totals since data were not available for States.
4 Includes projects later known as the “Program of Projects” (M&I, C&Y, Family Planning, Dental, Intensive Infant Care); excludes Family Planning moniesallocated to States in 1970-1972 because these were allocated by the National Center for Family Planning Services. These amounts are not includedin the annual totals.
5 Monies required from FY1975-FY1981 to maintain the FY1973 level of Title V funding defined as the “Hold Harmless” funding base. FY1974 monies inthis category were to enable States to plan for the Program of Projects, including management of existing Special Projects.
6 The total amount shown in FY1973 is not necessarily the base for FY1975 funding levels since some Special Projects were funded for 18 months andother adjustments were necessary.
7 Special Projects monies in 1975 are a portion of $10,472,000 impounded by President Nixon in 1973 and released by court order in 1975.
8 These monies are those used to fund the “transition” quarter in 1976 (July-September) when the Federal Fiscal Year changed from July-June to October-September.
9 Beginning in 1982, a single block allocation was made to each State as the MCH Block Grant.
10 This line is the State’s allocation of the $ 105 million appropriated for care of mothers and children under the 1983 Jobs Bill. It is perceived as 1983supplemental funding but was mostly used in 1984.
11 Represents the amount included in the FY2000 Appropriations as of February 2000.
12 The President’s Budget request for FY2001. Does not include Healthy Start, which is proposed for inclusion in the Title V in FY2001 ($90 million).
13 The Personal Responsibility, and Work Opportunity Reconciliation Act of 1996 created a new section, Section 510 to Title V of the SSA for providingformula grant funds to the States for Abstinence Education. This Act provided a separate appropriation of $50 million for each of the fiscal years1998-2002. This is a permanent appropriation and is counted as mandatory funding under The Budget Enforcement Act.
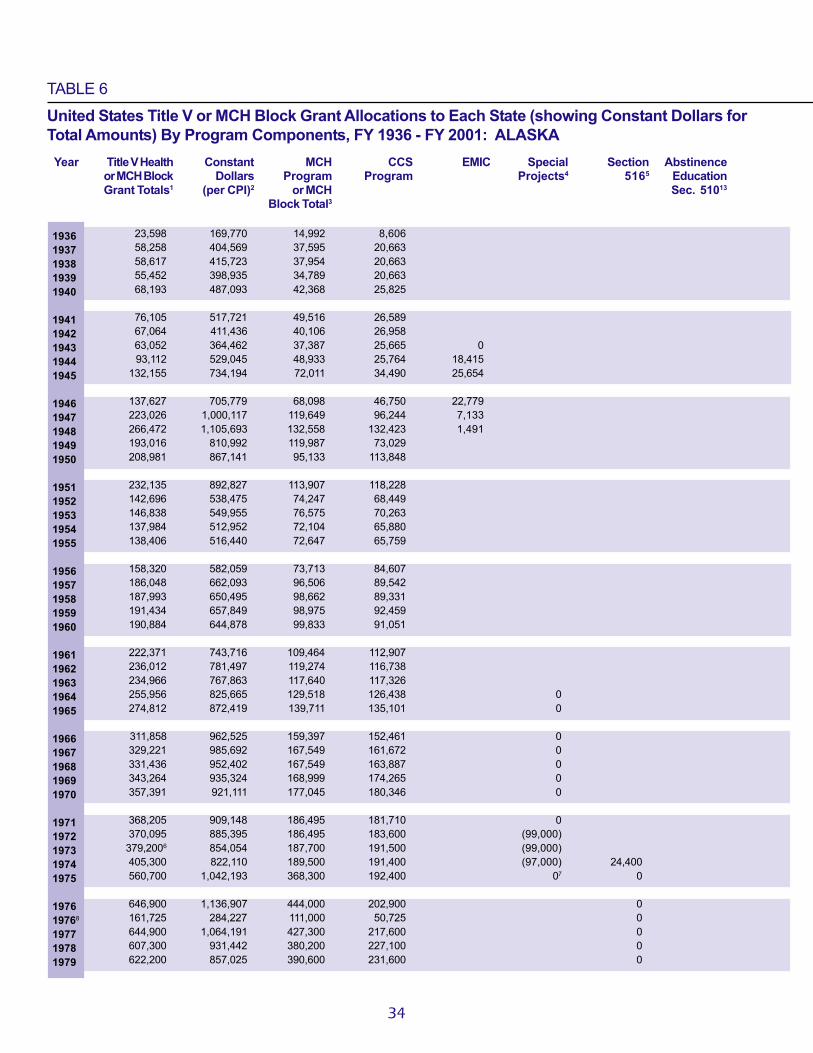
19361937193819391940
19411942194319441945
19461947194819491950
19511952195319541955
19561957195819591960
19611962196319641965
19661967196819691970
19711972197319741975
197619768
197719781979
Year Title V Health Constant MCH CCS EMIC Special Section Abstinenceor MCH Block Dollars Program Program Projects4 5165 EducationGrant Totals1 (per CPI)2 or MCH Sec. 51013
Block Total3
34
TABLE 6United States Title V or MCH Block Grant Allocations to Each State (showing Constant Dollars forTotal Amounts) By Program Components, FY 1936 - FY 2001: ALASKA
23,598 169,770 14,992 8,60658,258 404,569 37,595 20,66358,617 415,723 37,954 20,66355,452 398,935 34,789 20,66368,193 487,093 42,368 25,825
76,105 517,721 49,516 26,58967,064 411,436 40,106 26,95863,052 364,462 37,387 25,665 093,112 529,045 48,933 25,764 18,415
132,155 734,194 72,011 34,490 25,654
137,627 705,779 68,098 46,750 22,779223,026 1,000,117 119,649 96,244 7,133266,472 1,105,693 132,558 132,423 1,491193,016 810,992 119,987 73,029208,981 867,141 95,133 113,848
232,135 892,827 113,907 118,228142,696 538,475 74,247 68,449146,838 549,955 76,575 70,263137,984 512,952 72,104 65,880138,406 516,440 72,647 65,759
158,320 582,059 73,713 84,607186,048 662,093 96,506 89,542187,993 650,495 98,662 89,331191,434 657,849 98,975 92,459190,884 644,878 99,833 91,051
222,371 743,716 109,464 112,907236,012 781,497 119,274 116,738234,966 767,863 117,640 117,326255,956 825,665 129,518 126,438 0274,812 872,419 139,711 135,101 0
311,858 962,525 159,397 152,461 0329,221 985,692 167,549 161,672 0331,436 952,402 167,549 163,887 0343,264 935,324 168,999 174,265 0357,391 921,111 177,045 180,346 0
368,205 909,148 186,495 181,710 0370,095 885,395 186,495 183,600 (99,000)
379,2006 854,054 187,700 191,500 (99,000)405,300 822,110 189,500 191,400 (97,000) 24,400560,700 1,042,193 368,300 192,400 07 0
646,900 1,136,907 444,000 202,900 0161,725 284,227 111,000 50,725 0644,900 1,064,191 427,300 217,600 0607,300 931,442 380,200 227,100 0622,200 857,025 390,600 231,600 0

1980198119821983198310
19841985
19861987198819891990
19911992199319941995
1996199719981999
200011
200112
Year Title V Health Constant MCH CCS EMIC Special Section Abstinenceor MCH Block Dollars Program Program Projects4 5165 EducationGrant Totals1 (per CPI)2 or MCH Sec. 51013
Block Total3
35
649,100 787,743 405,800 243,300 0679,100 747,085 434,000 245,100 0657,696 681,550 657,6969
659,464 662,112 659,464218,400 219,277 218,400705,432 678,953 705,432845,104 785,413 845,104
808,765 737,924 808,765875,934 771,069 875,934911,066 770,132 911,066942,445 760,036 942,445950,345 727,119 950,345
993,090 729,141 993,0901,064,591 758,796 1,064,5911,091,576 755,416 1,091,5761,117,695 754,180 1,117,6951,114,098 731,035 1,114,098
1,105,350 704,493 1,105,3501,100,752 685,827 1,100,7521,099,491 674,534 1,099,491 78,5261,118,839 671,572 1,119,097 78,511
1,128,979 1,119,097 78,5111,128,979 78,526
1 Total of amounts shown on the table for each year; does not include Special Projects (Program of Projects), Research, Training, or Special Projects ofRegional and National Significance (SPRANS Grants), and Community Integrated Service Systems monies.
2 These are Constant Dollars for the Title V Health Program totals or the MCH Block Grant totals based on adjustments using the Consumer Price Index(CPI) which defined the average of 1982-1984 as the base year of 100%. 2000-2001 CPI data are not available.
3 Prior to 1952, State Program totals include all of Fund A and most of Fund B, including “Reserved” Funds. For later years, various reserved funds are notincluded in the totals since data were not available for States.
4 Includes projects later known as the “Program of Projects” (M&I, C&Y, Family Planning, Dental, Intensive Infant Care); excludes Family Planning moniesallocated to States in 1970-1972 because these were allocated by the National Center for Family Planning Services. These amounts are not includedin the annual totals.
5 Monies required from FY1975-FY1981 to maintain the FY1973 level of Title V funding defined as the “Hold Harmless” funding base. FY1974 monies inthis category were to enable States to plan for the Program of Projects, including management of existing Special Projects.
6 The total amount shown in FY1973 is not necessarily the base for FY1975 funding levels since some Special Projects were funded for 18 months andother adjustments were necessary.
7 Special Projects monies in 1975 are a portion of $10,472,000 impounded by President Nixon in 1973 and released by court order in 1975.
8 These monies are those used to fund the “transition” quarter in 1976 (July-September) when the Federal Fiscal Year changed from July-June to October-September.
9 Beginning in 1982, a single block allocation was made to each State as the MCH Block Grant.
10 This line is the State’s allocation of the $ 105 million appropriated for care of mothers and children under the 1983 Jobs Bill. It is perceived as 1983supplemental funding but was mostly used in 1984.
11 Represents the amount included in the FY2000 Appropriations as of February 2000.
12 The President’s Budget request for FY2001. Does not include Healthy Start, which is proposed for inclusion in the Title V in FY2001 ($90 million).
13 The Personal Responsibility, and Work Opportunity Reconciliation Act of 1996 created a new section, Section 510 to Title V of the SSA for providingformula grant funds to the States for Abstinence Education. This Act provided a separate appropriation of $50 million for each of the fiscal years1998-2002. This is a permanent appropriation and is counted as mandatory funding under The Budget Enforcement Act.
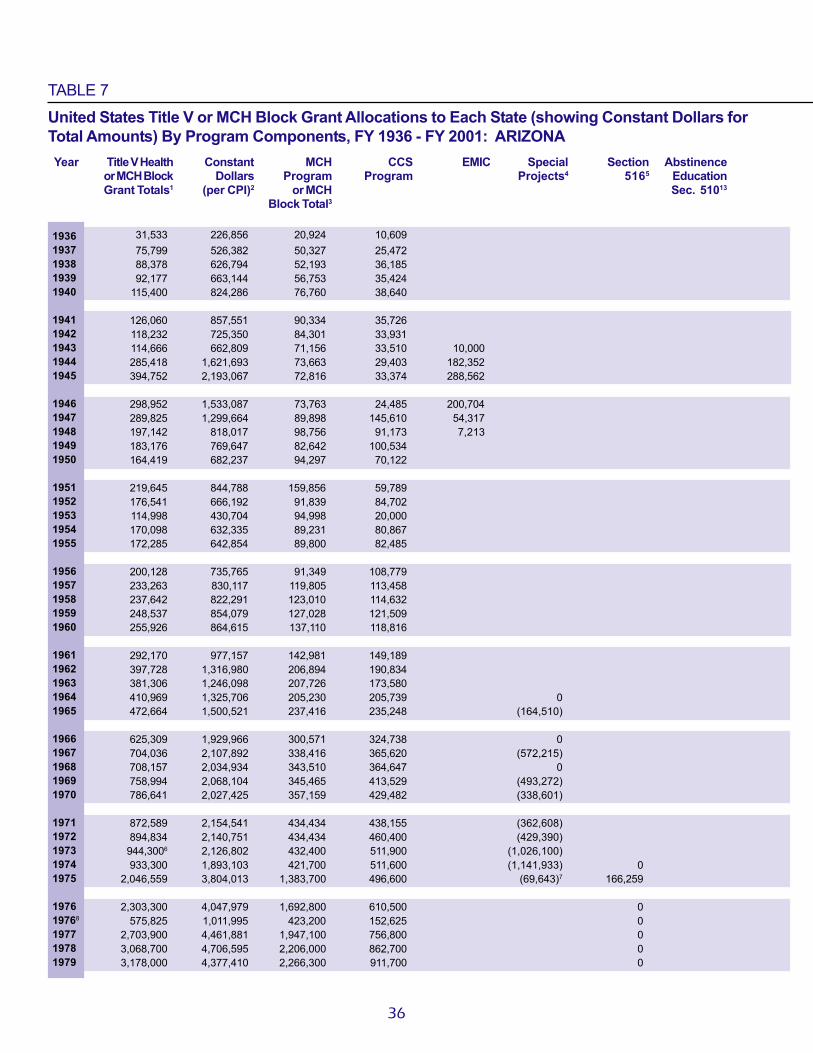
19361937193819391940
19411942194319441945
19461947194819491950
19511952195319541955
19561957195819591960
19611962196319641965
19661967196819691970
19711972197319741975
197619768
197719781979
Year Title V Health Constant MCH CCS EMIC Special Section Abstinenceor MCH Block Dollars Program Program Projects4 5165 EducationGrant Totals1 (per CPI)2 or MCH Sec. 51013
Block Total3
36
TABLE 7United States Title V or MCH Block Grant Allocations to Each State (showing Constant Dollars forTotal Amounts) By Program Components, FY 1936 - FY 2001: ARIZONA
31,533 226,856 20,924 10,60975,799 526,382 50,327 25,47288,378 626,794 52,193 36,18592,177 663,144 56,753 35,424
115,400 824,286 76,760 38,640
126,060 857,551 90,334 35,726118,232 725,350 84,301 33,931114,666 662,809 71,156 33,510 10,000285,418 1,621,693 73,663 29,403 182,352394,752 2,193,067 72,816 33,374 288,562
298,952 1,533,087 73,763 24,485 200,704289,825 1,299,664 89,898 145,610 54,317197,142 818,017 98,756 91,173 7,213183,176 769,647 82,642 100,534164,419 682,237 94,297 70,122
219,645 844,788 159,856 59,789176,541 666,192 91,839 84,702114,998 430,704 94,998 20,000170,098 632,335 89,231 80,867172,285 642,854 89,800 82,485
200,128 735,765 91,349 108,779233,263 830,117 119,805 113,458237,642 822,291 123,010 114,632248,537 854,079 127,028 121,509255,926 864,615 137,110 118,816
292,170 977,157 142,981 149,189397,728 1,316,980 206,894 190,834381,306 1,246,098 207,726 173,580410,969 1,325,706 205,230 205,739 0472,664 1,500,521 237,416 235,248 (164,510)
625,309 1,929,966 300,571 324,738 0704,036 2,107,892 338,416 365,620 (572,215)708,157 2,034,934 343,510 364,647 0758,994 2,068,104 345,465 413,529 (493,272)786,641 2,027,425 357,159 429,482 (338,601)
872,589 2,154,541 434,434 438,155 (362,608)894,834 2,140,751 434,434 460,400 (429,390)
944,3006 2,126,802 432,400 511,900 (1,026,100)933,300 1,893,103 421,700 511,600 (1,141,933) 0
2,046,559 3,804,013 1,383,700 496,600 (69,643)7 166,259
2,303,300 4,047,979 1,692,800 610,500 0575,825 1,011,995 423,200 152,625 0
2,703,900 4,461,881 1,947,100 756,800 03,068,700 4,706,595 2,206,000 862,700 03,178,000 4,377,410 2,266,300 911,700 0

1980198119821983198310
19841985
19861987198819891990
19911992199319941995
1996199719981999
200011
200112
Year Title V Health Constant MCH CCS EMIC Special Section Abstinenceor MCH Block Dollars Program Program Projects4 5165 EducationGrant Totals1 (per CPI)2 or MCH Sec. 51013
Block Total3
37
3,120,200 3,786,650 2,217,000 903,200 03,315,800 3,647,745 2,352,600 963,200 03,225,240 3,342,218 3,225,2409
3,233,910 3,246,898 3,233,9101,071,000 1,075,301 1,071,0003,459,330 3,329,480 3,459,3304,144,260 3,851,543 4,144,260
3,966,057 3,618,665 3,966,0574,295,443 3,781,200 4,295,4434,579,092 3,870,746 4,579,0924,838,227 3,901,796 4,838,2274,903,463 3,751,693 4,903,463
5,256,494 3,859,394 5,256,4945,846,911 4,167,435 5,846,9116,735,257 4,661,078 6,735,2577,032,288 4,745,134 7,032,2886,991,382 4,587,521 6,991,382
6,891,902 4,392,544 6,891,9026,873,677 4,282,665 6,873,6776,865,111 4,211,725 6,865,111 894,1377,085,050 4,252,731 7,087,982 893,333
7,200,363 7,087,982 893,3337,200,363 894,137
1 Total of amounts shown on the table for each year; does not include Special Projects (Program of Projects), Research, Training, or Special Projects ofRegional and National Significance (SPRANS Grants), and Community Integrated Service Systems monies.
2 These are Constant Dollars for the Title V Health Program totals or the MCH Block Grant totals based on adjustments using the Consumer Price Index(CPI) which defined the average of 1982-1984 as the base year of 100%. 2000-2001 CPI data are not available.
3 Prior to 1952, State Program totals include all of Fund A and most of Fund B, including “Reserved” Funds. For later years, various reserved funds are notincluded in the totals since data were not available for States.
4 Includes projects later known as the “Program of Projects” (M&I, C&Y, Family Planning, Dental, Intensive Infant Care); excludes Family Planning moniesallocated to States in 1970-1972 because these were allocated by the National Center for Family Planning Services. These amounts are not includedin the annual totals.
5 Monies required from FY1975-FY1981 to maintain the FY1973 level of Title V funding defined as the “Hold Harmless” funding base. FY1974 monies inthis category were to enable States to plan for the Program of Projects, including management of existing Special Projects.
6 The total amount shown in FY1973 is not necessarily the base for FY1975 funding levels since some Special Projects were funded for 18 months andother adjustments were necessary.
7 Special Projects monies in 1975 are a portion of $10,472,000 impounded by President Nixon in 1973 and released by court order in 1975.
8 These monies are those used to fund the “transition” quarter in 1976 (July-September) when the Federal Fiscal Year changed from July-June to October-September.
9 Beginning in 1982, a single block allocation was made to each State as the MCH Block Grant.
10 This line is the State’s allocation of the $ 105 million appropriated for care of mothers and children under the 1983 Jobs Bill. It is perceived as 1983supplemental funding but was mostly used in 1984.
11 Represents the amount included in the FY2000 Appropriations as of February 2000.
12 The President’s Budget request for FY2001. Does not include Healthy Start, which is proposed for inclusion in the Title V in FY2001 ($90 million).
13 The Personal Responsibility, and Work Opportunity Reconciliation Act of 1996 created a new section, Section 510 to Title V of the SSA for providingformula grant funds to the States for Abstinence Education. This Act provided a separate appropriation of $50 million for each of the fiscal years1998-2002. This is a permanent appropriation and is counted as mandatory funding under The Budget Enforcement Act.

19361937193819391940
19411942194319441945
19461947194819491950
19511952195319541955
19561957195819591960
19611962196319641965
19661967196819691970
19711972197319741975
197619768
197719781979
Year Title V Health Constant MCH CCS EMIC Special Section Abstinenceor MCH Block Dollars Program Program Projects4 5165 EducationGrant Totals1 (per CPI)2 or MCH Sec. 51013
Block Total3
38
TABLE 8United States Title V or MCH Block Grant Allocations to Each State (showing Constant Dollars forTotal Amounts) By Program Components, FY 1936 - FY 2001: ARKANSAS
49,648 357,180 30,769 18,879118,501 822,924 73,169 45,332111,113 788,035 65,782 45,331113,800 818,705 68,468 45,332165,458 1,181,843 88,400 77,058
188,092 1,279,537 114,179 73,913180,216 1,105,620 110,723 69,493259,380 1,499,306 129,742 87,450 42,188580,524 3,298,432 102,308 74,231 403,985792,623 4,403,461 103,146 78,847 610,630
555,820 2,850,359 101,664 62,083 392,073467,292 2,095,480 208,237 149,877 109,178416,597 1,728,618 187,146 227,084 2,367459,446 1,930,445 253,484 205,962459,991 1,908,676 248,687 211,304
593,800 2,283,846 286,256 307,544422,532 1,594,460 206,271 216,261464,274 1,738,854 223,771 240,503416,955 1,550,019 200,923 216,032400,973 1,496,168 191,972 209,001
473,736 1,741,676 183,254 290,482488,048 1,736,826 220,287 267,761478,054 1,654,166 221,158 256,896465,840 1,600,825 210,613 255,227473,718 1,600,399 217,525 256,193
544,530 1,821,171 225,625 318,905690,666 2,286,974 303,451 387,215662,757 2,165,873 294,577 368,180766,707 2,473,248 349,510 417,197 0880,722 2,795,943 411,565 469,157 (564,925)
1,136,419 3,507,466 528,896 607,523 01,297,296 3,884,120 614,867 682,429 (745,102)1,280,374 3,679,236 608,931 671,443 (1,040,784)1,334,503 3,636,248 585,553 748,950 (872,725)1,337,990 3,448,428 565,879 772,111 (998,982)
1,459,400 3,603,457 694,603 764,797 (1,112,195)1,461,303 3,495,940 694,603 766,700 (1,156,584)1,517,0006 3,416,667 708,600 808,400 (1,266,100)1,568,700 3,181,947 687,000 807,700 (1,548,920) 74,0003,050,600 5,670,260 2,287,200 763,400 07 0
3,459,800 6,080,492 2,534,700 925,100 0864,950 1,520,123 633,675 231,275 0
3,835,200 6,328,713 2,716,100 1,119,100 04,084,100 6,263,957 2,857,800 1,226,300 04,232,800 5,830,303 2,935,700 1,297,100 0

1980198119821983198310
19841985
19861987198819891990
19911992199319941995
1996199719981999
200011
200112
Year Title V Health Constant MCH CCS EMIC Special Section Abstinenceor MCH Block Dollars Program Program Projects4 5165 EducationGrant Totals1 (per CPI)2 or MCH Sec. 51013
Block Total3
39
4,096,800 4,971,845 2,803,200 1,293,600 04,224,900 4,647,855 2,890,600 1,334,300 04,132,734 4,282,626 4,132,7349
4,143,844 4,160,486 4,143,8441,372,350 1,377,861 1,372,3504,432,691 4,266,305 4,432,6915,310,341 4,935,261 5,310,341
5,081,996 4,636,858 5,081,9965,504,063 4,845,126 5,504,0635,846,070 4,941,733 5,846,0706,157,840 4,966,000 6,157,8406,236,329 4,771,484 6,236,329
6,661,063 4,890,648 6,661,0637,371,414 5,254,037 7,371,4147,309,629 5,058,567 7,309,6297,528,818 5,080,174 7,528,8187,498,632 4,920,362 7,498,632
7,425,222 4,732,455 7,425,2227,397,737 4,609,182 7,397,7377,389,035 4,533,150 7,389,035 660,0047,551,377 4,532,639 7,553,540 660,004
7,636,472 7,553,540 660,0047,636,472 660,004
1 Total of amounts shown on the table for each year; does not include Special Projects (Program of Projects), Research, Training, or Special Projects ofRegional and National Significance (SPRANS Grants), and Community Integrated Service Systems monies.
2 These are Constant Dollars for the Title V Health Program totals or the MCH Block Grant totals based on adjustments using the Consumer Price Index(CPI) which defined the average of 1982-1984 as the base year of 100%. 2000-2001 CPI data are not available.
3 Prior to 1952, State Program totals include all of Fund A and most of Fund B, including “Reserved” Funds. For later years, various reserved funds are notincluded in the totals since data were not available for States.
4 Includes projects later known as the “Program of Projects” (M&I, C&Y, Family Planning, Dental, Intensive Infant Care); excludes Family Planning moniesallocated to States in 1970-1972 because these were allocated by the National Center for Family Planning Services. These amounts are not includedin the annual totals.
5 Monies required from FY1975-FY1981 to maintain the FY1973 level of Title V funding defined as the “Hold Harmless” funding base. FY1974 monies inthis category were to enable States to plan for the Program of Projects, including management of existing Special Projects.
6 The total amount shown in FY1973 is not necessarily the base for FY1975 funding levels since some Special Projects were funded for 18 months andother adjustments were necessary.
7 Special Projects monies in 1975 are a portion of $10,472,000 impounded by President Nixon in 1973 and released by court order in 1975.
8 These monies are those used to fund the “transition” quarter in 1976 (July-September) when the Federal Fiscal Year changed from July-June to October-September.
9 Beginning in 1982, a single block allocation was made to each State as the MCH Block Grant.
10 This line is the State’s allocation of the $ 105 million appropriated for care of mothers and children under the 1983 Jobs Bill. It is perceived as 1983supplemental funding but was mostly used in 1984.
11 Represents the amount included in the FY2000 Appropriations as of February 2000.
12 The President’s Budget request for FY2001. Does not include Healthy Start, which is proposed for inclusion in the Title V in FY2001 ($90 million).
13 The Personal Responsibility, and Work Opportunity Reconciliation Act of 1996 created a new section, Section 510 to Title V of the SSA for providingformula grant funds to the States for Abstinence Education. This Act provided a separate appropriation of $50 million for each of the fiscal years1998-2002. This is a permanent appropriation and is counted as mandatory funding under The Budget Enforcement Act.

19361937193819391940
19411942194319441945
19461947194819491950
19511952195319541955
19561957195819591960
19611962196319641965
19661967196819691970
19711972197319741975
197619768
197719781979
Year Title V Health Constant MCH CCS EMIC Special Section Abstinenceor MCH Block Dollars Program Program Projects4 5165 EducationGrant Totals1 (per CPI)2 or MCH Sec. 51013
Block Total3
40
TABLE 9United States Title V or MCH Block Grant Allocations to Each State (showing Constant Dollars forTotal Amounts) By Program Components, FY 1936 - FY 2001: CALIFORNIA
`69,597 500,698 39,689 29,908159,460 1,107,361 87,643 71,817176,321 1,250,504 99,027 77,294211,020 1,518,129 103,295 107,725270,864 1,934,743 140,070 130,794
313,114 2,130,027 170,600 142,514326,598 2,003,669 179,029 147,569344,565 1,991,705 184,264 160,301 0
2,636,392 14,979,500 193,464 199,906 2,243,0224,172,252 23,179,178 191,159 193,621 3,787,472
4,268,887 21,891,728 208,584 132,416 3,927,8871,930,568 8,657,256 356,599 385,599 1,188,370
965,069 4,004,436 414,202 293,959 256,908640,314 2,690,395 314,910 325,404539,465 2,238,444 324,898 214,567
624,764 2,402,938 391,848 232,916655,224 2,472,543 391,759 263,465791,717 2,965,232 474,296 317,421687,683 2,556,442 413,862 273,821703,547 2,625,175 419,059 284,488
899,350 3,306,434 456,835 442,5151,094,527 3,895,114 651,552 442,9751,123,703 3,888,246 670,443 453,2601,319,904 4,535,753 675,609 644,2951,227,237 4,146,071 732,661 494,576
1,374,720 4,597,726 754,469 620,2512,066,848 6,843,868 1,186,411 880,4372,064,610 6,747,092 1,187,185 877,4252,379,735 7,676,565 1,305,572 1,074,163 02,793,117 8,867,038 1,499,122 1,293,995 (147,144)
3,853,625 11,893,904 2,013,147 1,840,478 (1,922,891)4,205,771 12,592,129 2,091,405 2,114,366 (1,012,711)4,243,457 12,193,842 2,143,084 2,100,373 (2,644,526)4,620,456 12,589,798 2,160,076 2,460,380 (4,325,697)4,779,309 12,317,807 2,292,452 2,486,857 (3,705,724)
5,354,003 13,219,760 2,828,154 2,525,849 (3,802,288)5,531,054 13,232,187 2,828,154 2,702,900 (4,133,743)5,719,9006 12,882,658 2,906,800 2,813,100 (6,277,000)5,965,900 12,101,217 3,141,400 2,809,200 (6,196,067) 15,300
13,113,200 24,373,978 10,268,300 2,844,900 07 0
13,639,500 23,971,002 10,171,100 3,468,400 03,409,875 5,992,750 2,542,775 867,100 0
14,691,300 24,243,069 10,446,500 4,244,800 015,284,600 23,442,638 10,827,900 4,456,700 015,829,500 21,803,719 11,124,800 4,704,700 0

1980198119821983198310
19841985
19861987198819891990
19911992199319941995
1996199719981999
200011
200112
Year Title V Health Constant MCH CCS EMIC Special Section Abstinenceor MCH Block Dollars Program Program Projects4 5165 EducationGrant Totals1 (per CPI)2 or MCH Sec. 51013
Block Total3
41
15,917,000 19,316,748 11,193,900 4,723,100 016,869,100 18,557,866 11,962,600 4,906,500 018,222,606 18,883,530 18,222,6069
18,271,581 18,344,961 18,271,5816,051,150 6,075,452 6,051,150
19,545,204 18,811,553 19,545,20423,415,069 21,761,217 23,415,069
22,408,221 20,445,457 22,408,22124,269,254 21,363,780 24,269,25426,355,751 22,278,741 26,355,75128,289,689 22,814,265 28,289,68928,774,939 22,016,021 28,774,939
31,400,977 23,055,049 31,400,97735,792,571 25,511,455 35,792,57139,988,493 27,673,698 39,988,49341,903,121 28,274,711 41,903,12141,639,448 27,322,472 41,639,448
40,998,208 26,130,152 40,998,20840,901,291 25,483,670 40,901,29140,849,561 25,061,080 40,849,561 5,764,19942,267,209 25,370,474 42,286,104 5,764,199
43,010,496 42,286,104 043,010,496 5,764,199
1 Total of amounts shown on the table for each year; does not include Special Projects (Program of Projects), Research, Training, or Special Projects ofRegional and National Significance (SPRANS Grants), and Community Integrated Service Systems monies.
2 These are Constant Dollars for the Title V Health Program totals or the MCH Block Grant totals based on adjustments using the Consumer Price Index(CPI) which defined the average of 1982-1984 as the base year of 100%. 2000-2001 CPI data are not available.
3 Prior to 1952, State Program totals include all of Fund A and most of Fund B, including “Reserved” Funds. For later years, various reserved funds are notincluded in the totals since data were not available for States.
4 Includes projects later known as the “Program of Projects” (M&I, C&Y, Family Planning, Dental, Intensive Infant Care); excludes Family Planning moniesallocated to States in 1970-1972 because these were allocated by the National Center for Family Planning Services. These amounts are not includedin the annual totals.
5 Monies required from FY1975-FY1981 to maintain the FY1973 level of Title V funding defined as the “Hold Harmless” funding base. FY1974 monies inthis category were to enable States to plan for the Program of Projects, including management of existing Special Projects.
6 The total amount shown in FY1973 is not necessarily the base for FY1975 funding levels since some Special Projects were funded for 18 months andother adjustments were necessary.
7 Special Projects monies in 1975 are a portion of $10,472,000 impounded by President Nixon in 1973 and released by court order in 1975.
8 These monies are those used to fund the “transition” quarter in 1976 (July-September) when the Federal Fiscal Year changed from July-June to October-September.
9 Beginning in 1982, a single block allocation was made to each State as the MCH Block Grant.
10 This line is the State’s allocation of the $ 105 million appropriated for care of mothers and children under the 1983 Jobs Bill. It is perceived as 1983supplemental funding but was mostly used in 1984.
11 Represents the amount included in the FY2000 Appropriations as of February 2000.
12 The President’s Budget request for FY2001. Does not include Healthy Start, which is proposed for inclusion in the Title V in FY2001 ($90 million).
13 The Personal Responsibility, and Work Opportunity Reconciliation Act of 1996 created a new section, Section 510 to Title V of the SSA for providingformula grant funds to the States for Abstinence Education. This Act provided a separate appropriation of $50 million for each of the fiscal years1998-2002. This is a permanent appropriation and is counted as mandatory funding under The Budget Enforcement Act.

19361937193819391940
19411942194319441945
19461947194819491950
19511952195319541955
19561957195819591960
19611962196319641965
19661967196819691970
19711972197319741975
197619768
197719781979
Year Title V Health Constant MCH CCS EMIC Special Section Abstinenceor MCH Block Dollars Program Program Projects4 5165 EducationGrant Totals1 (per CPI)2 or MCH Sec. 51013
Block Total3
42
TABLE 10United States Title V or MCH Block Grant Allocations to Each State (showing Constant Dollars forTotal Amounts) By Program Components, FY 1936 - FY 2001: COLORADO
40,818 293,655 27,581 13,237107,951 749,660 58,688 49,26396,981 687,809 62,462 34,51997,571 701,950 54,856 42,715
141,552 1,011,086 87,020 54,532
155,344 1,056,762 89,729 65,615135,112 828,908 79,265 55,847109,904 635,283 59,193 50,711 0363,273 2,064,051 77,709 35,484 250,080670,949 3,727,494 62,513 49,937 558,499
524,548 2,689,990 78,718 57,965 387,865380,532 1,706,422 168,700 131,268 80,564322,720 1,339,087 183,983 117,199 21,538200,866 843,975 145,877 54,989236,271 980,378 183,428 52,843
291,056 1,119,446 214,033 77,023200,180 755,396 105,093 95,087206,317 772,723 108,879 97,438192,934 717,227 102,316 90,618194,050 724,067 102,500 91,550
221,475 814,246 102,878 118,597259,770 924,448 134,744 125,026263,533 911,879 137,900 125,633275,478 946,660 138,892 136,586280,924 949,068 143,766 137,158
322,597 1,078,920 151,751 170,846409,560 1,356,159 197,682 211,878382,059 1,248,559 190,182 191,877452,813 1,460,687 227,747 225,066 0520,626 1,652,781 264,921 255,705 (447,315)
657,211 2,028,429 326,485 330,726 (635,028)728,849 2,182,183 360,851 367,998 (1,733,539)750,427 2,156,399 372,555 377,872 (3,344,221)781,790 2,130,218 362,396 419,394 (2,558,245)808,705 2,084,291 367,945 440,760 (2,828,785)
921,063 2,274,230 469,248 451,815 (2,925,000)994,148 2,378,344 469,248 524,900 (3,131,826)
1,052,2006 2,369,820 488,200 564,000 (3,131,800)1,067,800 2,165,923 504,100 563,700 (3,065,000) 03,774,221 7,015,281 1,658,100 548,400 (656,687)7 1,567,721
4,343,760 7,634,025 1,668,500 656,000 2,019,2601,085,940 1,908,506 417,125 164,000 504,8154,343,760 7,167,921 1,877,100 790,900 1,675,7604,343,760 6,662,209 2,037,000 860,100 1,446,6604,343,760 5,983,140 2,092,600 908,700 1,342,460
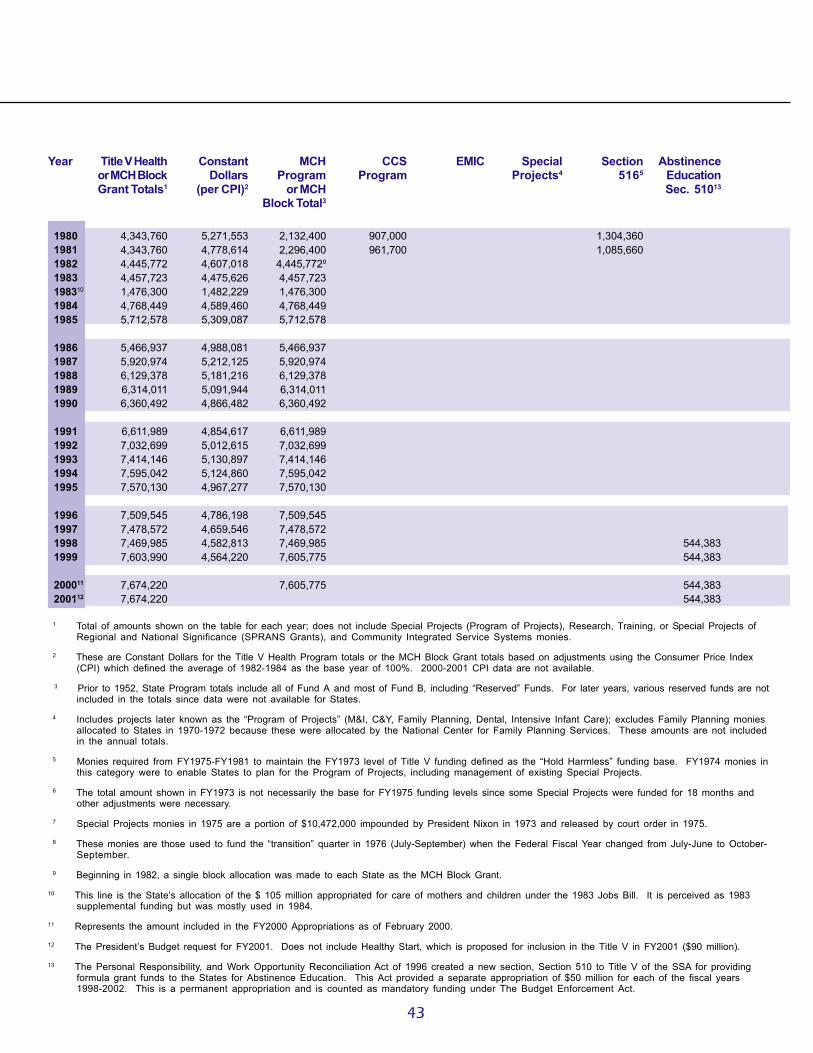
1980198119821983198310
19841985
19861987198819891990
19911992199319941995
1996199719981999
200011
200112
Year Title V Health Constant MCH CCS EMIC Special Section Abstinenceor MCH Block Dollars Program Program Projects4 5165 EducationGrant Totals1 (per CPI)2 or MCH Sec. 51013
Block Total3
43
4,343,760 5,271,553 2,132,400 907,000 1,304,3604,343,760 4,778,614 2,296,400 961,700 1,085,6604,445,772 4,607,018 4,445,7729
4,457,723 4,475,626 4,457,7231,476,300 1,482,229 1,476,3004,768,449 4,589,460 4,768,4495,712,578 5,309,087 5,712,578
5,466,937 4,988,081 5,466,9375,920,974 5,212,125 5,920,9746,129,378 5,181,216 6,129,3786,314,011 5,091,944 6,314,0116,360,492 4,866,482 6,360,492
6,611,989 4,854,617 6,611,9897,032,699 5,012,615 7,032,6997,414,146 5,130,897 7,414,1467,595,042 5,124,860 7,595,0427,570,130 4,967,277 7,570,130
7,509,545 4,786,198 7,509,5457,478,572 4,659,546 7,478,5727,469,985 4,582,813 7,469,985 544,3837,603,990 4,564,220 7,605,775 544,383
7,674,220 7,605,775 544,3837,674,220 544,383
1 Total of amounts shown on the table for each year; does not include Special Projects (Program of Projects), Research, Training, or Special Projects ofRegional and National Significance (SPRANS Grants), and Community Integrated Service Systems monies.
2 These are Constant Dollars for the Title V Health Program totals or the MCH Block Grant totals based on adjustments using the Consumer Price Index(CPI) which defined the average of 1982-1984 as the base year of 100%. 2000-2001 CPI data are not available.
3 Prior to 1952, State Program totals include all of Fund A and most of Fund B, including “Reserved” Funds. For later years, various reserved funds are notincluded in the totals since data were not available for States.
4 Includes projects later known as the “Program of Projects” (M&I, C&Y, Family Planning, Dental, Intensive Infant Care); excludes Family Planning moniesallocated to States in 1970-1972 because these were allocated by the National Center for Family Planning Services. These amounts are not includedin the annual totals.
5 Monies required from FY1975-FY1981 to maintain the FY1973 level of Title V funding defined as the “Hold Harmless” funding base. FY1974 monies inthis category were to enable States to plan for the Program of Projects, including management of existing Special Projects.
6 The total amount shown in FY1973 is not necessarily the base for FY1975 funding levels since some Special Projects were funded for 18 months andother adjustments were necessary.
7 Special Projects monies in 1975 are a portion of $10,472,000 impounded by President Nixon in 1973 and released by court order in 1975.
8 These monies are those used to fund the “transition” quarter in 1976 (July-September) when the Federal Fiscal Year changed from July-June to October-September.
9 Beginning in 1982, a single block allocation was made to each State as the MCH Block Grant.
10 This line is the State’s allocation of the $ 105 million appropriated for care of mothers and children under the 1983 Jobs Bill. It is perceived as 1983supplemental funding but was mostly used in 1984.
11 Represents the amount included in the FY2000 Appropriations as of February 2000.
12 The President’s Budget request for FY2001. Does not include Healthy Start, which is proposed for inclusion in the Title V in FY2001 ($90 million).
13 The Personal Responsibility, and Work Opportunity Reconciliation Act of 1996 created a new section, Section 510 to Title V of the SSA for providingformula grant funds to the States for Abstinence Education. This Act provided a separate appropriation of $50 million for each of the fiscal years1998-2002. This is a permanent appropriation and is counted as mandatory funding under The Budget Enforcement Act.

19361937193819391940
19411942194319441945
19461947194819491950
19511952195319541955
19561957195819591960
19611962196319641965
19661967196819691970
19711972197319741975
197619768
197719781979
Year Title V Health Constant MCH CCS EMIC Special Section Abstinenceor MCH Block Dollars Program Program Projects4 5165 EducationGrant Totals1 (per CPI)2 or MCH Sec. 51013
Block Total3
44
TABLE 11United States Title V or MCH Block Grant Allocations to Each State (showing Constant Dollars forTotal Amounts) By Program Components, FY 1936 - FY 2001: CONNECTICUT
35,863 258,007 20,140 15,72381,111 563,271 43,358 37,75381,253 576,262 43,500 37,75386,488 622,216 48,735 37,753
103,484 739,171 63,643 39,841
108,044 734,993 68,200 39,84497,997 601,209 55,219 42,778
143,245 828,006 58,398 39,847 45,000524,058 2,977,602 57,539 56,572 409,947818,013 4,544,517 64,797 74,041 679,175
790,162 4,052,113 80,955 68,206 641,001550,010 2,466,413 171,682 143,731 234,597212,572 882,041 91,638 86,245 34,689235,246 988,429 94,873 140,373231,957 962,477 97,434 134,523
289,526 1,113,562 119,315 170,211217,589 821,091 113,489 104,100224,420 840,524 117,672 106,748208,169 773,862 109,062 99,107208,954 779,679 109,486 99,468
243,142 893,904 111,566 131,576283,723 1,009,690 147,343 136,380288,316 997,633 152,027 136,289301,785 1,037,062 154,115 147,670301,640 1,019,054 159,401 142,239
346,595 1,159,181 166,800 179,795431,917 1,430,189 219,126 212,791437,216 1,428,810 218,761 218,455512,641 1,653,681 257,389 255,252 0586,984 1,863,441 294,367 292,617 0
758,420 2,340,802 378,997 379,423 (412,800)846,703 2,535,039 423,537 423,166 (338,306)847,307 2,434,790 423,537 423,770 (63,299)912,088 2,485,253 430,048 482,040 (857,713)928,801 2,393,817 434,924 493,877 (853,384)
994,855 2,456,432 494,721 500,134 (876,000)1,025,721 2,453,878 494,721 531,000 (1,081,894)1,047,8006 2,359,910 504,000 543,800 (1,081,900)1,041,000 2,111,562 497,800 543,200 (942,000) 02,289,559 4,255,686 1,452,300 542,100 (123,637)7 295,159
2,396,788 4,212,281 1,402,600 640,800 353,388599,197 1,053,070 350,650 160,200 88,347
2,396,788 3,955,096 1,392,500 772,400 231,8882,396,788 3,676,055 1,382,900 827,300 186,5882,396,788 3,301,361 1,420,800 873,800 102,188

1980198119821983198310
19841985
19861987198819891990
19911992199319941995
1996199719981999
200011
200112
Year Title V Health Constant MCH CCS EMIC Special Section Abstinenceor MCH Block Dollars Program Program Projects4 5165 EducationGrant Totals1 (per CPI)2 or MCH Sec. 51013
Block Total3
45
2,396,788 2,908,723 1,404,400 871,300 121,0882,468,800 2,715,952 1,574,800 894,000 02,861,610 2,965,399 2,861,6109
2,869,303 2,880,826 2,869,303950,250 954,066 950,250
3,069,308 2,954,098 3,069,3083,677,015 3,417,300 3,677,015
3,518,903 3,210,678 3,518,9033,811,153 3,354,888 3,811,1534,016,622 3,395,285 4,016,6224,202,874 3,389,415 4,202,8744,249,763 3,251,540 4,249,763
4,503,494 3,306,530 4,503,4944,927,866 3,512,378 4,927,8664,717,754 3,264,882 4,717,7544,827,530 3,257,443 4,827,5304,812,412 3,157,751 4,812,412
4,775,647 3,043,752 4,775,6474,755,540 2,962,953 4,755,5404,750,107 2,914,176 4,750,107 330,4844,831,430 2,900,018 4,832,514 330,484
4,874,049 4,832,514 330,4844,874,049 330,484
1 Total of amounts shown on the table for each year; does not include Special Projects (Program of Projects), Research, Training, or Special Projects ofRegional and National Significance (SPRANS Grants), and Community Integrated Service Systems monies.
2 These are Constant Dollars for the Title V Health Program totals or the MCH Block Grant totals based on adjustments using the Consumer Price Index(CPI) which defined the average of 1982-1984 as the base year of 100%. 2000-2001 CPI data are not available.
3 Prior to 1952, State Program totals include all of Fund A and most of Fund B, including “Reserved” Funds. For later years, various reserved funds are notincluded in the totals since data were not available for States.
4 Includes projects later known as the “Program of Projects” (M&I, C&Y, Family Planning, Dental, Intensive Infant Care); excludes Family Planning moniesallocated to States in 1970-1972 because these were allocated by the National Center for Family Planning Services. These amounts are not includedin the annual totals.
5 Monies required from FY1975-FY1981 to maintain the FY1973 level of Title V funding defined as the “Hold Harmless” funding base. FY1974 monies inthis category were to enable States to plan for the Program of Projects, including management of existing Special Projects.
6 The total amount shown in FY1973 is not necessarily the base for FY1975 funding levels since some Special Projects were funded for 18 months andother adjustments were necessary.
7 Special Projects monies in 1975 are a portion of $10,472,000 impounded by President Nixon in 1973 and released by court order in 1975.
8 These monies are those used to fund the “transition” quarter in 1976 (July-September) when the Federal Fiscal Year changed from July-June to October-September.
9 Beginning in 1982, a single block allocation was made to each State as the MCH Block Grant.
10 This line is the State’s allocation of the $ 105 million appropriated for care of mothers and children under the 1983 Jobs Bill. It is perceived as 1983supplemental funding but was mostly used in 1984.
11 Represents the amount included in the FY2000 Appropriations as of February 2000.
12 The President’s Budget request for FY2001. Does not include Healthy Start, which is proposed for inclusion in the Title V in FY2001 ($90 million).
13 The Personal Responsibility, and Work Opportunity Reconciliation Act of 1996 created a new section, Section 510 to Title V of the SSA for providingformula grant funds to the States for Abstinence Education. This Act provided a separate appropriation of $50 million for each of the fiscal years1998-2002. This is a permanent appropriation and is counted as mandatory funding under The Budget Enforcement Act.

19361937193819391940
19411942194319441945
19461947194819491950
19511952195319541955
19561957195819591960
19611962196319641965
19661967196819691970
19711972197319741975
197619768
197719781979
Year Title V Health Constant MCH CCS EMIC Special Section Abstinenceor MCH Block Dollars Program Program Projects4 5165 EducationGrant Totals1 (per CPI)2 or MCH Sec. 51013
Block Total3
46
TABLE 12United States Title V or MCH Block Grant Allocations to Each State (showing Constant Dollars forTotal Amounts) By Program Components, FY 1936 - FY 2001: DELAWARE
20,787 149,547 11,391 9,39651,632 358,556 29,071 22,56151,416 364,652 28,855 22,56153,325 383,633 30,764 22,56154,851 391,793 32,290 22,561
52,901 359,871 32,901 20,00052,113 319,712 31,813 20,30062,081 358,850 33,935 23,046 5,100
138,363 786,153 37,663 22,973 77,727206,996 1,149,978 32,172 22,991 151,833
156,468 802,400 33,336 29,347 93,785140,670 630,807 57,784 45,485 37,401119,356 495,253 70,845 35,716 12,795111,159 467,055 71,535 39,624116,945 485,249 70,351 46,594
159,919 615,073 87,206 72,713150,210 566,830 78,282 71,92868,046 254,854 48,046 20,000
145,539 541,037 76,029 69,510145,918 544,470 76,211 69,707
165,789 609,518 76,545 89,244193,818 689,744 99,379 94,439196,694 680,602 101,931 94,763200,000 687,285 102,935 97,065201,222 679,804 104,475 96,747
234,283 783,555 113,933 120,350255,519 846,089 128,431 127,088255,145 833,807 128,622 126,523278,681 898,971 140,597 138,094 0301,072 955,784 151,718 149,354 0
350,619 1,082,157 176,565 174,054 0375,876 1,125,377 189,075 186,801 0375,900 1,080,172 189,075 186,825 0391,652 1,067,172 188,996 202,656 (122,250)408,715 1,053,389 199,418 209,297 0
421,853 1,041,612 211,196 210,657 0426,796 1,021,043 211,196 215,600 0
432,7006 974,550 213,100 219,600 0507,400 1,029,209 212,600 219,400 0 75,400797,400 1,482,156 578,300 219,100 07 0
819,900 1,440,949 583,400 236,500 0204,975 360,237 145,850 59,125 0842,700 1,390,594 588,100 254,600 0876,800 1,344,785 613,500 263,300 0899,900 1,239,532 630,300 269,600 0

1980198119821983198310
19841985
19861987198819891990
19911992199319941995
1996199719981999
200011
200112
Year Title V Health Constant MCH CCS EMIC Special Section Abstinenceor MCH Block Dollars Program Program Projects4 5165 EducationGrant Totals1 (per CPI)2 or MCH Sec. 51013
Block Total3
47
886,000 1,075,243 621,400 264,600 0911,000 1,002,200 643,600 267,400 0
1,283,772 1,330,334 1,283,7729
1,287,223 1,292,393 1,287,223426,300 428,012 426,300
1,376,949 1,325,264 1,376,9491,649,578 1,533,065 1,649,578
1,578,646 1,440,370 1,578,6461,709,755 1,505,066 1,709,7551,768,145 1,494,628 1,768,1451,819,770 1,467,556 1,819,7701,832,766 1,402,269 1,832,766
1,903,085 1,397,272 1,903,0852,020,719 1,440,284 2,020,7191,932,842 1,337,607 1,932,8421,959,646 1,322,298 1,959,6461,955,955 1,283,435 1,955,955
1,946,978 1,240,904 1,946,9781,937,383 1,207,092 1,937,3831,935,261 1,187,277 1,935,261 80,9351,955,133 1,173,549 1,955,397 80,935
1,965,540 1,955,397 80,9351,965,540 80,935
1 Total of amounts shown on the table for each year; does not include Special Projects (Program of Projects), Research, Training, or Special Projects ofRegional and National Significance (SPRANS Grants), and Community Integrated Service Systems monies.
2 These are Constant Dollars for the Title V Health Program totals or the MCH Block Grant totals based on adjustments using the Consumer Price Index(CPI) which defined the average of 1982-1984 as the base year of 100%. 2000-2001 CPI data are not available.
3 Prior to 1952, State Program totals include all of Fund A and most of Fund B, including “Reserved” Funds. For later years, various reserved funds are notincluded in the totals since data were not available for States.
4 Includes projects later known as the “Program of Projects” (M&I, C&Y, Family Planning, Dental, Intensive Infant Care); excludes Family Planning moniesallocated to States in 1970-1972 because these were allocated by the National Center for Family Planning Services. These amounts are not includedin the annual totals.
5 Monies required from FY1975-FY1981 to maintain the FY1973 level of Title V funding defined as the “Hold Harmless” funding base. FY1974 monies inthis category were to enable States to plan for the Program of Projects, including management of existing Special Projects.
6 The total amount shown in FY1973 is not necessarily the base for FY1975 funding levels since some Special Projects were funded for 18 months andother adjustments were necessary.
7 Special Projects monies in 1975 are a portion of $10,472,000 impounded by President Nixon in 1973 and released by court order in 1975.
8 These monies are those used to fund the “transition” quarter in 1976 (July-September) when the Federal Fiscal Year changed from July-June to October-September.
9 Beginning in 1982, a single block allocation was made to each State as the MCH Block Grant.
10 This line is the State’s allocation of the $ 105 million appropriated for care of mothers and children under the 1983 Jobs Bill. It is perceived as 1983supplemental funding but was mostly used in 1984.
11 Represents the amount included in the FY2000 Appropriations as of February 2000.
12 The President’s Budget request for FY2001. Does not include Healthy Start, which is proposed for inclusion in the Title V in FY2001 ($90 million).
13 The Personal Responsibility, and Work Opportunity Reconciliation Act of 1996 created a new section, Section 510 to Title V of the SSA for providingformula grant funds to the States for Abstinence Education. This Act provided a separate appropriation of $50 million for each of the fiscal years1998-2002. This is a permanent appropriation and is counted as mandatory funding under The Budget Enforcement Act.
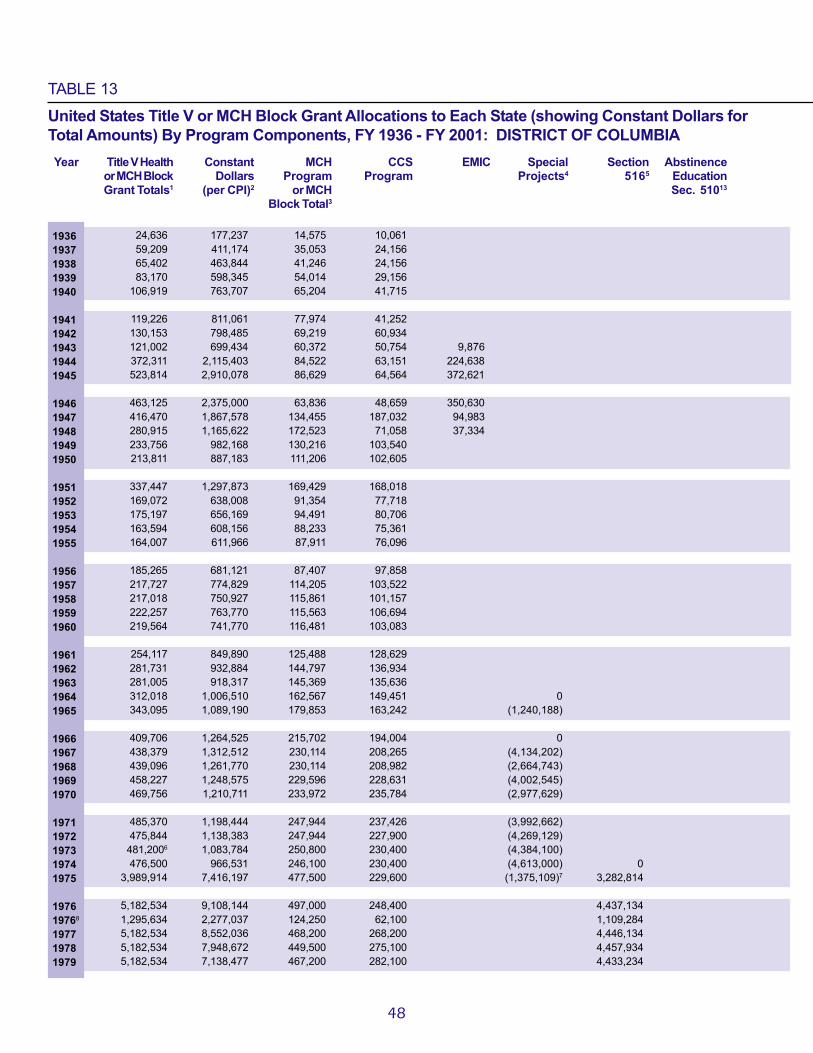
19361937193819391940
19411942194319441945
19461947194819491950
19511952195319541955
19561957195819591960
19611962196319641965
19661967196819691970
19711972197319741975
197619768
197719781979
Year Title V Health Constant MCH CCS EMIC Special Section Abstinenceor MCH Block Dollars Program Program Projects4 5165 EducationGrant Totals1 (per CPI)2 or MCH Sec. 51013
Block Total3
48
TABLE 13United States Title V or MCH Block Grant Allocations to Each State (showing Constant Dollars forTotal Amounts) By Program Components, FY 1936 - FY 2001: DISTRICT OF COLUMBIA
24,636 177,237 14,575 10,06159,209 411,174 35,053 24,15665,402 463,844 41,246 24,15683,170 598,345 54,014 29,156
106,919 763,707 65,204 41,715
119,226 811,061 77,974 41,252130,153 798,485 69,219 60,934121,002 699,434 60,372 50,754 9,876372,311 2,115,403 84,522 63,151 224,638523,814 2,910,078 86,629 64,564 372,621
463,125 2,375,000 63,836 48,659 350,630416,470 1,867,578 134,455 187,032 94,983280,915 1,165,622 172,523 71,058 37,334233,756 982,168 130,216 103,540213,811 887,183 111,206 102,605
337,447 1,297,873 169,429 168,018169,072 638,008 91,354 77,718175,197 656,169 94,491 80,706163,594 608,156 88,233 75,361164,007 611,966 87,911 76,096
185,265 681,121 87,407 97,858217,727 774,829 114,205 103,522217,018 750,927 115,861 101,157222,257 763,770 115,563 106,694219,564 741,770 116,481 103,083
254,117 849,890 125,488 128,629281,731 932,884 144,797 136,934281,005 918,317 145,369 135,636312,018 1,006,510 162,567 149,451 0343,095 1,089,190 179,853 163,242 (1,240,188)
409,706 1,264,525 215,702 194,004 0438,379 1,312,512 230,114 208,265 (4,134,202)439,096 1,261,770 230,114 208,982 (2,664,743)458,227 1,248,575 229,596 228,631 (4,002,545)469,756 1,210,711 233,972 235,784 (2,977,629)
485,370 1,198,444 247,944 237,426 (3,992,662)475,844 1,138,383 247,944 227,900 (4,269,129)
481,2006 1,083,784 250,800 230,400 (4,384,100)476,500 966,531 246,100 230,400 (4,613,000) 0
3,989,914 7,416,197 477,500 229,600 (1,375,109)7 3,282,814
5,182,534 9,108,144 497,000 248,400 4,437,1341,295,634 2,277,037 124,250 62,100 1,109,2845,182,534 8,552,036 468,200 268,200 4,446,1345,182,534 7,948,672 449,500 275,100 4,457,9345,182,534 7,138,477 467,200 282,100 4,433,234

1980198119821983198310
19841985
19861987198819891990
19911992199319941995
1996199719981999
200011
200112
Year Title V Health Constant MCH CCS EMIC Special Section Abstinenceor MCH Block Dollars Program Program Projects4 5165 EducationGrant Totals1 (per CPI)2 or MCH Sec. 51013
Block Total3
49
5,182,534 6,289,483 458,200 273,700 4,450,6345,182,534 5,701,358 451,300 274,400 4,456,8345,008,608 5,190,267 5,008,6089
5,022,072 5,042,241 5,022,0721,663,200 1,669,880 1,663,2005,372,136 5,170,487 5,372,1366,435,792 5,981,219 6,435,792
6,159,053 5,619,574 6,159,0536,670,571 5,871,982 6,670,5716,766,670 5,719,924 6,766,6706,843,600 5,519,032 6,843,6006,862,968 5,250,932 6,862,968
6,967,703 5,115,788 6,967,7037,143,054 5,091,272 7,143,0547,011,945 4,852,557 7,011,9457,051,870 4,758,347 7,051,8707,046,372 4,623,604 7,046,372
7,033,000 4,482,473 7,033,0006,993,911 4,357,577 6,993,9116,986,547 4,286,225 6,986,547 120,4397,016,215 4,211,414 7,016,609 0
7,031,721 7,016,609 120,4397,031,721 120,439
1 Total of amounts shown on the table for each year; does not include Special Projects (Program of Projects), Research, Training, or Special Projects ofRegional and National Significance (SPRANS Grants), and Community Integrated Service Systems monies.
2 These are Constant Dollars for the Title V Health Program totals or the MCH Block Grant totals based on adjustments using the Consumer Price Index(CPI) which defined the average of 1982-1984 as the base year of 100%. 2000-2001 CPI data are not available.
3 Prior to 1952, State Program totals include all of Fund A and most of Fund B, including “Reserved” Funds. For later years, various reserved funds are notincluded in the totals since data were not available for States.
4 Includes projects later known as the “Program of Projects” (M&I, C&Y, Family Planning, Dental, Intensive Infant Care); excludes Family Planning moniesallocated to States in 1970-1972 because these were allocated by the National Center for Family Planning Services. These amounts are not includedin the annual totals.
5 Monies required from FY1975-FY1981 to maintain the FY1973 level of Title V funding defined as the “Hold Harmless” funding base. FY1974 monies inthis category were to enable States to plan for the Program of Projects, including management of existing Special Projects.
6 The total amount shown in FY1973 is not necessarily the base for FY1975 funding levels since some Special Projects were funded for 18 months andother adjustments were necessary.
7 Special Projects monies in 1975 are a portion of $10,472,000 impounded by President Nixon in 1973 and released by court order in 1975.
8 These monies are those used to fund the “transition” quarter in 1976 (July-September) when the Federal Fiscal Year changed from July-June to October-September.
9 Beginning in 1982, a single block allocation was made to each State as the MCH Block Grant.
10 This line is the State’s allocation of the $ 105 million appropriated for care of mothers and children under the 1983 Jobs Bill. It is perceived as 1983supplemental funding but was mostly used in 1984.
11 Represents the amount included in the FY2000 Appropriations as of February 2000.
12 The President’s Budget request for FY2001. Does not include Healthy Start, which is proposed for inclusion in the Title V in FY2001 ($90 million).
13 The Personal Responsibility, and Work Opportunity Reconciliation Act of 1996 created a new section, Section 510 to Title V of the SSA for providingformula grant funds to the States for Abstinence Education. This Act provided a separate appropriation of $50 million for each of the fiscal years1998-2002. This is a permanent appropriation and is counted as mandatory funding under The Budget Enforcement Act.

19361937193819391940
19411942194319441945
19461947194819491950
19511952195319541955
19561957195819591960
19611962196319641965
19661967196819691970
19711972197319741975
197619768
197719781979
Year Title V Health Constant MCH CCS EMIC Special Section Abstinenceor MCH Block Dollars Program Program Projects4 5165 EducationGrant Totals1 (per CPI)2 or MCH Sec. 51013
Block Total3
50
TABLE 14United States Title V or MCH Block Grant Allocations to Each State (showing Constant Dollars forTotal Amounts) By Program Components, FY 1936 - FY 2001: FLORIDA
41,820 300,863 26,324 15,496128,443 891,965 70,949 57,494136,102 965,262 75,216 60,886133,691 961,806 76,334 57,357141,716 1,012,257 86,913 54,803
167,985 1,142,755 111,141 56,844224,711 1,378,595 150,323 74,388183,073 1,058,225 111,569 67,004 4,500708,631 4,026,313 123,366 64,367 520,898885,184 4,917,689 118,055 72,018 695,111
786,590 4,033,795 122,932 92,118 571,540701,367 3,145,143 313,507 280,622 107,238524,527 2,176,461 311,009 138,318 75,200324,623 1,363,962 204,013 120,610260,949 1,082,776 162,759 98,190
388,257 1,493,296 251,868 136,389355,541 1,341,664 189,765 165,776395,266 1,480,397 207,862 187,404354,494 1,317,822 188,314 166,180377,000 1,406,716 197,949 179,051
483,561 1,777,798 205,935 277,626515,154 1,833,288 258,268 256,886539,095 1,865,381 271,493 267,602594,723 2,043,722 285,711 309,012674,627 2,279,145 354,481 320,146
765,619 2,560,599 366,288 399,3311,133,776 3,754,225 583,401 550,3751,176,981 3,846,343 626,516 550,4651,434,721 4,628,132 771,691 663,030 01,661,464 5,274,489 900,922 760,542 (553,231)
2,222,297 6,858,941 1,185,722 1,036,575 (1,794,535)2,537,187 7,596,368 1,361,003 1,176,184 (2,935,397)2,529,051 7,267,388 1,354,581 1,174,470 (2,993,156)2,687,869 7,323,894 1,353,536 1,334,333 (4,331,180)2,690,614 6,934,572 1,330,915 1,359,699 (4,062,549)
3,071,780 7,584,642 1,659,093 1,412,687 (4,216,632)3,144,193 7,521,993 1,659,093 1,485,100 (4,402,598)3,245,2006 7,309,009 1,642,000 1,603,200 (4,502,600)3,183,300 6,456,998 1,581,200 1,602,100 (4,514,000) 07,751,679 14,408,325 5,245,500 1,537,200 (405,886)7 968,979
8,103,700 14,242,004 5,588,200 1,829,800 685,7002,025,925 3,560,501 1,397,050 457,450 171,4258,296,600 13,690,759 6,034,000 2,262,600 08,905,700 13,659,049 6,319,000 2,586,700 09,225,400 12,707,163 6,491,500 2,733,900 0

1980198119821983198310
19841985
19861987198819891990
19911992199319941995
1996199719981999
200011
200112
Year Title V Health Constant MCH CCS EMIC Special Section Abstinenceor MCH Block Dollars Program Program Projects4 5165 EducationGrant Totals1 (per CPI)2 or MCH Sec. 51013
Block Total3
51
9,044,000 10,975,728 6,401,300 2,642,700 09,461,200 10,408,361 6,705,000 2,756,200 09,270,984 9,607,237 9,270,9849
9,295,906 9,333,239 9,295,9063,078,600 3,090,964 3,078,6009,943,878 9,570,624 9,943,878
11,912,716 11,071,297 11,912,716
11,400,469 10,401,888 11,400,46912,347,293 10,869,096 12,347,29313,291,304 11,235,253 13,291,30414,157,783 11,417,567 14,157,78314,375,919 10,999,173 14,375,919
15,556,390 11,421,725 15,556,39017,530,573 12,495,063 17,530,57318,375,594 12,716,674 18,375,59419,109,032 12,894,084 19,109,03219,008,026 12,472,458 19,008,026
18,762,386 11,958,181 18,762,38618,706,917 11,655,400 18,706,91718,683,990 11,462,571 18,683,990 2,207,88319,227,102 11,540,878 19,234,340 2,207,883
19,511,836 19,234,340 2,207,88319,511,836 2,207,883
1 Total of amounts shown on the table for each year; does not include Special Projects (Program of Projects), Research, Training, or Special Projects ofRegional and National Significance (SPRANS Grants), and Community Integrated Service Systems monies.
2 These are Constant Dollars for the Title V Health Program totals or the MCH Block Grant totals based on adjustments using the Consumer Price Index(CPI) which defined the average of 1982-1984 as the base year of 100%. 2000-2001 CPI data are not available.
3 Prior to 1952, State Program totals include all of Fund A and most of Fund B, including “Reserved” Funds. For later years, various reserved funds are notincluded in the totals since data were not available for States.
4 Includes projects later known as the “Program of Projects” (M&I, C&Y, Family Planning, Dental, Intensive Infant Care); excludes Family Planning moniesallocated to States in 1970-1972 because these were allocated by the National Center for Family Planning Services. These amounts are not includedin the annual totals.
5 Monies required from FY1975-FY1981 to maintain the FY1973 level of Title V funding defined as the “Hold Harmless” funding base. FY1974 monies inthis category were to enable States to plan for the Program of Projects, including management of existing Special Projects.
6 The total amount shown in FY1973 is not necessarily the base for FY1975 funding levels since some Special Projects were funded for 18 months andother adjustments were necessary.
7 Special Projects monies in 1975 are a portion of $10,472,000 impounded by President Nixon in 1973 and released by court order in 1975.
8 These monies are those used to fund the “transition” quarter in 1976 (July-September) when the Federal Fiscal Year changed from July-June to October-September.
9 Beginning in 1982, a single block allocation was made to each State as the MCH Block Grant.
10 This line is the State’s allocation of the $ 105 million appropriated for care of mothers and children under the 1983 Jobs Bill. It is perceived as 1983supplemental funding but was mostly used in 1984.
11 Represents the amount included in the FY2000 Appropriations as of February 2000.
12 The President’s Budget request for FY2001. Does not include Healthy Start, which is proposed for inclusion in the Title V in FY2001 ($90 million).
13 The Personal Responsibility, and Work Opportunity Reconciliation Act of 1996 created a new section, Section 510 to Title V of the SSA for providingformula grant funds to the States for Abstinence Education. This Act provided a separate appropriation of $50 million for each of the fiscal years1998-2002. This is a permanent appropriation and is counted as mandatory funding under The Budget Enforcement Act.

19361937193819391940
19411942194319441945
19461947194819491950
19511952195319541955
19561957195819591960
19611962196319641965
19661967196819691970
19711972197319741975
197619768
197719781979
Year Title V Health Constant MCH CCS EMIC Special Section Abstinenceor MCH Block Dollars Program Program Projects4 5165 EducationGrant Totals1 (per CPI)2 or MCH Sec. 51013
Block Total3
52
TABLE 15United States Title V or MCH Block Grant Allocations to Each State (showing Constant Dollars forTotal Amounts) By Program Components, FY 1936 - FY 2001: GEORGIA
84,751 609,719 59,639 25,112200,970 1,395,625 140,670 60,300187,027 1,326,433 126,727 60,300186,665 1,342,914 126,365 60,300239,431 1,710,221 161,237 78,194
289,332 1,968,245 187,773 101,559309,017 1,895,810 197,937 111,080274,234 1,585,168 177,868 96,366 0633,815 3,601,222 172,625 95,869 365,321939,307 5,218,372 190,175 85,157 663,975
758,909 3,891,841 167,090 81,790 510,029636,316 2,853,435 368,162 140,569 127,585687,634 2,853,253 446,022 194,909 46,703767,207 3,223,559 512,770 254,437615,529 2,554,062 410,910 204,619
789,190 3,035,346 519,335 269,855703,861 2,656,079 372,749 331,112778,018 2,913,925 405,069 372,949671,732 2,497,145 340,257 331,475662,323 2,471,354 336,555 325,768
798,461 2,935,518 336,852 461,609850,637 3,027,178 402,869 447,768864,794 2,992,367 422,505 442,289900,196 3,093,457 425,100 475,096915,781 3,093,855 451,159 464,622
1,044,677 3,493,903 465,674 579,0031,391,309 4,606,983 656,631 734,6781,337,639 4,371,369 632,375 705,2641,568,107 5,058,410 755,103 813,004 (281,768)1,779,500 5,649,206 863,671 915,829 (1,106,655)
2,307,900 7,123,148 1,132,058 1,175,842 (290,317)2,649,144 7,931,569 1,323,207 1,325,937 (2,266,969)2,620,441 7,530,003 1,299,313 1,321,128 (2,018,062)2,809,140 7,654,332 1,319,346 1,489,794 (2,239,114)2,796,834 7,208,335 1,288,923 1,507,911 (2,120,738)
3,168,178 7,822,662 1,635,785 1,532,393 (2,104,581)3,205,985 7,669,821 1,635,785 1,570,200 (2,606,851)3,303,5006 7,440,315 1,645,600 1,657,900 (2,906,800)3,492,900 7,084,990 1,627,700 1,656,500 (3,028,000) 208,7007,019,900 13,048,141 5,423,400 1,596,500 07 0
8,076,400 14,194,025 6,159,700 1,916,700 02,019,100 3,548,506 1,539,925 479,175 08,831,200 14,572,937 6,482,500 2,348,700 08,856,100 13,582,975 6,328,500 2,527,600 09,174,400 12,636,915 6,501,200 2,673,200 0

1980198119821983198310
19841985
19861987198819891990
19911992199319941995
1996199719981999
200011
200112
Year Title V Health Constant MCH CCS EMIC Special Section Abstinenceor MCH Block Dollars Program Program Projects4 5165 EducationGrant Totals1 (per CPI)2 or MCH Sec. 51013
Block Total3
53
9,287,100 11,270,752 6,595,800 2,691,300 09,585,200 10,544,774 6,808,600 2,776,600 09,239,364 9,574,470 9,239,3649
9,264,201 9,301,407 9,264,2013,068,100 3,080,422 3,068,1009,909,963 9,537,982 9,909,963
11,872,086 11,033,537 11,872,086
11,361,586 10,366,411 11,361,58612,305,181 10,832,026 12,305,18113,061,883 11,041,321 13,061,88313,751,423 11,089,857 13,751,42313,925,014 10,654,181 13,925,014
14,864,394 10,913,652 14,864,39416,435,470 11,714,519 16,435,47016,273,868 11,262,192 16,273,86816,755,595 11,306,070 16,755,59516,689,254 10,950,954 16,689,254
16,527,916 10,534,045 16,527,91616,466,255 10,259,349 16,466,25516,446,918 10,090,134 16,446,918 1,450,08316,803,713 10,086,262 16,808,467 1,450,083
16,990,732 16,808,467 1,377,66816,990,732 1,450,083
1 Total of amounts shown on the table for each year; does not include Special Projects (Program of Projects), Research, Training, or Special Projects ofRegional and National Significance (SPRANS Grants), and Community Integrated Service Systems monies.
2 These are Constant Dollars for the Title V Health Program totals or the MCH Block Grant totals based on adjustments using the Consumer Price Index(CPI) which defined the average of 1982-1984 as the base year of 100%. 2000-2001 CPI data are not available.
3 Prior to 1952, State Program totals include all of Fund A and most of Fund B, including “Reserved” Funds. For later years, various reserved funds are notincluded in the totals since data were not available for States.
4 Includes projects later known as the “Program of Projects” (M&I, C&Y, Family Planning, Dental, Intensive Infant Care); excludes Family Planning moniesallocated to States in 1970-1972 because these were allocated by the National Center for Family Planning Services. These amounts are not includedin the annual totals.
5 Monies required from FY1975-FY1981 to maintain the FY1973 level of Title V funding defined as the “Hold Harmless” funding base. FY1974 monies inthis category were to enable States to plan for the Program of Projects, including management of existing Special Projects.
6 The total amount shown in FY1973 is not necessarily the base for FY1975 funding levels since some Special Projects were funded for 18 months andother adjustments were necessary.
7 Special Projects monies in 1975 are a portion of $10,472,000 impounded by President Nixon in 1973 and released by court order in 1975.
8 These monies are those used to fund the “transition” quarter in 1976 (July-September) when the Federal Fiscal Year changed from July-June to October-September.
9 Beginning in 1982, a single block allocation was made to each State as the MCH Block Grant.
10 This line is the State’s allocation of the $ 105 million appropriated for care of mothers and children under the 1983 Jobs Bill. It is perceived as 1983supplemental funding but was mostly used in 1984.
11 Represents the amount included in the FY2000 Appropriations as of February 2000.
12 The President’s Budget request for FY2001. Does not include Healthy Start, which is proposed for inclusion in the Title V in FY2001 ($90 million).
13 The Personal Responsibility, and Work Opportunity Reconciliation Act of 1996 created a new section, Section 510 to Title V of the SSA for providingformula grant funds to the States for Abstinence Education. This Act provided a separate appropriation of $50 million for each of the fiscal years1998-2002. This is a permanent appropriation and is counted as mandatory funding under The Budget Enforcement Act.

19361937193819391940
19411942194319441945
19461947194819491950
19511952195319541955
19561957195819591960
19611962196319641965
19661967196819691970
19711972197319741975
197619768
197719781979
Year Title V Health Constant MCH CCS EMIC Special Section Abstinenceor MCH Block Dollars Program Program Projects4 5165 EducationGrant Totals1 (per CPI)2 or MCH Sec. 51013
Block Total3
54
TABLE 16United States Title V or MCH Block Grant Allocations to Each State (showing Constant Dollars forTotal Amounts) By Program Components, FY 1936 - FY 2001: HAWAII
27,357 196,813 16,938 10,41964,616 448,722 39,599 25,01762,391 442,489 37,374 25,01760,907 438,180 35,890 25,01771,095 507,821 44,854 26,241
72,254 491,524 47,827 24,42765,453 401,552 42,062 23,39184,333 487,474 49,333 25,000 10,00094,725 538,210 44,253 32,372 18,100
134,751 748,617 54,601 30,738 49,412
191,836 983,774 47,032 37,950 106,854352,716 1,581,686 151,720 87,161 113,835329,459 1,367,050 120,244 136,070 73,145264,077 1,109,567 137,657 126,420222,498 923,228 98,844 123,654
295,306 1,135,792 137,130 158,176163,601 617,362 85,405 78,196168,714 631,888 88,260 80,454157,583 585,810 82,451 75,132156,675 584,608 82,108 74,567
178,839 657,496 82,827 96,012208,291 741,249 107,962 100,329210,342 727,827 109,941 100,401215,927 742,017 109,938 105,989214,875 725,929 112,077 102,798
249,507 834,472 121,250 128,257277,652 919,377 138,825 138,827278,548 910,288 139,354 139,194310,136 1,000,439 155,455 154,681 0342,727 1,088,022 173,090 169,637 0
402,666 1,242,796 204,672 197,994 (279,414)431,846 1,292,952 219,655 212,191 (258,386)432,807 1,243,698 219,655 213,152 (319,388)452,659 1,233,403 220,101 232,558 (626,097)471,207 1,214,451 227,416 243,791 (570,584)
490,599 1,211,356 245,080 245,519 (599,106)486,680 1,164,306 245,080 241,600 (630,192)500,7006 1,127,703 247,800 252,900 (630,200)505,300 1,024,949 252,600 252,700 (498,000) 0
1,268,057 2,356,983 686,600 254,200 (137,082)7 327,257
1,386,947 2,437,517 554,400 277,700 554,847346,737 609,380 138,600 69,425 138,712
1,386,947 2,288,691 633,400 309,900 443,6471,386,947 2,127,219 727,200 325,500 334,2471,386,947 1,910,395 747,000 335,000 304,947

1980198119821983198310
19841985
19861987198819891990
19911992199319941995
1996199719981999
200011
200112
Year Title V Health Constant MCH CCS EMIC Special Section Abstinenceor MCH Block Dollars Program Program Projects4 5165 EducationGrant Totals1 (per CPI)2 or MCH Sec. 51013
Block Total3
55
1,386,947 1,683,188 784,500 335,100 267,3471,386,947 1,525,794 855,300 345,700 185,9471,375,470 1,425,358 1,375,4709
1,379,168 1,384,707 1,379,168456,750 458,584 456,750
1,475,303 1,419,926 1,475,3031,767,405 1,642,570 1,767,405
1,691,407 1,543,255 1,691,4071,831,870 1,612,562 1,831,8701,911,104 1,615,473 1,911,1041,982,163 1,598,519 1,982,1632,000,053 1,530,262 2,000,053
2,096,852 1,539,539 2,096,8522,258,764 1,609,953 2,258,7642,192,984 1,517,636 2,192,9842,236,624 1,509,193 2,236,6242,230,614 1,463,657 2,230,614
2,215,998 1,412,363 2,215,9982,206,100 1,374,517 2,206,1002,203,617 1,351,912 2,203,617 131,5192,235,951 1,342,107 2,236,382 131,519
2,252,894 2,236,382 131,5192,252,894 131,519
1 Total of amounts shown on the table for each year; does not include Special Projects (Program of Projects), Research, Training, or Special Projects ofRegional and National Significance (SPRANS Grants), and Community Integrated Service Systems monies.
2 These are Constant Dollars for the Title V Health Program totals or the MCH Block Grant totals based on adjustments using the Consumer Price Index(CPI) which defined the average of 1982-1984 as the base year of 100%. 2000-2001 CPI data are not available.
3 Prior to 1952, State Program totals include all of Fund A and most of Fund B, including “Reserved” Funds. For later years, various reserved funds are notincluded in the totals since data were not available for States.
4 Includes projects later known as the “Program of Projects” (M&I, C&Y, Family Planning, Dental, Intensive Infant Care); excludes Family Planning moniesallocated to States in 1970-1972 because these were allocated by the National Center for Family Planning Services. These amounts are not includedin the annual totals.
5 Monies required from FY1975-FY1981 to maintain the FY1973 level of Title V funding defined as the “Hold Harmless” funding base. FY1974 monies inthis category were to enable States to plan for the Program of Projects, including management of existing Special Projects.
6 The total amount shown in FY1973 is not necessarily the base for FY1975 funding levels since some Special Projects were funded for 18 months andother adjustments were necessary.
7 Special Projects monies in 1975 are a portion of $10,472,000 impounded by President Nixon in 1973 and released by court order in 1975.
8 These monies are those used to fund the “transition” quarter in 1976 (July-September) when the Federal Fiscal Year changed from July-June to October-September.
9 Beginning in 1982, a single block allocation was made to each State as the MCH Block Grant.
10 This line is the State’s allocation of the $ 105 million appropriated for care of mothers and children under the 1983 Jobs Bill. It is perceived as 1983supplemental funding but was mostly used in 1984.
11 Represents the amount included in the FY2000 Appropriations as of February 2000.
12 The President’s Budget request for FY2001. Does not include Healthy Start, which is proposed for inclusion in the Title V in FY2001 ($90 million).
13 The Personal Responsibility, and Work Opportunity Reconciliation Act of 1996 created a new section, Section 510 to Title V of the SSA for providingformula grant funds to the States for Abstinence Education. This Act provided a separate appropriation of $50 million for each of the fiscal years1998-2002. This is a permanent appropriation and is counted as mandatory funding under The Budget Enforcement Act.

19361937193819391940
19411942194319441945
19461947194819491950
19511952195319541955
19561957195819591960
19611962196319641965
19661967196819691970
19711972197319741975
197619768
197719781979
Year Title V Health Constant MCH CCS EMIC Special Section Abstinenceor MCH Block Dollars Program Program Projects4 5165 EducationGrant Totals1 (per CPI)2 or MCH Sec. 51013
Block Total3
56
TABLE 17United States Title V or MCH Block Grant Allocations to Each State (showing Constant Dollars forTotal Amounts) By Program Components, FY 1936 - FY 2001: IDAHO
26,442 190,230 15,752 10,69068,219 473,743 42,552 25,66771,286 505,574 45,619 25,66769,148 497,468 43,481 25,66781,135 579,536 51,676 29,459
82,539 561,490 52,556 29,98387,392 536,147 49,234 38,158
118,084 682,566 64,643 40,441 13,000224,809 1,277,324 58,249 23,642 142,918321,383 1,785,461 58,167 26,692 236,524
249,957 1,281,831 53,852 20,000 176,105200,462 898,933 111,049 51,177 38,236167,843 696,444 96,823 63,298 7,722145,313 610,559 87,374 57,939124,323 515,863 72,733 51,590
176,585 679,173 93,316 83,269167,616 632,513 87,331 80,285172,933 647,689 90,278 82,655161,574 600,647 84,435 77,139160,943 600,534 83,918 77,025
182,475 670,864 83,996 98,479211,745 753,541 108,790 102,955214,081 740,765 111,137 102,944219,250 753,436 110,753 108,497216,180 730,338 111,460 104,720
251,425 840,886 120,656 130,769279,275 924,752 138,934 140,341279,958 914,895 139,530 140,428309,191 997,390 153,613 155,578 0338,690 1,075,206 167,956 170,734 0
394,881 1,218,769 192,056 202,825 (136,643)424,652 1,271,413 202,682 221,970 (21,731)420,786 1,209,155 202,682 218,104 (192,850)445,701 1,214,444 203,814 241,887 (335,000)463,700 1,195,103 215,317 248,383 (270,000)
486,209 1,200,516 234,870 251,339 (259,000)511,170 1,222,895 234,870 276,300 (282,702)
544,8006 1,227,027 245,200 299,600 (282,700)585,900 1,188,438 239,500 299,300 (411,000) 47,100
1,078,400 2,004,461 787,900 290,500 07 0
1,269,900 2,231,810 922,700 347,200 0317,475 557,953 230,675 86,800 0
1,514,000 2,498,350 1,086,900 427,100 01,710,900 2,624,080 1,248,700 462,200 01,771,200 2,439,669 1,282,700 488,500 0

1980198119821983198310
19841985
19861987198819891990
19911992199319941995
1996199719981999
200011
200112
Year Title V Health Constant MCH CCS EMIC Special Section Abstinenceor MCH Block Dollars Program Program Projects4 5165 EducationGrant Totals1 (per CPI)2 or MCH Sec. 51013
Block Total3
57
1,914,000 2,322,816 1,396,100 517,900 02,123,500 2,336,084 1,571,700 551,800 02,004,708 2,077,418 2,004,7089
2,010,097 2,018,170 2,010,097665,700 668,373 665,700
2,150,211 2,069,500 2,150,2112,575,942 2,393,998 2,575,942
2,465,176 2,249,248 2,465,1762,669,913 2,350,276 2,669,9132,767,905 2,339,734 2,767,9052,854,958 2,302,385 2,854,9582,876,874 2,201,128 2,876,874
2,995,454 2,199,305 2,995,4543,193,813 2,276,417 3,193,8133,233,976 2,238,046 3,233,9763,302,196 2,228,202 3,302,1963,292,801 2,160,631 3,292,801
3,269,953 2,084,100 3,269,9533,255,645 2,028,439 3,255,6453,251,961 1,995,068 3,251,961 205,2283,302,504 1,982,295 3,303,178 205,228
3,328,990 3,303,178 205,2283,328,990 205,228
1 Total of amounts shown on the table for each year; does not include Special Projects (Program of Projects), Research, Training, or Special Projects ofRegional and National Significance (SPRANS Grants), and Community Integrated Service Systems monies.
2 These are Constant Dollars for the Title V Health Program totals or the MCH Block Grant totals based on adjustments using the Consumer Price Index(CPI) which defined the average of 1982-1984 as the base year of 100%. 2000-2001 CPI data are not available.
3 Prior to 1952, State Program totals include all of Fund A and most of Fund B, including “Reserved” Funds. For later years, various reserved funds are notincluded in the totals since data were not available for States.
4 Includes projects later known as the “Program of Projects” (M&I, C&Y, Family Planning, Dental, Intensive Infant Care); excludes Family Planning moniesallocated to States in 1970-1972 because these were allocated by the National Center for Family Planning Services. These amounts are not includedin the annual totals.
5 Monies required from FY1975-FY1981 to maintain the FY1973 level of Title V funding defined as the “Hold Harmless” funding base. FY1974 monies inthis category were to enable States to plan for the Program of Projects, including management of existing Special Projects.
6 The total amount shown in FY1973 is not necessarily the base for FY1975 funding levels since some Special Projects were funded for 18 months andother adjustments were necessary.
7 Special Projects monies in 1975 are a portion of $10,472,000 impounded by President Nixon in 1973 and released by court order in 1975.
8 These monies are those used to fund the “transition” quarter in 1976 (July-September) when the Federal Fiscal Year changed from July-June to October-September.
9 Beginning in 1982, a single block allocation was made to each State as the MCH Block Grant.
10 This line is the State’s allocation of the $ 105 million appropriated for care of mothers and children under the 1983 Jobs Bill. It is perceived as 1983supplemental funding but was mostly used in 1984.
11 Represents the amount included in the FY2000 Appropriations as of February 2000.
12 The President’s Budget request for FY2001. Does not include Healthy Start, which is proposed for inclusion in the Title V in FY2001 ($90 million).
13 The Personal Responsibility, and Work Opportunity Reconciliation Act of 1996 created a new section, Section 510 to Title V of the SSA for providingformula grant funds to the States for Abstinence Education. This Act provided a separate appropriation of $50 million for each of the fiscal years1998-2002. This is a permanent appropriation and is counted as mandatory funding under The Budget Enforcement Act.

19361937193819391940
19411942194319441945
19461947194819491950
19511952195319541955
19561957195819591960
19611962196319641965
19661967196819691970
19711972197319741975
197619768
197719781979
Year Title V Health Constant MCH CCS EMIC Special Section Abstinenceor MCH Block Dollars Program Program Projects4 5165 EducationGrant Totals1 (per CPI)2 or MCH Sec. 51013
Block Total3
58
TABLE 18United States Title V or MCH Block Grant Allocations to Each State (showing Constant Dollars forTotal Amounts) By Program Components, FY 1936 - FY 2001: ILLINOIS
90,407 650,410 48,881 41,526210,801 1,463,896 111,087 99,714212,710 1,508,582 112,996 99,714223,681 1,609,216 123,967 99,714289,007 2,064,336 145,008 143,999
353,954 2,407,850 188,200 165,754339,708 2,084,098 184,915 154,793455,610 2,633,584 181,248 163,122 111,240
2,053,469 11,667,438 174,037 147,180 1,732,2522,588,384 14,379,911 189,585 176,112 2,222,687
2,382,989 12,220,456 178,599 138,084 2,066,306998,444 4,477,327 257,045 200,721 540,678558,523 2,317,523 237,363 212,179 108,981526,761 2,213,282 256,453 270,308444,333 1,843,705 268,206 176,127
569,577 2,190,681 315,827 253,750540,954 2,041,336 288,842 252,112531,516 1,990,697 298,993 232,523518,684 1,928,193 277,631 241,053530,800 1,980,597 282,861 247,939
631,379 2,321,246 284,801 346,578721,732 2,568,441 368,820 352,912721,813 2,497,623 373,862 347,951782,815 2,690,086 376,724 406,091810,423 2,737,916 420,259 390,164
922,168 3,084,174 433,553 488,6151,255,982 4,158,881 628,468 627,5141,335,479 4,364,310 661,961 673,5181,531,580 4,940,581 749,152 782,428 (1,291,759)1,736,526 5,512,781 860,595 875,931 0
2,262,222 6,982,167 1,133,275 1,128,947 (6,121,348)2,567,451 7,686,979 1,288,852 1,278,599 (4,019,325)2,641,199 7,589,652 1,323,810 1,317,389 (4,970,238)2,822,702 7,691,286 1,317,776 1,504,926 (6,079,630)2,845,424 7,333,567 1,326,856 1,518,568 (5,659,224)
3,170,463 7,828,304 1,624,459 1,546,004 (6,524,807)3,346,159 8,005,165 1,624,459 1,721,700 (6,634,359)3,507,2006 7,899,099 1,722,200 1,785,000 (7,534,400)3,564,200 7,229,615 1,779,600 1,784,600 (8,158,000) 0
10,620,625 19,740,939 5,817,300 1,872,600 (1,227,622)7 2,930,725
11,685,331 20,536,610 6,050,400 2,231,500 3,403,4312,921,332 5,134,151 1,512,600 557,875 850,857
11,685,331 19,282,724 6,269,000 2,649,300 2,767,03111,685,331 17,922,287 6,314,000 2,757,400 2,613,93111,685,331 16,095,497 6,487,000 2,912,000 2,286,331
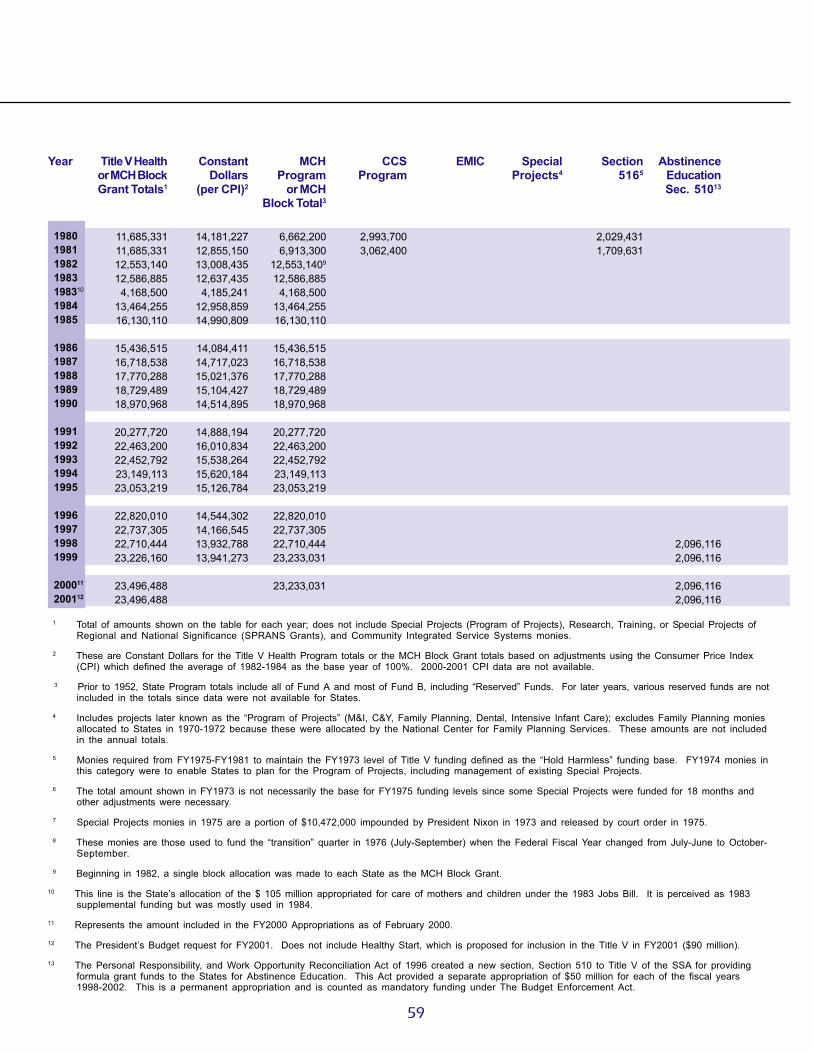
1980198119821983198310
19841985
19861987198819891990
19911992199319941995
1996199719981999
200011
200112
Year Title V Health Constant MCH CCS EMIC Special Section Abstinenceor MCH Block Dollars Program Program Projects4 5165 EducationGrant Totals1 (per CPI)2 or MCH Sec. 51013
Block Total3
59
11,685,331 14,181,227 6,662,200 2,993,700 2,029,43111,685,331 12,855,150 6,913,300 3,062,400 1,709,63112,553,140 13,008,435 12,553,1409
12,586,885 12,637,435 12,586,8854,168,500 4,185,241 4,168,500
13,464,255 12,958,859 13,464,25516,130,110 14,990,809 16,130,110
15,436,515 14,084,411 15,436,51516,718,538 14,717,023 16,718,53817,770,288 15,021,376 17,770,28818,729,489 15,104,427 18,729,48918,970,968 14,514,895 18,970,968
20,277,720 14,888,194 20,277,72022,463,200 16,010,834 22,463,20022,452,792 15,538,264 22,452,79223,149,113 15,620,184 23,149,11323,053,219 15,126,784 23,053,219
22,820,010 14,544,302 22,820,01022,737,305 14,166,545 22,737,30522,710,444 13,932,788 22,710,444 2,096,11623,226,160 13,941,273 23,233,031 2,096,116
23,496,488 23,233,031 2,096,11623,496,488 2,096,116
1 Total of amounts shown on the table for each year; does not include Special Projects (Program of Projects), Research, Training, or Special Projects ofRegional and National Significance (SPRANS Grants), and Community Integrated Service Systems monies.
2 These are Constant Dollars for the Title V Health Program totals or the MCH Block Grant totals based on adjustments using the Consumer Price Index(CPI) which defined the average of 1982-1984 as the base year of 100%. 2000-2001 CPI data are not available.
3 Prior to 1952, State Program totals include all of Fund A and most of Fund B, including “Reserved” Funds. For later years, various reserved funds are notincluded in the totals since data were not available for States.
4 Includes projects later known as the “Program of Projects” (M&I, C&Y, Family Planning, Dental, Intensive Infant Care); excludes Family Planning moniesallocated to States in 1970-1972 because these were allocated by the National Center for Family Planning Services. These amounts are not includedin the annual totals.
5 Monies required from FY1975-FY1981 to maintain the FY1973 level of Title V funding defined as the “Hold Harmless” funding base. FY1974 monies inthis category were to enable States to plan for the Program of Projects, including management of existing Special Projects.
6 The total amount shown in FY1973 is not necessarily the base for FY1975 funding levels since some Special Projects were funded for 18 months andother adjustments were necessary.
7 Special Projects monies in 1975 are a portion of $10,472,000 impounded by President Nixon in 1973 and released by court order in 1975.
8 These monies are those used to fund the “transition” quarter in 1976 (July-September) when the Federal Fiscal Year changed from July-June to October-September.
9 Beginning in 1982, a single block allocation was made to each State as the MCH Block Grant.
10 This line is the State’s allocation of the $ 105 million appropriated for care of mothers and children under the 1983 Jobs Bill. It is perceived as 1983supplemental funding but was mostly used in 1984.
11 Represents the amount included in the FY2000 Appropriations as of February 2000.
12 The President’s Budget request for FY2001. Does not include Healthy Start, which is proposed for inclusion in the Title V in FY2001 ($90 million).
13 The Personal Responsibility, and Work Opportunity Reconciliation Act of 1996 created a new section, Section 510 to Title V of the SSA for providingformula grant funds to the States for Abstinence Education. This Act provided a separate appropriation of $50 million for each of the fiscal years1998-2002. This is a permanent appropriation and is counted as mandatory funding under The Budget Enforcement Act.
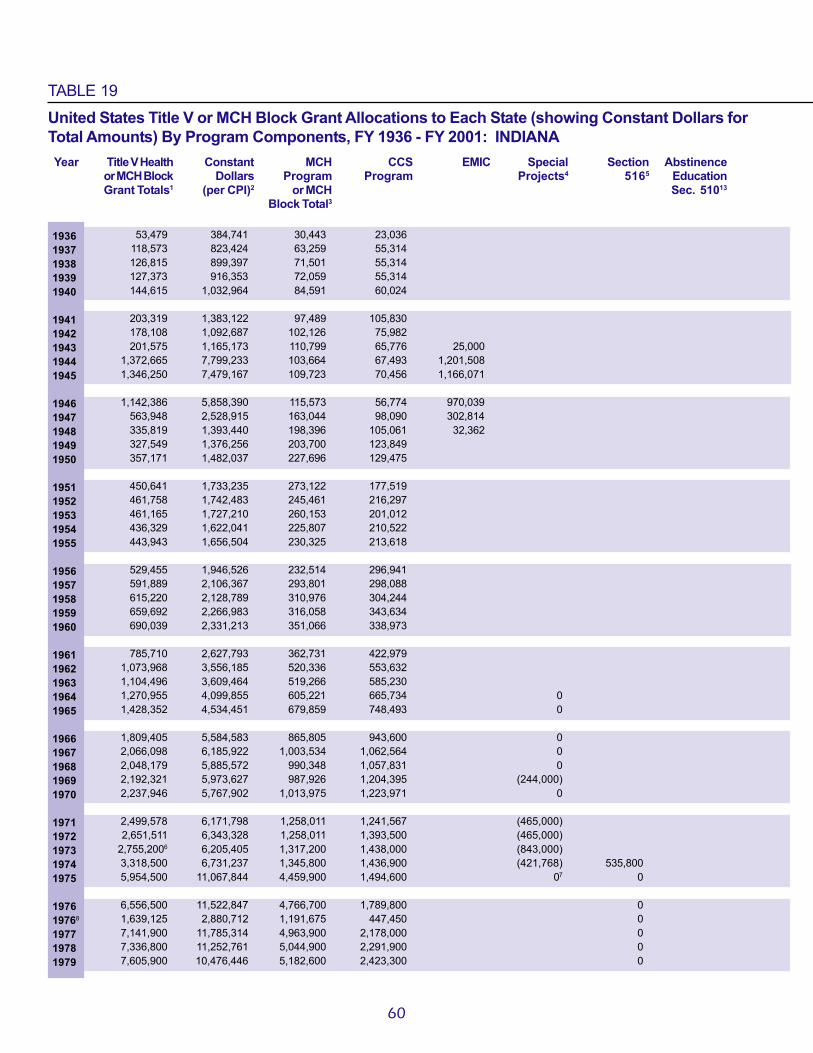
19361937193819391940
19411942194319441945
19461947194819491950
19511952195319541955
19561957195819591960
19611962196319641965
19661967196819691970
19711972197319741975
197619768
197719781979
Year Title V Health Constant MCH CCS EMIC Special Section Abstinenceor MCH Block Dollars Program Program Projects4 5165 EducationGrant Totals1 (per CPI)2 or MCH Sec. 51013
Block Total3
60
TABLE 19United States Title V or MCH Block Grant Allocations to Each State (showing Constant Dollars forTotal Amounts) By Program Components, FY 1936 - FY 2001: INDIANA
53,479 384,741 30,443 23,036118,573 823,424 63,259 55,314126,815 899,397 71,501 55,314127,373 916,353 72,059 55,314144,615 1,032,964 84,591 60,024
203,319 1,383,122 97,489 105,830178,108 1,092,687 102,126 75,982201,575 1,165,173 110,799 65,776 25,000
1,372,665 7,799,233 103,664 67,493 1,201,5081,346,250 7,479,167 109,723 70,456 1,166,071
1,142,386 5,858,390 115,573 56,774 970,039563,948 2,528,915 163,044 98,090 302,814335,819 1,393,440 198,396 105,061 32,362327,549 1,376,256 203,700 123,849357,171 1,482,037 227,696 129,475
450,641 1,733,235 273,122 177,519461,758 1,742,483 245,461 216,297461,165 1,727,210 260,153 201,012436,329 1,622,041 225,807 210,522443,943 1,656,504 230,325 213,618
529,455 1,946,526 232,514 296,941591,889 2,106,367 293,801 298,088615,220 2,128,789 310,976 304,244659,692 2,266,983 316,058 343,634690,039 2,331,213 351,066 338,973
785,710 2,627,793 362,731 422,9791,073,968 3,556,185 520,336 553,6321,104,496 3,609,464 519,266 585,2301,270,955 4,099,855 605,221 665,734 01,428,352 4,534,451 679,859 748,493 0
1,809,405 5,584,583 865,805 943,600 02,066,098 6,185,922 1,003,534 1,062,564 02,048,179 5,885,572 990,348 1,057,831 02,192,321 5,973,627 987,926 1,204,395 (244,000)2,237,946 5,767,902 1,013,975 1,223,971 0
2,499,578 6,171,798 1,258,011 1,241,567 (465,000)2,651,511 6,343,328 1,258,011 1,393,500 (465,000)
2,755,2006 6,205,405 1,317,200 1,438,000 (843,000)3,318,500 6,731,237 1,345,800 1,436,900 (421,768) 535,8005,954,500 11,067,844 4,459,900 1,494,600 07 0
6,556,500 11,522,847 4,766,700 1,789,800 01,639,125 2,880,712 1,191,675 447,450 07,141,900 11,785,314 4,963,900 2,178,000 07,336,800 11,252,761 5,044,900 2,291,900 07,605,900 10,476,446 5,182,600 2,423,300 0
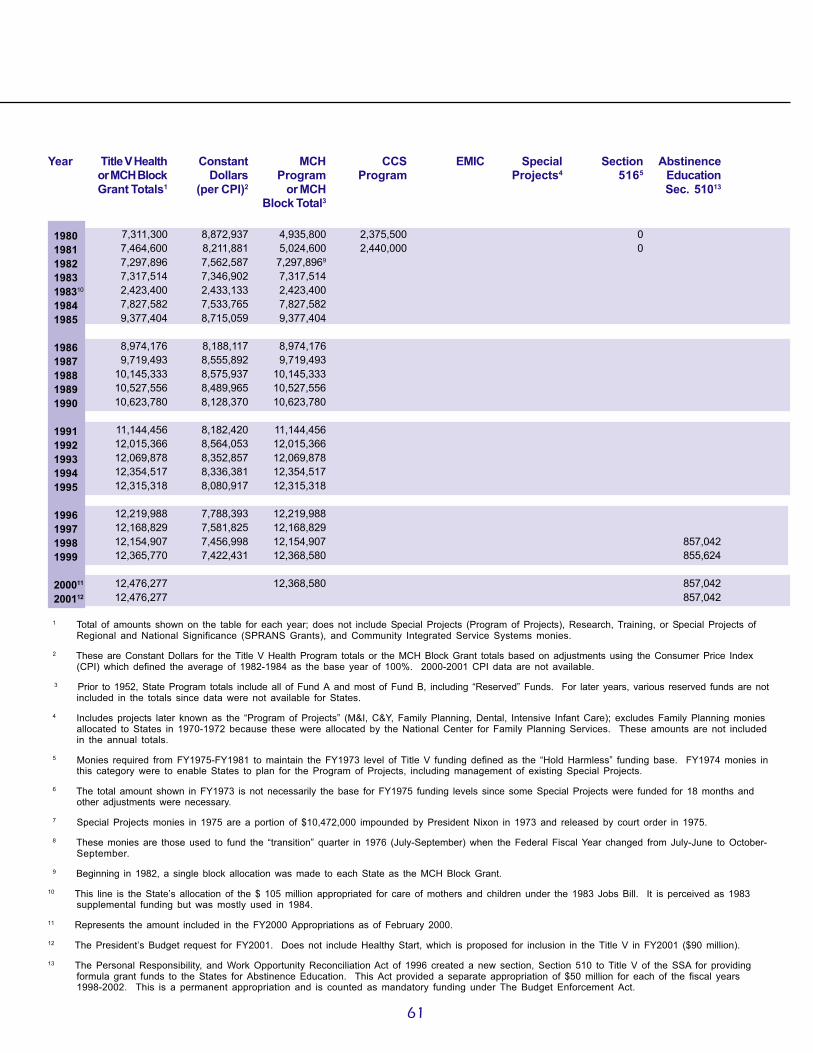
1980198119821983198310
19841985
19861987198819891990
19911992199319941995
1996199719981999
200011
200112
Year Title V Health Constant MCH CCS EMIC Special Section Abstinenceor MCH Block Dollars Program Program Projects4 5165 EducationGrant Totals1 (per CPI)2 or MCH Sec. 51013
Block Total3
61
7,311,300 8,872,937 4,935,800 2,375,500 07,464,600 8,211,881 5,024,600 2,440,000 07,297,896 7,562,587 7,297,8969
7,317,514 7,346,902 7,317,5142,423,400 2,433,133 2,423,4007,827,582 7,533,765 7,827,5829,377,404 8,715,059 9,377,404
8,974,176 8,188,117 8,974,1769,719,493 8,555,892 9,719,493
10,145,333 8,575,937 10,145,33310,527,556 8,489,965 10,527,55610,623,780 8,128,370 10,623,780
11,144,456 8,182,420 11,144,45612,015,366 8,564,053 12,015,36612,069,878 8,352,857 12,069,87812,354,517 8,336,381 12,354,51712,315,318 8,080,917 12,315,318
12,219,988 7,788,393 12,219,98812,168,829 7,581,825 12,168,82912,154,907 7,456,998 12,154,907 857,04212,365,770 7,422,431 12,368,580 855,624
12,476,277 12,368,580 857,04212,476,277 857,042
1 Total of amounts shown on the table for each year; does not include Special Projects (Program of Projects), Research, Training, or Special Projects ofRegional and National Significance (SPRANS Grants), and Community Integrated Service Systems monies.
2 These are Constant Dollars for the Title V Health Program totals or the MCH Block Grant totals based on adjustments using the Consumer Price Index(CPI) which defined the average of 1982-1984 as the base year of 100%. 2000-2001 CPI data are not available.
3 Prior to 1952, State Program totals include all of Fund A and most of Fund B, including “Reserved” Funds. For later years, various reserved funds are notincluded in the totals since data were not available for States.
4 Includes projects later known as the “Program of Projects” (M&I, C&Y, Family Planning, Dental, Intensive Infant Care); excludes Family Planning moniesallocated to States in 1970-1972 because these were allocated by the National Center for Family Planning Services. These amounts are not includedin the annual totals.
5 Monies required from FY1975-FY1981 to maintain the FY1973 level of Title V funding defined as the “Hold Harmless” funding base. FY1974 monies inthis category were to enable States to plan for the Program of Projects, including management of existing Special Projects.
6 The total amount shown in FY1973 is not necessarily the base for FY1975 funding levels since some Special Projects were funded for 18 months andother adjustments were necessary.
7 Special Projects monies in 1975 are a portion of $10,472,000 impounded by President Nixon in 1973 and released by court order in 1975.
8 These monies are those used to fund the “transition” quarter in 1976 (July-September) when the Federal Fiscal Year changed from July-June to October-September.
9 Beginning in 1982, a single block allocation was made to each State as the MCH Block Grant.
10 This line is the State’s allocation of the $ 105 million appropriated for care of mothers and children under the 1983 Jobs Bill. It is perceived as 1983supplemental funding but was mostly used in 1984.
11 Represents the amount included in the FY2000 Appropriations as of February 2000.
12 The President’s Budget request for FY2001. Does not include Healthy Start, which is proposed for inclusion in the Title V in FY2001 ($90 million).
13 The Personal Responsibility, and Work Opportunity Reconciliation Act of 1996 created a new section, Section 510 to Title V of the SSA for providingformula grant funds to the States for Abstinence Education. This Act provided a separate appropriation of $50 million for each of the fiscal years1998-2002. This is a permanent appropriation and is counted as mandatory funding under The Budget Enforcement Act.
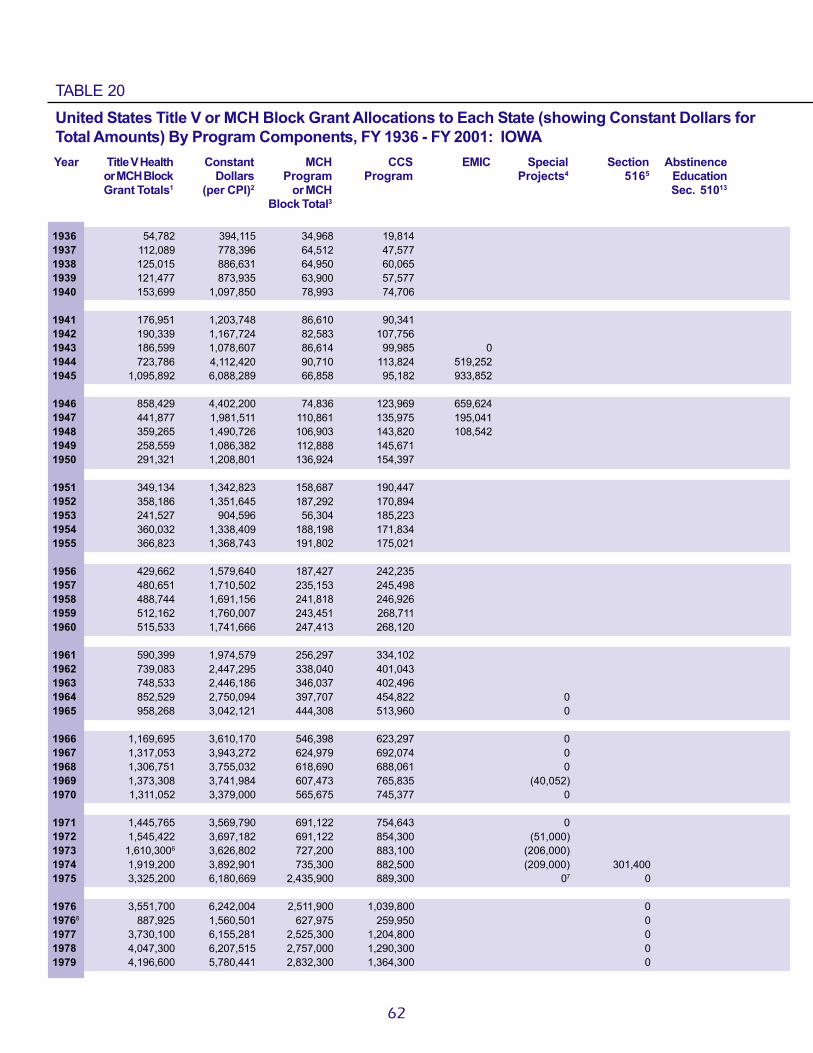
19361937193819391940
19411942194319441945
19461947194819491950
19511952195319541955
19561957195819591960
19611962196319641965
19661967196819691970
19711972197319741975
197619768
197719781979
Year Title V Health Constant MCH CCS EMIC Special Section Abstinenceor MCH Block Dollars Program Program Projects4 5165 EducationGrant Totals1 (per CPI)2 or MCH Sec. 51013
Block Total3
62
TABLE 20United States Title V or MCH Block Grant Allocations to Each State (showing Constant Dollars forTotal Amounts) By Program Components, FY 1936 - FY 2001: IOWA
54,782 394,115 34,968 19,814112,089 778,396 64,512 47,577125,015 886,631 64,950 60,065121,477 873,935 63,900 57,577153,699 1,097,850 78,993 74,706
176,951 1,203,748 86,610 90,341190,339 1,167,724 82,583 107,756186,599 1,078,607 86,614 99,985 0723,786 4,112,420 90,710 113,824 519,252
1,095,892 6,088,289 66,858 95,182 933,852
858,429 4,402,200 74,836 123,969 659,624441,877 1,981,511 110,861 135,975 195,041359,265 1,490,726 106,903 143,820 108,542258,559 1,086,382 112,888 145,671291,321 1,208,801 136,924 154,397
349,134 1,342,823 158,687 190,447358,186 1,351,645 187,292 170,894241,527 904,596 56,304 185,223360,032 1,338,409 188,198 171,834366,823 1,368,743 191,802 175,021
429,662 1,579,640 187,427 242,235480,651 1,710,502 235,153 245,498488,744 1,691,156 241,818 246,926512,162 1,760,007 243,451 268,711515,533 1,741,666 247,413 268,120
590,399 1,974,579 256,297 334,102739,083 2,447,295 338,040 401,043748,533 2,446,186 346,037 402,496852,529 2,750,094 397,707 454,822 0958,268 3,042,121 444,308 513,960 0
1,169,695 3,610,170 546,398 623,297 01,317,053 3,943,272 624,979 692,074 01,306,751 3,755,032 618,690 688,061 01,373,308 3,741,984 607,473 765,835 (40,052)1,311,052 3,379,000 565,675 745,377 0
1,445,765 3,569,790 691,122 754,643 01,545,422 3,697,182 691,122 854,300 (51,000)
1,610,3006 3,626,802 727,200 883,100 (206,000)1,919,200 3,892,901 735,300 882,500 (209,000) 301,4003,325,200 6,180,669 2,435,900 889,300 07 0
3,551,700 6,242,004 2,511,900 1,039,800 0887,925 1,560,501 627,975 259,950 0
3,730,100 6,155,281 2,525,300 1,204,800 04,047,300 6,207,515 2,757,000 1,290,300 04,196,600 5,780,441 2,832,300 1,364,300 0

1980198119821983198310
19841985
19861987198819891990
19911992199319941995
1996199719981999
200011
200112
Year Title V Health Constant MCH CCS EMIC Special Section Abstinenceor MCH Block Dollars Program Program Projects4 5165 EducationGrant Totals1 (per CPI)2 or MCH Sec. 51013
Block Total3
63
4,295,200 5,212,621 2,937,900 1,357,300 04,419,900 4,862,376 3,030,500 1,389,400 04,249,728 4,403,863 4,249,7289
4,261,152 4,278,265 4,261,1521,411,200 1,416,867 1,411,2004,558,176 4,387,080 4,558,1765,460,672 5,074,974 5,460,672
5,225,863 4,768,123 5,225,8635,659,878 4,982,287 5,659,8785,871,777 4,963,463 5,871,7776,060,256 4,887,303 6,060,2566,107,706 4,673,073 6,107,706
6,364,447 4,672,869 6,364,4476,793,917 4,842,421 6,793,9176,827,338 4,724,801 6,827,3386,968,498 4,702,090 6,968,4986,949,058 4,559,749 6,949,058
6,901,781 4,398,841 6,901,7816,871,361 4,281,222 6,871,3616,863,600 4,210,798 6,863,600 424,9086,968,187 4,182,585 6,969,580 424,908
7,022,990 6,969,580 424,9087,022,990 424,908
1 Total of amounts shown on the table for each year; does not include Special Projects (Program of Projects), Research, Training, or Special Projects ofRegional and National Significance (SPRANS Grants), and Community Integrated Service Systems monies.
2 These are Constant Dollars for the Title V Health Program totals or the MCH Block Grant totals based on adjustments using the Consumer Price Index(CPI) which defined the average of 1982-1984 as the base year of 100%. 2000-2001 CPI data are not available.
3 Prior to 1952, State Program totals include all of Fund A and most of Fund B, including “Reserved” Funds. For later years, various reserved funds are notincluded in the totals since data were not available for States.
4 Includes projects later known as the “Program of Projects” (M&I, C&Y, Family Planning, Dental, Intensive Infant Care); excludes Family Planning moniesallocated to States in 1970-1972 because these were allocated by the National Center for Family Planning Services. These amounts are not includedin the annual totals.
5 Monies required from FY1975-FY1981 to maintain the FY1973 level of Title V funding defined as the “Hold Harmless” funding base. FY1974 monies inthis category were to enable States to plan for the Program of Projects, including management of existing Special Projects.
6 The total amount shown in FY1973 is not necessarily the base for FY1975 funding levels since some Special Projects were funded for 18 months andother adjustments were necessary.
7 Special Projects monies in 1975 are a portion of $10,472,000 impounded by President Nixon in 1973 and released by court order in 1975.
8 These monies are those used to fund the “transition” quarter in 1976 (July-September) when the Federal Fiscal Year changed from July-June to October-September.
9 Beginning in 1982, a single block allocation was made to each State as the MCH Block Grant.
10 This line is the State’s allocation of the $ 105 million appropriated for care of mothers and children under the 1983 Jobs Bill. It is perceived as 1983supplemental funding but was mostly used in 1984.
11 Represents the amount included in the FY2000 Appropriations as of February 2000.
12 The President’s Budget request for FY2001. Does not include Healthy Start, which is proposed for inclusion in the Title V in FY2001 ($90 million).
13 The Personal Responsibility, and Work Opportunity Reconciliation Act of 1996 created a new section, Section 510 to Title V of the SSA for providingformula grant funds to the States for Abstinence Education. This Act provided a separate appropriation of $50 million for each of the fiscal years1998-2002. This is a permanent appropriation and is counted as mandatory funding under The Budget Enforcement Act.

19361937193819391940
19411942194319441945
19461947194819491950
19511952195319541955
19561957195819591960
19611962196319641965
19661967196819691970
19711972197319741975
197619768
197719781979
Year Title V Health Constant MCH CCS EMIC Special Section Abstinenceor MCH Block Dollars Program Program Projects4 5165 EducationGrant Totals1 (per CPI)2 or MCH Sec. 51013
Block Total3
64
TABLE 21United States Title V or MCH Block Grant Allocations to Each State (showing Constant Dollars forTotal Amounts) By Program Components, FY 1936 - FY 2001: KANSAS
54,713 393,619 37,447 17,26697,305 675,729 55,846 41,459
111,359 789,780 63,456 47,903110,278 793,367 68,819 41,459114,055 814,679 72,596 41,459
179,843 1,223,422 85,121 94,722137,670 844,601 82,504 55,166171,174 989,445 70,492 54,682 46,000822,847 4,675,267 90,072 46,048 686,727919,241 5,106,894 85,723 58,841 774,677
535,281 2,745,031 80,200 20,000 435,081423,536 1,899,265 206,789 39,764 176,983235,266 976,207 136,918 84,324 14,024199,208 837,008 127,552 71,656205,530 852,822 124,925 80,605
255,251 981,735 144,977 110,274254,720 961,208 131,172 123,548275,528 1,031,940 141,508 134,020249,500 927,509 128,719 120,781248,189 926,078 128,029 120,160
306,984 1,128,618 136,041 170,943335,763 1,194,886 168,455 167,308350,818 1,213,903 177,748 173,070376,036 1,292,220 185,593 190,443383,722 1,296,358 194,642 189,080
437,623 1,463,622 202,067 235,556543,870 1,800,894 257,264 286,606537,204 1,755,569 258,599 278,605600,498 1,937,090 282,771 317,727 0679,812 2,158,133 319,957 359,855 0
839,052 2,589,667 394,983 444,069 0927,090 2,775,719 433,957 493,133 (495,530)909,858 2,614,534 422,640 487,218 (307,167)958,589 2,611,959 408,121 550,468 (714,844)941,345 2,426,147 383,468 557,877 (513,858)
1,040,155 2,568,284 479,770 560,385 (605,505)1,066,070 2,550,407 479,770 586,300 (659,939)
1,097,2006 2,471,171 498,200 599,000 (995,900)1,110,500 2,252,535 483,700 598,500 (1,084,000) 28,3002,161,100 4,016,914 1,591,300 569,800 07 0
2,278,500 4,004,394 1,604,100 674,400 0569,625 1,001,098 401,025 168,600 0
2,453,300 4,048,350 1,654,800 798,500 02,677,000 4,105,828 1,833,000 844,000 02,775,200 3,822,590 1,883,100 892,100 0

1980198119821983198310
19841985
19861987198819891990
19911992199319941995
1996199719981999
200011
200112
Year Title V Health Constant MCH CCS EMIC Special Section Abstinenceor MCH Block Dollars Program Program Projects4 5165 EducationGrant Totals1 (per CPI)2 or MCH Sec. 51013
Block Total3
65
2,863,200 3,474,757 1,956,400 906,800 02,969,400 3,266,667 2,025,800 943,600 02,855,286 2,958,846 2,855,286 9/2,862,962 2,874,460 2,862,962
948,150 951,958 948,1503,062,525 2,947,570 3,062,5253,668,889 3,409,748 3,668,889
3,511,127 3,203,583 3,511,1273,802,731 3,347,474 3,802,7313,966,411 3,352,841 3,966,4114,113,186 3,317,085 4,113,1864,150,136 3,175,314 4,150,136
4,350,077 3,193,889 4,350,0774,684,511 3,338,924 4,684,5114,874,146 3,373,111 4,874,1465,004,067 3,376,563 5,004,0674,986,175 3,271,768 4,986,175
4,942,662 3,150,199 4,942,6624,923,122 3,067,366 4,923,1224,917,413 3,016,818 4,917,413 391,1855,013,648 3,009,393 5,014,930 391,185
5,064,088 5,014,930 391,1855,064,088 391,185
1 Total of amounts shown on the table for each year; does not include Special Projects (Program of Projects), Research, Training, or Special Projects ofRegional and National Significance (SPRANS Grants), and Community Integrated Service Systems monies.
2 These are Constant Dollars for the Title V Health Program totals or the MCH Block Grant totals based on adjustments using the Consumer Price Index(CPI) which defined the average of 1982-1984 as the base year of 100%. 2000-2001 CPI data are not available.
3 Prior to 1952, State Program totals include all of Fund A and most of Fund B, including “Reserved” Funds. For later years, various reserved funds are notincluded in the totals since data were not available for States.
4 Includes projects later known as the “Program of Projects” (M&I, C&Y, Family Planning, Dental, Intensive Infant Care); excludes Family Planning moniesallocated to States in 1970-1972 because these were allocated by the National Center for Family Planning Services. These amounts are not includedin the annual totals.
5 Monies required from FY1975-FY1981 to maintain the FY1973 level of Title V funding defined as the “Hold Harmless” funding base. FY1974 monies inthis category were to enable States to plan for the Program of Projects, including management of existing Special Projects.
6 The total amount shown in FY1973 is not necessarily the base for FY1975 funding levels since some Special Projects were funded for 18 months andother adjustments were necessary.
7 Special Projects monies in 1975 are a portion of $10,472,000 impounded by President Nixon in 1973 and released by court order in 1975.
8 These monies are those used to fund the “transition” quarter in 1976 (July-September) when the Federal Fiscal Year changed from July-June to October-September.
9 Beginning in 1982, a single block allocation was made to each State as the MCH Block Grant.
10 This line is the State’s allocation of the $ 105 million appropriated for care of mothers and children under the 1983 Jobs Bill. It is perceived as 1983supplemental funding but was mostly used in 1984.
11 Represents the amount included in the FY2000 Appropriations as of February 2000.
12 The President’s Budget request for FY2001. Does not include Healthy Start, which is proposed for inclusion in the Title V in FY2001 ($90 million).
13 The Personal Responsibility, and Work Opportunity Reconciliation Act of 1996 created a new section, Section 510 to Title V of the SSA for providingformula grant funds to the States for Abstinence Education. This Act provided a separate appropriation of $50 million for each of the fiscal years1998-2002. This is a permanent appropriation and is counted as mandatory funding under The Budget Enforcement Act.

19361937193819391940
19411942194319441945
19461947194819491950
19511952195319541955
19561957195819591960
19611962196319641965
19661967196819691970
19711972197319741975
197619768
197719781979
Year Title V Health Constant MCH CCS EMIC Special Section Abstinenceor MCH Block Dollars Program Program Projects4 5165 EducationGrant Totals1 (per CPI)2 or MCH Sec. 51013
Block Total3
66
TABLE 22United States Title V or MCH Block Grant Allocations to Each State (showing Constant Dollars forTotal Amounts) By Program Components, FY 1936 - FY 2001: KENTUCKY
63,771 458,784 36,251 27,520169,838 1,179,431 87,527 82,311178,752 1,267,745 96,758 81,994186,155 1,339,245 101,155 85,000186,488 1,332,057 99,357 87,131
237,077 1,612,769 132,224 104,853288,803 1,771,798 173,476 115,327301,700 1,743,931 151,705 97,995 52,000727,892 4,135,750 174,510 83,317 470,065
1,001,913 5,566,183 157,930 121,549 722,434
816,607 4,187,728 160,132 157,077 499,398718,390 3,221,480 327,982 231,740 158,668630,485 2,616,120 360,766 239,913 29,806626,337 2,631,668 366,094 260,243598,998 2,485,469 364,067 234,931
735,750 2,829,808 412,483 323,267629,544 2,375,638 325,758 303,786694,877 2,602,536 354,804 340,073611,986 2,275,041 309,604 302,382589,104 2,198,149 298,968 290,136
687,732 2,528,426 284,453 403,279726,580 2,585,694 334,347 392,233740,404 2,561,952 353,842 386,562739,588 2,541,540 344,972 394,616756,987 2,557,389 357,824 399,163
867,009 2,899,696 369,789 497,2201,155,425 3,825,911 533,441 621,9841,115,283 3,644,716 524,605 590,6781,279,498 4,127,413 606,675 672,823 01,445,326 4,588,337 689,486 755,840 (393,348)
1,779,135 5,491,157 847,415 931,720 02,024,898 6,062,569 982,379 1,042,519 (467,913)2,016,867 5,795,595 978,224 1,038,643 (993,278)2,099,148 5,719,749 947,140 1,152,008 (846,168)2,074,119 5,345,668 910,947 1,163,172 (812,933)
2,312,685 5,710,333 1,149,085 1,163,600 (1,007,652)2,384,685 5,704,988 1,149,085 1,235,600 (1,045,788)2,457,0006 5,533,784 1,167,300 1,289,700 (1,045,800)2,863,300 5,807,911 1,172,400 1,288,500 (977,000) 402,4005,133,700 9,542,193 3,912,000 1,221,700 07 0
5,957,000 10,469,244 4,493,000 1,464,000 01,489,250 2,617,311 1,123,250 366,000 06,378,700 10,525,908 4,618,800 1,759,900 06,633,900 10,174,693 4,778,000 1,855,900 06,871,200 9,464,463 4,908,200 1,963,000 0
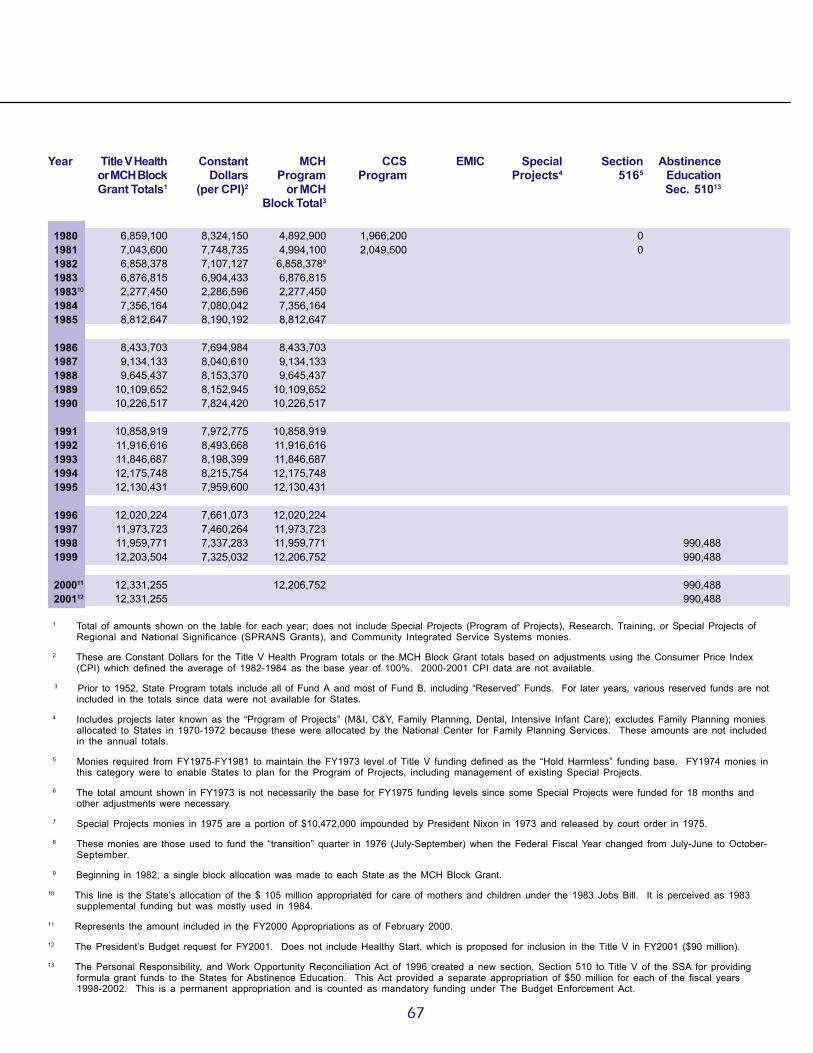
1980198119821983198310
19841985
19861987198819891990
19911992199319941995
1996199719981999
200011
200112
Year Title V Health Constant MCH CCS EMIC Special Section Abstinenceor MCH Block Dollars Program Program Projects4 5165 EducationGrant Totals1 (per CPI)2 or MCH Sec. 51013
Block Total3
67
6,859,100 8,324,150 4,892,900 1,966,200 07,043,600 7,748,735 4,994,100 2,049,500 06,858,378 7,107,127 6,858,3789
6,876,815 6,904,433 6,876,8152,277,450 2,286,596 2,277,4507,356,164 7,080,042 7,356,1648,812,647 8,190,192 8,812,647
8,433,703 7,694,984 8,433,7039,134,133 8,040,610 9,134,1339,645,437 8,153,370 9,645,437
10,109,652 8,152,945 10,109,65210,226,517 7,824,420 10,226,517
10,858,919 7,972,775 10,858,91911,916,616 8,493,668 11,916,61611,846,687 8,198,399 11,846,68712,175,748 8,215,754 12,175,74812,130,431 7,959,600 12,130,431
12,020,224 7,661,073 12,020,22411,973,723 7,460,264 11,973,72311,959,771 7,337,283 11,959,771 990,48812,203,504 7,325,032 12,206,752 990,488
12,331,255 12,206,752 990,48812,331,255 990,488
1 Total of amounts shown on the table for each year; does not include Special Projects (Program of Projects), Research, Training, or Special Projects ofRegional and National Significance (SPRANS Grants), and Community Integrated Service Systems monies.
2 These are Constant Dollars for the Title V Health Program totals or the MCH Block Grant totals based on adjustments using the Consumer Price Index(CPI) which defined the average of 1982-1984 as the base year of 100%. 2000-2001 CPI data are not available.
3 Prior to 1952, State Program totals include all of Fund A and most of Fund B, including “Reserved” Funds. For later years, various reserved funds are notincluded in the totals since data were not available for States.
4 Includes projects later known as the “Program of Projects” (M&I, C&Y, Family Planning, Dental, Intensive Infant Care); excludes Family Planning moniesallocated to States in 1970-1972 because these were allocated by the National Center for Family Planning Services. These amounts are not includedin the annual totals.
5 Monies required from FY1975-FY1981 to maintain the FY1973 level of Title V funding defined as the “Hold Harmless” funding base. FY1974 monies inthis category were to enable States to plan for the Program of Projects, including management of existing Special Projects.
6 The total amount shown in FY1973 is not necessarily the base for FY1975 funding levels since some Special Projects were funded for 18 months andother adjustments were necessary.
7 Special Projects monies in 1975 are a portion of $10,472,000 impounded by President Nixon in 1973 and released by court order in 1975.
8 These monies are those used to fund the “transition” quarter in 1976 (July-September) when the Federal Fiscal Year changed from July-June to October-September.
9 Beginning in 1982, a single block allocation was made to each State as the MCH Block Grant.
10 This line is the State’s allocation of the $ 105 million appropriated for care of mothers and children under the 1983 Jobs Bill. It is perceived as 1983supplemental funding but was mostly used in 1984.
11 Represents the amount included in the FY2000 Appropriations as of February 2000.
12 The President’s Budget request for FY2001. Does not include Healthy Start, which is proposed for inclusion in the Title V in FY2001 ($90 million).
13 The Personal Responsibility, and Work Opportunity Reconciliation Act of 1996 created a new section, Section 510 to Title V of the SSA for providingformula grant funds to the States for Abstinence Education. This Act provided a separate appropriation of $50 million for each of the fiscal years1998-2002. This is a permanent appropriation and is counted as mandatory funding under The Budget Enforcement Act.

19361937193819391940
19411942194319441945
19461947194819491950
19511952195319541955
19561957195819591960
19611962196319641965
19661967196819691970
19711972197319741975
197619768
197719781979
Year Title V Health Constant MCH CCS EMIC Special Section Abstinenceor MCH Block Dollars Program Program Projects4 5165 EducationGrant Totals1 (per CPI)2 or MCH Sec. 51013
Block Total3
68
TABLE 23United States Title V or MCH Block Grant Allocations to Each State (showing Constant Dollars forTotal Amounts) By Program Components, FY 1936 - FY 2001: LOUISIANA
51,322 369,223 31,485 19,837136,929 950,896 89,297 47,632140,821 998,730 93,188 47,633146,217 1,051,921 98,585 47,632162,474 1,160,529 114,842 47,632
185,834 1,264,177 148,386 37,448194,564 1,193,644 156,214 38,350208,852 1,207,237 148,471 60,381 0555,282 3,155,011 147,566 82,185 325,531909,521 5,052,894 131,155 57,980 720,386
732,810 3,758,000 131,345 81,650 519,815694,661 3,115,072 399,860 125,969 168,832471,839 1,957,838 273,183 175,709 22,947534,490 2,245,756 346,916 187,574493,154 2,046,282 339,830 153,324
587,021 2,257,773 364,254 222,767496,598 1,873,955 269,163 227,435543,324 2,034,921 287,555 255,769485,254 1,803,918 257,245 228,009494,530 1,845,261 259,423 235,107
589,755 2,168,217 255,867 333,888657,301 2,339,149 328,336 328,965665,457 2,302,619 337,070 328,387676,299 2,324,052 332,706 343,593707,845 2,391,368 360,029 347,816
805,505 2,693,997 372,014 433,4911,092,951 3,619,043 536,973 555,9781,077,928 3,522,641 534,935 542,9931,262,350 4,072,097 636,901 625,449 01,444,830 4,586,762 734,946 709,884 0
1,874,026 5,784,031 946,787 927,239 02,165,074 6,482,257 1,110,642 1,054,432 02,138,008 6,143,701 1,091,664 1,046,344 02,270,066 6,185,466 1,083,393 1,186,673 (596,539)2,283,532 5,885,392 1,076,825 1,206,707 0
2,555,221 6,309,188 1,336,337 1,218,884 02,593,237 6,203,916 1,336,337 1,256,900 (70,000)2,674,7006 6,024,099 1,366,900 1,307,800 (2,478,400)2,771,300 5,621,298 1,321,000 1,306,800 (1,428,491) 143,5005,713,300 10,619,517 4,397,800 1,315,500 07 0
6,266,200 11,012,654 4,687,500 1,578,700 01,566,550 2,753,163 1,171,875 394,675 06,730,300 11,106,106 4,852,200 1,878,100 06,987,500 10,717,025 5,041,000 1,946,500 07,237,100 9,968,457 5,178,600 2,058,500 0

1980198119821983198310
19841985
19861987198819891990
19911992199319941995
1996199719981999
200011
200112
Year Title V Health Constant MCH CCS EMIC Special Section Abstinenceor MCH Block Dollars Program Program Projects4 5165 EducationGrant Totals1 (per CPI)2 or MCH Sec. 51013
Block Total3
69
7,409,000 8,991,505 5,306,300 2,102,700 07,628,800 8,392,519 5,455,900 2,172,900 07,421,214 7,690,377 7,421,2149
7,441,164 7,471,048 7,441,1642,464,350 2,474,247 2,464,3507,959,851 7,661,069 7,959,8519,535,861 8,862,324 9,535,861
9,125,819 8,326,477 9,125,8199,883,730 8,700,467 9,883,730
10,562,267 8,928,374 10,562,26711,182,974 9,018,527 11,182,97411,339,236 8,675,774 11,339,236
12,184,860 8,946,300 12,184,86013,599,089 9,692,865 13,599,08914,329,460 9,916,581 14,329,46014,870,143 10,033,835 14,870,14314,795,682 9,708,453 14,795,682
14,614,599 9,314,595 14,614,59914,569,008 9,077,264 14,569,00814,551,311 8,927,185 14,551,311 1,627,85014,951,702 8,974,611 14,957,038 1,627,850
15,161,605 14,957,038 1,627,85015,161,605 1,627,850
1 Total of amounts shown on the table for each year; does not include Special Projects (Program of Projects), Research, Training, or Special Projects ofRegional and National Significance (SPRANS Grants), and Community Integrated Service Systems monies.
2 These are Constant Dollars for the Title V Health Program totals or the MCH Block Grant totals based on adjustments using the Consumer Price Index(CPI) which defined the average of 1982-1984 as the base year of 100%. 2000-2001 CPI data are not available.
3 Prior to 1952, State Program totals include all of Fund A and most of Fund B, including “Reserved” Funds. For later years, various reserved funds are notincluded in the totals since data were not available for States.
4 Includes projects later known as the “Program of Projects” (M&I, C&Y, Family Planning, Dental, Intensive Infant Care); excludes Family Planning moniesallocated to States in 1970-1972 because these were allocated by the National Center for Family Planning Services. These amounts are not includedin the annual totals.
5 Monies required from FY1975-FY1981 to maintain the FY1973 level of Title V funding defined as the “Hold Harmless” funding base. FY1974 monies inthis category were to enable States to plan for the Program of Projects, including management of existing Special Projects.
6 The total amount shown in FY1973 is not necessarily the base for FY1975 funding levels since some Special Projects were funded for 18 months andother adjustments were necessary.
7 Special Projects monies in 1975 are a portion of $10,472,000 impounded by President Nixon in 1973 and released by court order in 1975.
8 These monies are those used to fund the “transition” quarter in 1976 (July-September) when the Federal Fiscal Year changed from July-June to October-September.
9 Beginning in 1982, a single block allocation was made to each State as the MCH Block Grant.
10 This line is the State’s allocation of the $ 105 million appropriated for care of mothers and children under the 1983 Jobs Bill. It is perceived as 1983supplemental funding but was mostly used in 1984.
11 Represents the amount included in the FY2000 Appropriations as of February 2000.
12 The President’s Budget request for FY2001. Does not include Healthy Start, which is proposed for inclusion in the Title V in FY2001 ($90 million).
13 The Personal Responsibility, and Work Opportunity Reconciliation Act of 1996 created a new section, Section 510 to Title V of the SSA for providingformula grant funds to the States for Abstinence Education. This Act provided a separate appropriation of $50 million for each of the fiscal years1998-2002. This is a permanent appropriation and is counted as mandatory funding under The Budget Enforcement Act.

19361937193819391940
19411942194319441945
19461947194819491950
19511952195319541955
19561957195819591960
19611962196319641965
19661967196819691970
19711972197319741975
197619768
197719781979
Year Title V Health Constant MCH CCS EMIC Special Section Abstinenceor MCH Block Dollars Program Program Projects4 5165 EducationGrant Totals1 (per CPI)2 or MCH Sec. 51013
Block Total3
70
TABLE 24United States Title V or MCH Block Grant Allocations to Each State (showing Constant Dollars forTotal Amounts) By Program Components, FY 1936 - FY 2001: MAINE
31,840 229,065 19,783 12,05784,241 585,007 50,536 33,70583,984 595,631 51,407 32,57778,572 565,266 45,691 32,881
100,066 714,757 68,582 31,484
117,588 799,918 77,710 39,87884,206 516,601 39,904 44,302
128,085 740,376 65,459 41,826 20,800263,391 1,496,540 70,445 41,172 151,774380,932 2,116,289 64,536 39,193 277,203
331,509 1,700,046 66,397 34,953 230,159270,530 1,213,139 133,063 81,581 55,886162,032 672,332 94,198 57,151 10,683164,044 689,261 95,274 68,770156,670 650,083 87,420 69,250
196,891 757,273 99,481 97,410179,243 676,389 93,586 85,657182,770 684,532 94,235 88,535172,173 640,048 89,470 82,703170,124 634,791 88,567 81,557
193,180 710,221 88,274 104,906223,697 796,075 115,136 108,561226,275 782,958 117,830 108,445232,548 799,134 117,392 115,156229,426 775,088 118,868 110,558
266,183 890,244 127,786 138,397307,846 1,019,358 157,155 150,691310,695 1,015,343 152,581 158,114377,130 1,216,548 194,483 182,647 0428,251 1,359,527 221,439 206,812 0
530,486 1,637,302 277,551 252,935 0571,953 1,712,434 291,490 280,463 (63,555)576,091 1,655,434 294,048 282,043 (25,446)602,829 1,642,586 293,682 309,147 (103,687)594,118 1,531,232 282,260 311,858 (92,000)
640,216 1,580,780 330,076 310,140 (52,000)669,076 1,600,660 330,076 339,000 (137,965)
701,6006 1,580,180 341,200 360,400 (138,000)849,000 1,722,110 343,900 360,200 (296,000) 144,900
1,518,300 2,822,119 1,138,900 379,400 07 0
1,763,000 3,098,418 1,310,200 452,800 0440,750 774,605 327,550 113,200 0
1,875,000 3,094,059 1,327,800 547,200 01,936,700 2,970,399 1,344,200 592,500 02,007,200 2,764,738 1,380,800 626,400 0

1980198119821983198310
19841985
19861987198819891990
19911992199319941995
1996199719981999
200011
200112
Year Title V Health Constant MCH CCS EMIC Special Section Abstinenceor MCH Block Dollars Program Program Projects4 5165 EducationGrant Totals1 (per CPI)2 or MCH Sec. 51013
Block Total3
71
2,003,900 2,431,917 1,375,100 628,800 02,075,400 2,283,168 1,420,600 654,800 02,222,886 2,303,509 2,222,8869
2,228,862 2,237,813 2,228,862738,150 741,114 738,150
2,384,225 2,294,731 2,384,2252,856,289 2,654,544 2,856,289
2,733,469 2,494,041 2,733,4692,960,487 2,606,063 2,960,4873,073,686 2,598,213 3,073,6863,174,505 2,560,085 3,174,5053,199,887 2,448,269 3,199,887
3,337,221 2,450,236 3,337,2213,566,947 2,542,371 3,566,9473,435,444 2,377,470 3,435,4443,492,695 2,356,744 3,492,6953,484,810 2,286,621 3,484,810
3,465,636 2,208,818 3,465,6363,449,300 2,149,097 3,449,3003,445,475 2,113,788 3,445,475 172,4683,487,904 2,093,580 3,488,469 172,468
3,510,131 3,488,469 172,4683,510,131 172,468
1 Total of amounts shown on the table for each year; does not include Special Projects (Program of Projects), Research, Training, or Special Projects ofRegional and National Significance (SPRANS Grants), and Community Integrated Service Systems monies.
2 These are Constant Dollars for the Title V Health Program totals or the MCH Block Grant totals based on adjustments using the Consumer Price Index(CPI) which defined the average of 1982-1984 as the base year of 100%. 2000-2001 CPI data are not available.
3 Prior to 1952, State Program totals include all of Fund A and most of Fund B, including “Reserved” Funds. For later years, various reserved funds are notincluded in the totals since data were not available for States.
4 Includes projects later known as the “Program of Projects” (M&I, C&Y, Family Planning, Dental, Intensive Infant Care); excludes Family Planning moniesallocated to States in 1970-1972 because these were allocated by the National Center for Family Planning Services. These amounts are not includedin the annual totals.
5 Monies required from FY1975-FY1981 to maintain the FY1973 level of Title V funding defined as the “Hold Harmless” funding base. FY1974 monies inthis category were to enable States to plan for the Program of Projects, including management of existing Special Projects.
6 The total amount shown in FY1973 is not necessarily the base for FY1975 funding levels since some Special Projects were funded for 18 months andother adjustments were necessary.
7 Special Projects monies in 1975 are a portion of $10,472,000 impounded by President Nixon in 1973 and released by court order in 1975.
8 These monies are those used to fund the “transition” quarter in 1976 (July-September) when the Federal Fiscal Year changed from July-June to October-September.
9 Beginning in 1982, a single block allocation was made to each State as the MCH Block Grant.
10 This line is the State’s allocation of the $ 105 million appropriated for care of mothers and children under the 1983 Jobs Bill. It is perceived as 1983supplemental funding but was mostly used in 1984.
11 Represents the amount included in the FY2000 Appropriations as of February 2000.
12 The President’s Budget request for FY2001. Does not include Healthy Start, which is proposed for inclusion in the Title V in FY2001 ($90 million).
13 The Personal Responsibility, and Work Opportunity Reconciliation Act of 1996 created a new section, Section 510 to Title V of the SSA for providingformula grant funds to the States for Abstinence Education. This Act provided a separate appropriation of $50 million for each of the fiscal years1998-2002. This is a permanent appropriation and is counted as mandatory funding under The Budget Enforcement Act.

19361937193819391940
19411942194319441945
19461947194819491950
19511952195319541955
19561957195819591960
19611962196319641965
19661967196819691970
19711972197319741975
197619768
197719781979
Year Title V Health Constant MCH CCS EMIC Special Section Abstinenceor MCH Block Dollars Program Program Projects4 5165 EducationGrant Totals1 (per CPI)2 or MCH Sec. 51013
Block Total3
72
TABLE 25United States Title V or MCH Block Grant Allocations to Each State (showing Constant Dollars forTotal Amounts) By Program Components, FY 1936 - FY 2001: MARYLAND
35,673 256,640 19,789 15,88491,947 638,521 53,809 38,13998,127 695,936 59,988 38,139
116,304 836,719 62,165 54,139145,539 1,039,564 93,814 51,725
174,318 1,185,837 109,829 64,489205,804 1,262,601 121,413 84,391201,110 1,162,486 112,029 62,081 27,000539,382 3,064,670 112,100 57,342 369,940714,976 3,972,089 146,153 68,007 500,816
827,143 4,241,759 121,045 67,136 638,962582,504 2,612,126 215,801 122,094 244,609559,833 2,322,959 247,003 181,882 130,948416,007 1,747,929 256,497 159,510538,697 2,235,257 327,200 211,497
571,948 2,199,800 317,052 254,896255,863 965,521 143,466 112,397278,841 1,044,348 156,848 121,993251,511 934,985 141,964 109,547260,494 971,993 149,504 110,990
308,501 1,134,195 153,050 155,451345,413 1,229,228 190,586 154,827361,861 1,252,114 200,604 161,257428,596 1,472,838 208,256 220,340420,284 1,419,878 236,411 183,873
474,410 1,586,656 244,965 229,445666,356 2,206,477 375,365 290,991685,280 2,239,477 379,080 306,200833,387 2,688,345 480,152 353,235 (484,567)925,214 2,937,187 535,566 389,648 (63,637)
1,240,083 3,827,417 718,234 521,849 (4,641,972)1,390,485 4,163,129 794,881 595,604 (2,845,857)1,444,158 4,149,879 819,679 624,479 (4,412,346)1,553,913 4,234,095 838,465 715,448 (5,720,230)1,520,509 3,918,838 783,599 736,910 (3,277,376)
1,807,689 4,463,430 1,063,730 743,959 (4,738,196)1,866,130 4,464,426 1,063,730 802,400 (5,203,493)
1,925,8006 4,337,387 1,079,500 846,300 (5,508,500)1,932,500 3,919,878 1,086,700 845,800 (4,914,000) 06,766,737 12,577,578 3,606,400 861,100 (963,108)7 2,299,237
7,602,032 13,360,337 3,626,800 1,005,500 2,969,732/ 1,900,508 3,340,084 906,700 251,375 742,433
7,602,032 12,544,607 3,580,800 1,212,400 2,808,8327,602,032 11,659,558 3,718,800 1,284,200 2,599,0327,602,032 10,471,118 3,820,200 1,356,800 2,425,032

1980198119821983198310
19841985
19861987198819891990
19911992199319941995
1996199719981999
200011
200112
Year Title V Health Constant MCH CCS EMIC Special Section Abstinenceor MCH Block Dollars Program Program Projects4 5165 EducationGrant Totals1 (per CPI)2 or MCH Sec. 51013
Block Total3
73
7,602,032 9,225,767 3,788,600 1,332,700 2,480,7327,602,032 8,363,072 3,995,900 1,378,100 2,228,0327,806,978 8,090,133 7,806,9789
7,827,965 7,859,403 7,827,9652,592,450 2,602,861 2,592,4508,373,614 8,059,301 8,373,614
10,031,547 9,322,999 10,031,547
9,600,190 8,759,297 9,600,19010,397,499 9,152,728 10,397,49910,726,942 9,067,576 10,726,94211,016,646 8,884,392 11,016,64611,089,579 8,484,758 11,089,579
11,484,183 8,431,852 11,484,18312,144,324 8,655,969 12,144,32411,876,702 8,219,171 11,876,70212,054,686 8,134,066 12,054,68612,030,175 7,893,816 12,030,175
11,970,565 7,629,423 11,970,56511,912,599 7,422,180 11,912,59911,899,488 7,300,299 11,899,488 535,71212,031,415 7,221,738 12,033,172 535,712
12,100,518 12,033,172 535,71212,100,518 535,712
1 Total of amounts shown on the table for each year; does not include Special Projects (Program of Projects), Research, Training, or Special Projects ofRegional and National Significance (SPRANS Grants), and Community Integrated Service Systems monies.
2 These are Constant Dollars for the Title V Health Program totals or the MCH Block Grant totals based on adjustments using the Consumer Price Index(CPI) which defined the average of 1982-1984 as the base year of 100%. 2000-2001 CPI data are not available.
3 Prior to 1952, State Program totals include all of Fund A and most of Fund B, including “Reserved” Funds. For later years, various reserved funds are notincluded in the totals since data were not available for States.
4 Includes projects later known as the “Program of Projects” (M&I, C&Y, Family Planning, Dental, Intensive Infant Care); excludes Family Planning moniesallocated to States in 1970-1972 because these were allocated by the National Center for Family Planning Services. These amounts are not includedin the annual totals.
5 Monies required from FY1975-FY1981 to maintain the FY1973 level of Title V funding defined as the “Hold Harmless” funding base. FY1974 monies inthis category were to enable States to plan for the Program of Projects, including management of existing Special Projects.
6 The total amount shown in FY1973 is not necessarily the base for FY1975 funding levels since some Special Projects were funded for 18 months andother adjustments were necessary.
7 Special Projects monies in 1975 are a portion of $10,472,000 impounded by President Nixon in 1973 and released by court order in 1975.
8 These monies are those used to fund the “transition” quarter in 1976 (July-September) when the Federal Fiscal Year changed from July-June to October-September.
9 Beginning in 1982, a single block allocation was made to each State as the MCH Block Grant.
10 This line is the State’s allocation of the $ 105 million appropriated for care of mothers and children under the 1983 Jobs Bill. It is perceived as 1983supplemental funding but was mostly used in 1984.
11 Represents the amount included in the FY2000 Appropriations as of February 2000.
12 The President’s Budget request for FY2001. Does not include Healthy Start, which is proposed for inclusion in the Title V in FY2001 ($90 million).
13 The Personal Responsibility, and Work Opportunity Reconciliation Act of 1996 created a new section, Section 510 to Title V of the SSA for providingformula grant funds to the States for Abstinence Education. This Act provided a separate appropriation of $50 million for each of the fiscal years1998-2002. This is a permanent appropriation and is counted as mandatory funding under The Budget Enforcement Act.

19361937193819391940
19411942194319441945
19461947194819491950
19511952195319541955
19561957195819591960
19611962196319641965
19661967196819691970
19711972197319741975
197619768
197719781979
Year Title V Health Constant MCH CCS EMIC Special Section Abstinenceor MCH Block Dollars Program Program Projects4 5165 EducationGrant Totals1 (per CPI)2 or MCH Sec. 51013
Block Total3
74
TABLE 26United States Title V or MCH Block Grant Allocations to Each State (showing Constant Dollars forTotal Amounts) By Program Components, FY 1936 - FY 2001: MASSACHUSETTS
57,183 411,388 30,247 26,936146,096 1,014,556 77,373 68,723162,923 1,155,482 82,715 80,208153,329 1,103,086 78,651 74,678192,630 1,375,929 95,855 96,775
192,839 1,311,830 102,329 90,510177,698 1,090,172 96,046 81,652180,497 1,043,335 100,332 80,165 0
1,590,013 9,034,165 118,096 83,047 1,388,8701,550,459 8,613,661 111,811 76,985 1,361,663
1,470,761 7,542,364 119,994 110,486 1,240,281670,908 3,008,556 248,791 167,189 254,928337,042 1,398,515 237,153 92,869 7,020440,634 1,851,403 301,272 139,362461,124 1,913,378 315,510 145,614
440,014 1,692,362 228,189 211,825325,093 1,226,766 170,975 154,118338,344 1,267,206 177,875 160,469312,843 1,162,985 164,751 148,092310,764 1,159,567 163,843 146,921
362,658 1,333,301 166,291 196,367417,179 1,484,623 216,999 200,180418,403 1,447,761 222,642 195,761441,878 1,518,481 224,716 217,162436,512 1,474,703 234,756 201,756
496,898 1,661,866 239,331 257,567667,018 2,208,669 337,852 329,166687,551 2,246,899 334,507 353,044869,107 2,803,571 466,553 402,554 0981,643 3,116,327 514,333 467,310 0
1,277,514 3,942,944 669,955 607,559 (224,000)1,339,609 4,010,805 670,131 669,478 (2,732,113)1,371,835 3,942,055 690,778 681,057 (1,266,090)1,466,203 3,995,104 694,603 771,600 (2,405,000)1,491,640 3,844,433 706,451 785,189 (3,546,134)
1,637,450 4,043,086 847,061 790,389 (3,558,676)1,718,461 4,111,151 847,061 871,400 (3,699,163)
1,740,8006 3,920,721 845,000 895,800 (3,699,200)1,793,900 3,638,742 898,300 895,600 (2,906,000) 05,408,995 10,053,894 2,937,400 982,300 (623,828)7 1,489,285
5,950,026 10,456,988 3,093,600 1,232,300 1,624,1261,487,506 2,614,246 773,400 308,075 406,0315,950,026 9,818,525 3,097,900 1,474,400 1,377,7265,950,026 9,125,807 3,068,400 1,609,500 1,272,1265,950,026 8,195,628 3,152,400 1,700,300 1,097,326

1980198119821983198310
19841985
19861987198819891990
19911992199319941995
1996199719981999
200011
200112
Year Title V Health Constant MCH CCS EMIC Special Section Abstinenceor MCH Block Dollars Program Program Projects4 5165 EducationGrant Totals1 (per CPI)2 or MCH Sec. 51013
Block Total3
75
5,950,026 7,220,905 2,998,500 1,638,100 1,313,4265,950,026 6,545,683 3,262,100 1,702,900 985,0267,142,958 7,402,029 7,142,9589
7,162,160 7,190,924 7,162,1602,371,950 2,381,476 2,371,9507,661,399 7,373,820 7,661,3999,178,317 8,530,034 9,178,317
8,783,649 8,014,278 8,783,6499,513,143 8,374,246 9,513,1439,944,098 8,405,831 9,944,098
10,331,585 8,331,923 10,331,58510,429,134 7,979,445 10,429,134
10,956,985 8,044,776 10,956,98511,839,884 8,438,976 11,839,88411,542,066 7,987,589 11,542,06611,787,473 7,953,760 11,787,47311,753,677 7,712,386 11,753,677
11,671,486 7,438,806 11,671,48611,620,565 7,240,227 11,620,56511,607,406 7,121,108 11,607,406 739,01211,789,225 7,076,366 11,791,647 739,012
11,884,500 11,791,647 739,01211,884,500 739,012
1 Total of amounts shown on the table for each year; does not include Special Projects (Program of Projects), Research, Training, or Special Projects ofRegional and National Significance (SPRANS Grants), and Community Integrated Service Systems monies.
2 These are Constant Dollars for the Title V Health Program totals or the MCH Block Grant totals based on adjustments using the Consumer Price Index(CPI) which defined the average of 1982-1984 as the base year of 100%. 2000-2001 CPI data are not available.
3 Prior to 1952, State Program totals include all of Fund A and most of Fund B, including “Reserved” Funds. For later years, various reserved funds are notincluded in the totals since data were not available for States.
4 Includes projects later known as the “Program of Projects” (M&I, C&Y, Family Planning, Dental, Intensive Infant Care); excludes Family Planning moniesallocated to States in 1970-1972 because these were allocated by the National Center for Family Planning Services. These amounts are not includedin the annual totals.
5 Monies required from FY1975-FY1981 to maintain the FY1973 level of Title V funding defined as the “Hold Harmless” funding base. FY1974 monies inthis category were to enable States to plan for the Program of Projects, including management of existing Special Projects.
6 The total amount shown in FY1973 is not necessarily the base for FY1975 funding levels since some Special Projects were funded for 18 months andother adjustments were necessary.
7 Special Projects monies in 1975 are a portion of $10,472,000 impounded by President Nixon in 1973 and released by court order in 1975.
8 These monies are those used to fund the “transition” quarter in 1976 (July-September) when the Federal Fiscal Year changed from July-June to October-September.
9 Beginning in 1982, a single block allocation was made to each State as the MCH Block Grant.
10 This line is the State’s allocation of the $ 105 million appropriated for care of mothers and children under the 1983 Jobs Bill. It is perceived as 1983supplemental funding but was mostly used in 1984.
11 Represents the amount included in the FY2000 Appropriations as of February 2000.
12 The President’s Budget request for FY2001. Does not include Healthy Start, which is proposed for inclusion in the Title V in FY2001 ($90 million).
13 The Personal Responsibility, and Work Opportunity Reconciliation Act of 1996 created a new section, Section 510 to Title V of the SSA for providingformula grant funds to the States for Abstinence Education. This Act provided a separate appropriation of $50 million for each of the fiscal years1998-2002. This is a permanent appropriation and is counted as mandatory funding under The Budget Enforcement Act.

19361937193819391940
19411942194319441945
19461947194819491950
19511952195319541955
19561957195819591960
19611962196319641965
19661967196819691970
19711972197319741975
197619768
197719781979
Year Title V Health Constant MCH CCS EMIC Special Section Abstinenceor MCH Block Dollars Program Program Projects4 5165 EducationGrant Totals1 (per CPI)2 or MCH Sec. 51013
Block Total3
76
TABLE 27United States Title V or MCH Block Grant Allocations to Each State (showing Constant Dollars forTotal Amounts) By Program Components, FY 1936 - FY 2001: MICHIGAN
76,231 548,424 39,231 37,000199,295 1,383,993 99,295 100,000196,923 1,396,617 99,104 97,819204,560 1,471,655 104,560 100,000235,641 1,683,150 124,713 110,928
324,102 2,204,776 167,700 156,402250,740 1,538,282 164,206 86,534380,487 2,199,347 168,815 123,672 88,000
1,297,322 7,371,148 163,714 139,763 993,8452,128,893 11,827,183 159,319 110,343 1,859,231
1,942,403 9,961,041 161,021 131,838 1,649,5441,122,402 5,033,193 284,724 233,873 603,805
539,316 2,237,826 251,271 193,632 94,413514,878 2,163,353 279,378 235,500533,430 2,213,402 333,901 199,529
1 659,296 2,535,754 394,947 264,349603,789 2,278,449 333,745 270,044668,559 2,503,966 362,786 305,773598,471 2,224,799 328,204 270,267609,319 2,273,578 331,967 277,352
714,429 2,626,577 328,367 386,062800,444 2,848,555 420,696 379,748832,986 2,882,304 444,674 388,312920,286 3,162,495 468,030 452,256985,020 3,327,770 528,203 456,817
1,115,607 3,731,127 544,602 571,0051,605,950 5,317,715 835,729 770,2211,626,497 5,315,350 828,382 798,1151,869,788 6,031,574 926,458 943,330 (296,923)2,123,939 6,742,663 1,047,728 1,076,211 (215,415)
2,731,859 8,431,664 1,364,637 1,367,222 (670,645)3,065,302 9,177,551 1,519,651 1,545,651 (4,116,408)2,917,712 8,384,230 1,433,691 1,484,021 (4,890,151)3,158,181 8,605,398 1,453,924 1,704,257 (5,056,443)3,218,591 8,295,338 1,512,656 1,705,935 (4,393,218)
3,615,969 8,928,319 1,884,356 1,731,613 (4,282,852)3,810,056 9,114,967 1,884,356 1,925,700 (4,808,496)3,949,2006 8,894,595 1,958,000 1,991,200 (5,512,500)3,997,200 8,107,911 2,007,100 1,990,100 (5,392,232) 09,228,628 17,153,584 6,627,200 2,120,900 (201,284)7 480,528
9,403,200 16,525,835 6,666,600 2,457,600 279,0002,350,800 4,131,459 1,666,650 614,400 69,7509,848,200 16,251,155 6,884,700 2,963,500 0
10,552,800 16,185,276 7,251,700 3,301,100 010,939,000 15,067,493 7,449,900 3,489,100 0

1980198119821983198310
19841985
19861987198819891990
19911992199319941995
1996199719981999
200011
200112
Year Title V Health Constant MCH CCS EMIC Special Section Abstinenceor MCH Block Dollars Program Program Projects4 5165 EducationGrant Totals1 (per CPI)2 or MCH Sec. 51013
Block Total3
77
10,421,500 12,647,451 7,123,700 3,297,800 011,009,600 12,111,771 7,631,100 3,378,500 011,282,016 11,691,208 11,282,0169
11,312,344 11,357,775 11,312,3443,746,400 3,761,446 3,746,400
12,100,872 11,646,653 12,100,87214,496,784 13,472,848 14,496,784
13,873,422 12,658,232 13,873,42215,025,629 13,226,786 15,025,62915,827,526 13,379,143 15,827,52616,554,113 13,350,091 16,554,11316,737,032 12,805,686 16,737,032
17,726,857 13,015,314 17,726,85719,382,371 13,814,947 19,382,37120,220,974 13,993,754 20,220,97420,851,888 14,070,100 20,851,88820,765,001 13,625,329 20,765,001
20,553,698 13,099,871 20,553,69820,479,498 12,759,812 20,479,49820,455,286 12,549,255 20,455,286 1,899,56020,922,557 12,558,558 20,928,783 1,899,560
21,167,492 20,928,783 1,899,56021,167,492 1,899,560
1 Total of amounts shown on the table for each year; does not include Special Projects (Program of Projects), Research, Training, or Special Projects ofRegional and National Significance (SPRANS Grants), and Community Integrated Service Systems monies.
2 These are Constant Dollars for the Title V Health Program totals or the MCH Block Grant totals based on adjustments using the Consumer Price Index(CPI) which defined the average of 1982-1984 as the base year of 100%. 2000-2001 CPI data are not available.
3 Prior to 1952, State Program totals include all of Fund A and most of Fund B, including “Reserved” Funds. For later years, various reserved funds are notincluded in the totals since data were not available for States.
4 Includes projects later known as the “Program of Projects” (M&I, C&Y, Family Planning, Dental, Intensive Infant Care); excludes Family Planning moniesallocated to States in 1970-1972 because these were allocated by the National Center for Family Planning Services. These amounts are not includedin the annual totals.
5 Monies required from FY1975-FY1981 to maintain the FY1973 level of Title V funding defined as the “Hold Harmless” funding base. FY1974 monies inthis category were to enable States to plan for the Program of Projects, including management of existing Special Projects.
6 The total amount shown in FY1973 is not necessarily the base for FY1975 funding levels since some Special Projects were funded for 18 months andother adjustments were necessary.
7 Special Projects monies in 1975 are a portion of $10,472,000 impounded by President Nixon in 1973 and released by court order in 1975.
8 These monies are those used to fund the “transition” quarter in 1976 (July-September) when the Federal Fiscal Year changed from July-June to October-September.
9 Beginning in 1982, a single block allocation was made to each State as the MCH Block Grant.
10 This line is the State’s allocation of the $ 105 million appropriated for care of mothers and children under the 1983 Jobs Bill. It is perceived as 1983supplemental funding but was mostly used in 1984.
11 Represents the amount included in the FY2000 Appropriations as of February 2000.
12 The President’s Budget request for FY2001. Does not include Healthy Start, which is proposed for inclusion in the Title V in FY2001 ($90 million).
13 The Personal Responsibility, and Work Opportunity Reconciliation Act of 1996 created a new section, Section 510 to Title V of the SSA for providingformula grant funds to the States for Abstinence Education. This Act provided a separate appropriation of $50 million for each of the fiscal years1998-2002. This is a permanent appropriation and is counted as mandatory funding under The Budget Enforcement Act.

19361937193819391940
19411942194319441945
19461947194819491950
19511952195319541955
19561957195819591960
19611962196319641965
19661967196819691970
19711972197319741975
197619768
197719781979
Year Title V Health Constant MCH CCS EMIC Special Section Abstinenceor MCH Block Dollars Program Program Projects4 5165 EducationGrant Totals1 (per CPI)2 or MCH Sec. 51013
Block Total3
78
TABLE 28United States Title V or MCH Block Grant Allocations to Each State (showing Constant Dollars forTotal Amounts) By Program Components, FY 1936 - FY 2001: MINNESOTA
44,636 321,122 24,094 20,542158,433 1,100,229 69,435 88,998137,689 976,518 69,691 67,998138,793 998,511 69,468 69,325163,723 1,169,450 85,602 78,121
186,117 1,266,102 102,330 83,787183,381 1,125,037 95,615 87,766245,753 1,420,538 101,327 124,426 20,000909,249 5,166,188 97,056 122,018 690,175
1,105,540 6,141,889 95,107 133,889 876,544
1,071,492 5,494,831 92,754 118,561 860,177451,359 2,024,031 135,263 171,368 144,728367,709 1,525,763 178,648 170,452 18,609351,426 1,476,580 192,681 158,745353,259 1,465,805 197,768 155,491
419,335 1,612,827 228,978 190,357401,257 1,514,177 210,505 190,752438,628 1,642,801 226,215 212,413411,173 1,528,524 219,004 192,169421,421 1,572,466 223,712 197,709
496,991 1,827,173 220,617 276,374550,266 1,958,242 273,433 276,833555,881 1,923,464 278,873 277,008767,297 2,636,759 283,873 483,424594,643 2,008,929 294,491 300,152
678,859 2,270,431 304,648 374,211914,281 3,027,421 443,770 470,511918,754 3,002,464 457,281 461,473
1,012,613 3,266,494 484,967 527,646 01,148,790 3,646,952 556,709 592,081 (73,723)
1,437,963 4,438,157 691,056 746,907 (1,454,013)1,627,691 4,873,326 792,557 835,134 (144,815)1,623,527 4,665,307 786,652 836,875 (1,319,183)1,715,595 4,674,646 782,088 933,507 (1,484,812)1,683,897 4,339,941 736,789 947,108 (1,274,098)
1,871,451 4,620,867 910,103 961,348 (1,453,945)1,982,803 4,743,548 910,103 1,072,700 (1,675,631)
2,035,0006 4,583,333 930,500 1,104,500 (1,957,800)2,065,800 4,190,264 940,200 1,103,600 (2,190,000) 22,0004,214,500 7,833,643 3,111,700 1,102,800 07 0
4,436,700 7,797,364 3,137,700 1,299,000 01,109,175 1,949,341 784,425 324,750 04,785,300 7,896,535 3,237,100 1,548,200 05,218,600 8,003,988 3,577,700 1,640,900 05,410,200 7,452,066 3,675,400 1,734,800 0
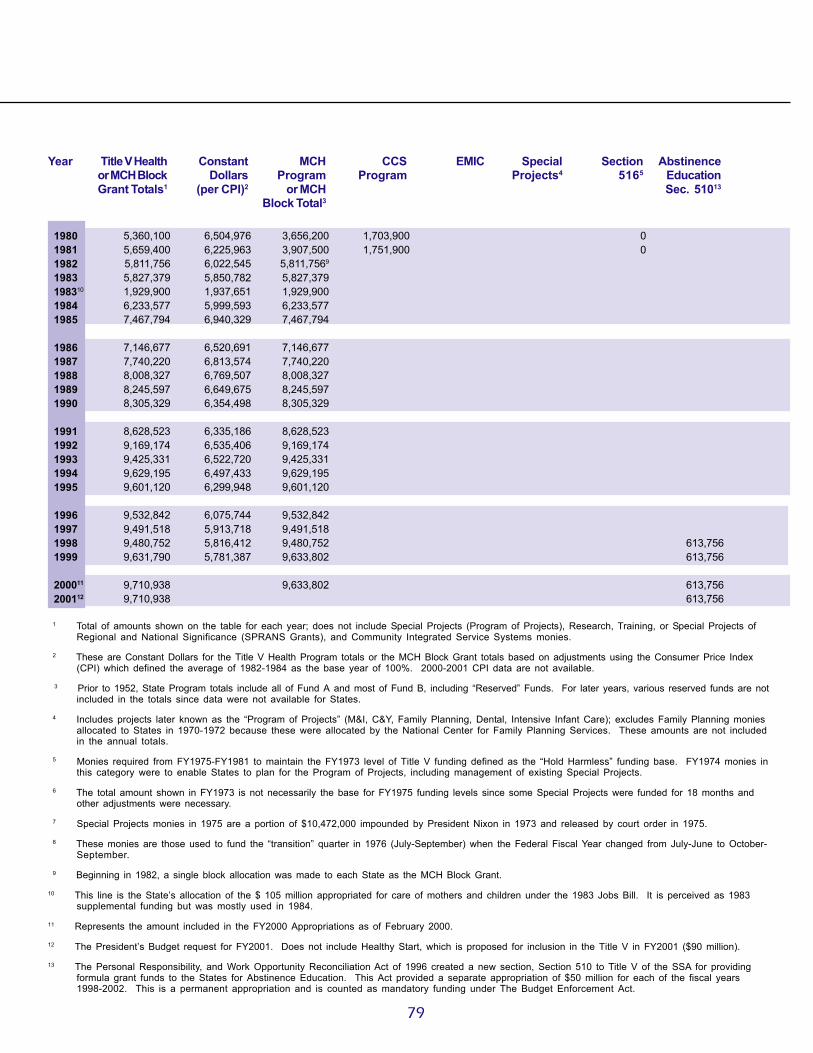
1980198119821983198310
19841985
19861987198819891990
19911992199319941995
1996199719981999
200011
200112
Year Title V Health Constant MCH CCS EMIC Special Section Abstinenceor MCH Block Dollars Program Program Projects4 5165 EducationGrant Totals1 (per CPI)2 or MCH Sec. 51013
Block Total3
79
5,360,100 6,504,976 3,656,200 1,703,900 05,659,400 6,225,963 3,907,500 1,751,900 05,811,756 6,022,545 5,811,7569
5,827,379 5,850,782 5,827,3791,929,900 1,937,651 1,929,9006,233,577 5,999,593 6,233,5777,467,794 6,940,329 7,467,794
7,146,677 6,520,691 7,146,6777,740,220 6,813,574 7,740,2208,008,327 6,769,507 8,008,3278,245,597 6,649,675 8,245,5978,305,329 6,354,498 8,305,329
8,628,523 6,335,186 8,628,5239,169,174 6,535,406 9,169,1749,425,331 6,522,720 9,425,3319,629,195 6,497,433 9,629,1959,601,120 6,299,948 9,601,120
9,532,842 6,075,744 9,532,8429,491,518 5,913,718 9,491,5189,480,752 5,816,412 9,480,752 613,7569,631,790 5,781,387 9,633,802 613,756
9,710,938 9,633,802 613,7569,710,938 613,756
1 Total of amounts shown on the table for each year; does not include Special Projects (Program of Projects), Research, Training, or Special Projects ofRegional and National Significance (SPRANS Grants), and Community Integrated Service Systems monies.
2 These are Constant Dollars for the Title V Health Program totals or the MCH Block Grant totals based on adjustments using the Consumer Price Index(CPI) which defined the average of 1982-1984 as the base year of 100%. 2000-2001 CPI data are not available.
3 Prior to 1952, State Program totals include all of Fund A and most of Fund B, including “Reserved” Funds. For later years, various reserved funds are notincluded in the totals since data were not available for States.
4 Includes projects later known as the “Program of Projects” (M&I, C&Y, Family Planning, Dental, Intensive Infant Care); excludes Family Planning moniesallocated to States in 1970-1972 because these were allocated by the National Center for Family Planning Services. These amounts are not includedin the annual totals.
5 Monies required from FY1975-FY1981 to maintain the FY1973 level of Title V funding defined as the “Hold Harmless” funding base. FY1974 monies inthis category were to enable States to plan for the Program of Projects, including management of existing Special Projects.
6 The total amount shown in FY1973 is not necessarily the base for FY1975 funding levels since some Special Projects were funded for 18 months andother adjustments were necessary.
7 Special Projects monies in 1975 are a portion of $10,472,000 impounded by President Nixon in 1973 and released by court order in 1975.
8 These monies are those used to fund the “transition” quarter in 1976 (July-September) when the Federal Fiscal Year changed from July-June to October-September.
9 Beginning in 1982, a single block allocation was made to each State as the MCH Block Grant.
10 This line is the State’s allocation of the $ 105 million appropriated for care of mothers and children under the 1983 Jobs Bill. It is perceived as 1983supplemental funding but was mostly used in 1984.
11 Represents the amount included in the FY2000 Appropriations as of February 2000.
12 The President’s Budget request for FY2001. Does not include Healthy Start, which is proposed for inclusion in the Title V in FY2001 ($90 million).
13 The Personal Responsibility, and Work Opportunity Reconciliation Act of 1996 created a new section, Section 510 to Title V of the SSA for providingformula grant funds to the States for Abstinence Education. This Act provided a separate appropriation of $50 million for each of the fiscal years1998-2002. This is a permanent appropriation and is counted as mandatory funding under The Budget Enforcement Act.

19361937193819391940
19411942194319441945
19461947194819491950
19511952195319541955
19561957195819591960
19611962196319641965
19661967196819691970
19711972197319741975
197619768
197719781979
Year Title V Health Constant MCH CCS EMIC Special Section Abstinenceor MCH Block Dollars Program Program Projects4 5165 EducationGrant Totals1 (per CPI)2 or MCH Sec. 51013
Block Total3
80
TABLE 29United States Title V or MCH Block Grant Allocations to Each State (showing Constant Dollars forTotal Amounts) By Program Components, FY 1936 - FY 2001: MISSISSIPPI
70,974 510,604 51,000 19,974152,658 1,060,125 104,696 47,962139,311 988,021 91,349 47,962143,972 1,035,770 96,010 47,962179,501 1,282,150 120,993 58,508
185,768 1,263,728 143,018 42,750201,859 1,238,399 145,637 56,222267,908 1,548,601 153,378 62,530 52,000638,526 3,627,989 157,185 67,361 413,980791,959 4,399,772 141,892 87,444 562,623
625,617 3,208,292 144,631 103,858 377,128705,924 3,165,578 358,009 195,906 152,009628,200 2,606,639 370,430 217,817 39,953590,007 2,479,021 339,116 250,891546,310 2,266,846 315,007 231,303
605,175 2,327,596 345,433 259,742597,948 2,256,408 324,601 273,347669,146 2,506,165 355,322 313,824594,792 2,211,123 312,416 282,376576,486 2,151,067 301,467 275,019
673,361 2,475,592 292,431 380,930715,964 2,547,915 354,485 361,479707,544 2,448,249 357,682 349,862717,606 2,466,000 346,236 371,370713,002 2,408,791 351,808 361,194
813,338 2,720,194 363,637 449,7011,043,064 3,453,854 491,183 551,8811,025,209 3,350,356 486,942 538,2671,183,457 3,817,603 564,512 618,945 01,343,183 4,264,073 646,188 696,995 0
1,700,256 5,247,704 827,117 873,139 (188,975)1,911,554 5,723,216 940,817 970,737 01,891,117 5,434,244 931,443 959,674 (180,888)1,999,141 5,447,251 925,660 1,073,481 (1,209,973)1,939,627 4,999,039 861,147 1,078,480 (350,166)
2,132,383 5,265,143 1,052,599 1,079,784 (326,710)2,119,199 5,069,854 1,052,599 1,066,600 (374,449)
2,193,1006 4,939,414 1,071,800 1,121,300 (374,400)2,605,200 5,284,381 1,041,700 1,120,200 (389,000)7 443,3004,551,800 8,460,595 3,479,200 1,072,600 0 0
5,042,800 8,862,566 3,789,000 1,253,800 01,260,700 2,215,641 947,250 313,450 05,438,300 8,974,092 3,896,300 1,542,000 05,728,300 8,785,736 4,066,100 1,662,200 05,935,400 8,175,482 4,177,000 1,758,400 0

1980198119821983198310
19841985
19861987198819891990
19911992199319941995
1996199719981999
200011
200112
Year Title V Health Constant MCH CCS EMIC Special Section Abstinenceor MCH Block Dollars Program Program Projects4 5165 EducationGrant Totals1 (per CPI)2 or MCH Sec. 51013
Block Total3
81
5,743,800 6,970,631 3,987,900 1,755,900 05,894,200 6,484,268 4,054,700 1,839,500 05,622,036 5,825,944 5,622,0369
5,637,149 5,659,788 5,637,1491,866,900 1,874,398 1,866,9006,030,087 5,803,741 6,030,0877,224,014 6,713,768 7,224,014
6,913,381 6,307,829 6,913,3817,487,547 6,591,151 7,487,5478,030,351 6,788,124 8,030,3518,515,267 6,867,151 8,515,2678,638,962 6,609,764 8,638,962
9,308,349 6,834,324 9,308,34910,427,828 7,432,522 10,427,82810,392,295 7,191,900 10,392,29510,745,288 7,250,532 10,745,28810,696,676 7,018,816 10,696,676
10,578,452 6,742,162 10,578,45210,542,465 6,568,514 10,542,46510,529,856 6,460,034 10,529,856 1,062,75210,791,276 6,477,357 10,794,759 1,062,752
10,928,315 10,794,759 1,062,75210,928,315 1,062,752
1 Total of amounts shown on the table for each year; does not include Special Projects (Program of Projects), Research, Training, or Special Projects ofRegional and National Significance (SPRANS Grants), and Community Integrated Service Systems monies.
2 These are Constant Dollars for the Title V Health Program totals or the MCH Block Grant totals based on adjustments using the Consumer Price Index(CPI) which defined the average of 1982-1984 as the base year of 100%. 2000-2001 CPI data are not available.
3 Prior to 1952, State Program totals include all of Fund A and most of Fund B, including “Reserved” Funds. For later years, various reserved funds are notincluded in the totals since data were not available for States.
4 Includes projects later known as the “Program of Projects” (M&I, C&Y, Family Planning, Dental, Intensive Infant Care); excludes Family Planning moniesallocated to States in 1970-1972 because these were allocated by the National Center for Family Planning Services. These amounts are not includedin the annual totals.
5 Monies required from FY1975-FY1981 to maintain the FY1973 level of Title V funding defined as the “Hold Harmless” funding base. FY1974 monies inthis category were to enable States to plan for the Program of Projects, including management of existing Special Projects.
6 The total amount shown in FY1973 is not necessarily the base for FY1975 funding levels since some Special Projects were funded for 18 months andother adjustments were necessary.
7 Special Projects monies in 1975 are a portion of $10,472,000 impounded by President Nixon in 1973 and released by court order in 1975.
8 These monies are those used to fund the “transition” quarter in 1976 (July-September) when the Federal Fiscal Year changed from July-June to October-September.
9 Beginning in 1982, a single block allocation was made to each State as the MCH Block Grant.
10 This line is the State’s allocation of the $ 105 million appropriated for care of mothers and children under the 1983 Jobs Bill. It is perceived as 1983supplemental funding but was mostly used in 1984.
11 Represents the amount included in the FY2000 Appropriations as of February 2000.
12 The President’s Budget request for FY2001. Does not include Healthy Start, which is proposed for inclusion in the Title V in FY2001 ($90 million).
13 The Personal Responsibility, and Work Opportunity Reconciliation Act of 1996 created a new section, Section 510 to Title V of the SSA for providingformula grant funds to the States for Abstinence Education. This Act provided a separate appropriation of $50 million for each of the fiscal years1998-2002. This is a permanent appropriation and is counted as mandatory funding under The Budget Enforcement Act.

19361937193819391940
19411942194319441945
19461947194819491950
19511952195319541955
19561957195819591960
19611962196319641965
19661967196819691970
19711972197319741975
197619768
197719781979
Year Title V Health Constant MCH CCS EMIC Special Section Abstinenceor MCH Block Dollars Program Program Projects4 5165 EducationGrant Totals1 (per CPI)2 or MCH Sec. 51013
Block Total3
82
TABLE 30United States Title V or MCH Block Grant Allocations to Each State (showing Constant Dollars forTotal Amounts) By Program Components, FY 1936 - FY 2001: MISSOURI
53,249 383,086 28,651 24,598138,194 959,681 78,908 59,286132,173 937,397 73,309 58,864143,530 1,032,590 84,666 58,864179,290 1,280,643 103,982 75,308
216,452 1,472,463 125,479 90,973210,159 1,289,319 119,762 90,397242,463 1,401,520 129,687 82,776 30,000
1,045,989 5,943,119 123,611 90,697 831,6811,563,687 8,687,150 104,594 119,146 1,339,947
939,795 4,819,462 122,892 104,779 712,124564,329 2,530,623 154,849 147,111 262,369369,047 1,531,315 208,782 89,472 70,793307,677 1,292,761 176,013 131,664395,571 1,641,373 214,979 180,592
518,538 1,994,377 246,261 272,277439,837 1,659,762 235,296 204,541453,989 1,700,333 248,884 205,105431,712 1,604,877 221,976 209,736438,253 1,635,272 223,228 215,025
514,779 1,892,570 219,219 295,560561,415 1,997,918 274,951 286,464575,361 1,990,869 281,768 293,593604,246 2,076,447 289,335 314,911610,597 2,062,828 303,086 307,511
697,055 2,331,288 313,448 383,607923,130 3,056,722 446,442 476,688909,488 2,972,183 440,083 469,405
1,021,177 3,294,119 486,271 534,906 01,154,658 3,665,581 551,786 602,872 (705,578)
1,439,483 4,442,849 690,266 749,217 (1,094,272)1,679,301 5,027,847 827,293 852,008 (1,850,311)1,774,318 5,098,615 874,839 899,479 (1,975,976)1,877,642 5,116,191 851,460 1,026,182 (2,272,026)1,895,771 4,886,008 845,063 1,050,708 (2,073,634)
2,137,165 5,276,951 1,074,037 1,063,128 (2,105,303)2,236,637 5,350,806 1,074,037 1,162,600 (2,299,284)
2,300,0006 5,180,180 1,102,300 1,197,700 (2,768,300)2,538,000 5,148,073 1,154,600 1,196,900 (2,429,000) 186,5005,122,555 9,521,478 3,826,700 1,198,100 (40,948)7 97,755
5,562,700 9,776,274 4,146,700 1,416,000 01,390,675 2,444,069 1,036,675 354,000 06,230,600 10,281,518 4,498,300 1,732,300 06,514,400 9,991,411 4,671,700 1,842,700 06,747,300 9,293,802 4,799,200 1,948,100 0

1980198119821983198310
19841985
19861987198819891990
19911992199319941995
1996199719981999
200011
200112
Year Title V Health Constant MCH CCS EMIC Special Section Abstinenceor MCH Block Dollars Program Program Projects4 5165 EducationGrant Totals1 (per CPI)2 or MCH Sec. 51013
Block Total3
83
6,642,900 8,061,772 4,709,300 1,933,600 06,982,900 7,681,958 4,979,500 2,003,400 07,493,940 7,765,741 7,493,9409
7,514,085 7,544,262 7,514,0852,488,500 2,498,494 2,488,5008,037,855 7,736,145 8,037,8559,629,310 8,949,173 9,629,310
9,215,250 8,408,075 9,215,2509,980,588 8,785,729 9,980,588
10,420,285 8,808,356 10,420,28510,815,059 8,721,822 10,815,05910,914,444 8,350,761 10,914,444
11,452,218 8,408,383 11,452,21812,351,728 8,803,798 12,351,72812,636,380 8,744,900 12,636,38012,958,276 8,743,776 12,958,27612,913,946 8,473,718 12,913,946
12,806,138 8,161,975 12,806,13812,754,364 7,946,644 12,754,36412,739,650 7,815,736 12,739,650 969,29112,978,095 7,789,973 12,981,271 969,291
13,103,064 12,981,271 969,29113,103,064 969,291
1 Total of amounts shown on the table for each year; does not include Special Projects (Program of Projects), Research, Training, or Special Projects ofRegional and National Significance (SPRANS Grants), and Community Integrated Service Systems monies.
2 These are Constant Dollars for the Title V Health Program totals or the MCH Block Grant totals based on adjustments using the Consumer Price Index(CPI) which defined the average of 1982-1984 as the base year of 100%. 2000-2001 CPI data are not available.
3 Prior to 1952, State Program totals include all of Fund A and most of Fund B, including “Reserved” Funds. For later years, various reserved funds are notincluded in the totals since data were not available for States.
4 Includes projects later known as the “Program of Projects” (M&I, C&Y, Family Planning, Dental, Intensive Infant Care); excludes Family Planning moniesallocated to States in 1970-1972 because these were allocated by the National Center for Family Planning Services. These amounts are not includedin the annual totals.
5 Monies required from FY1975-FY1981 to maintain the FY1973 level of Title V funding defined as the “Hold Harmless” funding base. FY1974 monies inthis category were to enable States to plan for the Program of Projects, including management of existing Special Projects.
6 The total amount shown in FY1973 is not necessarily the base for FY1975 funding levels since some Special Projects were funded for 18 months andother adjustments were necessary.
7 Special Projects monies in 1975 are a portion of $10,472,000 impounded by President Nixon in 1973 and released by court order in 1975.
8 These monies are those used to fund the “transition” quarter in 1976 (July-September) when the Federal Fiscal Year changed from July-June to October-September.
9 Beginning in 1982, a single block allocation was made to each State as the MCH Block Grant.
10 This line is the State’s allocation of the $ 105 million appropriated for care of mothers and children under the 1983 Jobs Bill. It is perceived as 1983supplemental funding but was mostly used in 1984.
11 Represents the amount included in the FY2000 Appropriations as of February 2000.
12 The President’s Budget request for FY2001. Does not include Healthy Start, which is proposed for inclusion in the Title V in FY2001 ($90 million).
13 The Personal Responsibility, and Work Opportunity Reconciliation Act of 1996 created a new section, Section 510 to Title V of the SSA for providingformula grant funds to the States for Abstinence Education. This Act provided a separate appropriation of $50 million for each of the fiscal years1998-2002. This is a permanent appropriation and is counted as mandatory funding under The Budget Enforcement Act.

19361937193819391940
19411942194319441945
19461947194819491950
19511952195319541955
19561957195819591960
19611962196319641965
19661967196819691970
19711972197319741975
197619768
197719781979
Year Title V Health Constant MCH CCS EMIC Special Section Abstinenceor MCH Block Dollars Program Program Projects4 5165 EducationGrant Totals1 (per CPI)2 or MCH Sec. 51013
Block Total3
84
TABLE 31United States Title V or MCH Block Grant Allocations to Each State (showing Constant Dollars forTotal Amounts) By Program Components, FY 1936 - FY 2001: MONTANA
26,829 193,014 15,892 10,93771,412 495,917 45,153 26,25978,203 554,631 51,944 26,25989,991 647,417 51,107 38,88498,117 700,836 62,156 35,961
107,364 730,367 59,665 47,69993,316 572,491 50,933 42,38392,363 533,890 49,181 33,182 10,000
260,554 1,480,420 57,748 28,611 174,195259,144 1,439,689 57,255 24,977 176,912
220,736 1,131,979 56,388 20,000 144,348150,706 675,812 79,067 34,375 37,264192,236 797,660 67,253 83,526 41,457144,330 606,429 67,282 77,048127,347 528,411 65,628 61,719
196,103 754,242 92,231 103,872165,594 624,883 86,682 78,912
82,930 310,599 36,797 46,133159,888 594,379 84,011 75,877159,132 593,776 83,363 75,769
181,087 665,761 83,632 97,455210,902 750,541 108,586 102,316213,641 739,242 111,315 102,326219,533 754,409 111,349 108,184217,463 734,672 112,885 104,578
252,610 844,849 122,027 130,583280,177 927,738 139,962 140,215279,883 914,650 140,491 139,392309,795 999,339 154,815 154,980 0339,463 1,077,660 169,460 170,003 0
392,990 1,212,932 196,169 196,821 0418,045 1,251,632 207,948 210,097 (182,000)417,451 1,199,572 207,948 209,503 0431,931 1,176,924 205,294 226,637 (219,201)442,415 1,140,245 211,251 231,164 (268,998)
457,575 1,129,815 226,685 230,890 (323,000)472,985 1,131,543 226,685 246,300 (383,000)
490,3006 1,104,279 229,000 261,300 (383,000)509,200 1,032,860 224,500 261,100 (976,000) 23,600957,800 1,780,297 696,400 261,400 07 0
1,109,500 1,949,912 810,500 299,000 0277,375 487,478 202,625 74,750 0
1,237,400 2,041,914 875,100 362,300 01,360,000 2,085,890 964,000 396,000 01,408,800 1,940,496 990,300 418,500 0
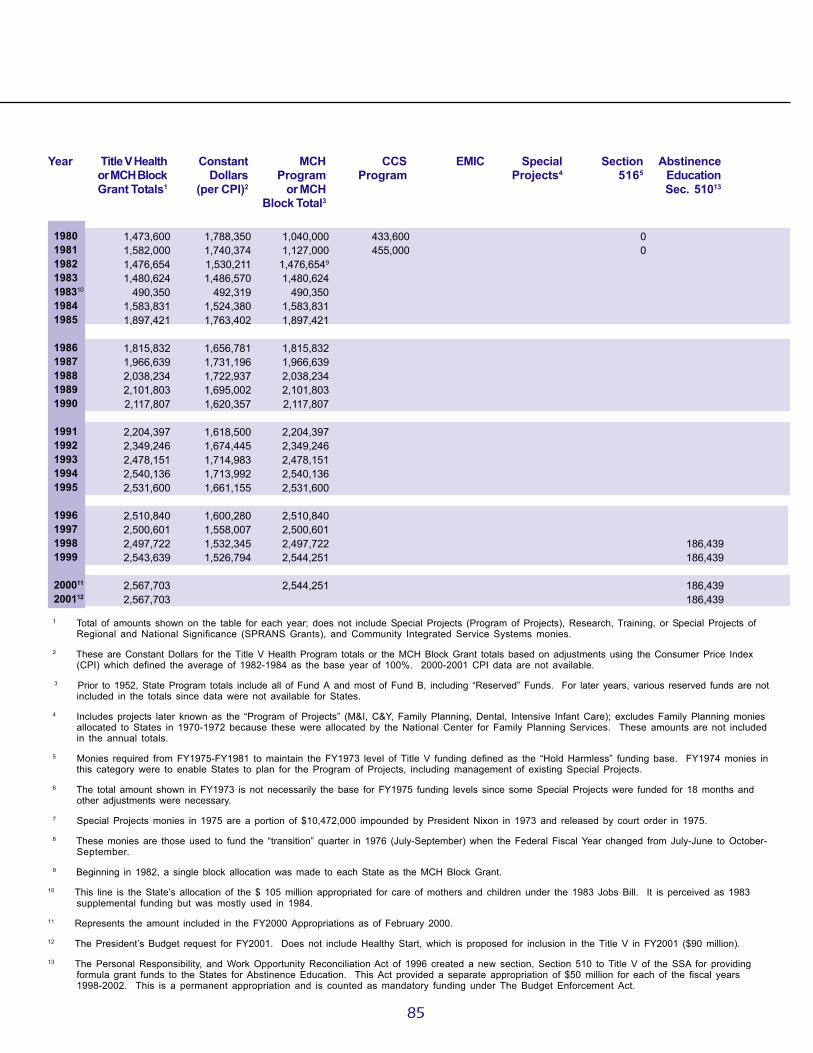
1980198119821983198310
19841985
19861987198819891990
19911992199319941995
1996199719981999
200011
200112
Year Title V Health Constant MCH CCS EMIC Special Section Abstinenceor MCH Block Dollars Program Program Projects4 5165 EducationGrant Totals1 (per CPI)2 or MCH Sec. 51013
Block Total3
85
1,473,600 1,788,350 1,040,000 433,600 01,582,000 1,740,374 1,127,000 455,000 01,476,654 1,530,211 1,476,6549
1,480,624 1,486,570 1,480,624490,350 492,319 490,350
1,583,831 1,524,380 1,583,8311,897,421 1,763,402 1,897,421
1,815,832 1,656,781 1,815,8321,966,639 1,731,196 1,966,6392,038,234 1,722,937 2,038,2342,101,803 1,695,002 2,101,8032,117,807 1,620,357 2,117,807
2,204,397 1,618,500 2,204,3972,349,246 1,674,445 2,349,2462,478,151 1,714,983 2,478,1512,540,136 1,713,992 2,540,1362,531,600 1,661,155 2,531,600
2,510,840 1,600,280 2,510,8402,500,601 1,558,007 2,500,6012,497,722 1,532,345 2,497,722 186,4392,543,639 1,526,794 2,544,251 186,439
2,567,703 2,544,251 186,4392,567,703 186,439
1 Total of amounts shown on the table for each year; does not include Special Projects (Program of Projects), Research, Training, or Special Projects ofRegional and National Significance (SPRANS Grants), and Community Integrated Service Systems monies.
2 These are Constant Dollars for the Title V Health Program totals or the MCH Block Grant totals based on adjustments using the Consumer Price Index(CPI) which defined the average of 1982-1984 as the base year of 100%. 2000-2001 CPI data are not available.
3 Prior to 1952, State Program totals include all of Fund A and most of Fund B, including “Reserved” Funds. For later years, various reserved funds are notincluded in the totals since data were not available for States.
4 Includes projects later known as the “Program of Projects” (M&I, C&Y, Family Planning, Dental, Intensive Infant Care); excludes Family Planning moniesallocated to States in 1970-1972 because these were allocated by the National Center for Family Planning Services. These amounts are not includedin the annual totals.
5 Monies required from FY1975-FY1981 to maintain the FY1973 level of Title V funding defined as the “Hold Harmless” funding base. FY1974 monies inthis category were to enable States to plan for the Program of Projects, including management of existing Special Projects.
6 The total amount shown in FY1973 is not necessarily the base for FY1975 funding levels since some Special Projects were funded for 18 months andother adjustments were necessary.
7 Special Projects monies in 1975 are a portion of $10,472,000 impounded by President Nixon in 1973 and released by court order in 1975.
8 These monies are those used to fund the “transition” quarter in 1976 (July-September) when the Federal Fiscal Year changed from July-June to October-September.
9 Beginning in 1982, a single block allocation was made to each State as the MCH Block Grant.
10 This line is the State’s allocation of the $ 105 million appropriated for care of mothers and children under the 1983 Jobs Bill. It is perceived as 1983supplemental funding but was mostly used in 1984.
11 Represents the amount included in the FY2000 Appropriations as of February 2000.
12 The President’s Budget request for FY2001. Does not include Healthy Start, which is proposed for inclusion in the Title V in FY2001 ($90 million).
13 The Personal Responsibility, and Work Opportunity Reconciliation Act of 1996 created a new section, Section 510 to Title V of the SSA for providingformula grant funds to the States for Abstinence Education. This Act provided a separate appropriation of $50 million for each of the fiscal years1998-2002. This is a permanent appropriation and is counted as mandatory funding under The Budget Enforcement Act.

19361937193819391940
19411942194319441945
19461947194819491950
19511952195319541955
19561957195819591960
19611962196319641965
19661967196819691970
19711972197319741975
197619768
197719781979
Year Title V Health Constant MCH CCS EMIC Special Section Abstinenceor MCH Block Dollars Program Program Projects4 5165 EducationGrant Totals1 (per CPI)2 or MCH Sec. 51013
Block Total3
86
TABLE 32United States Title V or MCH Block Grant Allocations to Each State (showing Constant Dollars forTotal Amounts) By Program Components, FY 1936 - FY 2001: NEBRASKA
49,560 356,547 24,560 25,00076,893 533,979 40,729 36,16491,644 649,957 55,480 36,164
103,071 741,518 51,907 51,164110,960 792,571 56,390 54,570
125,673 854,918 69,356 56,317118,337 725,994 62,503 55,834181,258 1,047,734 78,208 61,675 41,375522,775 2,970,313 66,377 58,561 397,837739,534 4,108,522 65,098 63,484 610,952
556,939 2,856,097 65,757 74,748 416,434215,396 965,901 118,058 85,076 12,262200,435 831,680 107,472 90,251 2,712183,875 772,584 100,100 83,775183,194 760,141 97,604 85,590
215,672 829,508 107,404 108,268198,348 748,483 103,679 94,669185,024 692,974 97,855 87,169190,213 707,112 100,226 89,987192,099 716,787 100,410 91,689
227,536 836,529 100,028 127,508257,301 915,662 128,415 128,886263,559 911,969 131,665 131,894274,497 943,289 131,856 142,641275,681 931,355 133,873 141,808
318,723 1,065,963 142,228 176,495378,235 1,252,434 172,210 206,025369,742 1,208,307 173,499 196,243430,411 1,388,423 199,916 230,495 0492,935 1,564,873 232,617 260,318 0
618,123 1,907,787 294,803 323,320 (150,834)677,776 2,029,269 318,665 359,111 (1,381,249)685,950 1,971,121 325,028 360,922 (650,000)708,769 1,931,251 312,620 396,149 (1,240,909)674,316 1,737,928 283,832 390,484 (1,201,383)
740,930 1,829,457 346,379 394,551 (985,093)782,679 1,872,438 346,379 436,300 (1,206,777)
812,7006 1,830,405 359,100 453,600 (1,406,800)809,200 1,641,379 355,900 453,300 (1,174,000) 0
2,266,243 4,212,348 1,170,500 431,600 (278,196)7 664,143
2,507,520 4,406,889 1,269,500 508,700 729,320626,880 1,101,722 317,375 127,175 182,330
2,507,520 4,137,822 1,358,300 609,800 539,4202,507,520 3,845,890 1,514,600 662,300 330,6202,507,520 3,453,884 1,556,000 700,100 251,420
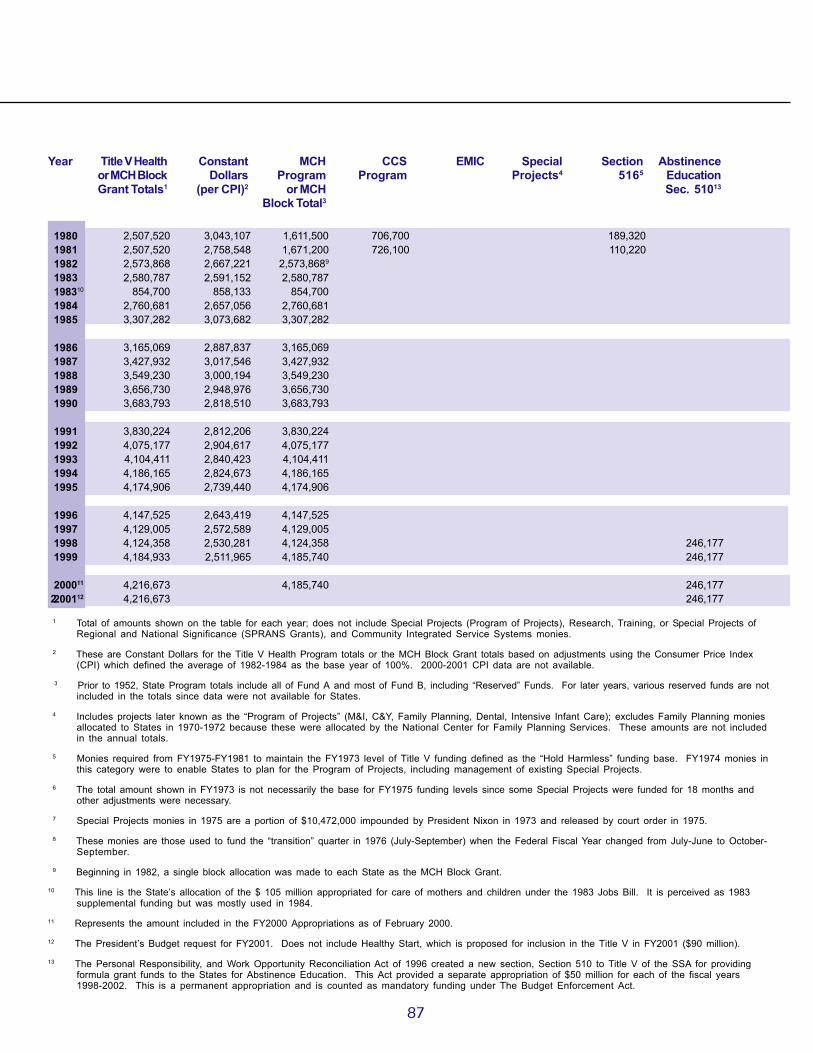
1980198119821983198310
19841985
19861987198819891990
19911992199319941995
1996199719981999
200011
200112
Year Title V Health Constant MCH CCS EMIC Special Section Abstinenceor MCH Block Dollars Program Program Projects4 5165 EducationGrant Totals1 (per CPI)2 or MCH Sec. 51013
Block Total3
87
2,507,520 3,043,107 1,611,500 706,700 189,3202,507,520 2,758,548 1,671,200 726,100 110,2202,573,868 2,667,221 2,573,8689
2,580,787 2,591,152 2,580,787854,700 858,133 854,700
2,760,681 2,657,056 2,760,6813,307,282 3,073,682 3,307,282
3,165,069 2,887,837 3,165,0693,427,932 3,017,546 3,427,9323,549,230 3,000,194 3,549,2303,656,730 2,948,976 3,656,7303,683,793 2,818,510 3,683,793
3,830,224 2,812,206 3,830,2244,075,177 2,904,617 4,075,1774,104,411 2,840,423 4,104,4114,186,165 2,824,673 4,186,1654,174,906 2,739,440 4,174,906
4,147,525 2,643,419 4,147,5254,129,005 2,572,589 4,129,0054,124,358 2,530,281 4,124,358 246,1774,184,933 2,511,965 4,185,740 246,177
4,216,673 4,185,740 246,1772 4,216,673 246,177
1 Total of amounts shown on the table for each year; does not include Special Projects (Program of Projects), Research, Training, or Special Projects ofRegional and National Significance (SPRANS Grants), and Community Integrated Service Systems monies.
2 These are Constant Dollars for the Title V Health Program totals or the MCH Block Grant totals based on adjustments using the Consumer Price Index(CPI) which defined the average of 1982-1984 as the base year of 100%. 2000-2001 CPI data are not available.
3 Prior to 1952, State Program totals include all of Fund A and most of Fund B, including “Reserved” Funds. For later years, various reserved funds are notincluded in the totals since data were not available for States.
4 Includes projects later known as the “Program of Projects” (M&I, C&Y, Family Planning, Dental, Intensive Infant Care); excludes Family Planning moniesallocated to States in 1970-1972 because these were allocated by the National Center for Family Planning Services. These amounts are not includedin the annual totals.
5 Monies required from FY1975-FY1981 to maintain the FY1973 level of Title V funding defined as the “Hold Harmless” funding base. FY1974 monies inthis category were to enable States to plan for the Program of Projects, including management of existing Special Projects.
6 The total amount shown in FY1973 is not necessarily the base for FY1975 funding levels since some Special Projects were funded for 18 months andother adjustments were necessary.
7 Special Projects monies in 1975 are a portion of $10,472,000 impounded by President Nixon in 1973 and released by court order in 1975.
8 These monies are those used to fund the “transition” quarter in 1976 (July-September) when the Federal Fiscal Year changed from July-June to October-September.
9 Beginning in 1982, a single block allocation was made to each State as the MCH Block Grant.
10 This line is the State’s allocation of the $ 105 million appropriated for care of mothers and children under the 1983 Jobs Bill. It is perceived as 1983supplemental funding but was mostly used in 1984.
11 Represents the amount included in the FY2000 Appropriations as of February 2000.
12 The President’s Budget request for FY2001. Does not include Healthy Start, which is proposed for inclusion in the Title V in FY2001 ($90 million).
13 The Personal Responsibility, and Work Opportunity Reconciliation Act of 1996 created a new section, Section 510 to Title V of the SSA for providingformula grant funds to the States for Abstinence Education. This Act provided a separate appropriation of $50 million for each of the fiscal years1998-2002. This is a permanent appropriation and is counted as mandatory funding under The Budget Enforcement Act.

19361937193819391940
19411942194319441945
19461947194819491950
19511952195319541955
19561957195819591960
19611962196319641965
19661967196819691970
19711972197319741975
197619768
197719781979
Year Title V Health Constant MCH CCS EMIC Special Section Abstinenceor MCH Block Dollars Program Program Projects4 5165 EducationGrant Totals1 (per CPI)2 or MCH Sec. 51013
Block Total3
88
TABLE 33United States Title V or MCH Block Grant Allocations to Each State (showing Constant Dollars forTotal Amounts) By Program Components, FY 1936 - FY 2001: NEVADA
33,157 238,540 24,467 8,69081,212 563,972 60,347 20,86577,957 552,887 57,092 20,86571,416 513,784 50,551 20,86567,718 483,700 43,818 23,900
74,668 507,946 49,947 24,72165,940 404,540 38,593 27,34769,214 400,081 37,956 25,008 6,250
118,182 671,489 44,485 22,799 50,898159,532 886,289 44,691 22,834 92,007
112,370 576,256 48,400 20,000 43,970151,019 677,215 65,646 75,720 9,653107,987 448,079 55,092 51,953 942100,341 421,601 62,591 37,750106,232 440,797 61,694 44,538
150,301 578,081 79,676 70,625143,105 540,019 74,400 68,70545,000 168,539 25,000 20,000
138,402 514,506 72,046 66,356138,943 518,444 72,239 66,704
157,742 579,934 72,586 85,156184,834 657,772 94,582 90,252188,176 651,128 97,195 90,981192,689 662,162 97,667 95,022190,744 644,405 98,482 92,262
222,653 744,659 108,164 114,489237,887 787,705 118,750 119,137237,368 775,712 119,155 118,213259,539 837,223 130,859 128,680 0280,744 891,251 142,902 137,842 0
333,381 1,028,954 167,542 165,839 (81,119)361,289 1,081,704 181,817 179,472 0361,344 1,038,345 181,817 179,527 (104,814)374,961 1,021,692 182,272 192,689 (125,125)389,634 1,004,211 190,501 199,133 (122,097)
402,470 993,753 202,707 199,763 (116,998)406,607 972,744 202,707 203,900 (131,566)
416,1006 937,162 204,300 211,800 (131,600)416,800 845,436 205,100 211,700 (221,000) 0617,230 1,147,268 347,100 213,100 (23,888)7 57,030
637,948 1,121,174 383,400 230,100 24,448159,487 280,293 95,850 57,525 6,112655,400 1,081,518 400,200 255,200 0693,900 1,064,264 427,200 266,700 0716,800 987,328 443,600 273,200 0

1980198119821983198310
19841985
19861987198819891990
19911992199319941995
1996199719981999
200011
200112
Year Title V Health Constant MCH CCS EMIC Special Section Abstinenceor MCH Block Dollars Program Program Projects4 5165 EducationGrant Totals1 (per CPI)2 or MCH Sec. 51013
Block Total3
89
745,100 904,248 462,900 282,200 0800,700 880,858 504,700 296,000 0777,852 806,064 777,8529
779,943 783,075 779,943258,300 259,337 258,300834,309 802,992 834,309999,498 928,901 999,498
956,520 872,737 956,5201,035,960 911,937 1,035,9601,083,654 916,022 1,083,6541,126,574 908,527 1,126,5741,137,378 870,220 1,137,378
1,195,845 878,007 1,195,8451,293,637 922,051 1,293,6371,465,866 1,014,440 1,465,8661,518,129 1,024,379 1,518,1291,510,931 991,425 1,510,931
1,493,428 951,834 1,493,4281,488,536 927,437 1,488,5361,486,743 912,112 1,486,743 157,5341,525,447 915,634 1,525,963 157,534
1,545,737 1,525,963 157,5341,545,737 157,534
1 Total of amounts shown on the table for each year; does not include Special Projects (Program of Projects), Research, Training, or Special Projects ofRegional and National Significance (SPRANS Grants), and Community Integrated Service Systems monies.
2 These are Constant Dollars for the Title V Health Program totals or the MCH Block Grant totals based on adjustments using the Consumer Price Index(CPI) which defined the average of 1982-1984 as the base year of 100%. 2000-2001 CPI data are not available.
3 Prior to 1952, State Program totals include all of Fund A and most of Fund B, including “Reserved” Funds. For later years, various reserved funds are notincluded in the totals since data were not available for States.
4 Includes projects later known as the “Program of Projects” (M&I, C&Y, Family Planning, Dental, Intensive Infant Care); excludes Family Planning moniesallocated to States in 1970-1972 because these were allocated by the National Center for Family Planning Services. These amounts are not includedin the annual totals.
5 Monies required from FY1975-FY1981 to maintain the FY1973 level of Title V funding defined as the “Hold Harmless” funding base. FY1974 monies inthis category were to enable States to plan for the Program of Projects, including management of existing Special Projects.
6 The total amount shown in FY1973 is not necessarily the base for FY1975 funding levels since some Special Projects were funded for 18 months andother adjustments were necessary.
7 Special Projects monies in 1975 are a portion of $10,472,000 impounded by President Nixon in 1973 and released by court order in 1975.
8 These monies are those used to fund the “transition” quarter in 1976 (July-September) when the Federal Fiscal Year changed from July-June to October-September.
9 Beginning in 1982, a single block allocation was made to each State as the MCH Block Grant.
10 This line is the State’s allocation of the $ 105 million appropriated for care of mothers and children under the 1983 Jobs Bill. It is perceived as 1983supplemental funding but was mostly used in 1984.
11 Represents the amount included in the FY2000 Appropriations as of February 2000.
12 The President’s Budget request for FY2001. Does not include Healthy Start, which is proposed for inclusion in the Title V in FY2001 ($90 million).
13 The Personal Responsibility, and Work Opportunity Reconciliation Act of 1996 created a new section, Section 510 to Title V of the SSA for providingformula grant funds to the States for Abstinence Education. This Act provided a separate appropriation of $50 million for each of the fiscal years1998-2002. This is a permanent appropriation and is counted as mandatory funding under The Budget Enforcement Act.

19361937193819391940
19411942194319441945
19461947194819491950
19511952195319541955
19561957195819591960
19611962196319641965
19661967196819691970
19711972197319741975
197619768
197719781979
Year Title V Health Constant MCH CCS EMIC Special Section Abstinenceor MCH Block Dollars Program Program Projects4 5165 EducationGrant Totals1 (per CPI)2 or MCH Sec. 51013
Block Total3
90
TABLE 34United States Title V or MCH Block Grant Allocations to Each State (showing Constant Dollars forTotal Amounts) By Program Components, FY 1936 - FY 2001: NEW HAMPSHIRE
29,287 210,698 18,919 10,36860,972 423,417 36,078 24,89463,218 448,355 38,324 24,89461,325 441,187 36,431 24,89466,397 474,264 39,176 27,221
69,896 475,483 43,406 26,49075,626 463,963 51,887 23,73967,990 393,006 38,966 24,024 5,000
191,076 1,085,659 43,216 24,000 123,860184,297 1,023,872 43,247 24,009 117,041
247,132 1,267,344 42,251 25,640 179,241171,371 768,480 84,966 50,355 36,050107,247 445,008 63,583 32,625 11,039112,918 474,445 69,113 43,805119,666 496,539 69,910 49,756
163,407 628,488 86,677 76,730159,549 602,072 83,084 76,465102,209 382,805 78,235 23,974153,607 571,030 79,909 73,698153,210 571,679 79,735 73,475
172,917 635,724 79,521 93,396201,156 715,858 102,530 98,626203,626 704,588 105,082 98,544208,497 716,485 105,250 103,247206,565 697,855 106,757 99,808
240,479 804,278 116,129 124,350263,604 872,861 131,719 131,885265,203 866,676 132,049 133,154292,067 942,152 145,903 146,164 0319,542 1,014,419 160,321 159,221 0
373,862 1,153,895 187,603 186,259 0401,556 1,202,263 201,144 200,412 (74,950)402,045 1,155,302 201,144 200,901 0420,041 1,144,526 201,981 218,060 (147,400)439,686 1,133,211 214,066 225,620 (77,003)
457,035 1,128,481 229,881 227,154 (102,324)469,481 1,123,160 229,881 239,600 (147,981)476,3006 1,072,748 232,200 244,100 (148,000)525,900 1,066,734 232,200 243,900 (280,000) 49,800
1,023,131 1,901,730 666,000 249,500 (45,084)7 107,631
1,100,000 1,933,216 801,300 298,700 0275,000 483,304 200,325 74,675 0
1,204,400 1,987,459 831,000 373,400 01,203,400 1,845,706 802,000 401,400 01,248,100 1,719,146 823,900 424,200 0

1980198119821983198310
19841985
19861987198819891990
19911992199319941995
1996199719981999
200011
200112
Year Title V Health Constant MCH CCS EMIC Special Section Abstinenceor MCH Block Dollars Program Program Projects4 5165 EducationGrant Totals1 (per CPI)2 or MCH Sec. 51013
Block Total3
91
1,281,300 1,554,976 850,000 431,300 01,371,700 1,509,021 924,500 447,200 01,309,068 1,356,547 1,309,0689
1,312,587 1,317,858 1,312,587434,700 436,446 434,700
1,404,081 1,351,377 1,404,0811,682,082 1,563,273 1,682,082
1,609,752 1,468,752 1,609,7521,743,445 1,534,723 1,743,4451,798,268 1,520,091 1,798,2681,846,451 1,489,073 1,846,4511,858,581 1,422,021 1,858,581
1,924,210 1,412,783 1,924,2102,034,003 1,449,753 2,034,0031,972,506 1,365,056 1,972,5062,000,032 1,349,549 2,000,0321,996,241 1,309,869 1,996,241
1,987,022 1,266,426 1,987,0221,977,243 1,231,927 1,977,2431,975,077 1,211,704 1,975,0771,995,482 1,197,768 1,995,754 82,862
2,006,169 1,995,754 82,8622,006,169 82,862
1 Total of amounts shown on the table for each year; does not include Special Projects (Program of Projects), Research, Training, or Special Projects ofRegional and National Significance (SPRANS Grants), and Community Integrated Service Systems monies.
2 These are Constant Dollars for the Title V Health Program totals or the MCH Block Grant totals based on adjustments using the Consumer Price Index(CPI) which defined the average of 1982-1984 as the base year of 100%. 2000-2001 CPI data are not available.
3 Prior to 1952, State Program totals include all of Fund A and most of Fund B, including “Reserved” Funds. For later years, various reserved funds are notincluded in the totals since data were not available for States.
4 Includes projects later known as the “Program of Projects” (M&I, C&Y, Family Planning, Dental, Intensive Infant Care); excludes Family Planning moniesallocated to States in 1970-1972 because these were allocated by the National Center for Family Planning Services. These amounts are not includedin the annual totals.
5 Monies required from FY1975-FY1981 to maintain the FY1973 level of Title V funding defined as the “Hold Harmless” funding base. FY1974 monies inthis category were to enable States to plan for the Program of Projects, including management of existing Special Projects.
6 The total amount shown in FY1973 is not necessarily the base for FY1975 funding levels since some Special Projects were funded for 18 months andother adjustments were necessary.
7 Special Projects monies in 1975 are a portion of $10,472,000 impounded by President Nixon in 1973 and released by court order in 1975.
8 These monies are those used to fund the “transition” quarter in 1976 (July-September) when the Federal Fiscal Year changed from July-June to October-September.
9 Beginning in 1982, a single block allocation was made to each State as the MCH Block Grant.
10 This line is the State’s allocation of the $ 105 million appropriated for care of mothers and children under the 1983 Jobs Bill. It is perceived as 1983supplemental funding but was mostly used in 1984.
11 Represents the amount included in the FY2000 Appropriations as of February 2000.
12 The President’s Budget request for FY2001. Does not include Healthy Start, which is proposed for inclusion in the Title V in FY2001 ($90 million).
13 The Personal Responsibility, and Work Opportunity Reconciliation Act of 1996 created a new section, Section 510 to Title V of the SSA for providingformula grant funds to the States for Abstinence Education. This Act provided a separate appropriation of $50 million for each of the fiscal years1998-2002. This is a permanent appropriation and is counted as mandatory funding under The Budget Enforcement Act.

19361937193819391940
19411942194319441945
19461947194819491950
19511952195319541955
19561957195819591960
19611962196319641965
19661967196819691970
19711972197319741975
197619768
197719781979
Year Title V Health Constant MCH CCS EMIC Special Section Abstinenceor MCH Block Dollars Program Program Projects4 5165 EducationGrant Totals1 (per CPI)2 or MCH Sec. 51013
Block Total3
92
TABLE 35United States Title V or MCH Block Grant Allocations to Each State (showing Constant Dollars forTotal Amounts) By Program Components, FY 1936 - FY 2001: NEW JERSEY
74,327 534,727 29,524 44,803165,511 1,149,382 71,006 94,505138,331 981,071 70,311 68,020151,306 1,088,532 78,429 72,877169,888 1,213,486 92,534 77,354
179,419 1,220,537 91,400 88,019204,871 1,256,877 116,425 88,446248,233 1,434,873 108,717 84,516 55,000
1,107,546 6,292,875 101,826 82,669 923,0511,405,140 7,806,333 114,750 69,610 1,220,780
1,237,454 6,345,918 104,701 20,000 1,112,753510,034 2,287,148 157,658 172,951 179,425348,882 1,447,643 139,595 150,222 59,065341,485 1,434,811 150,380 191,105325,858 1,352,108 158,819 167,039
384,257 1,477,912 178,657 205,600328,378 1,239,162 173,066 155,312338,064 1,266,157 180,066 157,998314,088 1,167,613 166,341 147,747317,675 1,185,354 168,515 149,160
370,446 1,361,934 170,669 199,777433,443 1,542,502 226,592 206,851442,003 1,529,422 235,723 206,280471,735 1,621,082 238,356 233,379475,117 1,605,125 251,434 223,683
541,604 1,811,385 255,384 286,220734,651 2,432,619 370,775 363,876749,193 2,448,343 379,036 370,157911,237 2,939,474 459,327 451,910 0
1,073,450 3,407,778 540,356 533,094 (753,982)
1,448,142 4,469,574 719,709 728,433 01,631,755 4,885,494 811,768 819,987 (576,585)1,634,357 4,696,428 811,768 822,589 (458,382)1,773,937 4,833,616 822,834 951,103 (687,935)1,826,533 4,707,559 856,509 970,024 (467,100)
2,043,149 5,044,812 1,061,487 981,662 (511,000)2,108,587 5,044,467 1,061,487 1,047,100 (550,000)
2,203,3006 4,962,387 1,102,600 1,100,700 (957,300)2,564,500 5,201,826 1,121,700 1,099,200 (1,052,371) 343,6004,770,000 8,866,171 3,669,400 1,100,600 07 0
4,579,000 8,047,452 3,303,200 1,275,800 01,144,750 2,011,863 825,800 318,950 04,970,100 8,201,485 3,471,500 1,498,600 04,968,800 7,620,859 3,401,600 1,567,200 05,135,400 7,073,554 3,494,800 1,640,600 0

1980198119821983198310
19841985
19861987198819891990
19911992199319941995
1996199719981999
200011
200112
Year Title V Health Constant MCH CCS EMIC Special Section Abstinenceor MCH Block Dollars Program Program Projects4 5165 EducationGrant Totals1 (per CPI)2 or MCH Sec. 51013
Block Total3
93
5,099,600 6,188,835 3,481,900 1,617,700 05,429,100 5,972,607 3,744,800 1,684,300 06,908,970 7,159,554 6,908,9709
6,927,543 6,955,364 6,927,5432,294,250 2,303,464 2,294,2507,410,428 7,132,269 7,410,4288,877,655 8,250,609 8,877,655
8,495,916 7,751,748 8,495,9169,201,513 8,099,923 9,201,5139,811,285 8,293,563 9,811,285
10,368,423 8,361,631 10,368,42310,508,683 8,040,308 10,508,683
11,267,699 8,272,907 11,267,69912,537,096 8,935,920 12,537,09611,512,986 7,967,464 11,512,98611,793,009 7,957,496 11,793,00911,754,445 7,712,890 11,754,445
11,660,661 7,431,906 11,660,66111,612,499 7,235,202 11,612,49911,599,171 7,116,056 11,599,171 843,07111,806,608 7,086,800 11,809,371 843,071
11,915,321 11,809,371 843,07111,915,321 843,071
1 Total of amounts shown on the table for each year; does not include Special Projects (Program of Projects), Research, Training, or Special Projects ofRegional and National Significance (SPRANS Grants), and Community Integrated Service Systems monies.
2 These are Constant Dollars for the Title V Health Program totals or the MCH Block Grant totals based on adjustments using the Consumer Price Index(CPI) which defined the average of 1982-1984 as the base year of 100%. 2000-2001 CPI data are not available.
3 Prior to 1952, State Program totals include all of Fund A and most of Fund B, including “Reserved” Funds. For later years, various reserved funds are notincluded in the totals since data were not available for States.
4 Includes projects later known as the “Program of Projects” (M&I, C&Y, Family Planning, Dental, Intensive Infant Care); excludes Family Planning moniesallocated to States in 1970-1972 because these were allocated by the National Center for Family Planning Services. These amounts are not includedin the annual totals.
5 Monies required from FY1975-FY1981 to maintain the FY1973 level of Title V funding defined as the “Hold Harmless” funding base. FY1974 monies inthis category were to enable States to plan for the Program of Projects, including management of existing Special Projects.
6 The total amount shown in FY1973 is not necessarily the base for FY1975 funding levels since some Special Projects were funded for 18 months andother adjustments were necessary.
7 Special Projects monies in 1975 are a portion of $10,472,000 impounded by President Nixon in 1973 and released by court order in 1975.
8 These monies are those used to fund the “transition” quarter in 1976 (July-September) when the Federal Fiscal Year changed from July-June to October-September.
9 Beginning in 1982, a single block allocation was made to each State as the MCH Block Grant.
10 This line is the State’s allocation of the $ 105 million appropriated for care of mothers and children under the 1983 Jobs Bill. It is perceived as 1983supplemental funding but was mostly used in 1984.
11 Represents the amount included in the FY2000 Appropriations as of February 2000.
12 The President’s Budget request for FY2001. Does not include Healthy Start, which is proposed for inclusion in the Title V in FY2001 ($90 million).
13 The Personal Responsibility, and Work Opportunity Reconciliation Act of 1996 created a new section, Section 510 to Title V of the SSA for providingformula grant funds to the States for Abstinence Education. This Act provided a separate appropriation of $50 million for each of the fiscal years1998-2002. This is a permanent appropriation and is counted as mandatory funding under The Budget Enforcement Act.

19361937193819391940
19411942194319441945
19461947194819491950
19511952195319541955
19561957195819591960
19611962196319641965
19661967196819691970
19711972197319741975
197619768
197719781979
Year Title V Health Constant MCH CCS EMIC Special Section Abstinenceor MCH Block Dollars Program Program Projects4 5165 EducationGrant Totals1 (per CPI)2 or MCH Sec. 51013
Block Total3
94
TABLE 36United States Title V or MCH Block Grant Allocations to Each State (showing Constant Dollars forTotal Amounts) By Program Components, FY 1936 - FY 2001: NEW MEXICO
39,659 285,317 28,873 10,78688,672 615,778 61,958 26,714
110,657 784,801 64,663 45,994102,351 736,338 72,351 30,000130,581 932,721 96,237 34,344
160,111 1,089,190 123,570 36,541162,861 999,147 123,464 39,397195,059 1,127,509 121,320 34,739 39,000304,699 1,731,244 114,809 35,234 154,656404,802 2,248,900 102,984 31,714 270,104
309,961 1,589,544 102,775 36,461 170,725353,627 1,585,771 210,780 74,848 67,999320,795 1,331,100 220,849 75,320 24,626220,451 926,265 146,689 73,762214,877 891,606 161,499 53,378
234,621 902,388 153,791 80,830177,893 671,294 93,251 84,642182,149 682,206 96,477 85,672171,198 636,424 90,503 80,695172,047 641,966 90,872 81,175
196,022 720,669 90,817 105,205229,449 816,544 118,972 110,477231,787 802,031 121,555 110,232238,822 820,694 121,472 117,350237,248 801,514 124,697 112,551
274,398 917,719 133,396 141,002327,560 1,084,636 163,000 164,560324,850 1,061,601 165,712 159,138376,215 1,213,597 189,866 186,349 0433,762 1,377,022 218,912 214,850 0
547,911 1,691,083 277,999 269,912 0613,583 1,837,075 310,922 302,661 0605,431 1,739,744 307,570 297,861 (445,000)617,046 1,681,324 291,940 325,106 0614,782 1,584,490 277,326 337,456 (244,075)
655,519 1,618,565 325,026 330,493 (410,045)673,026 1,610,110 325,026 348,000 (559,242)711,3006 1,602,027 337,200 374,100 (593,200)749,000 1,519,270 340,800 373,900 (614,000) 34,300
1,500,800 2,789,591 1,123,300 377,500 07 0
1,760,900 3,094,728 1,292,500 468,400 0440,225 773,682 323,125 117,100 0
1,979,100 3,265,842 1,408,800 570,300 02,013,000 3,087,423 1,416,300 596,700 02,085,600 2,872,727 1,454,900 630,700 0

1980198119821983198310
19841985
19861987198819891990
19911992199319941995
1996199719981999
200011
200112
Year Title V Health Constant MCH CCS EMIC Special Section Abstinenceor MCH Block Dollars Program Program Projects4 5165 EducationGrant Totals1 (per CPI)2 or MCH Sec. 51013
Block Total3
95
2,198,200 2,667,718 1,562,800 635,400 02,220,200 2,442,464 1,554,800 665,400 02,251,344 2,332,999 2,251,349
2,257,396 2,266,462 2,257,396747,600 750,602 747,600
2,414,748 2,324,108 2,414,7482,892,856 2,688,528 2,892,856
2,768,463 2,525,970 2,768,4632,998,388 2,639,426 2,998,3883,199,066 2,704,198 3,199,0663,382,484 2,727,810 3,382,4843,428,660 2,623,305 3,428,660
3,678,539 2,700,836 3,678,5394,096,444 2,919,775 4,096,4444,414,245 3,054,841 4,414,2454,586,480 3,094,791 4,586,4804,562,760 2,993,937 4,562,760
4,505,076 2,871,304 4,505,0764,491,456 2,798,415 4,491,4564,485,971 2,752,129 4,485,971 518,3684,613,513 2,769,215 4,615,213 518,368
4,680,378 4,615,213 518,3684,680,378 518,368
1 Total of amounts shown on the table for each year; does not include Special Projects (Program of Projects), Research, Training, or Special Projects ofRegional and National Significance (SPRANS Grants), and Community Integrated Service Systems monies.
2 These are Constant Dollars for the Title V Health Program totals or the MCH Block Grant totals based on adjustments using the Consumer Price Index(CPI) which defined the average of 1982-1984 as the base year of 100%. 2000-2001 CPI data are not available.
3 Prior to 1952, State Program totals include all of Fund A and most of Fund B, including “Reserved” Funds. For later years, various reserved funds are notincluded in the totals since data were not available for States.
4 Includes projects later known as the “Program of Projects” (M&I, C&Y, Family Planning, Dental, Intensive Infant Care); excludes Family Planning moniesallocated to States in 1970-1972 because these were allocated by the National Center for Family Planning Services. These amounts are not includedin the annual totals.
5 Monies required from FY1975-FY1981 to maintain the FY1973 level of Title V funding defined as the “Hold Harmless” funding base. FY1974 monies inthis category were to enable States to plan for the Program of Projects, including management of existing Special Projects.
6 The total amount shown in FY1973 is not necessarily the base for FY1975 funding levels since some Special Projects were funded for 18 months andother adjustments were necessary.
7 Special Projects monies in 1975 are a portion of $10,472,000 impounded by President Nixon in 1973 and released by court order in 1975.
8 These monies are those used to fund the “transition” quarter in 1976 (July-September) when the Federal Fiscal Year changed from July-June to October-September.
9 Beginning in 1982, a single block allocation was made to each State as the MCH Block Grant.
10 This line is the State’s allocation of the $ 105 million appropriated for care of mothers and children under the 1983 Jobs Bill. It is perceived as 1983supplemental funding but was mostly used in 1984.
11 Represents the amount included in the FY2000 Appropriations as of February 2000.
12 The President’s Budget request for FY2001. Does not include Healthy Start, which is proposed for inclusion in the Title V in FY2001 ($90 million).
13 The Personal Responsibility, and Work Opportunity Reconciliation Act of 1996 created a new section, Section 510 to Title V of the SSA for providingformula grant funds to the States for Abstinence Education. This Act provided a separate appropriation of $50 million for each of the fiscal years1998-2002. This is a permanent appropriation and is counted as mandatory funding under The Budget Enforcement Act.

19361937193819391940
19411942194319441945
19461947194819491950
19511952195319541955
19561957195819591960
19611962196319641965
19661967196819691970
19711972197319741975
197619768
197719781979
Year Title V Health Constant MCH CCS EMIC Special Section Abstinenceor MCH Block Dollars Program Program Projects4 5165 EducationGrant Totals1 (per CPI)2 or MCH Sec. 51013
Block Total3
96
TABLE 37United States Title V or MCH Block Grant Allocations to Each State (showing Constant Dollars forTotal Amounts) By Program Components, FY 1936 - FY 2001: NEW YORK
147,441 1,060,727 82,904 64,537329,075 2,285,243 182,018 147,057324,209 2,299,355 177,153 147,056319,448 2,298,187 172,391 147,057356,531 2,546,650 209,474 147,057
424,193 2,885,667 244,400 179,793418,425 2,567,025 244,080 174,345420,359 2,429,821 245,829 174,530 0
3,735,495 21,224,403 249,423 120,510 3,365,5624,846,445 26,924,694 256,740 81,577 4,508,128
5,242,702 26,885,651 287,552 139,785 4,815,3652,646,849 11,869,278 408,799 187,887 2,050,163
863,226 3,581,851 387,269 176,403 299,554602,432 2,531,227 402,386 200,046603,030 2,502,199 382,114 220,916
738,285 2,839,558 433,145 305,140722,399 2,726,034 387,010 335,389751,419 2,814,303 404,123 347,296688,374 2,559,011 369,928 318,446707,001 2,638,063 387,524 319,477
829,644 3,050,162 399,273 430,3711,036,700 3,689,324 579,824 456,8761,060,706 3,670,263 606,587 454,1191,124,358 3,863,773 618,721 505,6371,091,973 3,689,098 619,187 472,786
1,249,489 4,178,893 637,761 611,7281,797,672 5,952,556 979,910 817,7621,813,102 5,925,170 953,634 859,4682,236,074 7,213,142 1,205,247 1,030,827 (1,426,718)2,649,301 8,410,479 1,408,299 1,241,002 (382,471)
3,578,185 11,043,781 1,888,859 1,689,326 (5,987,356)3,884,931 11,631,530 1,978,136 1,906,795 (10,322,930)3,996,876 11,485,276 2,084,182 1,912,694 (9,594,817)4,354,091 11,864,008 2,142,892 2,211,199 (13,096,783)4,378,457 11,284,683 2,155,852 2,222,605 (10,051,164)
4,902,630 12,105,259 2,651,940 2,250,690 (11,760,000)5,045,140 12,069,713 2,651,940 2,393,200 (12,839,975)
5,109,4006 11,507,658 2,640,400 2,469,000 (15,337,600)5,135,100 10,416,024 2,669,500 2,465,600 (14,571,431) 0
18,686,003 34,732,348 8,712,300 2,594,400 (3,091,044)7 7,379,303
21,366,838 37,551,561 9,747,400 3,220,500 8,398,9385,341,710 9,387,891 2,436,850 805,125 2,099,735
21,366,838 35,258,809 9,799,600 3,990,700 7,576,53821,366,832 32,771,215 10,212,800 4,359,000 6,795,03221,366,832 29,430,898 10,492,200 4,604,000 6,270,632

1980198119821983198310
19841985
19861987198819891990
19911992199319941995
1996199719981999
200011
200112
Year Title V Health Constant MCH CCS EMIC Special Section Abstinenceor MCH Block Dollars Program Program Projects4 5165 EducationGrant Totals1 (per CPI)2 or MCH Sec. 51013
Block Total3
97
21,366,832 25,930,621 10,548,300 4,738,000 6,080,53221,366,832 23,505,866 11,140,000 4,959,500 5,267,33223,329,236 24,175,374 23,329,2369
23,391,949 23,485,893 23,391,9497,746,900 7,778,012 7,746,900
25,022,487 24,083,241 25,022,48729,976,814 27,859,493 29,976,814
28,687,816 26,175,015 28,687,81631,070,372 27,350,680 31,070,37233,009,716 27,903,395 33,009,71634,777,901 28,046,694 34,777,90135,223,041 26,949,534 35,223,041
37,631,897 27,629,880 37,631,89741,660,599 29,693,941 41,660,59940,318,047 27,901,763 40,318,04741,439,904 27,962,148 41,439,90441,285,407 27,090,162 41,285,407
40,909,679 26,073,728 40,909,67940,751,569 25,390,386 40,751,56940,704,075 24,971,825 40,704,075 3,377,58441,535,027 24,930,989 41,546,099 3,377,584
41,970,563 41,546,099 3,377,58441,970,563 3,377,584
1 Total of amounts shown on the table for each year; does not include Special Projects (Program of Projects), Research, Training, or Special Projects ofRegional and National Significance (SPRANS Grants), and Community Integrated Service Systems monies.
2 These are Constant Dollars for the Title V Health Program totals or the MCH Block Grant totals based on adjustments using the Consumer Price Index(CPI) which defined the average of 1982-1984 as the base year of 100%. 2000-2001 CPI data are not available.
3 Prior to 1952, State Program totals include all of Fund A and most of Fund B, including “Reserved” Funds. For later years, various reserved funds are notincluded in the totals since data were not available for States.
4 Includes projects later known as the “Program of Projects” (M&I, C&Y, Family Planning, Dental, Intensive Infant Care); excludes Family Planning moniesallocated to States in 1970-1972 because these were allocated by the National Center for Family Planning Services. These amounts are not includedin the annual totals.
5 Monies required from FY1975-FY1981 to maintain the FY1973 level of Title V funding defined as the “Hold Harmless” funding base. FY1974 monies inthis category were to enable States to plan for the Program of Projects, including management of existing Special Projects.
6 The total amount shown in FY1973 is not necessarily the base for FY1975 funding levels since some Special Projects were funded for 18 months andother adjustments were necessary.
7 Special Projects monies in 1975 are a portion of $10,472,000 impounded by President Nixon in 1973 and released by court order in 1975.
8 These monies are those used to fund the “transition” quarter in 1976 (July-September) when the Federal Fiscal Year changed from July-June to October-September.
9 Beginning in 1982, a single block allocation was made to each State as the MCH Block Grant.
10 This line is the State’s allocation of the $ 105 million appropriated for care of mothers and children under the 1983 Jobs Bill. It is perceived as 1983supplemental funding but was mostly used in 1984.
11 Represents the amount included in the FY2000 Appropriations as of February 2000.
12 The President’s Budget request for FY2001. Does not include Healthy Start, which is proposed for inclusion in the Title V in FY2001 ($90 million).
13 The Personal Responsibility, and Work Opportunity Reconciliation Act of 1996 created a new section, Section 510 to Title V of the SSA for providingformula grant funds to the States for Abstinence Education. This Act provided a separate appropriation of $50 million for each of the fiscal years1998-2002. This is a permanent appropriation and is counted as mandatory funding under The Budget Enforcement Act.

19361937193819391940
19411942194319441945
19461947194819491950
19511952195319541955
19561957195819591960
19611962196319641965
19661967196819691970
19711972197319741975
197619768
197719781979
Year Title V Health Constant MCH CCS EMIC Special Section Abstinenceor MCH Block Dollars Program Program Projects4 5165 EducationGrant Totals1 (per CPI)2 or MCH Sec. 51013
Block Total3
98
TABLE 38United States Title V or MCH Block Grant Allocations to Each State (showing Constant Dollars forTotal Amounts) By Program Components, FY 1936 - FY 2001: NORTH CAROLINA
82,830 595,899 50,121 32,709217,415 1,509,826 137,852 79,563205,979 1,460,844 128,665 77,314211,366 1,520,619 114,829 96,537260,969 1,864,064 156,030 104,939
303,264 2,063,020 190,016 113,248312,148 1,915,018 193,107 119,041391,867 2,265,127 205,131 117,236 69,500
1,050,296 5,967,591 189,557 122,714 738,0251,657,148 9,206,378 188,957 119,032 1,349,159
1,336,872 6,855,754 175,508 119,982 1,041,382629,771 2,824,085 265,080 205,358 159,333599,771 2,488,676 366,457 228,027 5,287704,662 2,960,765 341,948 362,714724,679 3,006,967 448,111 276,568
910,196 3,500,754 572,492 337,704923,221 3,483,853 465,456 457,765989,214 3,704,921 505,589 483,625888,080 3,301,413 446,374 441,706883,543 3,296,802 445,889 437,654
1,051,967 3,867,526 442,206 609,7611,141,519 4,062,345 549,514 592,0051,158,351 4,008,135 570,057 588,2941,193,088 4,099,959 565,755 627,3331,195,464 4,038,730 583,610 611,854
1,364,171 4,562,445 601,819 762,3521,778,648 5,889,563 823,478 955,1701,759,720 5,750,719 800,809 958,9112,043,717 6,592,635 942,863 1,100,854 02,311,433 7,337,883 1,076,625 1,234,808 0
2,911,086 8,984,833 1,390,238 1,520,848 (241,782)3,242,802 9,708,988 1,539,029 1,703,773 (1,036,340)3,257,918 9,361,833 1,539,200 1,718,718 (1,049,109)3,441,773 9,378,128 1,526,191 1,915,582 (595,066)3,457,883 8,912,070 1,512,631 1,945,252 (988,232)
3,847,058 9,498,909 1,887,202 1,959,856 (896,144)3,915,202 9,366,512 1,887,202 2,028,000 (988,860)
4,025,2006 9,065,766 1,911,900 2,113,300 (988,900)4,635,600 9,402,840 1,835,300 2,111,300 (1,038,000) 689,0008,159,900 15,167,100 6,126,600 2,033,300 07 0
9,298,000 16,340,949 6,885,500 2,412,500 0/ 2,324,500 4,085,237 1,721,375 603,125 0
10,147,100 16,744,389 7,216,500 2,930,600 010,135,600 15,545,399 6,978,900 3,156,700 010,508,800 14,474,931 7,169,300 3,339,500 0

1980198119821983198310
19841985
19861987198819891990
19911992199319941995
1996199719981999
200011
200112
Year Title V Health Constant MCH CCS EMIC Special Section Abstinenceor MCH Block Dollars Program Program Projects4 5165 EducationGrant Totals1 (per CPI)2 or MCH Sec. 51013
Block Total3
99
10,348,700 12,559,102 7,033,000 3,315,700 010,525,400 11,579,098 7,092,200 3,433,200 09,928,680 10,288,788 9,928,6809
9,955,370 9,995,351 9,955,3703,297,000 3,310,241 3,297,000
10,649,310 10,249,577 10,649,31012,757,820 11,856,710 12,757,820
12,209,234 11,139,812 12,209,23413,223,227 11,640,165 13,223,22713,889,630 11,741,023 13,889,63014,491,914 11,687,027 14,491,91414,643,539 11,203,932 14,643,539
15,464,016 11,353,903 15,464,01616,836,319 12,000,227 16,836,31916,383,535 11,338,087 16,383,53516,766,218 11,313,238 16,766,21816,713,517 10,966,875 16,713,517
16,585,350 10,570,650 16,585,35016,515,634 10,290,115 16,515,63416,496,757 10,120,710 16,496,757 1,151,87616,780,254 10,072,181 16,784,030 1,151,876
16,928,823 16,784,030 1,151,87616,928,823 1,151,876
1 Total of amounts shown on the table for each year; does not include Special Projects (Program of Projects), Research, Training, or Special Projects ofRegional and National Significance (SPRANS Grants), and Community Integrated Service Systems monies.
2 These are Constant Dollars for the Title V Health Program totals or the MCH Block Grant totals based on adjustments using the Consumer Price Index(CPI) which defined the average of 1982-1984 as the base year of 100%. 2000-2001 CPI data are not available.
3 Prior to 1952, State Program totals include all of Fund A and most of Fund B, including “Reserved” Funds. For later years, various reserved funds are notincluded in the totals since data were not available for States.
4 Includes projects later known as the “Program of Projects” (M&I, C&Y, Family Planning, Dental, Intensive Infant Care); excludes Family Planning moniesallocated to States in 1970-1972 because these were allocated by the National Center for Family Planning Services. These amounts are not includedin the annual totals.
5 Monies required from FY1975-FY1981 to maintain the FY1973 level of Title V funding defined as the “Hold Harmless” funding base. FY1974 monies inthis category were to enable States to plan for the Program of Projects, including management of existing Special Projects.
6 The total amount shown in FY1973 is not necessarily the base for FY1975 funding levels since some Special Projects were funded for 18 months andother adjustments were necessary.
7 Special Projects monies in 1975 are a portion of $10,472,000 impounded by President Nixon in 1973 and released by court order in 1975.
8 These monies are those used to fund the “transition” quarter in 1976 (July-September) when the Federal Fiscal Year changed from July-June to October-September.
9 Beginning in 1982, a single block allocation was made to each State as the MCH Block Grant.
10 This line is the State’s allocation of the $ 105 million appropriated for care of mothers and children under the 1983 Jobs Bill. It is perceived as 1983supplemental funding but was mostly used in 1984.
11 Represents the amount included in the FY2000 Appropriations as of February 2000.
12 The President’s Budget request for FY2001. Does not include Healthy Start, which is proposed for inclusion in the Title V in FY2001 ($90 million).
13 The Personal Responsibility, and Work Opportunity Reconciliation Act of 1996 created a new section, Section 510 to Title V of the SSA for providingformula grant funds to the States for Abstinence Education. This Act provided a separate appropriation of $50 million for each of the fiscal years1998-2002. This is a permanent appropriation and is counted as mandatory funding under The Budget Enforcement Act.

19361937193819391940
19411942194319441945
19461947194819491950
19511952195319541955
19561957195819591960
19611962196319641965
19661967196819691970
19711972197319741975
197619768
197719781979
Year Title V Health Constant MCH CCS EMIC Special Section Abstinenceor MCH Block Dollars Program Program Projects4 5165 EducationGrant Totals1 (per CPI)2 or MCH Sec. 51013
Block Total3
100
TABLE 39United States Title V or MCH Block Grant Allocations to Each State (showing Constant Dollars forTotal Amounts) By Program Components, FY 1936 - FY 2001: NORTH DAKOTA
31,099 223,734 18,928 12,17177,275 536,632 48,052 29,22378,032 553,418 48,809 29,22373,051 525,547 43,828 29,22394,193 672,807 57,720 36,473
100,288 682,231 61,025 39,26381,120 497,669 42,159 38,96188,679 512,595 50,534 38,145 0
155,705 884,688 58,929 42,448 54,328246,934 1,371,856 58,486 42,235 146,213
215,697 1,106,138 59,882 37,850 117,965269,033 1,206,426 110,901 90,472 67,660156,274 648,440 73,881 76,539 5,854134,750 566,176 78,382 56,368123,914 514,166 71,408 52,506
172,904 665,015 93,876 79,028169,477 639,536 88,237 81,240174,700 654,307 91,226 83,474163,317 607,126 85,432 77,885161,927 604,205 84,793 77,134
183,418 674,331 84,436 98,982212,876 757,566 109,070 103,806215,266 744,865 111,428 103,838219,948 755,835 111,060 108,888216,194 730,385 111,545 104,649
251,414 840,849 120,738 130,676280,762 929,675 138,460 142,302277,494 906,843 139,125 138,369310,633 1,002,042 152,746 157,887 0336,365 1,067,825 165,979 170,386 0
398,958 1,231,352 193,185 205,773 0432,902 1,296,114 204,696 228,206 0435,771 1,252,216 204,696 231,075 0453,452 1,235,564 202,875 250,577 0452,014 1,164,985 204,021 247,993 0
459,260 1,133,975 216,561 242,699 0475,261 1,136,988 216,561 258,700 0
490,1006 1,103,829 218,600 271,500 0584,300 1,185,193 217,700 271,400 0 95,200924,300 1,718,030 668,300 256,000 07 0
886,500 1,557,996 611,200 275,300 0221,625 389,499 152,800 68,825 0966,700 1,595,215 650,700 316,000 0
1,076,400 1,650,920 737,600 338,800 01,115,800 1,536,915 757,700 358,100 0

1980198119821983198310
19841985
19861987198819891990
19911992199319941995
1996199719981999
200011
200112
Year Title V Health Constant MCH CCS EMIC Special Section Abstinenceor MCH Block Dollars Program Program Projects4 5165 EducationGrant Totals1 (per CPI)2 or MCH Sec. 51013
Block Total3
101
1,216,400 1,476,214 829,400 387,000 01,259,000 1,385,039 857,800 401,200 01,182,588 1,225,480 1,182,5889
1,185,767 1,190,529 1,185,767392,700 394,277 392,700
1,268,421 1,220,809 1,268,4211,519,562 1,412,232 1,519,562
1,454,221 1,326,844 1,454,2211,574,996 1,386,440 1,574,9961,635,874 1,382,818 1,635,8741,690,130 1,363,008 1,690,1301,703,789 1,303,588 1,703,789
1,777,696 1,305,210 1,777,6961,901,324 1,355,185 1,901,3241,921,152 1,329,517 1,921,1521,963,034 1,324,584 1,963,0341,957,266 1,284,295 1,957,266
1,943,239 1,238,521 1,943,2391,934,841 1,205,508 1,934,8411,932,644 1,185,671 1,932,644 126,2201,963,673 1,178,675 1,964,086 126,220
1,979,933 1,964,086 126,2201,979,933 126,220
1 Total of amounts shown on the table for each year; does not include Special Projects (Program of Projects), Research, Training, or Special Projects ofRegional and National Significance (SPRANS Grants), and Community Integrated Service Systems monies.
2 These are Constant Dollars for the Title V Health Program totals or the MCH Block Grant totals based on adjustments using the Consumer Price Index(CPI) which defined the average of 1982-1984 as the base year of 100%. 2000-2001 CPI data are not available.
3 Prior to 1952, State Program totals include all of Fund A and most of Fund B, including “Reserved” Funds. For later years, various reserved funds are notincluded in the totals since data were not available for States.
4 Includes projects later known as the “Program of Projects” (M&I, C&Y, Family Planning, Dental, Intensive Infant Care); excludes Family Planning moniesallocated to States in 1970-1972 because these were allocated by the National Center for Family Planning Services. These amounts are not includedin the annual totals.
5 Monies required from FY1975-FY1981 to maintain the FY1973 level of Title V funding defined as the “Hold Harmless” funding base. FY1974 monies inthis category were to enable States to plan for the Program of Projects, including management of existing Special Projects.
6 The total amount shown in FY1973 is not necessarily the base for FY1975 funding levels since some Special Projects were funded for 18 months andother adjustments were necessary.
7 Special Projects monies in 1975 are a portion of $10,472,000 impounded by President Nixon in 1973 and released by court order in 1975.
8 These monies are those used to fund the “transition” quarter in 1976 (July-September) when the Federal Fiscal Year changed from July-June to October-September.
9 Beginning in 1982, a single block allocation was made to each State as the MCH Block Grant.
10 This line is the State’s allocation of the $ 105 million appropriated for care of mothers and children under the 1983 Jobs Bill. It is perceived as 1983supplemental funding but was mostly used in 1984.
11 Represents the amount included in the FY2000 Appropriations as of February 2000.
12 The President’s Budget request for FY2001. Does not include Healthy Start, which is proposed for inclusion in the Title V in FY2001 ($90 million).
13 The Personal Responsibility, and Work Opportunity Reconciliation Act of 1996 created a new section, Section 510 to Title V of the SSA for providingformula grant funds to the States for Abstinence Education. This Act provided a separate appropriation of $50 million for each of the fiscal years1998-2002. This is a permanent appropriation and is counted as mandatory funding under The Budget Enforcement Act.

19361937193819391940
19411942194319441945
19461947194819491950
19511952195319541955
19561957195819591960
19611962196319641965
19661967196819691970
19711972197319741975
197619768
197719781979
Year Title V Health Constant MCH CCS EMIC Special Section Abstinenceor MCH Block Dollars Program Program Projects4 5165 EducationGrant Totals1 (per CPI)2 or MCH Sec. 51013
Block Total3
102
TABLE 40United States Title V or MCH Block Grant Allocations to Each State (showing Constant Dollars forTotal Amounts) By Program Components, FY 1936 - FY 2001: OHIO
92,349 664,381 47,699 44,650273,838 1,901,653 115,136 158,702248,543 1,762,716 104,035 144,508232,729 1,674,309 116,859 115,870272,133 1,943,807 148,216 123,917
302,413 2,057,231 158,400 144,013285,564 1,751,926 177,267 108,297281,224 1,625,572 151,790 129,434 0
2,097,714 11,918,830 156,164 109,351 1,832,1992,511,369 13,952,050 174,768 105,319 2,231,282
2,054,628 10,536,554 190,566 100,032 1,764,030705,073 3,161,762 258,637 182,386 264,050484,108 2,008,747 272,540 207,577 3,991514,210 2,160,546 285,396 228,814519,675 2,156,328 337,133 182,542
676,313 2,601,204 417,228 259,085697,993 2,633,936 382,651 315,342780,091 2,921,689 415,049 365,042680,815 2,530,911 360,262 320,553677,274 2,527,142 358,432 318,842
804,191 2,956,585 358,482 445,709952,878 3,391,025 482,972 469,906
1,014,320 3,509,758 530,014 484,3061,079,582 3,709,904 535,939 543,6431,136,884 3,840,824 610,218 526,666
1,287,182 4,304,957 628,849 658,3331,820,912 6,029,510 935,567 885,3451,905,200 6,226,144 950,170 955,0302,234,222 7,207,168 1,108,177 1,126,045 02,540,197 8,064,117 1,238,875 1,301,322 (1,311,766)
3,280,803 10,125,935 1,619,506 1,661,297 (2,080,444)3,694,732 11,062,072 1,816,894 1,877,838 (1,673,208)3,694,182 10,615,466 1,812,050 1,882,132 (3,316,011)3,935,763 10,724,150 1,796,267 2,139,496 (4,203,439)4,002,875 10,316,688 1,829,608 2,173,267 (3,404,151)
4,467,677 11,031,301 2,260,887 2,206,790 (3,645,395)4,658,287 11,144,227 2,260,887 2,397,400 (4,304,321)
4,810,7006 10,834,910 2,347,600 2,463,100 (5,379,300)4,812,900 9,762,475 2,351,400 2,461,500 (5,663,000) 0
10,526,038 19,565,126 7,770,200 2,516,700 (100,171)7 239,138
11,582,100 20,355,185 8,581,600 3,000,500 02,895,525 5,088,796 2,145,400 750,125 0
12,225,000 20,173,267 8,634,200 3,590,800 012,672,600 19,436,503 8,841,400 3,831,200 013,132,800 18,089,256 9,083,000 4,049,800 0

1980198119821983198310
19841985
19861987198819891990
19911992199319941995
1996199719981999
200011
200112
Year Title V Health Constant MCH CCS EMIC Special Section Abstinenceor MCH Block Dollars Program Program Projects4 5165 EducationGrant Totals1 (per CPI)2 or MCH Sec. 51013
Block Total3
103
12,679,500 15,387,743 8,730,500 3,949,000 013,089,500 14,399,890 9,061,100 4,028,400 013,261,428 13,742,412 13,261,4289
13,297,077 13,350,479 13,297,0774,403,700 4,421,386 4,403,700
14,223,951 13,690,039 14,223,95117,040,222 15,836,638 17,040,222
16,307,492 14,879,099 16,307,49217,661,851 15,547,404 17,661,85118,558,668 15,687,801 18,558,66819,369,474 15,620,544 19,369,47419,573,594 14,975,971 19,573,594
20,678,138 15,182,186 20,678,13822,525,555 16,055,278 22,525,55523,384,342 16,182,936 23,384,34224,078,972 16,247,619 24,078,97223,983,311 15,737,081 23,983,311
23,750,668 15,137,456 23,750,66823,662,248 14,742,834 23,662,24823,634,449 14,499,662 23,634,449 2,091,29924,148,929 14,495,155 24,155,784 2,091,299
24,418,602 24,155,784 2,091,29924,418,602 2,091,299
1 Total of amounts shown on the table for each year; does not include Special Projects (Program of Projects), Research, Training, or Special Projects ofRegional and National Significance (SPRANS Grants), and Community Integrated Service Systems monies.
2 These are Constant Dollars for the Title V Health Program totals or the MCH Block Grant totals based on adjustments using the Consumer Price Index(CPI) which defined the average of 1982-1984 as the base year of 100%. 2000-2001 CPI data are not available.
3 Prior to 1952, State Program totals include all of Fund A and most of Fund B, including “Reserved” Funds. For later years, various reserved funds are notincluded in the totals since data were not available for States.
4 Includes projects later known as the “Program of Projects” (M&I, C&Y, Family Planning, Dental, Intensive Infant Care); excludes Family Planning moniesallocated to States in 1970-1972 because these were allocated by the National Center for Family Planning Services. These amounts are not includedin the annual totals.
5 Monies required from FY1975-FY1981 to maintain the FY1973 level of Title V funding defined as the “Hold Harmless” funding base. FY1974 monies inthis category were to enable States to plan for the Program of Projects, including management of existing Special Projects.
6 The total amount shown in FY1973 is not necessarily the base for FY1975 funding levels since some Special Projects were funded for 18 months andother adjustments were necessary.
7 Special Projects monies in 1975 are a portion of $10,472,000 impounded by President Nixon in 1973 and released by court order in 1975.
8 These monies are those used to fund the “transition” quarter in 1976 (July-September) when the Federal Fiscal Year changed from July-June to October-September.
9 Beginning in 1982, a single block allocation was made to each State as the MCH Block Grant.
10 This line is the State’s allocation of the $ 105 million appropriated for care of mothers and children under the 1983 Jobs Bill. It is perceived as 1983supplemental funding but was mostly used in 1984.
11 Represents the amount included in the FY2000 Appropriations as of February 2000.
12 The President’s Budget request for FY2001. Does not include Healthy Start, which is proposed for inclusion in the Title V in FY2001 ($90 million).
13 The Personal Responsibility, and Work Opportunity Reconciliation Act of 1996 created a new section, Section 510 to Title V of the SSA for providingformula grant funds to the States for Abstinence Education. This Act provided a separate appropriation of $50 million for each of the fiscal years1998-2002. This is a permanent appropriation and is counted as mandatory funding under The Budget Enforcement Act.

19361937193819391940
19411942194319441945
19461947194819491950
19511952195319541955
19561957195819591960
19611962196319641965
19661967196819691970
19711972197319741975
197619768
197719781979
Year Title V Health Constant MCH CCS EMIC Special Section Abstinenceor MCH Block Dollars Program Program Projects4 5165 EducationGrant Totals1 (per CPI)2 or MCH Sec. 51013
Block Total3
104
TABLE 41United States Title V or MCH Block Grant Allocations to Each State (showing Constant Dollars forTotal Amounts) By Program Components, FY 1936 - FY 2001: OKLAHOMA
47,398 340,993 25,869 21,529140,890 978,403 79,086 61,804169,572 1,202,638 75,586 93,986167,418 1,204,446 89,874 77,544183,642 1,311,729 100,503 83,139
196,818 1,338,898 108,483 88,335186,793 1,145,969 85,931 100,862290,124 1,677,017 114,236 92,388 83,500892,212 5,069,386 102,977 106,606 682,629
1,120,661 6,225,894 104,008 104,648 912,005
723,125 3,708,333 105,687 96,560 520,878510,602 2,289,695 194,927 157,881 157,794371,570 1,541,784 148,901 186,424 36,245354,140 1,487,983 162,274 191,866371,030 1,539,544 161,858 209,172
406,712 1,564,277 171,651 235,061362,014 1,366,091 174,630 187,384364,687 1,365,869 166,901 197,786342,951 1,274,911 164,594 178,357336,784 1,256,657 159,653 177,131
393,527 1,446,790 155,067 238,460404,130 1,438,185 185,444 218,686398,267 1,378,087 184,704 213,563406,873 1,398,189 177,855 229,018408,146 1,378,872 185,140 223,006
470,097 1,572,231 192,303 277,794597,767 1,979,361 256,620 341,147569,389 1,860,748 253,248 316,141667,280 2,152,516 298,006 369,274 0769,514 2,442,902 348,599 420,915 0
976,845 3,014,954 449,011 527,834 01,100,333 3,294,410 512,737 587,596 01,086,780 3,122,931 510,518 576,262 01,141,429 3,110,161 496,724 644,705 (190,315)1,135,753 2,927,198 483,120 652,633 0
1,273,672 3,144,869 606,840 666,832 01,327,840 3,176,651 606,840 721,000 0
1,376,8006 3,100,901 622,600 754,200 (660,000)1,532,000 3,107,505 624,600 753,700 (760,000) 153,7002,802,100 5,208,364 2,064,300 737,800 07 0
3,275,500 5,756,591 2,389,000 886,500 0818,875 1,439,148 597,250 221,625 0
3,621,100 5,975,413 2,525,600 1,095,500 03,724,500 5,712,423 2,602,000 1,122,500 03,859,800 5,316,529 2,673,100 1,186,700 0

1980198119821983198310
19841985
19861987198819891990
19911992199319941995
1996199719981999
200011
200112
Year Title V Health Constant MCH CCS EMIC Special Section Abstinenceor MCH Block Dollars Program Program Projects4 5165 EducationGrant Totals1 (per CPI)2 or MCH Sec. 51013
Block Total3
105
3,935,000 4,775,485 2,700,600 1,234,400 04,033,600 4,437,404 2,786,300 1,247,300 04,069,494 4,217,092 4,069,4949
4,080,434 4,096,821 4,080,4341,351,350 1,356,777 1,351,3504,364,861 4,201,021 4,364,8615,229,081 4,859,741 5,229,081
5,004,231 4,565,904 5,004,2315,419,839 4,770,985 5,419,8395,713,678 4,829,821 5,713,6785,980,100 4,822,661 5,980,1006,047,172 4,626,757 6,047,172
6,410,118 4,706,401 6,410,1187,017,154 5,001,535 7,017,1547,488,549 5,182,387 7,488,5497,739,922 5,222,619 7,739,9227,705,304 5,055,974 7,705,304
7,621,115 4,857,307 7,621,1157,594,960 4,732,062 7,594,9607,585,891 4,653,921 7,585,891 756,8377,772,054 4,665,098 7,774,535 756,837
7,869,643 7,774,535 756,8377,869,643 756,837
1 Total of amounts shown on the table for each year; does not include Special Projects (Program of Projects), Research, Training, or Special Projects ofRegional and National Significance (SPRANS Grants), and Community Integrated Service Systems monies.
2 These are Constant Dollars for the Title V Health Program totals or the MCH Block Grant totals based on adjustments using the Consumer Price Index(CPI) which defined the average of 1982-1984 as the base year of 100%. 2000-2001 CPI data are not available.
3 Prior to 1952, State Program totals include all of Fund A and most of Fund B, including “Reserved” Funds. For later years, various reserved funds are notincluded in the totals since data were not available for States.
4 Includes projects later known as the “Program of Projects” (M&I, C&Y, Family Planning, Dental, Intensive Infant Care); excludes Family Planning moniesallocated to States in 1970-1972 because these were allocated by the National Center for Family Planning Services. These amounts are not includedin the annual totals.
5 Monies required from FY1975-FY1981 to maintain the FY1973 level of Title V funding defined as the “Hold Harmless” funding base. FY1974 monies inthis category were to enable States to plan for the Program of Projects, including management of existing Special Projects.
6 The total amount shown in FY1973 is not necessarily the base for FY1975 funding levels since some Special Projects were funded for 18 months andother adjustments were necessary.
7 Special Projects monies in 1975 are a portion of $10,472,000 impounded by President Nixon in 1973 and released by court order in 1975.
8 These monies are those used to fund the “transition” quarter in 1976 (July-September) when the Federal Fiscal Year changed from July-June to October-September.
9 Beginning in 1982, a single block allocation was made to each State as the MCH Block Grant.
10 This line is the State’s allocation of the $ 105 million appropriated for care of mothers and children under the 1983 Jobs Bill. It is perceived as 1983supplemental funding but was mostly used in 1984.
11 Represents the amount included in the FY2000 Appropriations as of February 2000.
12 The President’s Budget request for FY2001. Does not include Healthy Start, which is proposed for inclusion in the Title V in FY2001 ($90 million).
13 The Personal Responsibility, and Work Opportunity Reconciliation Act of 1996 created a new section, Section 510 to Title V of the SSA for providingformula grant funds to the States for Abstinence Education. This Act provided a separate appropriation of $50 million for each of the fiscal years1998-2002. This is a permanent appropriation and is counted as mandatory funding under The Budget Enforcement Act.

19361937193819391940
19411942194319441945
19461947194819491950
19511952195319541955
19561957195819591960
19611962196319641965
19661967196819691970
19711972197319741975
197619768
197719781979
Year Title V Health Constant MCH CCS EMIC Special Section Abstinenceor MCH Block Dollars Program Program Projects4 5165 EducationGrant Totals1 (per CPI)2 or MCH Sec. 51013
Block Total3
106
TABLE 42United States Title V or MCH Block Grant Allocations to Each State (showing Constant Dollars forTotal Amounts) By Program Components, FY 1936 - FY 2001: OREGON
32,464 233,554 20,177 12,28767,813 470,924 38,312 29,50172,263 512,504 42,762 29,50181,771 588,281 52,270 29,50196,451 688,936 64,904 31,547
129,395 880,238 64,043 65,352116,626 715,497 72,475 44,15194,037 543,566 53,324 40,713 0
466,893 2,652,801 64,167 58,131 344,595664,092 3,689,400 65,288 57,096 541,708
514,878 2,640,400 66,430 46,827 401,621352,066 1,578,771 112,765 114,414 124,887235,939 979,000 98,585 106,223 31,131172,916 726,538 100,342 72,574152,118 631,195 90,248 61,870
213,976 822,985 121,488 92,488202,904 765,675 107,638 95,266212,789 796,963 111,543 101,246197,655 734,777 104,513 93,142197,811 738,101 103,913 93,898
238,154 875,566 105,428 132,726278,271 990,288 142,466 135,805284,900 985,813 145,294 139,606298,690 1,026,426 147,127 151,563302,663 1,022,510 151,401 151,262
346,037 1,157,314 157,649 188,388441,520 1,461,987 208,206 233,314397,673 1,299,585 178,622 219,051504,526 1,627,503 247,376 257,150 0583,452 1,852,229 287,982 295,470 (85,366)
706,326 2,180,019 348,643 357,683 (99,093)777,675 2,328,368 375,918 401,757 (213,263)795,825 2,286,853 380,211 415,614 (181,632)861,482 2,347,362 388,977 472,505 (418,972)910,639 2,347,008 424,806 485,833 (243,441)
1,026,939 2,535,652 534,555 492,384 (244,143)1,094,055 2,617,356 534,555 559,500 (289,999)
1,137,1006 2,561,036 552,200 584,900 (840,000)1,212,400 2,459,229 571,100 584,500 (844,000) 56,8002,480,100 4,609,851 1,892,600 587,500 07 0
2,647,300 4,652,548 1,934,900 712,400 0661,825 1,163,137 483,725 178,100 0
2,958,700 4,882,343 2,095,500 863,200 03,285,500 5,039,110 2,373,200 912,300 03,402,200 4,686,226 2,438,000 964,200 0

1980198119821983198310
19841985
19861987198819891990
19911992199319941995
1996199719981999
200011
200112
Year Title V Health Constant MCH CCS EMIC Special Section Abstinenceor MCH Block Dollars Program Program Projects4 5165 EducationGrant Totals1 (per CPI)2 or MCH Sec. 51013
Block Total3
107
3,445,300 4,181,189 2,465,500 979,800 03,617,200 3,979,318 2,593,600 1,023,600 03,680,568 3,814,060 3,680,5689
3,690,462 3,705,283 3,690,4621,222,200 1,227,108 1,222,2003,947,706 3,799,525 3,947,7064,729,332 4,395,290 4,729,332
4,525,971 4,129,536 4,525,9714,901,859 4,315,017 4,901,8595,094,950 4,306,805 5,094,9505,267,237 4,247,772 5,267,2375,310,606 4,063,203 5,310,606
5,545,290 4,071,432 5,545,2905,937,852 4,232,254 5,937,8526,162,498 4,264,704 6,162,4986,315,250 4,261,302 6,315,2506,294,214 4,130,062 6,294,214
6,243,055 3,979,003 6,243,0556,217,490 3,873,826 6,217,4906,210,338 3,810,023 6,210,338 460,0766,323,492 3,795,613 6,325,000 460,076
6,382,795 6,325,000 460,0766,382,795 460,076
1 Total of amounts shown on the table for each year; does not include Special Projects (Program of Projects), Research, Training, or Special Projects ofRegional and National Significance (SPRANS Grants), and Community Integrated Service Systems monies.
2 These are Constant Dollars for the Title V Health Program totals or the MCH Block Grant totals based on adjustments using the Consumer Price Index(CPI) which defined the average of 1982-1984 as the base year of 100%. 2000-2001 CPI data are not available.
3 Prior to 1952, State Program totals include all of Fund A and most of Fund B, including “Reserved” Funds. For later years, various reserved funds are notincluded in the totals since data were not available for States.
4 Includes projects later known as the “Program of Projects” (M&I, C&Y, Family Planning, Dental, Intensive Infant Care); excludes Family Planning moniesallocated to States in 1970-1972 because these were allocated by the National Center for Family Planning Services. These amounts are not includedin the annual totals.
5 Monies required from FY1975-FY1981 to maintain the FY1973 level of Title V funding defined as the “Hold Harmless” funding base. FY1974 monies inthis category were to enable States to plan for the Program of Projects, including management of existing Special Projects.
6 The total amount shown in FY1973 is not necessarily the base for FY1975 funding levels since some Special Projects were funded for 18 months andother adjustments were necessary.
7 Special Projects monies in 1975 are a portion of $10,472,000 impounded by President Nixon in 1973 and released by court order in 1975.
8 These monies are those used to fund the “transition” quarter in 1976 (July-September) when the Federal Fiscal Year changed from July-June to October-September.
9 Beginning in 1982, a single block allocation was made to each State as the MCH Block Grant.
10 This line is the State’s allocation of the $ 105 million appropriated for care of mothers and children under the 1983 Jobs Bill. It is perceived as 1983supplemental funding but was mostly used in 1984.
11 Represents the amount included in the FY2000 Appropriations as of February 2000.
12 The President’s Budget request for FY2001. Does not include Healthy Start, which is proposed for inclusion in the Title V in FY2001 ($90 million).
13 The Personal Responsibility, and Work Opportunity Reconciliation Act of 1996 created a new section, Section 510 to Title V of the SSA for providingformula grant funds to the States for Abstinence Education. This Act provided a separate appropriation of $50 million for each of the fiscal years1998-2002. This is a permanent appropriation and is counted as mandatory funding under The Budget Enforcement Act.

19361937193819391940
19411942194319441945
19461947194819491950
19511952195319541955
19561957195819591960
19611962196319641965
19661967196819691970
19711972197319741975
197619768
197719781979
Year Title V Health Constant MCH CCS EMIC Special Section Abstinenceor MCH Block Dollars Program Program Projects4 5165 EducationGrant Totals1 (per CPI)2 or MCH Sec. 51013
Block Total3
108
TABLE 43United States Title V or MCH Block Grant Allocations to Each State (showing Constant Dollars forTotal Amounts) By Program Components, FY 1936 - FY 2001: PENNSYLVANIA
129,208 929,554 73,569 55,639310,544 2,156,556 176,940 133,604294,052 2,085,475 153,958 140,094286,723 2,062,755 153,119 133,604334,801 2,391,436 184,741 150,060
411,890 2,801,973 228,807 183,083446,819 2,741,221 257,927 188,892404,273 2,336,838 210,034 194,239 0
1,968,296 11,183,500 208,445 169,579 1,590,2723,001,244 16,673,578 218,044 168,613 2,614,587
2,381,844 12,214,585 204,492 134,816 2,042,5361,040,892 4,667,677 372,768 221,134 446,990
692,519 2,873,523 381,223 250,981 60,315780,901 3,281,097 438,127 342,774749,113 3,108,353 477,570 271,543
816,461 3,140,235 504,269 312,192921,726 3,478,211 484,941 436,785960,577 3,597,667 528,667 431,910913,906 3,397,420 473,874 440,032918,170 3,426,007 479,421 438,749
1,085,367 3,990,320 479,621 605,7461,237,024 4,402,221 617,579 619,4451,250,565 4,327,215 641,145 609,4201,301,997 4,474,216 642,070 659,9271,339,386 4,524,953 696,949 642,437
1,520,734 5,086,067 717,985 802,7492,035,971 6,741,626 1,016,425 1,019,5462,164,668 7,074,078 1,054,406 1,110,2622,491,737 8,037,861 1,203,484 1,288,253 02,794,507 8,871,451 1,328,701 1,465,806 (491,689)
3,564,677 11,002,090 1,738,489 1,826,188 (1,865,042)4,096,952 12,266,323 2,051,530 2,045,422 (4,494,026)4,149,014 11,922,454 2,068,584 2,080,430 (4,326,374)4,410,336 12,017,264 2,083,414 2,326,922 (4,216,688)4,417,783 11,386,039 2,062,028 2,355,755 (4,395,249)
4,892,628 12,080,563 2,522,102 2,370,526 (4,166,397)5,120,602 12,250,244 2,522,102 2,598,500 (5,307,328)
5,282,4006 11,897,297 2,605,000 2,677,400 (5,307,300)5,413,500 10,980,730 2,553,700 2,675,600 (4,750,000) 184,200
11,278,800 20,964,312 8,464,400 2,814,400 07 0
12,608,300 22,158,699 9,275,300 3,333,000 03,152,075 5,539,675 2,318,825 833,250 0
13,284,000 21,920,792 9,316,600 3,967,400 013,413,100 20,572,239 9,266,400 4,146,700 013,903,300 19,150,551 9,519,500 4,383,800 0

1980198119821983198310
19841985
19861987198819891990
19911992199319941995
1996199719981999
200011
200112
Year Title V Health Constant MCH CCS EMIC Special Section Abstinenceor MCH Block Dollars Program Program Projects4 5165 EducationGrant Totals1 (per CPI)2 or MCH Sec. 51013
Block Total3
109
13,968,100 16,951,578 9,668,000 4,300,100 014,931,100 16,425,853 10,503,100 4,428,000 014,858,238 15,397,138 14,858,2389
14,898,180 14,958,012 14,898,1804,933,950 4,953,765 4,933,950
15,936,659 15,338,459 15,936,65919,092,037 17,743,529 19,092,037
18,271,079 16,670,693 18,271,07919,788,517 17,419,469 19,788,51720,744,001 17,535,081 20,744,00121,605,824 17,424,052 21,605,82421,822,788 16,696,854 21,822,788
22,996,817 16,884,594 22,996,81724,960,489 17,790,798 24,960,48924,779,323 17,148,320 24,779,32325,383,956 17,128,175 25,383,95625,300,688 16,601,501 25,300,688
25,098,187 15,996,295 25,098,18724,994,675 15,573,006 24,994,67524,965,975 15,316,549 24,965,975 1,820,07025,413,876 15,254,427 25,419,843 1,820,070
25,648,613 25,419,843 1,820,07025,648,613 1,820,070
1 Total of amounts shown on the table for each year; does not include Special Projects (Program of Projects), Research, Training, or Special Projects ofRegional and National Significance (SPRANS Grants), and Community Integrated Service Systems monies.
2 These are Constant Dollars for the Title V Health Program totals or the MCH Block Grant totals based on adjustments using the Consumer Price Index(CPI) which defined the average of 1982-1984 as the base year of 100%. 2000-2001 CPI data are not available.
3 Prior to 1952, State Program totals include all of Fund A and most of Fund B, including “Reserved” Funds. For later years, various reserved funds are notincluded in the totals since data were not available for States.
4 Includes projects later known as the “Program of Projects” (M&I, C&Y, Family Planning, Dental, Intensive Infant Care); excludes Family Planning moniesallocated to States in 1970-1972 because these were allocated by the National Center for Family Planning Services. These amounts are not includedin the annual totals.
5 Monies required from FY1975-FY1981 to maintain the FY1973 level of Title V funding defined as the “Hold Harmless” funding base. FY1974 monies inthis category were to enable States to plan for the Program of Projects, including management of existing Special Projects.
6 The total amount shown in FY1973 is not necessarily the base for FY1975 funding levels since some Special Projects were funded for 18 months andother adjustments were necessary.
7 Special Projects monies in 1975 are a portion of $10,472,000 impounded by President Nixon in 1973 and released by court order in 1975.
8 These monies are those used to fund the “transition” quarter in 1976 (July-September) when the Federal Fiscal Year changed from July-June to October-September.
9 Beginning in 1982, a single block allocation was made to each State as the MCH Block Grant.
10 This line is the State’s allocation of the $ 105 million appropriated for care of mothers and children under the 1983 Jobs Bill. It is perceived as 1983supplemental funding but was mostly used in 1984.
11 Represents the amount included in the FY2000 Appropriations as of February 2000.
12 The President’s Budget request for FY2001. Does not include Healthy Start, which is proposed for inclusion in the Title V in FY2001 ($90 million).
13 The Personal Responsibility, and Work Opportunity Reconciliation Act of 1996 created a new section, Section 510 to Title V of the SSA for providingformula grant funds to the States for Abstinence Education. This Act provided a separate appropriation of $50 million for each of the fiscal years1998-2002. This is a permanent appropriation and is counted as mandatory funding under The Budget Enforcement Act.

19361937193819391940
19411942194319441945
19461947194819491950
19511952195319541955
19561957195819591960
19611962196319641965
19661967196819691970
19711972197319741975
197619768
197719781979
Year Title V Health Constant MCH CCS EMIC Special Section Abstinenceor MCH Block Dollars Program Program Projects4 5165 EducationGrant Totals1 (per CPI)2 or MCH Sec. 51013
Block Total3
110
TABLE 44United States Title V or MCH Block Grant Allocations to Each State (showing Constant Dollars forTotal Amounts) By Program Components, FY 1936 - FY 2001: PUERTO RICO
102,235 730,250 84,905 17,330
286,947 1,952,020 214,026 72,921341,110 2,092,699 275,516 65,594265,610 1,535,318 188,657 76,953 0325,573 1,849,847 185,807 85,078 54,688451,122 2,506,233 200,032 76,039 175,051
550,871 2,824,979 236,545 64,862 249,464656,524 2,944,054 448,650 178,516 29,358674,377 2,798,245 492,878 166,924 14,575673,418 2,829,487 480,785 192,633575,820 2,389,295 400,323 175,497
655,237 2,520,142 399,947 255,290678,183 2,559,181 367,958 310,225754,008 2,824,000 400,410 353,598685,345 2,547,751 366,691 318,654649,235 2,422,519 342,962 306,273
749,939 2,757,129 323,894 426,045781,214 2,780,121 370,280 410,934777,511 2,690,349 371,356 406,155777,490 2,671,787 361,311 416,179762,893 2,577,341 365,625 397,268
872,587 2,918,351 377,798 494,7891,153,661 3,820,070 524,466 629,1951,261,856 4,123,712 590,727 671,1291,495,542 4,824,329 722,768 772,774 (802,414)1,727,005 5,482,556 854,534 872,471 (826,575)
2,193,277 6,769,373 1,118,641 1,074,636 (2,167,914)2,540,933 7,607,584 1,335,520 1,205,413 (2,868,117)2,565,985 7,373,520 1,344,010 1,221,975 (2,489,652)2,820,706 7,685,847 1,445,022 1,375,684 (3,321,064)2,841,437 7,323,291 1,365,413 1,476,024 (2,791,500)
3,154,535 7,788,975 1,646,229 1,508,306 (3,103,000)3,245,729 7,764,902 1,646,229 1,599,500 (3,316,025)
3,257,2006 7,336,036 1,685,200 1,572,000 (5,198,600)2,946,100 5,975,862 1,375,700 1,570,400 (5,138,198) 07,922,334 14,725,528 4,592,200 1,484,300 (773,175)7 1,845,834
8,592,902 15,101,761 5,635,800 1,925,300 1,031,8022,148,225 3,775,439 1,408,950 481,325 257,9509,363,300 15,450,990 6,739,400 2,623,900 09,545,700 14,640,644 6,638,100 2,907,600 09,895,700 13,630,441 6,819,100 3,076,600 0

1980198119821983198310
19841985
19861987198819891990
19911992199319941995
1996199719981999
200011
200112
Year Title V Health Constant MCH CCS EMIC Special Section Abstinenceor MCH Block Dollars Program Program Projects4 5165 EducationGrant Totals1 (per CPI)2 or MCH Sec. 51013
Block Total3
111
10,163,800 12,334,709 7,050,700 3,113,100 010,536,700 11,591,529 7,271,300 3,265,400 09,163,476 9,495,830 9,163,4769
9,188,109 9,225,009 9,188,1093,042,900 3,055,120 3,042,9009,828,567 9,459,641 9,828,567
11,774,574 10,942,913 11,774,574
11,268,267 10,281,266 11,268,26712,204,112 10,743,056 12,204,11212,875,285 10,883,588 12,875,28513,484,200 10,874,355 13,484,20013,637,494 10,434,196 13,637,494
14,467,019 10,621,894 14,467,01915,854,415 11,300,367 15,854,41516,169,062 11,189,662 16,169,06216,650,360 11,235,061 16,650,36016,584,078 10,881,941 16,584,078
16,422,883 10,467,102 16,422,88316,361,820 10,194,280 16,361,82016,342,593 10,026,131 16,342,593 1,449,01816,699,067 10,023,450 16,703,817 1,449,018
16,885,919 16,703,817 1,449,01816,885,919 1,449,018
1 Total of amounts shown on the table for each year; does not include Special Projects (Program of Projects), Research, Training, or Special Projects ofRegional and National Significance (SPRANS Grants), and Community Integrated Service Systems monies.
2 These are Constant Dollars for the Title V Health Program totals or the MCH Block Grant totals based on adjustments using the Consumer Price Index(CPI) which defined the average of 1982-1984 as the base year of 100%. 2000-2001 CPI data are not available.
3 Prior to 1952, State Program totals include all of Fund A and most of Fund B, including “Reserved” Funds. For later years, various reserved funds are notincluded in the totals since data were not available for States.
4 Includes projects later known as the “Program of Projects” (M&I, C&Y, Family Planning, Dental, Intensive Infant Care); excludes Family Planning moniesallocated to States in 1970-1972 because these were allocated by the National Center for Family Planning Services. These amounts are not includedin the annual totals.
5 Monies required from FY1975-FY1981 to maintain the FY1973 level of Title V funding defined as the “Hold Harmless” funding base. FY1974 monies inthis category were to enable States to plan for the Program of Projects, including management of existing Special Projects.
6 The total amount shown in FY1973 is not necessarily the base for FY1975 funding levels since some Special Projects were funded for 18 months andother adjustments were necessary.
7 Special Projects monies in 1975 are a portion of $10,472,000 impounded by President Nixon in 1973 and released by court order in 1975.
8 These monies are those used to fund the “transition” quarter in 1976 (July-September) when the Federal Fiscal Year changed from July-June to October-September.
9 Beginning in 1982, a single block allocation was made to each State as the MCH Block Grant.
10 This line is the State’s allocation of the $ 105 million appropriated for care of mothers and children under the 1983 Jobs Bill. It is perceived as 1983supplemental funding but was mostly used in 1984.
11 Represents the amount included in the FY2000 Appropriations as of February 2000.
12 The President’s Budget request for FY2001. Does not include Healthy Start, which is proposed for inclusion in the Title V in FY2001 ($90 million).
13 The Personal Responsibility, and Work Opportunity Reconciliation Act of 1996 created a new section, Section 510 to Title V of the SSA for providingformula grant funds to the States for Abstinence Education. This Act provided a separate appropriation of $50 million for each of the fiscal years1998-2002. This is a permanent appropriation and is counted as mandatory funding under The Budget Enforcement Act.

19361937193819391940
19411942194319441945
19461947194819491950
19511952195319541955
19561957195819591960
19611962196319641965
19661967196819691970
19711972197319741975
197619768
197719781979
Year Title V Health Constant MCH CCS EMIC Special Section Abstinenceor MCH Block Dollars Program Program Projects4 5165 EducationGrant Totals1 (per CPI)2 or MCH Sec. 51013
Block Total3
112
TABLE 45United States Title V or MCH Block Grant Allocations to Each State (showing Constant Dollars forTotal Amounts) By Program Components, FY 1936 - FY 2001: RHODE ISLAND
23,372 168,144 11,872 11,50061,877 429,701 34,265 27,61261,102 433,348 33,490 27,61261,119 439,705 33,507 27,61268,105 486,464 39,584 28,521
57,500 391,156 37,500 20,00081,656 500,957 38,027 43,62986,893 502,272 46,893 30,000 10,000
244,846 1,391,170 37,502 40,000 167,344410,154 2,278,633 40,574 55,474 314,106
265,097 1,359,472 43,068 65,297 156,732173,663 778,758 66,059 90,922 16,682165,675 687,448 60,951 93,888 10,836169,741 713,197 69,524 100,217166,738 691,859 66,552 100,186
218,714 841,208 96,897 121,817168,806 637,004 87,865 80,94199,749 373,592 66,260 33,489
162,209 603,007 84,611 77,598161,815 603,787 84,517 77,298
183,181 673,460 84,239 98,942213,869 761,100 109,637 104,232215,774 746,623 112,211 103,563221,457 761,021 111,864 109,593219,172 740,446 113,455 105,717
254,647 851,662 122,576 132,071284,762 942,921 142,149 142,613286,030 934,739 142,600 143,430315,968 1,019,252 157,401 158,567 0348,718 1,107,041 174,330 174,388 0
412,445 1,272,978 206,706 205,739 (177,095)441,797 1,322,746 223,062 218,735 0442,210 1,270,718 223,062 219,148 (143,812)463,335 1,262,493 225,643 237,692 (236,000)478,186 1,232,438 233,471 244,715 (176,000)
495,639 1,223,800 250,431 245,208 (175,000)507,331 1,213,711 250,431 256,900 (226,997)
514,6006 1,159,009 253,300 261,300 (227,000)515,200 1,045,030 251,000 261,100 (281,000) 3,100808,700 1,503,160 547,400 261,300 07 0
802,400 1,410,193 515,800 286,600 0200,600 352,548 128,950 71,650 0824,900 1,361,221 513,500 311,400 0801,100 1,228,681 480,200 320,900 0829,800 1,142,975 499,600 330,200 0
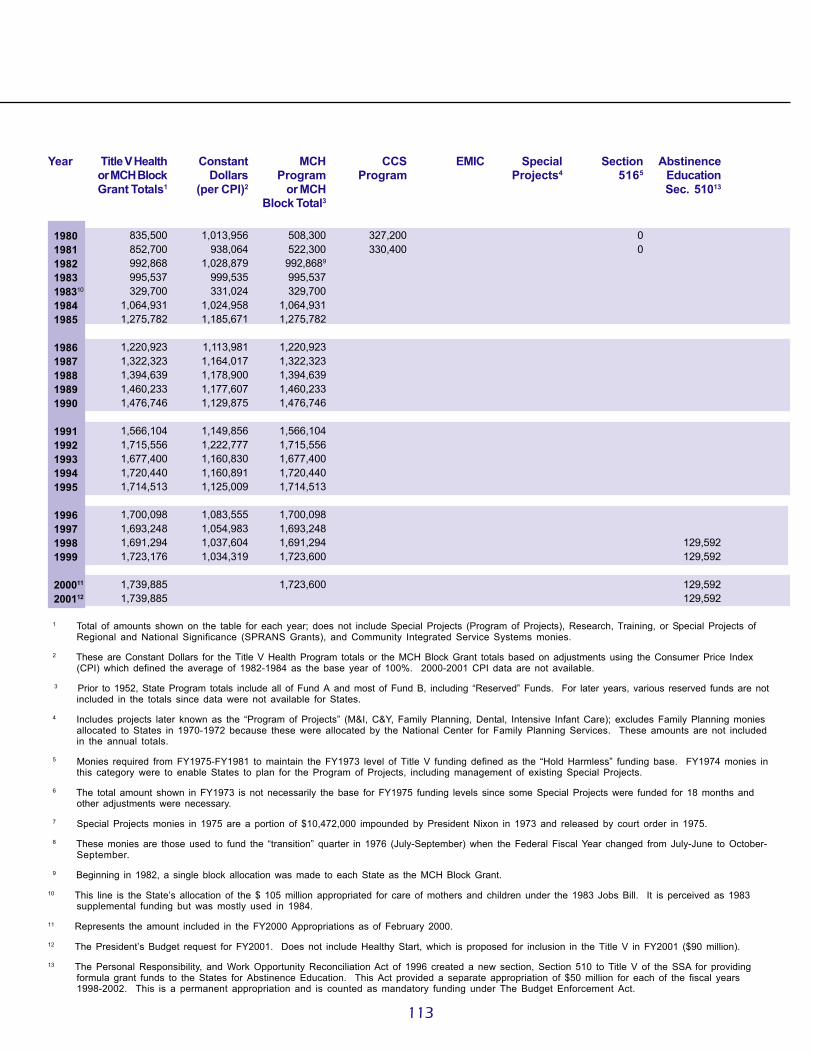
1980198119821983198310
19841985
19861987198819891990
19911992199319941995
1996199719981999
200011
200112
Year Title V Health Constant MCH CCS EMIC Special Section Abstinenceor MCH Block Dollars Program Program Projects4 5165 EducationGrant Totals1 (per CPI)2 or MCH Sec. 51013
Block Total3
113
835,500 1,013,956 508,300 327,200 0852,700 938,064 522,300 330,400 0992,868 1,028,879 992,8689
995,537 999,535 995,537329,700 331,024 329,700
1,064,931 1,024,958 1,064,9311,275,782 1,185,671 1,275,782
1,220,923 1,113,981 1,220,9231,322,323 1,164,017 1,322,3231,394,639 1,178,900 1,394,6391,460,233 1,177,607 1,460,2331,476,746 1,129,875 1,476,746
1,566,104 1,149,856 1,566,1041,715,556 1,222,777 1,715,5561,677,400 1,160,830 1,677,4001,720,440 1,160,891 1,720,4401,714,513 1,125,009 1,714,513
1,700,098 1,083,555 1,700,0981,693,248 1,054,983 1,693,2481,691,294 1,037,604 1,691,294 129,5921,723,176 1,034,319 1,723,600 129,592
1,739,885 1,723,600 129,5921,739,885 129,592
1 Total of amounts shown on the table for each year; does not include Special Projects (Program of Projects), Research, Training, or Special Projects ofRegional and National Significance (SPRANS Grants), and Community Integrated Service Systems monies.
2 These are Constant Dollars for the Title V Health Program totals or the MCH Block Grant totals based on adjustments using the Consumer Price Index(CPI) which defined the average of 1982-1984 as the base year of 100%. 2000-2001 CPI data are not available.
3 Prior to 1952, State Program totals include all of Fund A and most of Fund B, including “Reserved” Funds. For later years, various reserved funds are notincluded in the totals since data were not available for States.
4 Includes projects later known as the “Program of Projects” (M&I, C&Y, Family Planning, Dental, Intensive Infant Care); excludes Family Planning moniesallocated to States in 1970-1972 because these were allocated by the National Center for Family Planning Services. These amounts are not includedin the annual totals.
5 Monies required from FY1975-FY1981 to maintain the FY1973 level of Title V funding defined as the “Hold Harmless” funding base. FY1974 monies inthis category were to enable States to plan for the Program of Projects, including management of existing Special Projects.
6 The total amount shown in FY1973 is not necessarily the base for FY1975 funding levels since some Special Projects were funded for 18 months andother adjustments were necessary.
7 Special Projects monies in 1975 are a portion of $10,472,000 impounded by President Nixon in 1973 and released by court order in 1975.
8 These monies are those used to fund the “transition” quarter in 1976 (July-September) when the Federal Fiscal Year changed from July-June to October-September.
9 Beginning in 1982, a single block allocation was made to each State as the MCH Block Grant.
10 This line is the State’s allocation of the $ 105 million appropriated for care of mothers and children under the 1983 Jobs Bill. It is perceived as 1983supplemental funding but was mostly used in 1984.
11 Represents the amount included in the FY2000 Appropriations as of February 2000.
12 The President’s Budget request for FY2001. Does not include Healthy Start, which is proposed for inclusion in the Title V in FY2001 ($90 million).
13 The Personal Responsibility, and Work Opportunity Reconciliation Act of 1996 created a new section, Section 510 to Title V of the SSA for providingformula grant funds to the States for Abstinence Education. This Act provided a separate appropriation of $50 million for each of the fiscal years1998-2002. This is a permanent appropriation and is counted as mandatory funding under The Budget Enforcement Act.
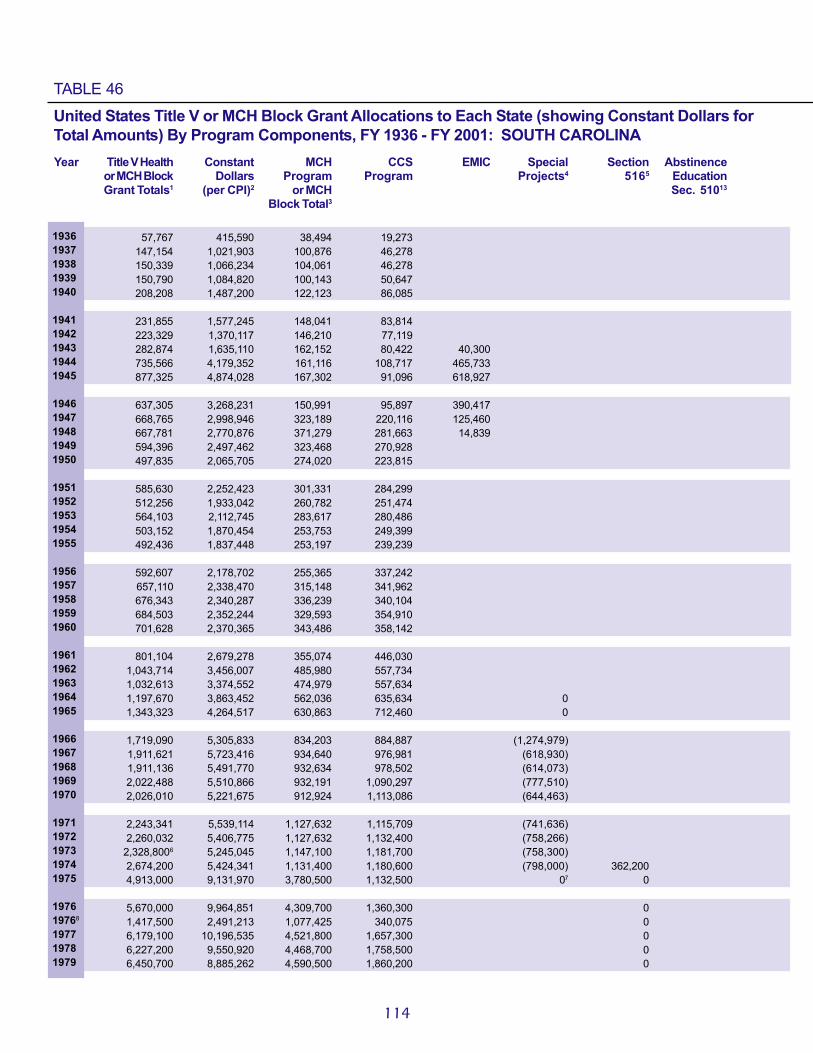
19361937193819391940
19411942194319441945
19461947194819491950
19511952195319541955
19561957195819591960
19611962196319641965
19661967196819691970
19711972197319741975
197619768
197719781979
Year Title V Health Constant MCH CCS EMIC Special Section Abstinenceor MCH Block Dollars Program Program Projects4 5165 EducationGrant Totals1 (per CPI)2 or MCH Sec. 51013
Block Total3
114
TABLE 46United States Title V or MCH Block Grant Allocations to Each State (showing Constant Dollars forTotal Amounts) By Program Components, FY 1936 - FY 2001: SOUTH CAROLINA
57,767 415,590 38,494 19,273147,154 1,021,903 100,876 46,278150,339 1,066,234 104,061 46,278150,790 1,084,820 100,143 50,647208,208 1,487,200 122,123 86,085
231,855 1,577,245 148,041 83,814223,329 1,370,117 146,210 77,119282,874 1,635,110 162,152 80,422 40,300735,566 4,179,352 161,116 108,717 465,733877,325 4,874,028 167,302 91,096 618,927
637,305 3,268,231 150,991 95,897 390,417668,765 2,998,946 323,189 220,116 125,460667,781 2,770,876 371,279 281,663 14,839594,396 2,497,462 323,468 270,928497,835 2,065,705 274,020 223,815
585,630 2,252,423 301,331 284,299512,256 1,933,042 260,782 251,474564,103 2,112,745 283,617 280,486503,152 1,870,454 253,753 249,399492,436 1,837,448 253,197 239,239
592,607 2,178,702 255,365 337,242657,110 2,338,470 315,148 341,962676,343 2,340,287 336,239 340,104684,503 2,352,244 329,593 354,910701,628 2,370,365 343,486 358,142
801,104 2,679,278 355,074 446,0301,043,714 3,456,007 485,980 557,7341,032,613 3,374,552 474,979 557,6341,197,670 3,863,452 562,036 635,634 01,343,323 4,264,517 630,863 712,460 0
1,719,090 5,305,833 834,203 884,887 (1,274,979)1,911,621 5,723,416 934,640 976,981 (618,930)1,911,136 5,491,770 932,634 978,502 (614,073)2,022,488 5,510,866 932,191 1,090,297 (777,510)2,026,010 5,221,675 912,924 1,113,086 (644,463)
2,243,341 5,539,114 1,127,632 1,115,709 (741,636)2,260,032 5,406,775 1,127,632 1,132,400 (758,266)
2,328,8006 5,245,045 1,147,100 1,181,700 (758,300)2,674,200 5,424,341 1,131,400 1,180,600 (798,000) 362,2004,913,000 9,131,970 3,780,500 1,132,500 07 0
5,670,000 9,964,851 4,309,700 1,360,300 01,417,500 2,491,213 1,077,425 340,075 06,179,100 10,196,535 4,521,800 1,657,300 06,227,200 9,550,920 4,468,700 1,758,500 06,450,700 8,885,262 4,590,500 1,860,200 0

1980198119821983198310
19841985
19861987198819891990
19911992199319941995
1996199719981999
200011
200112
Year Title V Health Constant MCH CCS EMIC Special Section Abstinenceor MCH Block Dollars Program Program Projects4 5165 EducationGrant Totals1 (per CPI)2 or MCH Sec. 51013
Block Total3
115
6,538,400 7,934,951 4,673,300 1,865,100 06,776,900 7,455,336 4,849,300 1,927,600 07,029,126 7,284,068 7,029,1269
7,048,022 7,076,327 7,048,0222,334,150 2,343,524 2,334,1507,539,305 7,256,309 7,539,3059,032,049 8,394,098 9,032,049
8,643,671 7,886,561 8,643,6719,361,539 8,240,791 9,361,5399,797,730 8,282,105 9,797,730
10,190,480 8,218,129 10,190,48010,289,354 7,872,497 10,289,354
10,824,378 7,947,414 10,824,37811,719,268 8,353,006 11,719,26811,588,731 8,019,883 11,588,73111,858,411 8,001,627 11,858,41111,821,272 7,756,740 11,821,272
11,730,952 7,476,706 11,730,95211,681,564 7,278,233 11,681,56411,668,217 7,158,415 11,668,217 811,75711,868,000 7,123,649 11,870,662 811,757
11,972,698 11,870,662 811,75711,972,698 811,757
1 Total of amounts shown on the table for each year; does not include Special Projects (Program of Projects), Research, Training, or Special Projects ofRegional and National Significance (SPRANS Grants), and Community Integrated Service Systems monies.
2 These are Constant Dollars for the Title V Health Program totals or the MCH Block Grant totals based on adjustments using the Consumer Price Index(CPI) which defined the average of 1982-1984 as the base year of 100%. 2000-2001 CPI data are not available.
3 Prior to 1952, State Program totals include all of Fund A and most of Fund B, including “Reserved” Funds. For later years, various reserved funds are notincluded in the totals since data were not available for States.
4 Includes projects later known as the “Program of Projects” (M&I, C&Y, Family Planning, Dental, Intensive Infant Care); excludes Family Planning moniesallocated to States in 1970-1972 because these were allocated by the National Center for Family Planning Services. These amounts are not includedin the annual totals.
5 Monies required from FY1975-FY1981 to maintain the FY1973 level of Title V funding defined as the “Hold Harmless” funding base. FY1974 monies inthis category were to enable States to plan for the Program of Projects, including management of existing Special Projects.
6 The total amount shown in FY1973 is not necessarily the base for FY1975 funding levels since some Special Projects were funded for 18 months andother adjustments were necessary.
7 Special Projects monies in 1975 are a portion of $10,472,000 impounded by President Nixon in 1973 and released by court order in 1975.
8 These monies are those used to fund the “transition” quarter in 1976 (July-September) when the Federal Fiscal Year changed from July-June to October-September.
9 Beginning in 1982, a single block allocation was made to each State as the MCH Block Grant.
10 This line is the State’s allocation of the $ 105 million appropriated for care of mothers and children under the 1983 Jobs Bill. It is perceived as 1983supplemental funding but was mostly used in 1984.
11 Represents the amount included in the FY2000 Appropriations as of February 2000.
12 The President’s Budget request for FY2001. Does not include Healthy Start, which is proposed for inclusion in the Title V in FY2001 ($90 million).
13 The Personal Responsibility, and Work Opportunity Reconciliation Act of 1996 created a new section, Section 510 to Title V of the SSA for providingformula grant funds to the States for Abstinence Education. This Act provided a separate appropriation of $50 million for each of the fiscal years1998-2002. This is a permanent appropriation and is counted as mandatory funding under The Budget Enforcement Act.

19361937193819391940
19411942194319441945
19461947194819491950
19511952195319541955
19561957195819591960
19611962196319641965
19661967196819691970
19711972197319741975
197619768
197719781979
Year Title V Health Constant MCH CCS EMIC Special Section Abstinenceor MCH Block Dollars Program Program Projects4 5165 EducationGrant Totals1 (per CPI)2 or MCH Sec. 51013
Block Total3
116
TABLE 47United States Title V or MCH Block Grant Allocations to Each State (showing Constant Dollars forTotal Amounts) By Program Components, FY 1936 - FY 2001: SOUTH DAKOTA
28,845 207,518 16,834 12,01179,549 552,424 50,773 28,77681,632 578,950 52,856 28,77677,868 560,201 49,092 28,77694,411 674,364 63,519 30,892
92,776 631,129 59,891 32,88594,975 582,669 56,454 38,521
123,241 712,376 63,288 39,953 20,000303,535 1,724,631 54,073 38,631 210,831297,705 1,653,917 57,661 38,044 202,000
241,352 1,237,703 56,093 38,927 146,332160,816 721,148 54,320 64,396 42,100170,576 707,784 81,784 75,193 13,599156,087 655,828 70,419 85,668114,191 473,822 70,260 43,931
172,345 662,865 90,180 82,165169,681 640,306 88,620 81,061108,347 405,794 25,000 83,347163,979 609,587 86,209 77,770163,349 609,511 85,669 77,680
184,467 678,188 85,397 99,070214,359 762,843 110,411 103,948216,402 748,796 112,358 104,044219,860 755,533 112,767 107,093218,476 738,095 113,257 105,219
253,805 848,846 122,385 131,420280,523 928,884 140,055 140,468280,894 917,954 141,162 139,732314,413 1,014,235 155,522 158,891 0344,883 1,094,867 170,455 174,428 0
418,532 1,291,765 200,031 218,501 0446,933 1,338,123 210,632 236,301 0450,907 1,295,710 213,321 237,586 0464,369 1,265,311 206,652 257,717 0456,495 1,176,534 207,450 249,045 0
472,096 1,165,669 223,592 248,504 0489,192 1,170,316 223,592 265,600 0503,4006 1,133,784 228,400 275,000 0603,500 1,224,138 233,100 274,800 0 105,600
1,007,700 1,873,048 734,100 273,600 07 0
1,112,300 1,954,833 793,700 318,600 0278,075 488,708 198,425 79,650 0
1,214,500 2,004,125 843,900 370,600 01,350,800 2,071,779 943,000 407,800 01,400,000 1,928,375 968,800 431,200 0

1980198119821983198310
19841985
19861987198819891990
19911992199319941995
1996199719981999
200011
200112
Year Title V Health Constant MCH CCS EMIC Special Section Abstinenceor MCH Block Dollars Program Program Projects4 5165 EducationGrant Totals1 (per CPI)2 or MCH Sec. 51013
Block Total3
117
1,395,300 1,693,325 968,800 426,500 01,479,200 1,627,283 1,039,500 439,700 01,416,576 1,467,954 1,416,5769
1,420,384 1,426,088 1,420,384470,400 472,289 470,400
1,519,392 1,462,360 1,519,3921,820,224 1,691,658 1,820,224
1,741,954 1,589,374 1,741,9541,886,626 1,660,762 1,886,6261,977,109 1,671,267 1,977,1092,058,695 1,660,238 2,058,6952,079,235 1,590,845 2,079,235
2,190,378 1,608,207 2,190,3782,376,273 1,693,708 2,376,2732,351,075 1,627,042 2,351,0752,407,331 1,624,380 2,407,3312,399,584 1,574,530 2,399,584
2,380,743 1,517,363 2,380,7432,370,838 1,477,158 2,370,8382,368,121 1,452,835 2,368,121 169,5782,409,796 1,446,456 2,410,351 169,578
2,431,636 2,410,351 169,5782,431,636 169,578
1 Total of amounts shown on the table for each year; does not include Special Projects (Program of Projects), Research, Training, or Special Projects ofRegional and National Significance (SPRANS Grants), and Community Integrated Service Systems monies.
2 These are Constant Dollars for the Title V Health Program totals or the MCH Block Grant totals based on adjustments using the Consumer Price Index(CPI) which defined the average of 1982-1984 as the base year of 100%. 2000-2001 CPI data are not available.
3 Prior to 1952, State Program totals include all of Fund A and most of Fund B, including “Reserved” Funds. For later years, various reserved funds are notincluded in the totals since data were not available for States.
4 Includes projects later known as the “Program of Projects” (M&I, C&Y, Family Planning, Dental, Intensive Infant Care); excludes Family Planning moniesallocated to States in 1970-1972 because these were allocated by the National Center for Family Planning Services. These amounts are not includedin the annual totals.
5 Monies required from FY1975-FY1981 to maintain the FY1973 level of Title V funding defined as the “Hold Harmless” funding base. FY1974 monies inthis category were to enable States to plan for the Program of Projects, including management of existing Special Projects.
6 The total amount shown in FY1973 is not necessarily the base for FY1975 funding levels since some Special Projects were funded for 18 months andother adjustments were necessary.
7 Special Projects monies in 1975 are a portion of $10,472,000 impounded by President Nixon in 1973 and released by court order in 1975.
8 These monies are those used to fund the “transition” quarter in 1976 (July-September) when the Federal Fiscal Year changed from July-June to October-September.
9 Beginning in 1982, a single block allocation was made to each State as the MCH Block Grant.
10 This line is the State’s allocation of the $ 105 million appropriated for care of mothers and children under the 1983 Jobs Bill. It is perceived as 1983supplemental funding but was mostly used in 1984.
11 Represents the amount included in the FY2000 Appropriations as of February 2000.
12 The President’s Budget request for FY2001. Does not include Healthy Start, which is proposed for inclusion in the Title V in FY2001 ($90 million).
13 The Personal Responsibility, and Work Opportunity Reconciliation Act of 1996 created a new section, Section 510 to Title V of the SSA for providingformula grant funds to the States for Abstinence Education. This Act provided a separate appropriation of $50 million for each of the fiscal years1998-2002. This is a permanent appropriation and is counted as mandatory funding under The Budget Enforcement Act.

19361937193819391940
19411942194319441945
19461947194819491950
19511952195319541955
19561957195819591960
19611962196319641965
19661967196819691970
19711972197319741975
197619768
197719781979
Year Title V Health Constant MCH CCS EMIC Special Section Abstinenceor MCH Block Dollars Program Program Projects4 5165 EducationGrant Totals1 (per CPI)2 or MCH Sec. 51013
Block Total3
118
TABLE 48United States Title V or MCH Block Grant Allocations to Each State (showing Constant Dollars forTotal Amounts) By Program Components, FY 1936 - FY 2001: TENNESSEE
61,042 439,151 35,449 25,593150,130 1,042,569 95,876 54,254154,303 1,094,348 100,049 54,254139,230 1,001,655 84,976 54,254172,444 1,231,743 110,073 62,371
197,364 1,342,612 139,787 57,577238,619 1,463,920 150,351 88,268214,631 1,240,642 137,634 76,997 0509,307 2,893,790 136,260 68,595 304,452762,156 4,234,200 116,049 77,484 568,623
581,663 2,982,887 129,933 60,114 391,616438,266 1,965,318 222,697 119,752 95,817531,243 2,204,328 387,692 140,606 2,945569,464 2,392,706 378,837 190,627573,934 2,381,469 386,132 187,802
768,902 2,957,315 482,036 286,866644,063 2,430,426 332,515 311,548708,968 2,655,311 361,710 347,258631,606 2,347,978 322,597 309,009615,579 2,296,937 317,316 298,263
719,518 2,645,287 304,164 415,354784,423 2,791,541 374,786 409,637793,815 2,746,765 390,348 403,467812,871 2,793,371 386,026 426,845807,628 2,728,473 394,300 413,328
922,255 3,084,465 407,263 514,9921,212,485 4,014,851 568,443 644,0421,190,359 3,890,062 560,098 630,2611,368,000 4,412,903 648,978 719,022 01,547,300 4,912,063 739,809 807,491 0
1,928,279 5,951,478 908,282 1,019,997 02,178,650 6,522,904 1,033,015 1,145,635 02,183,277 6,273,784 1,032,581 1,150,696 02,290,785 6,241,921 1,012,463 1,278,322 (1,000,194)2,277,186 5,869,036 977,393 1,299,793 (589,187)
2,511,421 6,201,040 1,214,192 1,297,229 (587,094)2,584,592 6,183,234 1,214,192 1,370,400 (698,388)
2,662,8006 5,997,297 1,239,300 1,423,500 (918,400)3,070,000 6,227,181 1,231,000 1,422,200 (937,000) 416,8005,450,200 10,130,483 4,096,900 1,353,300 07 0
6,037,600 10,610,896 4,413,300 1,624,300 01,509,400 2,652,724 1,103,325 406,075 06,466,100 10,670,132 4,540,800 1,925,300 06,555,800 10,054,908 4,483,000 2,072,800 06,797,700 9,363,223 4,605,400 2,192,300 0

1980198119821983198310
19841985
19861987198819891990
19911992199319941995
1996199719981999
200011
200112
Year Title V Health Constant MCH CCS EMIC Special Section Abstinenceor MCH Block Dollars Program Program Projects4 5165 EducationGrant Totals1 (per CPI)2 or MCH Sec. 51013
Block Total3
119
6,905,100 8,379,976 4,670,300 2,234,800 07,131,000 7,844,884 4,842,100 2,288,900 06,760,356 7,005,550 6,760,3569
6,778,529 6,805,752 6,778,5292,244,900 2,253,916 2,244,9007,251,027 6,978,852 7,251,0278,686,694 8,073,136 8,686,694
8,313,166 7,585,005 8,313,1669,003,586 7,925,692 9,003,5869,585,289 8,102,527 9,585,289
10,116,311 8,158,315 10,116,31110,249,996 7,842,384 10,249,996
10,973,429 8,056,849 10,973,42912,183,327 8,683,768 12,183,32711,925,070 8,252,644 11,925,07012,279,701 8,285,898 12,279,70112,230,863 8,025,501 12,230,863
12,112,092 7,719,625 12,112,09212,067,031 7,518,399 12,067,03112,052,852 7,394,388 12,052,852 1,067,56912,315,510 7,392,263 12,319,010 600,000
12,453,186 12,319,010 600,00012,453,186 1,067,569
1 Total of amounts shown on the table for each year; does not include Special Projects (Program of Projects), Research, Training, or Special Projects ofRegional and National Significance (SPRANS Grants), and Community Integrated Service Systems monies.
2 These are Constant Dollars for the Title V Health Program totals or the MCH Block Grant totals based on adjustments using the Consumer Price Index(CPI) which defined the average of 1982-1984 as the base year of 100%. 2000-2001 CPI data are not available.
3 Prior to 1952, State Program totals include all of Fund A and most of Fund B, including “Reserved” Funds. For later years, various reserved funds are notincluded in the totals since data were not available for States.
4 Includes projects later known as the “Program of Projects” (M&I, C&Y, Family Planning, Dental, Intensive Infant Care); excludes Family Planning moniesallocated to States in 1970-1972 because these were allocated by the National Center for Family Planning Services. These amounts are not includedin the annual totals.
5 Monies required from FY1975-FY1981 to maintain the FY1973 level of Title V funding defined as the “Hold Harmless” funding base. FY1974 monies inthis category were to enable States to plan for the Program of Projects, including management of existing Special Projects.
6 The total amount shown in FY1973 is not necessarily the base for FY1975 funding levels since some Special Projects were funded for 18 months andother adjustments were necessary.
7 Special Projects monies in 1975 are a portion of $10,472,000 impounded by President Nixon in 1973 and released by court order in 1975.
8 These monies are those used to fund the “transition” quarter in 1976 (July-September) when the Federal Fiscal Year changed from July-June to October-September.
9 Beginning in 1982, a single block allocation was made to each State as the MCH Block Grant.
10 This line is the State’s allocation of the $ 105 million appropriated for care of mothers and children under the 1983 Jobs Bill. It is perceived as 1983supplemental funding but was mostly used in 1984.
11 Represents the amount included in the FY2000 Appropriations as of February 2000.
12 The President’s Budget request for FY2001. Does not include Healthy Start, which is proposed for inclusion in the Title V in FY2001 ($90 million).
13 The Personal Responsibility, and Work Opportunity Reconciliation Act of 1996 created a new section, Section 510 to Title V of the SSA for providingformula grant funds to the States for Abstinence Education. This Act provided a separate appropriation of $50 million for each of the fiscal years1998-2002. This is a permanent appropriation and is counted as mandatory funding under The Budget Enforcement Act.

19361937193819391940
19411942194319441945
19461947194819491950
19511952195319541955
19561957195819591960
19611962196319641965
19661967196819691970
19711972197319741975
197619768
197719781979
Year Title V Health Constant MCH CCS EMIC Special Section Abstinenceor MCH Block Dollars Program Program Projects4 5165 EducationGrant Totals1 (per CPI)2 or MCH Sec. 51013
Block Total3
120
Table 49United States Title V or MCH Block Grant Allocations to Each State (showing Constant Dollars forTotal Amounts) By Program Components, FY 1936 - FY 2001: Texas
120,334 865,712 70,334 50,000343,321 2,384,174 190,591 152,730334,504 2,372,369 188,804 145,700246,094 1,770,460 146,982 99,112341,151 2,436,793 191,443 149,708
432,843 2,944,510 278,872 153,971438,489 2,690,117 284,416 154,073482,689 2,790,110 328,572 154,117 0
1,346,859 7,652,608 289,635 166,071 891,1532,715,942 15,088,567 284,672 101,648 2,329,622
2,553,507 13,094,908 282,446 184,107 2,086,954957,144 4,292,126 506,400 215,791 234,953720,690 2,990,415 477,243 234,327 9,120824,226 3,463,134 452,016 372,210803,866 3,335,544 451,619 352,247
1,027,788 3,953,031 572,564 455,2241,019,497 3,847,158 559,590 459,9071,136,144 4,255,221 601,040 535,104
974,395 3,622,286 504,727 469,6681,009,916 3,768,343 520,087 489,829
1,238,700 4,554,044 536,827 701,8731,362,265 4,847,918 660,801 701,4641,375,631 4,759,969 668,917 706,7141,524,963 5,240,423 653,311 871,6521,474,657 4,981,949 702,315 772,342
1,687,519 5,643,876 723,509 964,0102,259,349 7,481,288 1,024,173 1,235,1762,119,980 6,928,039 1,003,050 1,116,9302,478,462 7,995,039 1,155,796 1,322,666 02,904,362 9,220,197 1,379,752 1,524,610 0
3,748,470 11,569,352 1,773,624 1,974,846 (1,630,112)4,321,472 12,938,539 2,092,525 2,228,947 (1,061,551)4,362,764 12,536,678 2,103,339 2,259,425 (2,101,147)4,636,139 12,632,531 2,084,408 2,551,731 (2,779,771)4,643,986 11,969,036 2,062,132 2,581,854 (3,077,393)
5,228,663 12,910,279 2,584,320 2,644,343 (3,230,760)5,349,720 12,798,373 2,584,320 2,765,400 (3,567,174)
5,513,9006 12,418,694 2,592,900 2,921,000 (5,855,400)5,877,200 11,921,298 2,646,500 2,918,900 (7,093,589) 311,800
11,736,729 21,815,481 8,732,400 2,840,500 (68,625)7 163,829
13,212,400 23,220,387 9,790,200 3,422,200 03,303,100 5,805,097 2,447,550 855,550 0
14,266,300 23,541,749 10,084,600 4,181,700 014,679,300 22,514,264 10,386,600 4,292,700 015,207,600 20,947,107 10,670,600 4,537,000 0

1980198119821983198310
19841985
19861987198819891990
19911992199319941995
1996199719981999
200011
200112
Year Title V Health Constant MCH CCS EMIC Special Section Abstinenceor MCH Block Dollars Program Program Projects4 5165 EducationGrant Totals1 (per CPI)2 or MCH Sec. 51013
Block Total3
121
15,077,400 18,297,816 10,469,800 4,607,600 015,999,900 17,601,650 11,180,900 4,819,000 016,164,144 16,750,408 16,164,1449
16,207,596 16,272,687 16,207,5965,367,600 5,389,157 5,367,600
17,337,348 16,686,572 17,337,34820,770,056 19,303,026 20,770,056
19,876,944 18,135,898 19,876,94421,527,750 18,950,484 21,527,75023,266,559 19,667,421 23,266,55924,865,092 20,052,494 24,865,09225,267,522 19,332,458 25,267,522
27,445,342 20,150,765 27,445,34231,087,417 22,157,817 31,087,41734,951,877 24,188,150 34,951,87736,586,740 24,687,409 36,586,74036,361,594 23,859,314 36,361,594
35,814,052 22,826,037 35,814,05235,726,457 22,259,475 35,726,45735,681,466 21,890,470 35,681,466 4,922,09136,891,982 22,144,047 36,908,116 4,922,091
37,526,660 36,908,116 4,922,09137,526,660 4,922,091
1 Total of amounts shown on the table for each year; does not include Special Projects (Program of Projects), Research, Training, or Special Projects ofRegional and National Significance (SPRANS Grants), and Community Integrated Service Systems monies.
2 These are Constant Dollars for the Title V Health Program totals or the MCH Block Grant totals based on adjustments using the Consumer Price Index(CPI) which defined the average of 1982-1984 as the base year of 100%. 2000-2001 CPI data are not available.
3 Prior to 1952, State Program totals include all of Fund A and most of Fund B, including “Reserved” Funds. For later years, various reserved funds are notincluded in the totals since data were not available for States.
4 Includes projects later known as the “Program of Projects” (M&I, C&Y, Family Planning, Dental, Intensive Infant Care); excludes Family Planning moniesallocated to States in 1970-1972 because these were allocated by the National Center for Family Planning Services. These amounts are not includedin the annual totals.
5 Monies required from FY1975-FY1981 to maintain the FY1973 level of Title V funding defined as the “Hold Harmless” funding base. FY1974 monies inthis category were to enable States to plan for the Program of Projects, including management of existing Special Projects.
6 The total amount shown in FY1973 is not necessarily the base for FY1975 funding levels since some Special Projects were funded for 18 months andother adjustments were necessary.
7 Special Projects monies in 1975 are a portion of $10,472,000 impounded by President Nixon in 1973 and released by court order in 1975.
8 These monies are those used to fund the “transition” quarter in 1976 (July-September) when the Federal Fiscal Year changed from July-June to October-September.
9 Beginning in 1982, a single block allocation was made to each State as the MCH Block Grant.
10 This line is the State’s allocation of the $ 105 million appropriated for care of mothers and children under the 1983 Jobs Bill. It is perceived as 1983supplemental funding but was mostly used in 1984.
11 Represents the amount included in the FY2000 Appropriations as of February 2000.
12 The President’s Budget request for FY2001. Does not include Healthy Start, which is proposed for inclusion in the Title V in FY2001 ($90 million).
13 The Personal Responsibility, and Work Opportunity Reconciliation Act of 1996 created a new section, Section 510 to Title V of the SSA for providingformula grant funds to the States for Abstinence Education. This Act provided a separate appropriation of $50 million for each of the fiscal years1998-2002. This is a permanent appropriation and is counted as mandatory funding under The Budget Enforcement Act.
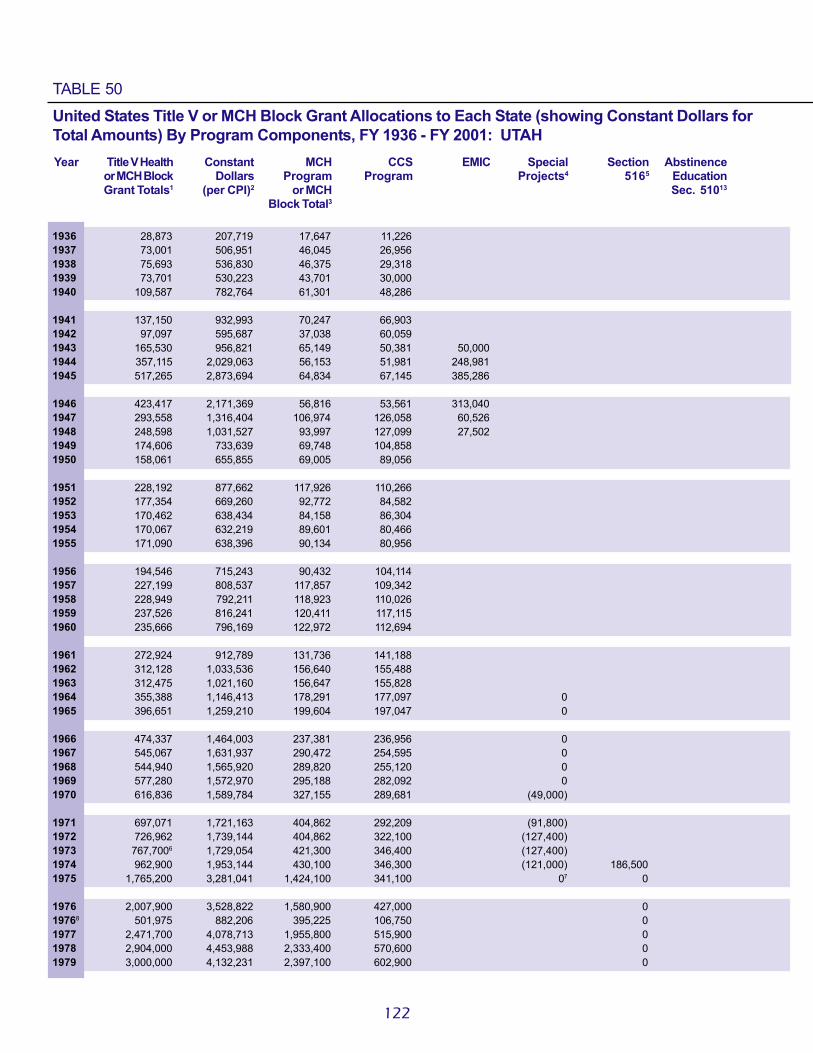
19361937193819391940
19411942194319441945
19461947194819491950
19511952195319541955
19561957195819591960
19611962196319641965
19661967196819691970
19711972197319741975
197619768
197719781979
Year Title V Health Constant MCH CCS EMIC Special Section Abstinenceor MCH Block Dollars Program Program Projects4 5165 EducationGrant Totals1 (per CPI)2 or MCH Sec. 51013
Block Total3
122
TABLE 50United States Title V or MCH Block Grant Allocations to Each State (showing Constant Dollars forTotal Amounts) By Program Components, FY 1936 - FY 2001: UTAH
28,873 207,719 17,647 11,22673,001 506,951 46,045 26,95675,693 536,830 46,375 29,31873,701 530,223 43,701 30,000
109,587 782,764 61,301 48,286
137,150 932,993 70,247 66,90397,097 595,687 37,038 60,059
165,530 956,821 65,149 50,381 50,000357,115 2,029,063 56,153 51,981 248,981517,265 2,873,694 64,834 67,145 385,286
423,417 2,171,369 56,816 53,561 313,040293,558 1,316,404 106,974 126,058 60,526248,598 1,031,527 93,997 127,099 27,502174,606 733,639 69,748 104,858158,061 655,855 69,005 89,056
228,192 877,662 117,926 110,266177,354 669,260 92,772 84,582170,462 638,434 84,158 86,304170,067 632,219 89,601 80,466171,090 638,396 90,134 80,956
194,546 715,243 90,432 104,114227,199 808,537 117,857 109,342228,949 792,211 118,923 110,026237,526 816,241 120,411 117,115235,666 796,169 122,972 112,694
272,924 912,789 131,736 141,188312,128 1,033,536 156,640 155,488312,475 1,021,160 156,647 155,828355,388 1,146,413 178,291 177,097 0396,651 1,259,210 199,604 197,047 0
474,337 1,464,003 237,381 236,956 0545,067 1,631,937 290,472 254,595 0544,940 1,565,920 289,820 255,120 0577,280 1,572,970 295,188 282,092 0616,836 1,589,784 327,155 289,681 (49,000)
697,071 1,721,163 404,862 292,209 (91,800)726,962 1,739,144 404,862 322,100 (127,400)
767,7006 1,729,054 421,300 346,400 (127,400)962,900 1,953,144 430,100 346,300 (121,000) 186,500
1,765,200 3,281,041 1,424,100 341,100 07 0
2,007,900 3,528,822 1,580,900 427,000 0501,975 882,206 395,225 106,750 0
2,471,700 4,078,713 1,955,800 515,900 02,904,000 4,453,988 2,333,400 570,600 03,000,000 4,132,231 2,397,100 602,900 0

1980198119821983198310
19841985
19861987198819891990
19911992199319941995
1996199719981999
200011
200112
Year Title V Health Constant MCH CCS EMIC Special Section Abstinenceor MCH Block Dollars Program Program Projects4 5165 EducationGrant Totals1 (per CPI)2 or MCH Sec. 51013
Block Total3
123
3,318,500 4,027,306 2,683,300 635,200 03,807,900 4,189,109 3,107,400 700,500 03,924,042 4,066,365 3,924,0429
3,934,591 3,950,393 3,934,5911,303,050 1,308,283 1,303,0504,208,852 4,050,868 4,208,8525,042,183 4,686,044 5,042,183
4,825,369 4,402,709 4,825,3695,226,122 4,600,460 5,226,1225,359,095 4,530,089 5,359,0955,473,884 4,414,423 5,473,8845,502,781 4,210,238 5,502,781
5,659,119 4,155,007 5,659,1195,920,699 4,220,028 5,920,6996,123,315 4,237,588 6,123,3156,231,559 4,204,831 6,231,5596,216,652 4,079,168 6,216,652
6,180,400 3,939,069 6,180,4006,151,745 3,832,863 6,151,7456,144,891 3,769,872 6,144,891 325,6666,225,106 3,736,558 6,226,174 325,666
6,267,131 6,226,174 325,6666,267,131 325,666
1 Total of amounts shown on the table for each year; does not include Special Projects (Program of Projects), Research, Training, or Special Projects ofRegional and National Significance (SPRANS Grants), and Community Integrated Service Systems monies.
2 These are Constant Dollars for the Title V Health Program totals or the MCH Block Grant totals based on adjustments using the Consumer Price Index(CPI) which defined the average of 1982-1984 as the base year of 100%. 2000-2001 CPI data are not available.
3 Prior to 1952, State Program totals include all of Fund A and most of Fund B, including “Reserved” Funds. For later years, various reserved funds are notincluded in the totals since data were not available for States.
4 Includes projects later known as the “Program of Projects” (M&I, C&Y, Family Planning, Dental, Intensive Infant Care); excludes Family Planning moniesallocated to States in 1970-1972 because these were allocated by the National Center for Family Planning Services. These amounts are not includedin the annual totals.
5 Monies required from FY1975-FY1981 to maintain the FY1973 level of Title V funding defined as the “Hold Harmless” funding base. FY1974 monies inthis category were to enable States to plan for the Program of Projects, including management of existing Special Projects.
6 The total amount shown in FY1973 is not necessarily the base for FY1975 funding levels since some Special Projects were funded for 18 months andother adjustments were necessary.
7 Special Projects monies in 1975 are a portion of $10,472,000 impounded by President Nixon in 1973 and released by court order in 1975.
8 These monies are those used to fund the “transition” quarter in 1976 (July-September) when the Federal Fiscal Year changed from July-June to October-September.
9 Beginning in 1982, a single block allocation was made to each State as the MCH Block Grant.
10 This line is the State’s allocation of the $ 105 million appropriated for care of mothers and children under the 1983 Jobs Bill. It is perceived as 1983supplemental funding but was mostly used in 1984.
11 Represents the amount included in the FY2000 Appropriations as of February 2000.
12 The President’s Budget request for FY2001. Does not include Healthy Start, which is proposed for inclusion in the Title V in FY2001 ($90 million).
13 The Personal Responsibility, and Work Opportunity Reconciliation Act of 1996 created a new section, Section 510 to Title V of the SSA for providingformula grant funds to the States for Abstinence Education. This Act provided a separate appropriation of $50 million for each of the fiscal years1998-2002. This is a permanent appropriation and is counted as mandatory funding under The Budget Enforcement Act.

19361937193819391940
19411942194319441945
19461947194819491950
19511952195319541955
19561957195819591960
19611962196319641965
19661967196819691970
19711972197319741975
197619768
197719781979
Year Title V Health Constant MCH CCS EMIC Special Section Abstinenceor MCH Block Dollars Program Program Projects4 5165 EducationGrant Totals1 (per CPI)2 or MCH Sec. 51013
Block Total3
124
TABLE 51United States Title V or MCH Block Grant Allocations to Each State (showing Constant Dollars forTotal Amounts) By Program Components, FY 1936 - FY 2001: VERMONT
33,375 240,108 23,388 9,98765,760 456,667 41,782 23,97866,222 469,660 42,244 23,97862,821 451,950 38,843 23,97872,861 520,436 46,194 26,667
73,076 497,116 47,946 25,13073,577 451,393 46,057 27,520
107,720 622,659 61,649 24,071 22,000166,149 944,028 50,722 24,525 90,902153,880 854,889 46,904 24,170 82,806
239,130 1,226,308 47,069 27,000 165,061151,321 678,570 78,783 47,683 24,854110,918 460,241 65,319 44,443 1,156108,146 454,395 61,313 46,833114,463 474,950 66,341 48,122
159,314 612,746 79,654 79,660154,205 581,906 80,307 73,898130,528 488,869 82,921 47,607148,794 553,138 77,391 71,403147,969 552,123 76,951 71,018
167,330 615,184 76,903 90,427194,775 693,149 99,627 95,148196,207 678,917 101,444 94,763200,120 687,698 101,417 98,703197,256 666,405 101,933 95,323
229,975 769,147 111,486 118,489247,490 819,503 124,062 123,428248,155 810,964 124,013 124,142268,129 864,932 134,219 133,910 0289,077 917,705 144,840 144,237 0
329,000 1,015,432 164,334 164,666 0347,987 1,041,877 174,797 173,190 0348,950 1,002,730 174,797 174,053 0361,868 986,016 174,918 186,950 0378,091 974,461 185,425 192,666 0
389,180 960,938 195,331 193,849 0397,631 951,270 195,331 202,300 0
401,3006 903,829 196,800 204,500 0473,400 960,243 197,000 204,400 (160,000) 72,000765,100 1,422,119 561,100 204,000 07 0
912,300 1,603,339 658,100 254,200 0228,075 400,835 164,525 63,550 0959,200 1,582,838 656,400 302,800 0988,500 1,516,104 668,100 320,400 0
1,025,000 1,411,846 686,300 338,700 0
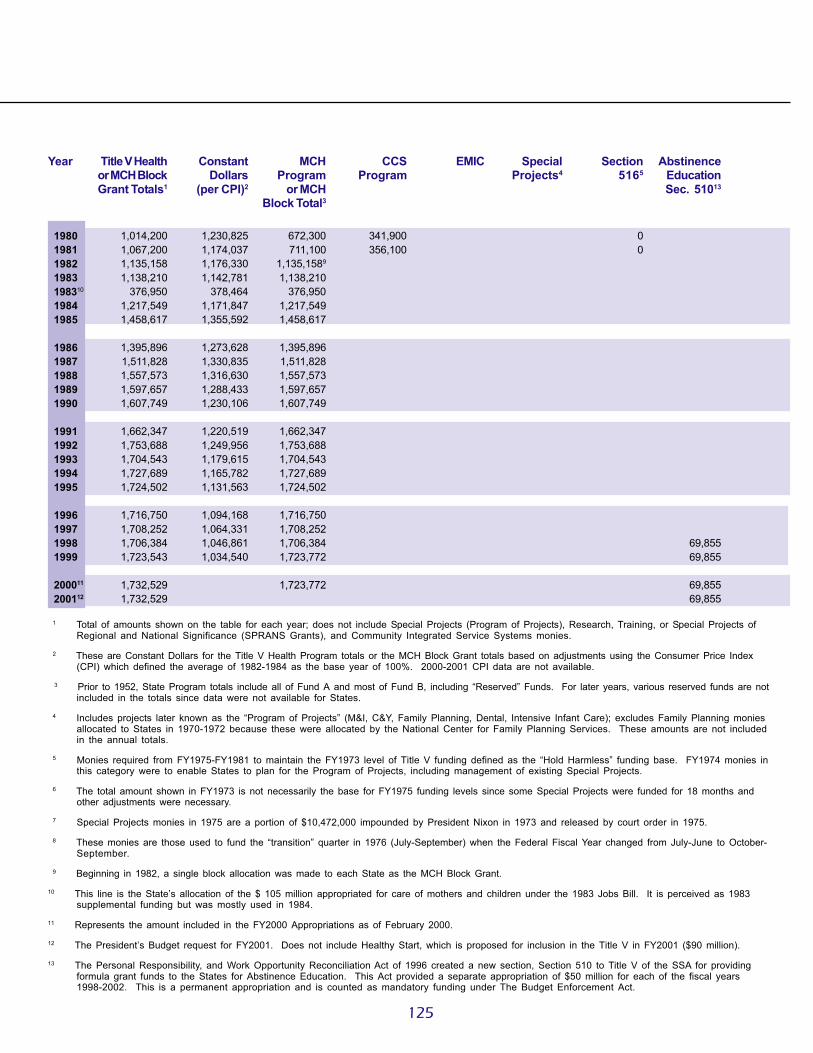
1980198119821983198310
19841985
19861987198819891990
19911992199319941995
1996199719981999
200011
200112
Year Title V Health Constant MCH CCS EMIC Special Section Abstinenceor MCH Block Dollars Program Program Projects4 5165 EducationGrant Totals1 (per CPI)2 or MCH Sec. 51013
Block Total3
125
1,014,200 1,230,825 672,300 341,900 01,067,200 1,174,037 711,100 356,100 01,135,158 1,176,330 1,135,1589
1,138,210 1,142,781 1,138,210376,950 378,464 376,950
1,217,549 1,171,847 1,217,5491,458,617 1,355,592 1,458,617
1,395,896 1,273,628 1,395,8961,511,828 1,330,835 1,511,8281,557,573 1,316,630 1,557,5731,597,657 1,288,433 1,597,6571,607,749 1,230,106 1,607,749
1,662,347 1,220,519 1,662,3471,753,688 1,249,956 1,753,6881,704,543 1,179,615 1,704,5431,727,689 1,165,782 1,727,6891,724,502 1,131,563 1,724,502
1,716,750 1,094,168 1,716,7501,708,252 1,064,331 1,708,2521,706,384 1,046,861 1,706,384 69,8551,723,543 1,034,540 1,723,772 69,855
1,732,529 1,723,772 69,8551,732,529 69,855
1 Total of amounts shown on the table for each year; does not include Special Projects (Program of Projects), Research, Training, or Special Projects ofRegional and National Significance (SPRANS Grants), and Community Integrated Service Systems monies.
2 These are Constant Dollars for the Title V Health Program totals or the MCH Block Grant totals based on adjustments using the Consumer Price Index(CPI) which defined the average of 1982-1984 as the base year of 100%. 2000-2001 CPI data are not available.
3 Prior to 1952, State Program totals include all of Fund A and most of Fund B, including “Reserved” Funds. For later years, various reserved funds are notincluded in the totals since data were not available for States.
4 Includes projects later known as the “Program of Projects” (M&I, C&Y, Family Planning, Dental, Intensive Infant Care); excludes Family Planning moniesallocated to States in 1970-1972 because these were allocated by the National Center for Family Planning Services. These amounts are not includedin the annual totals.
5 Monies required from FY1975-FY1981 to maintain the FY1973 level of Title V funding defined as the “Hold Harmless” funding base. FY1974 monies inthis category were to enable States to plan for the Program of Projects, including management of existing Special Projects.
6 The total amount shown in FY1973 is not necessarily the base for FY1975 funding levels since some Special Projects were funded for 18 months andother adjustments were necessary.
7 Special Projects monies in 1975 are a portion of $10,472,000 impounded by President Nixon in 1973 and released by court order in 1975.
8 These monies are those used to fund the “transition” quarter in 1976 (July-September) when the Federal Fiscal Year changed from July-June to October-September.
9 Beginning in 1982, a single block allocation was made to each State as the MCH Block Grant.
10 This line is the State’s allocation of the $ 105 million appropriated for care of mothers and children under the 1983 Jobs Bill. It is perceived as 1983supplemental funding but was mostly used in 1984.
11 Represents the amount included in the FY2000 Appropriations as of February 2000.
12 The President’s Budget request for FY2001. Does not include Healthy Start, which is proposed for inclusion in the Title V in FY2001 ($90 million).
13 The Personal Responsibility, and Work Opportunity Reconciliation Act of 1996 created a new section, Section 510 to Title V of the SSA for providingformula grant funds to the States for Abstinence Education. This Act provided a separate appropriation of $50 million for each of the fiscal years1998-2002. This is a permanent appropriation and is counted as mandatory funding under The Budget Enforcement Act.
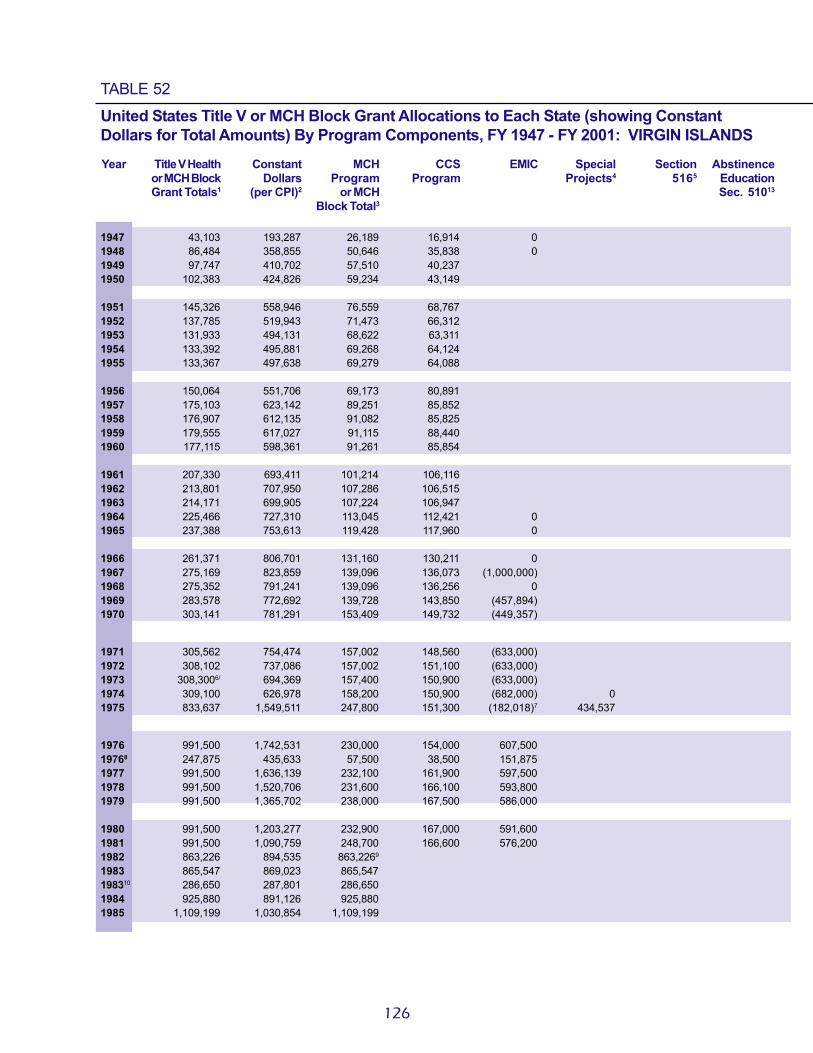
126
Year Title V Health Constant MCH CCS EMIC Special Section Abstinenceor MCH Block Dollars Program Program Projects4 5165 EducationGrant Totals1 (per CPI)2 or MCH Sec. 51013
Block Total3
126
TABLE 52United States Title V or MCH Block Grant Allocations to Each State (showing ConstantDollars for Total Amounts) By Program Components, FY 1947 - FY 2001: VIRGIN ISLANDS
1947 43,103 193,287 26,189 16,914 01948 86,484 358,855 50,646 35,838 01949 97,747 410,702 57,510 40,2371950 102,383 424,826 59,234 43,149
1951 145,326 558,946 76,559 68,7671952 137,785 519,943 71,473 66,3121953 131,933 494,131 68,622 63,3111954 133,392 495,881 69,268 64,1241955 133,367 497,638 69,279 64,088
1956 150,064 551,706 69,173 80,8911957 175,103 623,142 89,251 85,8521958 176,907 612,135 91,082 85,8251959 179,555 617,027 91,115 88,4401960 177,115 598,361 91,261 85,854
1961 207,330 693,411 101,214 106,1161962 213,801 707,950 107,286 106,5151963 214,171 699,905 107,224 106,9471964 225,466 727,310 113,045 112,421 01965 237,388 753,613 119,428 117,960 0
1966 261,371 806,701 131,160 130,211 01967 275,169 823,859 139,096 136,073 (1,000,000)1968 275,352 791,241 139,096 136,256 01969 283,578 772,692 139,728 143,850 (457,894)1970 303,141 781,291 153,409 149,732 (449,357)
1971 305,562 754,474 157,002 148,560 (633,000)1972 308,102 737,086 157,002 151,100 (633,000)1973 308,3006/ 694,369 157,400 150,900 (633,000)1974 309,100 626,978 158,200 150,900 (682,000) 01975 833,637 1,549,511 247,800 151,300 (182,018)7 434,537
1976 991,500 1,742,531 230,000 154,000 607,50019768 247,875 435,633 57,500 38,500 151,8751977 991,500 1,636,139 232,100 161,900 597,5001978 991,500 1,520,706 231,600 166,100 593,8001979 991,500 1,365,702 238,000 167,500 586,000
1980 991,500 1,203,277 232,900 167,000 591,6001981 991,500 1,090,759 248,700 166,600 576,2001982 863,226 894,535 863,2269
1983 865,547 869,023 865,547198310 286,650 287,801 286,6501984 925,880 891,126 925,8801985 1,109,199 1,030,854 1,109,199

127
Year Title V Health Constant MCH CCS EMIC Special Section Abstinenceor MCH Block Dollars Program Program Projects4 5165 EducationGrant Totals1 (per CPI)2 or MCH Sec. 51013
Block Total3
126
1986 1,061,503 968,525 1,061,5031987 1,149,669 1,012,033 1,149,6691988 1,212,890 1,025,266 1,212,8901989 1,270,251 1,024,396 1,270,2511990 1,284,692 982,932 1,284,692
1991 1,362,835 1,000,613 1,362,8351992 1,493,532 1,064,527 1,493,5321993 1,523,173 1,054,099 1,523,1731994 1,568,513 1,058,376 1,568,5131995 1,562,269 1,025,111 1,562,269
1996 1,547,084 986,032 1,547,0841997 1,541,331 960,331 1,541,3311998 1,539,520 944,491 1,539,520 136,5091999 1,573,102 944,239 1,573,549 136,509200011/ 1,590,703 1,573,549 136,509200112/ 1,590,703 136,509
1 Total of amounts shown on the table for each year; does not include Special Projects (Program of Projects), Research, Training, or Special Projects ofRegional and National Significance (SPRANS Grants), and Community Integrated Service Systems monies.
2 These are Constant Dollars for the Title V Health Program totals or the MCH Block Grant totals based on adjustments using the Consumer Price Index(CPI) which defined the average of 1982-1984 as the base year of 100%. 2000-2001 CPI data are not available.
3 Prior to 1952, State Program totals include all of Fund A and most of Fund B, including “Reserved” Funds. For later years, various reserved funds are noincluded in the totals since data were not available for States.
4 Includes projects later known as the “Program of Projects” (M&I, C&Y, Family Planning, Dental, Intensive Infant Care); excludes Family Planning moniesallocated to States in 1970-1972 because these were allocated by the National Center for Family Planning Services. These amounts are not includedin the annual totals.
5 Monies required from FY1975-FY1981 to maintain the FY1973 level of Title V funding defined as the “Hold Harmless” funding base. FY1974 monies inthis category were to enable States to plan for the Program of Projects, including management of existing Special Projects.
6 The total amount shown in FY1973 is not necessarily the base for FY1975 funding levels since some Special Projects were funded for 18 months andother adjustments were necessary.
7 Special Projects monies in 1975 are a portion of $10,472,000 impounded by President Nixon in 1973 and released by court order in 1975.
8 These monies are those used to fund the “transition” quarter in 1976 (July-September) when the Federal Fiscal Year changed from July-June to October-September.
9 Beginning in 1982, a single block allocation was made to each State as the MCH Block Grant.
10 This line is the State’s allocation of the $ 105 million appropriated for care of mothers and children under the 1983 Jobs Bill. It is perceived as 1983supplemental funding but was mostly used in 1984.
11 Represents the amount included in the FY2000 Appropriations as of February 2000.
12 The President’s Budget request for FY2001. Does not include Healthy Start, which is proposed for inclusion in the Title V in FY2001 ($90 million).
13 The Personal Responsibility, and Work Opportunity Reconciliation Act of 1996 created a new section, Section 510 to Title V of the SSA for providingformula grant funds to the States for Abstinence Education. This Act provided a separate appropriation of $50 million for each of the fiscal years1998-2002. This is a permanent appropriation and is counted as mandatory funding under The Budget Enforcement Act.

19361937193819391940
19411942194319441945
19461947194819491950
19511952195319541955
19561957195819591960
19611962196319641965
19661967196819691970
19711972197319741975
197619768
197719781979
Year Title V Health Constant MCH CCS EMIC Special Section Abstinenceor MCH Block Dollars Program Program Projects4 5165 EducationGrant Totals1 (per CPI)2 or MCH Sec. 51013
Block Total3
128
TABLE 53United States Title V or MCH Block Grant Allocations to Each State (showing Constant Dollars forTotal Amounts) By Program Components, FY 1936 - FY 2001: VIRGINIA
56,300 405,036 34,627 21,673163,517 1,135,535 90,220 73,297166,101 1,178,021 95,438 70,663166,639 1,198,842 94,599 72,040192,807 1,377,193 110,071 82,736
240,142 1,633,619 137,719 102,423219,070 1,343,988 117,548 101,522242,599 1,402,306 130,603 111,996 0580,735 3,299,631 153,196 97,539 330,000
1,226,474 6,813,744 137,542 106,742 982,190
847,913 4,348,272 139,801 116,836 591,276786,951 3,528,928 353,795 185,081 248,075619,064 2,568,730 286,777 277,153 55,134634,727 2,666,920 318,038 316,689492,742 2,044,573 277,150 215,592
602,371 2,316,812 347,715 254,656590,232 2,227,291 315,311 274,921644,122 2,412,442 342,480 301,642568,801 2,114,502 300,646 268,155573,478 2,139,843 305,556 267,922
686,429 2,523,636 306,112 380,317742,978 2,644,050 370,311 372,667754,106 2,609,363 387,313 366,793772,672 2,655,230 373,835 398,837800,796 2,705,392 399,392 401,404
912,786 3,052,796 412,465 500,3211,240,136 4,106,411 595,526 644,6101,212,262 3,961,641 584,780 627,4821,430,382 4,614,135 700,020 730,362 01,633,838 5,186,787 810,768 823,070 0
2,104,394 6,495,043 1,038,227 1,066,167 (573,906)2,333,510 6,986,557 1,129,103 1,204,407 (910,000)2,064,519 5,932,526 991,769 1,072,750 (1,713,447)2,190,511 5,968,695 986,181 1,204,330 (1,315,153)2,427,775 6,257,152 1,079,310 1,348,465 (1,599,529)
2,695,374 6,655,244 1,325,581 1,369,793 (1,734,943)2,742,781 6,561,677 1,325,581 1,417,200 (1,515,557)2,837,6006 6,390,991 1,343,300 1,494,300 (1,595,500)3,014,500 6,114,604 1,300,400 1,493,000 (1,968,400) 221,1005,720,300 10,632,528 4,317,800 1,402,500 07 0
6,278,700 11,034,622 4,647,000 1,631,700 01,569,675 2,758,656 1,161,750 407,925 06,698,100 11,052,970 4,724,400 1,973,700 06,763,000 10,372,699 4,678,300 2,084,700 07,010,200 9,655,923 4,806,000 2,204,200 0

1980198119821983198310
19841985
19861987198819891990
19911992199319941995
1996199719981999
200011
200112
Year Title V Health Constant MCH CCS EMIC Special Section Abstinenceor MCH Block Dollars Program Program Projects4 5165 EducationGrant Totals1 (per CPI)2 or MCH Sec. 51013
Block Total3
129
7,016,900 8,515,655 4,794,200 2,222,700 07,221,600 7,944,554 4,947,700 2,273,900 07,585,638 7,860,765 7,585,6389
7,606,030 7,636,576 7,606,0302,518,950 2,529,066 2,518,9508,136,209 7,830,808 8,136,2099,747,137 9,058,678 9,747,137
9,328,010 8,510,958 9,328,01010,102,714 8,893,234 10,102,71410,586,378 8,948,756 10,586,37811,022,452 8,889,074 11,022,45211,132,233 8,517,393 11,132,233
11,726,280 8,609,604 11,726,28012,719,879 9,066,200 12,719,87912,376,970 8,565,377 12,376,97012,652,203 8,537,249 12,652,20312,614,299 8,277,099 12,614,299
12,522,119 7,980,955 12,522,11912,468,416 7,768,483 12,468,41612,454,235 7,640,635 12,454,235 828,61912,658,141 7,597,924 12,660,857 828,619
12,764,996 12,660,857 828,61912,764,996 828,619
1 Total of amounts shown on the table for each year; does not include Special Projects (Program of Projects), Research, Training, or Special Projects ofRegional and National Significance (SPRANS Grants), and Community Integrated Service Systems monies.
2 These are Constant Dollars for the Title V Health Program totals or the MCH Block Grant totals based on adjustments using the Consumer Price Index(CPI) which defined the average of 1982-1984 as the base year of 100%. 2000-2001 CPI data are not available.
3 Prior to 1952, State Program totals include all of Fund A and most of Fund B, including “Reserved” Funds. For later years, various reserved funds are notincluded in the totals since data were not available for States.
4 Includes projects later known as the “Program of Projects” (M&I, C&Y, Family Planning, Dental, Intensive Infant Care); excludes Family Planning moniesallocated to States in 1970-1972 because these were allocated by the National Center for Family Planning Services. These amounts are not includedin the annual totals.
5 Monies required from FY1975-FY1981 to maintain the FY1973 level of Title V funding defined as the “Hold Harmless” funding base. FY1974 monies inthis category were to enable States to plan for the Program of Projects, including management of existing Special Projects.
6 The total amount shown in FY1973 is not necessarily the base for FY1975 funding levels since some Special Projects were funded for 18 months andother adjustments were necessary.
7 Special Projects monies in 1975 are a portion of $10,472,000 impounded by President Nixon in 1973 and released by court order in 1975.
8 These monies are those used to fund the “transition” quarter in 1976 (July-September) when the Federal Fiscal Year changed from July-June to October-September.
9 Beginning in 1982, a single block allocation was made to each State as the MCH Block Grant.
10 This line is the State’s allocation of the $ 105 million appropriated for care of mothers and children under the 1983 Jobs Bill. It is perceived as 1983supplemental funding but was mostly used in 1984.
11 Represents the amount included in the FY2000 Appropriations as of February 2000.
12 The President’s Budget request for FY2001. Does not include Healthy Start, which is proposed for inclusion in the Title V in FY2001 ($90 million).
13 The Personal Responsibility, and Work Opportunity Reconciliation Act of 1996 created a new section, Section 510 to Title V of the SSA for providingformula grant funds to the States for Abstinence Education. This Act provided a separate appropriation of $50 million for each of the fiscal years1998-2002. This is a permanent appropriation and is counted as mandatory funding under The Budget Enforcement Act.
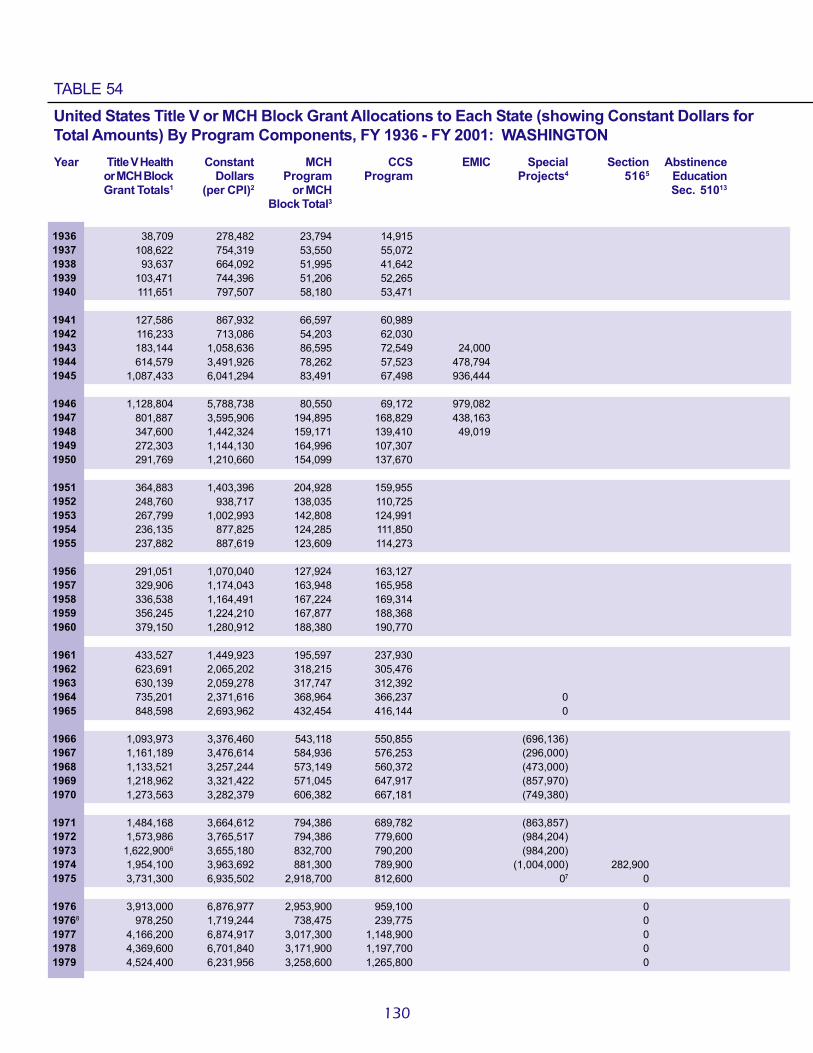
19361937193819391940
19411942194319441945
19461947194819491950
19511952195319541955
19561957195819591960
19611962196319641965
19661967196819691970
19711972197319741975
197619768
197719781979
Year Title V Health Constant MCH CCS EMIC Special Section Abstinenceor MCH Block Dollars Program Program Projects4 5165 EducationGrant Totals1 (per CPI)2 or MCH Sec. 51013
Block Total3
130
TABLE 54United States Title V or MCH Block Grant Allocations to Each State (showing Constant Dollars forTotal Amounts) By Program Components, FY 1936 - FY 2001: WASHINGTON
38,709 278,482 23,794 14,915108,622 754,319 53,550 55,072
93,637 664,092 51,995 41,642103,471 744,396 51,206 52,265111,651 797,507 58,180 53,471
127,586 867,932 66,597 60,989116,233 713,086 54,203 62,030183,144 1,058,636 86,595 72,549 24,000614,579 3,491,926 78,262 57,523 478,794
1,087,433 6,041,294 83,491 67,498 936,444
1,128,804 5,788,738 80,550 69,172 979,082801,887 3,595,906 194,895 168,829 438,163347,600 1,442,324 159,171 139,410 49,019272,303 1,144,130 164,996 107,307291,769 1,210,660 154,099 137,670
364,883 1,403,396 204,928 159,955248,760 938,717 138,035 110,725267,799 1,002,993 142,808 124,991236,135 877,825 124,285 111,850237,882 887,619 123,609 114,273
291,051 1,070,040 127,924 163,127329,906 1,174,043 163,948 165,958336,538 1,164,491 167,224 169,314356,245 1,224,210 167,877 188,368379,150 1,280,912 188,380 190,770
433,527 1,449,923 195,597 237,930623,691 2,065,202 318,215 305,476630,139 2,059,278 317,747 312,392735,201 2,371,616 368,964 366,237 0848,598 2,693,962 432,454 416,144 0
1,093,973 3,376,460 543,118 550,855 (696,136)1,161,189 3,476,614 584,936 576,253 (296,000)1,133,521 3,257,244 573,149 560,372 (473,000)1,218,962 3,321,422 571,045 647,917 (857,970)1,273,563 3,282,379 606,382 667,181 (749,380)
1,484,168 3,664,612 794,386 689,782 (863,857)1,573,986 3,765,517 794,386 779,600 (984,204)
1,622,9006 3,655,180 832,700 790,200 (984,200)1,954,100 3,963,692 881,300 789,900 (1,004,000) 282,9003,731,300 6,935,502 2,918,700 812,600 07 0
3,913,000 6,876,977 2,953,900 959,100 0978,250 1,719,244 738,475 239,775 0
4,166,200 6,874,917 3,017,300 1,148,900 04,369,600 6,701,840 3,171,900 1,197,700 04,524,400 6,231,956 3,258,600 1,265,800 0

1980198119821983198310
19841985
19861987198819891990
19911992199319941995
1996199719981999
200011
200112
Year Title V Health Constant MCH CCS EMIC Special Section Abstinenceor MCH Block Dollars Program Program Projects4 5165 EducationGrant Totals1 (per CPI)2 or MCH Sec. 51013
Block Total3
131
4,742,500 5,755,461 3,449,100 1,293,400 05,080,100 5,588,669 3,704,500 1,375,600 05,116,116 5,301,675 5,116,1169
5,129,869 5,150,471 5,129,8691,698,900 1,705,723 1,698,9005,487,447 5,281,470 5,487,4476,573,934 6,109,604 6,573,934
6,291,255 5,740,196 6,291,2556,813,752 5,998,021 6,813,7527,104,022 6,005,090 7,104,0227,364,169 5,938,846 7,364,1697,429,660 5,684,514 7,429,660
7,784,037 5,715,152 7,784,0378,376,794 5,970,630 8,376,7948,837,640 6,116,014 8,837,6409,083,159 6,128,987 9,083,1599,049,347 5,937,892 9,049,347
8,967,119 5,715,181 8,967,1198,932,433 5,565,379 8,932,4338,922,024 5,473,634 8,922,024 739,0129,103,879 5,464,513 9,106,302 739,012
9,199,196 9,106,302 739,0129,199,196 739,012
1 Total of amounts shown on the table for each year; does not include Special Projects (Program of Projects), Research, Training, or Special Projects ofRegional and National Significance (SPRANS Grants), and Community Integrated Service Systems monies.
2 These are Constant Dollars for the Title V Health Program totals or the MCH Block Grant totals based on adjustments using the Consumer Price Index(CPI) which defined the average of 1982-1984 as the base year of 100%. 2000-2001 CPI data are not available.
3 Prior to 1952, State Program totals include all of Fund A and most of Fund B, including “Reserved” Funds. For later years, various reserved funds are notincluded in the totals since data were not available for States.
4 Includes projects later known as the “Program of Projects” (M&I, C&Y, Family Planning, Dental, Intensive Infant Care); excludes Family Planning moniesallocated to States in 1970-1972 because these were allocated by the National Center for Family Planning Services. These amounts are not includedin the annual totals.
5 Monies required from FY1975-FY1981 to maintain the FY1973 level of Title V funding defined as the “Hold Harmless” funding base. FY1974 monies inthis category were to enable States to plan for the Program of Projects, including management of existing Special Projects.
6 The total amount shown in FY1973 is not necessarily the base for FY1975 funding levels since some Special Projects were funded for 18 months andother adjustments were necessary.
7 Special Projects monies in 1975 are a portion of $10,472,000 impounded by President Nixon in 1973 and released by court order in 1975.
8 These monies are those used to fund the “transition” quarter in 1976 (July-September) when the Federal Fiscal Year changed from July-June to October-September.
9 Beginning in 1982, a single block allocation was made to each State as the MCH Block Grant.
10 This line is the State’s allocation of the $ 105 million appropriated for care of mothers and children under the 1983 Jobs Bill. It is perceived as 1983supplemental funding but was mostly used in 1984.
11 Represents the amount included in the FY2000 Appropriations as of February 2000.
12 The President’s Budget request for FY2001. Does not include Healthy Start, which is proposed for inclusion in the Title V in FY2001 ($90 million).
13 The Personal Responsibility, and Work Opportunity Reconciliation Act of 1996 created a new section, Section 510 to Title V of the SSA for providingformula grant funds to the States for Abstinence Education. This Act provided a separate appropriation of $50 million for each of the fiscal years1998-2002. This is a permanent appropriation and is counted as mandatory funding under The Budget Enforcement Act.

19361937193819391940
19411942194319441945
19461947194819491950
19511952195319541955
19561957195819591960
19611962196319641965
19661967196819691970
19711972197319741975
197619768
197719781979
Year Title V Health Constant MCH CCS EMIC Special Section Abstinenceor MCH Block Dollars Program Program Projects4 5165 EducationGrant Totals1 (per CPI)2 or MCH Sec. 51013
Block Total3
132
TABLE 55United States Title V or MCH Block Grant Allocations to Each State (showing Constant Dollars forTotal Amounts) By Program Components, FY 1936 - FY 2001: WEST VIRGINIA
54,031 388,712 27,763 26,268151,881 1,054,729 70,133 81,748136,227 966,149 66,524 69,703122,272 879,655 68,599 53,673145,543 1,039,593 75,670 69,873
179,779 1,222,986 100,614 79,165161,853 992,963 77,630 84,223179,799 1,039,301 87,168 62,631 30,000568,699 3,231,244 102,085 59,434 407,180759,225 4,217,917 94,598 53,216 611,411
527,830 2,706,821 98,068 62,430 367,332549,369 2,463,538 201,091 192,780 155,498405,505 1,682,593 244,514 134,791 26,200364,573 1,531,819 227,458 137,115347,659 1,442,568 221,324 126,335
474,867 1,826,412 259,581 215,286427,055 1,611,528 218,068 208,987468,546 1,754,854 238,377 230,169414,153 1,539,602 206,546 207,607398,100 1,485,448 198,299 199,801
460,270 1,692,169 189,614 270,656494,550 1,759,964 222,805 271,745491,063 1,699,180 226,381 264,682484,819 1,666,045 212,032 272,787473,128 1,598,405 214,953 258,175
544,434 1,820,849 222,976 321,458701,760 2,323,709 313,045 388,715668,491 2,184,611 293,903 374,588735,755 2,373,403 326,348 409,407 (98,537)823,090 2,612,984 363,328 459,762 0
999,609 3,085,213 456,124 543,485 (185,919)1,126,589 3,373,021 524,318 602,271 (226,628)1,154,478 3,317,466 536,962 617,516 (395,021)1,192,463 3,249,218 519,183 673,280 (462,740)1,186,535 3,058,080 505,176 681,359 (437,097)
1,302,369 3,215,726 624,050 678,319 (488,203)1,332,450 3,187,679 624,050 708,400 (612,776)1,387,9006 3,125,901 646,200 741,700 (612,800)1,527,100 3,097,566 603,100 740,900 (619,000) 183,1002,747,700 5,107,249 2,007,700 740,000 07 0
3,263,700 5,735,852 2,393,000 870,700 0815,925 1,433,963 598,250 217,675 0
3,561,700 5,877,393 2,520,900 1,040,800 03,668,100 5,625,920 2,576,100 1,092,000 03,801,500 5,236,226 2,646,400 1,155,100 0

1980198119821983198310
19841985
19861987198819891990
19911992199319941995
1996199719981999
200011
200112
Year Title V Health Constant MCH CCS EMIC Special Section Abstinenceor MCH Block Dollars Program Program Projects4 5165 EducationGrant Totals1 (per CPI)2 or MCH Sec. 51013
Block Total3
133
3,839,000 4,658,981 2,667,100 1,171,900 03,912,100 4,303,740 2,692,400 1,219,700 04,041,036 4,187,602 4,041,0369
4,051,899 4,068,172 4,051,8991,341,900 1,347,289 1,341,9004,334,337 4,171,643 4,334,3375,192,514 4,825,757 5,192,514
4,969,236 4,533,974 4,969,2365,381,938 4,737,621 5,381,9385,611,217 4,743,210 5,611,2175,816,702 4,690,889 5,816,7025,868,433 4,490,002 5,868,433
6,148,349 4,514,206 6,148,3496,616,558 4,716,007 6,616,5586,718,626 4,649,568 6,718,6266,880,543 4,642,742 6,880,5436,858,245 4,500,161 6,858,245
6,804,016 4,336,530 6,804,0166,775,799 4,221,682 6,775,7996,768,029 4,152,165 6,768,029 487,5366,887,975 4,134,439 6,889,573 487,536
6,950,837 6,889,573 487,5366,950,837 487,536
1 Total of amounts shown on the table for each year; does not include Special Projects (Program of Projects), Research, Training, or Special Projects ofRegional and National Significance (SPRANS Grants), and Community Integrated Service Systems monies.
2 These are Constant Dollars for the Title V Health Program totals or the MCH Block Grant totals based on adjustments using the Consumer Price Index(CPI) which defined the average of 1982-1984 as the base year of 100%. 2000-2001 CPI data are not available.
3 Prior to 1952, State Program totals include all of Fund A and most of Fund B, including “Reserved” Funds. For later years, various reserved funds are notincluded in the totals since data were not available for States.
4 Includes projects later known as the “Program of Projects” (M&I, C&Y, Family Planning, Dental, Intensive Infant Care); excludes Family Planning moniesallocated to States in 1970-1972 because these were allocated by the National Center for Family Planning Services. These amounts are not includedin the annual totals.
5 Monies required from FY1975-FY1981 to maintain the FY1973 level of Title V funding defined as the “Hold Harmless” funding base. FY1974 monies inthis category were to enable States to plan for the Program of Projects, including management of existing Special Projects.
6 The total amount shown in FY1973 is not necessarily the base for FY1975 funding levels since some Special Projects were funded for 18 months andother adjustments were necessary.
7 Special Projects monies in 1975 are a portion of $10,472,000 impounded by President Nixon in 1973 and released by court order in 1975.
8 These monies are those used to fund the “transition” quarter in 1976 (July-September) when the Federal Fiscal Year changed from July-June to October-September.
9 Beginning in 1982, a single block allocation was made to each State as the MCH Block Grant.
10 This line is the State’s allocation of the $ 105 million appropriated for care of mothers and children under the 1983 Jobs Bill. It is perceived as 1983supplemental funding but was mostly used in 1984.
11 Represents the amount included in the FY2000 Appropriations as of February 2000.
12 The President’s Budget request for FY2001. Does not include Healthy Start, which is proposed for inclusion in the Title V in FY2001 ($90 million).
13 The Personal Responsibility, and Work Opportunity Reconciliation Act of 1996 created a new section, Section 510 to Title V of the SSA for providingformula grant funds to the States for Abstinence Education. This Act provided a separate appropriation of $50 million for each of the fiscal years1998-2002. This is a permanent appropriation and is counted as mandatory funding under The Budget Enforcement Act.

19361937193819391940
19411942194319441945
19461947194819491950
19511952195319541955
19561957195819591960
19611962196319641965
19661967196819691970
19711972197319741975
197619768
197719781979
Year Title V Health Constant MCH CCS EMIC Special Section Abstinenceor MCH Block Dollars Program Program Projects4 5165 EducationGrant Totals1 (per CPI)2 or MCH Sec. 51013
Block Total3
134
TABLE 56United States Title V or MCH Block Grant Allocations to Each State (showing Constant Dollars forTotal Amounts) By Program Components, FY 1936 - FY 2001: WISCONSIN
51,576 371,050 29,317 22,259123,956 860,806 70,509 53,447133,485 946,702 71,552 61,933134,589 968,266 71,142 63,447156,379 1,116,993 85,100 71,279
180,865 1,230,374 98,219 82,646171,903 1,054,620 94,653 77,250243,462 1,407,295 100,323 85,768 57,371811,669 4,611,756 99,951 106,146 605,572993,890 5,521,611 95,175 81,143 817,572
883,621 4,531,390 96,396 69,421 717,804468,450 2,100,673 163,903 148,901 155,646346,902 1,439,427 147,776 161,104 38,022353,137 1,483,769 166,880 186,257338,794 1,405,784 171,720 167,074
423,816 1,630,062 205,152 218,664427,243 1,612,238 229,880 197,363375,832 1,407,610 158,213 217,619416,737 1,549,208 222,251 194,486425,734 1,588,560 226,003 199,731
499,065 1,834,798 224,736 274,329566,890 2,017,402 283,118 283,772582,645 2,016,073 293,932 288,713608,669 2,091,646 298,506 310,163622,992 2,104,703 307,860 315,132
711,405 2,379,281 318,362 393,043955,582 3,164,179 459,001 496,581956,554 3,125,993 462,691 493,863
1,100,706 3,550,665 525,781 574,925 01,248,692 3,964,102 594,171 654,521 0
1,570,531 4,847,318 750,131 820,400 01,827,791 5,472,428 906,096 921,695 01,830,484 5,260,011 905,187 925,297 01,935,029 5,272,559 893,676 1,041,353 01,882,569 4,851,982 838,813 1,043,756 0
2,046,612 5,053,363 997,099 1,049,513 02,200,699 5,264,830 997,099 1,203,600 0
2,272,4006 5,118,018 1,032,600 1,239,800 (100,000)2,754,100 5,586,410 1,056,000 1,238,800 (100,000) 459,3004,810,200 8,940,892 3,496,400 1,313,800 07 0
5,333,900 9,374,165 3,754,500 1,579,400 01,333,475 2,343,541 938,625 394,850 05,713,100 9,427,558 3,846,300 1,866,800 06,082,200 9,328,528 4,095,900 1,986,300 06,307,900 8,688,567 4,207,700 2,100,200 0

1980198119821983198310
19841985
19861987198819891990
19911992199319941995
1996199719981999
200011
200112
Year Title V Health Constant MCH CCS EMIC Special Section Abstinenceor MCH Block Dollars Program Program Projects4 5165 EducationGrant Totals1 (per CPI)2 or MCH Sec. 51013
Block Total3
135
6,236,900 7,569,053 4,184,300 2,052,600 06,564,100 7,221,232 4,438,100 2,126,000 06,893,160 7,143,171 6,893,1609
6,911,690 6,939,448 6,911,6902,289,000 2,298,193 2,289,0007,393,470 7,115,948 7,393,4708,857,340 8,231,729 8,857,340
8,476,474 7,734,009 8,476,4749,180,457 8,081,388 9,180,4579,497,364 8,028,203 9,497,3649,777,755 7,885,286 9,777,7559,848,343 7,535,075 9,848,343
10,230,274 7,511,214 10,230,27410,869,184 7,747,102 10,869,18411,364,047 7,864,392 11,364,04711,628,447 7,846,455 11,628,44711,592,035 7,606,322 11,592,035
11,503,483 7,331,729 11,503,48311,455,049 7,137,102 11,455,04911,441,961 7,019,608 11,441,961 795,85911,637,833 6,985,494 11,640,442 795,859
11,740,481 11,640,442 795,85911,740,481 795,859
1 Total of amounts shown on the table for each year; does not include Special Projects (Program of Projects), Research, Training, or Special Projects ofRegional and National Significance (SPRANS Grants), and Community Integrated Service Systems monies.
2 These are Constant Dollars for the Title V Health Program totals or the MCH Block Grant totals based on adjustments using the Consumer Price Index(CPI) which defined the average of 1982-1984 as the base year of 100%. 2000-2001 CPI data are not available.
3 Prior to 1952, State Program totals include all of Fund A and most of Fund B, including “Reserved” Funds. For later years, various reserved funds are notincluded in the totals since data were not available for States.
4 Includes projects later known as the “Program of Projects” (M&I, C&Y, Family Planning, Dental, Intensive Infant Care); excludes Family Planning moniesallocated to States in 1970-1972 because these were allocated by the National Center for Family Planning Services. These amounts are not includedin the annual totals.
5 Monies required from FY1975-FY1981 to maintain the FY1973 level of Title V funding defined as the “Hold Harmless” funding base. FY1974 monies inthis category were to enable States to plan for the Program of Projects, including management of existing Special Projects.
6 The total amount shown in FY1973 is not necessarily the base for FY1975 funding levels since some Special Projects were funded for 18 months andother adjustments were necessary.
7 Special Projects monies in 1975 are a portion of $10,472,000 impounded by President Nixon in 1973 and released by court order in 1975.
8 These monies are those used to fund the “transition” quarter in 1976 (July-September) when the Federal Fiscal Year changed from July-June to October-September.
9 Beginning in 1982, a single block allocation was made to each State as the MCH Block Grant.
10 This line is the State’s allocation of the $ 105 million appropriated for care of mothers and children under the 1983 Jobs Bill. It is perceived as 1983supplemental funding but was mostly used in 1984.
11 Represents the amount included in the FY2000 Appropriations as of February 2000.
12 The President’s Budget request for FY2001. Does not include Healthy Start, which is proposed for inclusion in the Title V in FY2001 ($90 million).
13 The Personal Responsibility, and Work Opportunity Reconciliation Act of 1996 created a new section, Section 510 to Title V of the SSA for providingformula grant funds to the States for Abstinence Education. This Act provided a separate appropriation of $50 million for each of the fiscal years1998-2002. This is a permanent appropriation and is counted as mandatory funding under The Budget Enforcement Act.
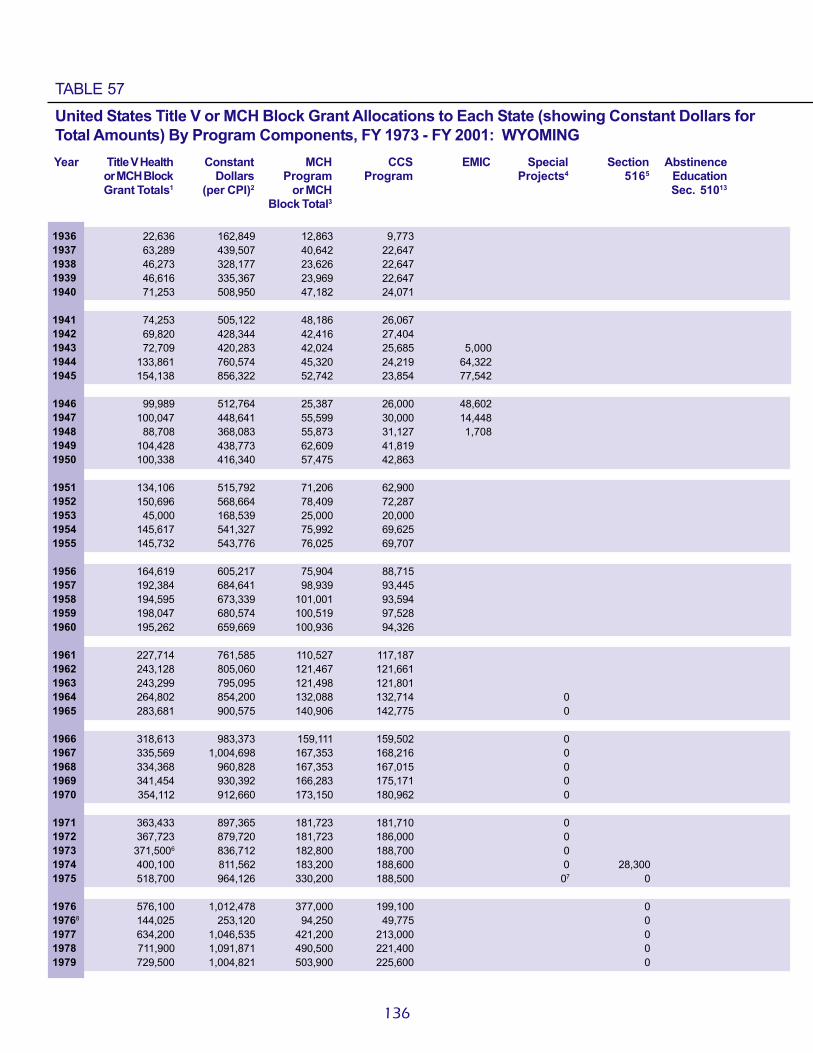
19361937193819391940
19411942194319441945
19461947194819491950
19511952195319541955
19561957195819591960
19611962196319641965
19661967196819691970
19711972197319741975
197619768
197719781979
Year Title V Health Constant MCH CCS EMIC Special Section Abstinenceor MCH Block Dollars Program Program Projects4 5165 EducationGrant Totals1 (per CPI)2 or MCH Sec. 51013
Block Total3
136
TABLE 57United States Title V or MCH Block Grant Allocations to Each State (showing Constant Dollars forTotal Amounts) By Program Components, FY 1973 - FY 2001: WYOMING
22,636 162,849 12,863 9,77363,289 439,507 40,642 22,64746,273 328,177 23,626 22,64746,616 335,367 23,969 22,64771,253 508,950 47,182 24,071
74,253 505,122 48,186 26,06769,820 428,344 42,416 27,40472,709 420,283 42,024 25,685 5,000
133,861 760,574 45,320 24,219 64,322154,138 856,322 52,742 23,854 77,542
99,989 512,764 25,387 26,000 48,602100,047 448,641 55,599 30,000 14,448
88,708 368,083 55,873 31,127 1,708104,428 438,773 62,609 41,819100,338 416,340 57,475 42,863
134,106 515,792 71,206 62,900150,696 568,664 78,409 72,287
45,000 168,539 25,000 20,000145,617 541,327 75,992 69,625145,732 543,776 76,025 69,707
164,619 605,217 75,904 88,715192,384 684,641 98,939 93,445194,595 673,339 101,001 93,594198,047 680,574 100,519 97,528195,262 659,669 100,936 94,326
227,714 761,585 110,527 117,187243,128 805,060 121,467 121,661243,299 795,095 121,498 121,801264,802 854,200 132,088 132,714 0283,681 900,575 140,906 142,775 0
318,613 983,373 159,111 159,502 0335,569 1,004,698 167,353 168,216 0334,368 960,828 167,353 167,015 0341,454 930,392 166,283 175,171 0354,112 912,660 173,150 180,962 0
363,433 897,365 181,723 181,710 0367,723 879,720 181,723 186,000 0
371,5006 836,712 182,800 188,700 0400,100 811,562 183,200 188,600 0 28,300518,700 964,126 330,200 188,500 07 0
576,100 1,012,478 377,000 199,100 0144,025 253,120 94,250 49,775 0634,200 1,046,535 421,200 213,000 0711,900 1,091,871 490,500 221,400 0729,500 1,004,821 503,900 225,600 0

1980198119821983198310
19841985
19861987198819891990
19911992199319941995
1996199719981999
200011
200112
Year Title V Health Constant MCH CCS EMIC Special Section Abstinenceor MCH Block Dollars Program Program Projects4 5165 EducationGrant Totals1 (per CPI)2 or MCH Sec. 51013
Block Total3
137
774,000 939,320 539,200 234,800 0843,400 927,833 598,900 244,500 0793,662 822,448 793,6629
795,796 798,992 795,796263,550 264,608 263,550851,267 819,314 851,267
1,019,813 947,782 1,019,813
975,961 890,475 975,9611,057,016 930,472 1,057,0161,082,909 915,392 1,082,9091,105,178 891,273 1,105,1781,110,784 849,873 1,110,784
1,141,114 837,822 1,141,1141,191,862 849,510 1,191,8621,278,723 884,929 1,278,7231,305,535 880,928 1,305,5351,301,843 854,228 1,301,843
1,292,863 824,004 1,292,8631,287,193 801,989 1,287,1931,285,738 788,796 1,285,738 80,9351,305,602 783,675 1,305,867 80,935
1,316,012 1,305,867 80,9351,316,012 80,935
1 Total of amounts shown on the table for each year; does not include Special Projects (Program of Projects), Research, Training, or Special Projects ofRegional and National Significance (SPRANS Grants), and Community Integrated Service Systems monies.
2 These are Constant Dollars for the Title V Health Program totals or the MCH Block Grant totals based on adjustments using the Consumer Price Index(CPI) which defined the average of 1982-1984 as the base year of 100%. 2000-2001 CPI data are not available.
3 Prior to 1952, State Program totals include all of Fund A and most of Fund B, including “Reserved” Funds. For later years, various reserved funds are notincluded in the totals since data were not available for States.
4 Includes projects later known as the “Program of Projects” (M&I, C&Y, Family Planning, Dental, Intensive Infant Care); excludes Family Planning moniesallocated to States in 1970-1972 because these were allocated by the National Center for Family Planning Services. These amounts are not includedin the annual totals.
5 Monies required from FY1975-FY1981 to maintain the FY1973 level of Title V funding defined as the “Hold Harmless” funding base. FY1974 monies inthis category were to enable States to plan for the Program of Projects, including management of existing Special Projects.
6 The total amount shown in FY1973 is not necessarily the base for FY1975 funding levels since some Special Projects were funded for 18 months andother adjustments were necessary.
7 Special Projects monies in 1975 are a portion of $10,472,000 impounded by President Nixon in 1973 and released by court order in 1975.
8 These monies are those used to fund the “transition” quarter in 1976 (July-September) when the Federal Fiscal Year changed from July-June to October-September.
9 Beginning in 1982, a single block allocation was made to each State as the MCH Block Grant.
10 This line is the State’s allocation of the $ 105 million appropriated for care of mothers and children under the 1983 Jobs Bill. It is perceived as 1983supplemental funding but was mostly used in 1984.
11 Represents the amount included in the FY2000 Appropriations as of February 2000.
12 The President’s Budget request for FY2001. Does not include Healthy Start, which is proposed for inclusion in the Title V in FY2001 ($90 million).
13 The Personal Responsibility, and Work Opportunity Reconciliation Act of 1996 created a new section, Section 510 to Title V of the SSA for providingformula grant funds to the States for Abstinence Education. This Act provided a separate appropriation of $50 million for each of the fiscal years1998-2002. This is a permanent appropriation and is counted as mandatory funding under The Budget Enforcement Act.

138
197319741975
197619768
197719781979
1980198119821983198310
19841985
19861987198819891990
19911992199319941995
1996199719981999200011
200112
TABLE 58United States Title V or MCH Block Grant Allocations to Each State (showing Constant Dollars
for Total Amounts) By Program Components, FY 1936 - FY 2001: AMERICAN SAMOA
208,8006 470,270 105,200 103,600 0314,100 637,120 147,200 146,100 0 20,800309,100 574,535 162,900 146,200 07 0
314,000 551,845 166,400 147,600 078,500 137,961 41,600 36,900 0
322,200 531,683 172,800 149,400 0327,300 501,994 177,100 150,200 0330,000 454,545 179,300 150,700 0
322,900 391,869 172,600 150,300 0325,900 358,526 174,900 151,000 0284,580 294,902 284,5809
285,345 286,491 285,34594,500 94,880 94,500
305,235 293,778 305,235365,670 339,842 365,670
349,946 319,294 349,946379,010 333,636 379,010399,854 338,000 399,854418,764 337,713 418,764423,525 324,044 423,525
449,286 329,872 449,286492,373 350,943 492,373502,145 347,505 502,145517,092 348,915 517,092515,033 337,948 515,033
510,027 325,065 510,027508,131 316,593 508,131507,534 311,371 507,534518,604 311,287 518,752 0524,408 518,752 0524,408 44,992
Year Title V Health Constant MCH CCS EMIC Special Section Abstinenceor MCH Block Dollars Program Program Projects4 5165 EducationGrant Totals1 (per CPI)2 or MCH Sec. 51013
Block Total3

139
1 Total of amounts shown on the table for each year; does not include Special Projects (Program of Projects), Research, Training, orSpecial Projects of Regional and National Significance (SPRANS Grants), and Community Integrated Service Systems monies.
2 These are Constant Dollars for the Title V Health Program totals or the MCH Block Grant totals based on adjustments using theConsumer Price Index (CPI) which defined the average of 1982-1984 as the base year of 100%. 2000-2001 CPI data are notavailable.
3 Prior to 1952, State Program totals include all of Fund A and most of Fund B, including “Reserved” Funds. For later years, variousreserved funds are not included in the totals since data were not available for States.
4 Includes projects later known as the “Program of Projects” (M&I, C&Y, Family Planning, Dental, Intensive Infant Care); excludesFamily Planning monies allocated to States in 1970-1972 because these were allocated by the National Center for FamilyPlanning Services. These amounts are not included in the annual totals.
5 Monies required from FY1975-FY1981 to maintain the FY1973 level of Title V funding defined as the “Hold Harmless” fundingbase. FY1974 monies in this category were to enable States to plan for the Program of Projects, including management ofexisting Special Projects.
6 The total amount shown in FY1973 is not necessarily the base for FY1975 funding levels since some Special Projects were fundedfor 18 months and other adjustments were necessary.
7 Special Projects monies in 1975 are a portion of $10,472,000 impounded by President Nixon in 1973 and released by court orderin 1975.
8 These monies are those used to fund the “transition” quarter in 1976 (July-September) when the Federal Fiscal Year changed fromJuly-June to October-September.
9 Beginning in 1982, a single block allocation was made to each State as the MCH Block Grant.
10 This line is the State’s allocation of the $ 105 million appropriated for care of mothers and children under the 1983 Jobs Bill. It isperceived as 1983 supplemental funding but was mostly used in 1984.
11 Represents the amount included in the FY2000 Appropriations as of February 2000.
12 The President’s Budget request for FY2001. Does not include Healthy Start, which is proposed for inclusion in the Title V inFY2001 ($90 million).
13 The Personal Responsibility, and Work Opportunity Reconciliation Act of 1996 created a new section, Section 510 to Title V of theSSA for providing formula grant funds to the States for Abstinence Education. This Act provided a separate appropriation of $50million for each of the fiscal years 1998-2002. This is a permanent appropriation and is counted as mandatory funding underThe Budget Enforcement Act.
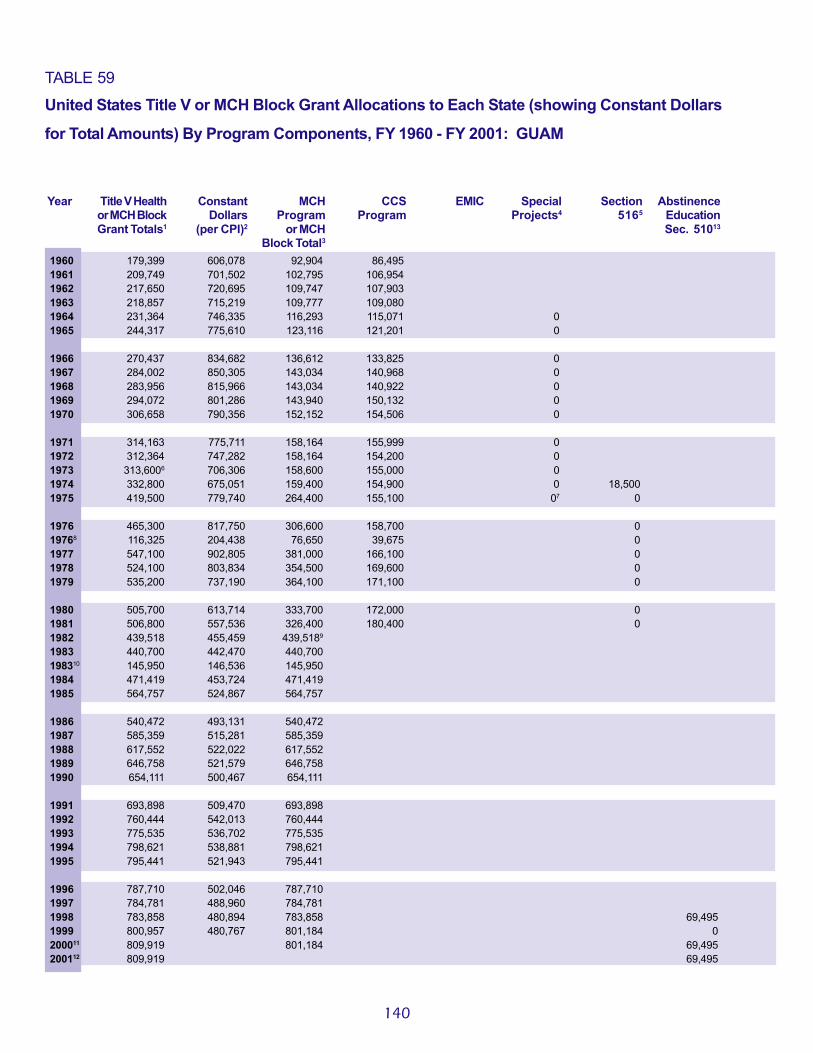
140
196019611962196319641965
19661967196819691970
19711972197319741975
197619768
197719781979
1980198119821983198310
19841985
19861987198819891990
19911992199319941995
1996199719981999200011
200112
TABLE 59United States Title V or MCH Block Grant Allocations to Each State (showing Constant Dollars
for Total Amounts) By Program Components, FY 1960 - FY 2001: GUAM
179,399 606,078 92,904 86,495209,749 701,502 102,795 106,954217,650 720,695 109,747 107,903218,857 715,219 109,777 109,080231,364 746,335 116,293 115,071 0244,317 775,610 123,116 121,201 0
270,437 834,682 136,612 133,825 0284,002 850,305 143,034 140,968 0283,956 815,966 143,034 140,922 0294,072 801,286 143,940 150,132 0306,658 790,356 152,152 154,506 0
314,163 775,711 158,164 155,999 0312,364 747,282 158,164 154,200 0
313,6006 706,306 158,600 155,000 0332,800 675,051 159,400 154,900 0 18,500419,500 779,740 264,400 155,100 07 0
465,300 817,750 306,600 158,700 0116,325 204,438 76,650 39,675 0547,100 902,805 381,000 166,100 0524,100 803,834 354,500 169,600 0535,200 737,190 364,100 171,100 0
505,700 613,714 333,700 172,000 0506,800 557,536 326,400 180,400 0439,518 455,459 439,5189
440,700 442,470 440,700145,950 146,536 145,950471,419 453,724 471,419564,757 524,867 564,757
540,472 493,131 540,472585,359 515,281 585,359617,552 522,022 617,552646,758 521,579 646,758654,111 500,467 654,111
693,898 509,470 693,898760,444 542,013 760,444775,535 536,702 775,535798,621 538,881 798,621795,441 521,943 795,441
787,710 502,046 787,710784,781 488,960 784,781783,858 480,894 783,858 69,495800,957 480,767 801,184 0809,919 801,184 69,495809,919 69,495
Year Title V Health Constant MCH CCS EMIC Special Section Abstinenceor MCH Block Dollars Program Program Projects4 5165 EducationGrant Totals1 (per CPI)2 or MCH Sec. 51013
Block Total3
141
1 Total of amounts shown on the table for each year; does not include Special Projects (Program of Projects), Research, Training, orSpecial Projects of Regional and National Significance (SPRANS Grants), and Community Integrated Service Systems monies.
2 These are Constant Dollars for the Title V Health Program totals or the MCH Block Grant totals based on adjustments using theConsumer Price Index (CPI) which defined the average of 1982-1984 as the base year of 100%. 2000-2001 CPI data are notavailable.
3 Prior to 1952, State Program totals include all of Fund A and most of Fund B, including “Reserved” Funds. For later years, variousreserved funds are not included in the totals since data were not available for States.
4 Includes projects later known as the “Program of Projects” (M&I, C&Y, Family Planning, Dental, Intensive Infant Care); excludesFamily Planning monies allocated to States in 1970-1972 because these were allocated by the National Center for FamilyPlanning Services. These amounts are not included in the annual totals.
5 Monies required from FY1975-FY1981 to maintain the FY1973 level of Title V funding defined as the “Hold Harmless” fundingbase. FY1974 monies in this category were to enable States to plan for the Program of Projects, including management ofexisting Special Projects.
6 The total amount shown in FY1973 is not necessarily the base for FY1975 funding levels since some Special Projects were fundedfor 18 months and other adjustments were necessary.
7 Special Projects monies in 1975 are a portion of $10,472,000 impounded by President Nixon in 1973 and released by court orderin 1975.
8 These monies are those used to fund the “transition” quarter in 1976 (July-September) when the Federal Fiscal Year changed fromJuly-June to October-September.
9 Beginning in 1982, a single block allocation was made to each State as the MCH Block Grant.
10 This line is the State’s allocation of the $ 105 million appropriated for care of mothers and children under the 1983 Jobs Bill. It isperceived as 1983 supplemental funding but was mostly used in 1984.
11 Represents the amount included in the FY2000 Appropriations as of February 2000.
12 The President’s Budget request for FY2001. Does not include Healthy Start, which is proposed for inclusion in the Title V inFY2001 ($90 million).
13 The Personal Responsibility, and Work Opportunity Reconciliation Act of 1996 created a new section, Section 510 to Title V of theSSA for providing formula grant funds to the States for Abstinence Education. This Act provided a separate appropriation of $50million for each of the fiscal years 1998-2002. This is a permanent appropriation and is counted as mandatory funding underThe Budget Enforcement Act.
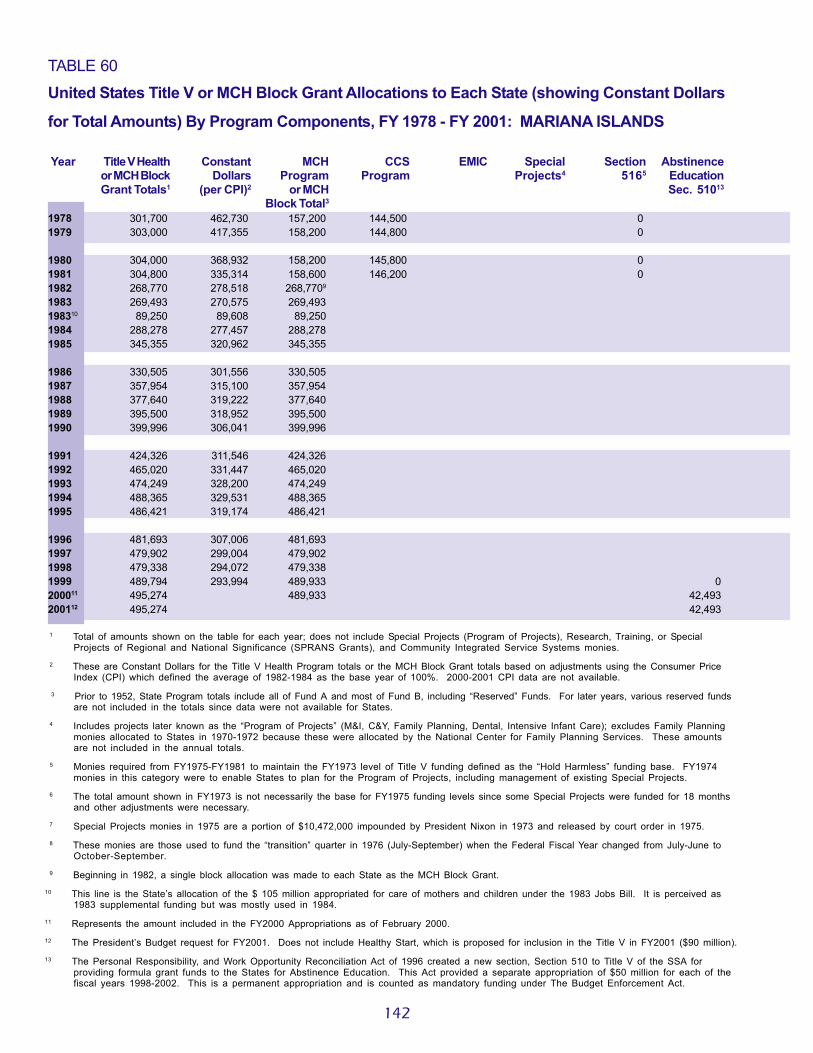
142
19781979
1980198119821983198310
19841985
19861987198819891990
19911992199319941995
1996199719981999200011
200112
TABLE 60United States Title V or MCH Block Grant Allocations to Each State (showing Constant Dollars
for Total Amounts) By Program Components, FY 1978 - FY 2001: MARIANA ISLANDS
301,700 462,730 157,200 144,500 0303,000 417,355 158,200 144,800 0
304,000 368,932 158,200 145,800 0304,800 335,314 158,600 146,200 0268,770 278,518 268,7709
269,493 270,575 269,49389,250 89,608 89,250
288,278 277,457 288,278345,355 320,962 345,355
330,505 301,556 330,505357,954 315,100 357,954377,640 319,222 377,640395,500 318,952 395,500399,996 306,041 399,996
424,326 311,546 424,326465,020 331,447 465,020474,249 328,200 474,249488,365 329,531 488,365486,421 319,174 486,421
481,693 307,006 481,693479,902 299,004 479,902479,338 294,072 479,338489,794 293,994 489,933 0495,274 489,933 42,493495,274 42,493
1 Total of amounts shown on the table for each year; does not include Special Projects (Program of Projects), Research, Training, or SpecialProjects of Regional and National Significance (SPRANS Grants), and Community Integrated Service Systems monies.
2 These are Constant Dollars for the Title V Health Program totals or the MCH Block Grant totals based on adjustments using the Consumer PriceIndex (CPI) which defined the average of 1982-1984 as the base year of 100%. 2000-2001 CPI data are not available.
3 Prior to 1952, State Program totals include all of Fund A and most of Fund B, including “Reserved” Funds. For later years, various reserved fundsare not included in the totals since data were not available for States.
4 Includes projects later known as the “Program of Projects” (M&I, C&Y, Family Planning, Dental, Intensive Infant Care); excludes Family Planningmonies allocated to States in 1970-1972 because these were allocated by the National Center for Family Planning Services. These amountsare not included in the annual totals.
5 Monies required from FY1975-FY1981 to maintain the FY1973 level of Title V funding defined as the “Hold Harmless” funding base. FY1974monies in this category were to enable States to plan for the Program of Projects, including management of existing Special Projects.
6 The total amount shown in FY1973 is not necessarily the base for FY1975 funding levels since some Special Projects were funded for 18 monthsand other adjustments were necessary.
7 Special Projects monies in 1975 are a portion of $10,472,000 impounded by President Nixon in 1973 and released by court order in 1975. 8 These monies are those used to fund the “transition” quarter in 1976 (July-September) when the Federal Fiscal Year changed from July-June to
October-September. 9 Beginning in 1982, a single block allocation was made to each State as the MCH Block Grant.10 This line is the State’s allocation of the $ 105 million appropriated for care of mothers and children under the 1983 Jobs Bill. It is perceived as
1983 supplemental funding but was mostly used in 1984.11 Represents the amount included in the FY2000 Appropriations as of February 2000.12 The President’s Budget request for FY2001. Does not include Healthy Start, which is proposed for inclusion in the Title V in FY2001 ($90 million).13 The Personal Responsibility, and Work Opportunity Reconciliation Act of 1996 created a new section, Section 510 to Title V of the SSA for
providing formula grant funds to the States for Abstinence Education. This Act provided a separate appropriation of $50 million for each of thefiscal years 1998-2002. This is a permanent appropriation and is counted as mandatory funding under The Budget Enforcement Act.
Year Title V Health Constant MCH CCS EMIC Special Section Abstinenceor MCH Block Dollars Program Program Projects4 5165 EducationGrant Totals1 (per CPI)2 or MCH Sec. 51013
Block Total3

143

144
197319741975
197619768
197719781979
1980198119821983198310
19841985
19861987198819891990
19911992199319941995
1996199719981999200011
200112
TABLE 61United States Title V or MCH Block Grant Allocations to Each State (showing Constant Dollars
for Total Amounts) By Program Components, FY 1973 - FY 2001: TRUST TERRITORIES
282,8006 636,937 123,000 159,800 0369,400 749,290 164,800 159,800 0 44,800496,900 923,606 336,900 160,000 07 0
613,000 1,077,329 448,400 164,600 0153,250 269,332 112,100 41,150 0748,700 1,235,479 575,300 173,400 0721,400 1,106,442 546,300 175,100 0738,100 1,016,667 561,200 176,900 0
698,800 848,058 500,500 198,300 0597,900 657,756 385,100 212,800 0518,568 537,376 518,5689
519,962 522,050 519,962172,200 172,892 172,200556,206 535,328 556,206666,332 619,268 666,332
637,680 581,825 637,680690,640 607,958 690,640728,622 615,910 728,622763,081 615,388 763,081771,756 590,479 771,756
818,698 601,100 818,698897,214 639,497 897,214915,019 633,231 915,019942,256 635,800 942,256938,506 615,818 938,506
929,383 592,341 929,383925,928 576,902 925,928924,840 567,387 924,840945,013 567,235 945,280 0955,587 945,280 0955,587 81,993
Year Title V Health Constant MCH CCS EMIC Special Section Abstinenceor MCH Block Dollars Program Program Projects4 5165 EducationGrant Totals1 (per CPI)2 or MCH Sec. 51013
Block Total3

145
1 Total of amounts shown on the table for each year; does not include Special Projects (Program of Projects), Research, Training, orSpecial Projects of Regional and National Significance (SPRANS Grants), and Community Integrated Service Systems monies.
2 These are Constant Dollars for the Title V Health Program totals or the MCH Block Grant totals based on adjustments using theConsumer Price Index (CPI) which defined the average of 1982-1984 as the base year of 100%. 2000-2001 CPI data are notavailable.
3 Prior to 1952, State Program totals include all of Fund A and most of Fund B, including “Reserved” Funds. For later years, variousreserved funds are not included in the totals since data were not available for States.
4 Includes projects later known as the “Program of Projects” (M&I, C&Y, Family Planning, Dental, Intensive Infant Care); excludesFamily Planning monies allocated to States in 1970-1972 because these were allocated by the National Center for FamilyPlanning Services. These amounts are not included in the annual totals.
5 Monies required from FY1975-FY1981 to maintain the FY1973 level of Title V funding defined as the “Hold Harmless” fundingbase. FY1974 monies in this category were to enable States to plan for the Program of Projects, including management ofexisting Special Projects.
6 The total amount shown in FY1973 is not necessarily the base for FY1975 funding levels since some Special Projects were fundedfor 18 months and other adjustments were necessary.
7 Special Projects monies in 1975 are a portion of $10,472,000 impounded by President Nixon in 1973 and released by court orderin 1975.
8 These monies are those used to fund the “transition” quarter in 1976 (July-September) when the Federal Fiscal Year changed fromJuly-June to October-September.
9 Beginning in 1982, a single block allocation was made to each State as the MCH Block Grant.
10 This line is the State’s allocation of the $ 105 million appropriated for care of mothers and children under the 1983 Jobs Bill. It isperceived as 1983 supplemental funding but was mostly used in 1984.
11 Represents the amount included in the FY2000 Appropriations as of February 2000.
12 The President’s Budget request for FY2001. Does not include Healthy Start, which is proposed for inclusion in the Title V inFY2001 ($90 million).
13 The Personal Responsibility, and Work Opportunity Reconciliation Act of 1996 created a new section, Section 510 to Title V of theSSA for providing formula grant funds to the States for Abstinence Education. This Act provided a separate appropriation of $50million for each of the fiscal years 1998-2002. This is a permanent appropriation and is counted as mandatory funding underThe Budget Enforcement Act.

Maternal and Child Health BureauMaternal and Child Health BureauMaternal and Child Health BureauMaternal and Child Health BureauMaternal and Child Health Bureau5600 Fishers Lane5600 Fishers Lane5600 Fishers Lane5600 Fishers Lane5600 Fishers LaneParklawn BuildingParklawn BuildingParklawn BuildingParklawn BuildingParklawn BuildingRockville, MD 20857Rockville, MD 20857Rockville, MD 20857Rockville, MD 20857Rockville, MD 20857tel. 301.443.0205tel. 301.443.0205tel. 301.443.0205tel. 301.443.0205tel. 301.443.0205fax. 301.443.1797fax. 301.443.1797fax. 301.443.1797fax. 301.443.1797fax. 301.443.1797
1935-2000A Review of FederalAppropriations andAllocations to Statesfor Maternal and ChildHealth Programs UnderTitle V of the SocialSecurity Act of 1935(FY1936-FY1981)and the OmnibusReconciliation Act of1981 (Maternal andChild Health BlockGrant, FY1982-FY1999)
65
Published February 2001Published February 2001Published February 2001Published February 2001Published February 2001
Celebrating65 Years of Title V
The Maternal and ChildHealth Program