The mass of the white dwarf in the old nova BT Mon
18
The mass of the white dwarf in the old nova BT Mon D. A. Smith, 1;2 * V. S. Dhillon 3 * and T. R. Marsh 4 * 1 Institute of Astronomy, Madingley Road, Cambridge CB3 0HA 2 Royal Greenwich Observatory, Madingley Road, Cambridge CB3 0EZ 3 Department of Physics and Astronomy, University of Sheffield, Sheffield S3 7RH 4 University of Southampton, Department of Physics and Astronomy, Highfield, Southampton SO17 1BJ Accepted 1997 September 26. Received 1997 September 18; in original form 1997 August 15 ABSTRACT We present spectrophotometry of the eclipsing old nova BT Mon (Nova Mon 1939). By detecting weak absorption features from the secondary star, we find its radial velocity semi-amplitude to be K R ¼ 205 6 5 km s ¹1 and its rotational velocity to be v sin i ¼ 138 6 5 km s ¹1 . We also measure the radial velocity semi-amplitude of the primary star to be K R ¼ 170 6 10 km s ¹1 . From these parameters we obtain a mass of 1:04 6 0:06 M ( for the white dwarf primary star and a mass of 0:87 6 0:06 M ( for the G8 V secondary star. The inclination of the system is found to be 828 : 2 6 38 : 2 and we estimate that the system lies at a distance of 1700 6 300 pc. The high mass of the white dwarf and our finding that BT Mon was probably a fast nova together constitute a new piece of evidence in favour of the thermonuclear runaway model of classical nova outbursts. The emission lines are single- peaked throughout the orbital cycle, showing absorption around phase 0.5, high-velocity S-wave components and large phase offsets in their radial velocity curves. In each of these respects, BT Mon is similar to the SW Sex stars. We also find quasi-periodic flaring in the trailed spectra, which makes BT Mon a candidate intermediate polar. Key words: accretion, accretion discs – binaries: eclipsing – binaries: spectroscopic – stars: individual: BT Mon – novae, cataclysmic variables. 1 INTRODUCTION Old novae are cataclysmic binaries in which a white dwarf primary star accretes material from a red dwarf secondary star via an accretion disc or magnetic accretion stream. By definition, an old nova is an object that has been observed to have undergone a single nova outburst and then faded back to its pre-eruptive luminosity (see Warner 1995a for a review). The thermonuclear runaway model (TNR) is the widely accepted theory of nova outbursts (see Starrfield 1989). In this model, the primary star builds up a layer of material, accreted from the secondary star, on its surface. The temperature and pressure at the base of the layer eventually become sufficiently high for nuclear reactions to begin. After ignition, the temperature rises rapidly and the reaction rates run away, to be stopped only when the radiation pressure becomes such that most of the envelope is blown away. The model predicts that the fastest and most violent TNRs occur as a result of the high compression in the gravitational wells of the most massive white dwarfs, while slower TNRs occur on lower mass white dwarfs. As one of the primary parameters in the TNR model is the mass of the white dwarf, we are motivated to try to measure the masses of novae as a test. The difficulties of measuring the masses of the components of cataclysmic variables are well known: they can only be measured in eclipsing systems, and to date only one old nova, DQ Her, has had its mass tightly constrained (Horne, Welsh & Wade 1993: M 1 ¼ 0:60 6 0:07 M ( ). This was possible because the M3 V sec- ondary star in DQ Her is easily observed through the Na I doublet around l8190 A ˚ . DQ Her was a moderately slow nova taking 67 d to fall 2 mag from its peak luminosity, so its relatively low mass ties in reasonably well with the speed of the nova, according to the TNR model. Nova BT Mon 1939 is another bright (V ¼ 15:8), eclipsing old nova and hence another obvious candidate for mass determination. It has a longer period than DQ Her so the secondary star is of an earlier spectral type, and because the accretion structures are bright, the secondary star is faint compared with the system as a whole, so we are forced to adopt different observation and analysis strategies from those of Horne et al. (1993), as described below. 2 OBSERVATIONS On the night of 1995 January 23–24 we obtained 47 red and 49 blue spectra of the old nova BT Mon, covering ,1:0 orbits from cycle 18 718.87 to 18 719.86 (according to our ephemeris, see Section 4.1) with the 4.2-m William Herschel Telescope (WHT) on Mon. Not. R. Astron. Soc. 296, 465–482 (1998) q 1998 RAS * E-mail: [email protected] (DAS); [email protected] (VSD); [email protected] (TRM) Downloaded from https://academic.oup.com/mnras/article-abstract/296/3/465/1032168/The-mass-of-the-white-dwarf-in-the-old-nova-BT-Mon by University of Sheffield user on 06 October 2017
Transcript of The mass of the white dwarf in the old nova BT Mon
The mass of the white dwarf in the old nova BT Mon
D. A. Smith,1;2* V. S. Dhillon3* and T. R. Marsh4*1Institute of Astronomy, Madingley Road, Cambridge CB3 0HA2Royal Greenwich Observatory, Madingley Road, Cambridge CB3 0EZ3Department of Physics and Astronomy, University of Sheffield, Sheffield S3 7RH4University of Southampton, Department of Physics and Astronomy, Highfield, Southampton SO17 1BJ
Accepted 1997 September 26. Received 1997 September 18; in original form 1997 August 15
A B S T R A C TWe present spectrophotometry of the eclipsing old nova BT Mon (Nova Mon 1939).By detecting weak absorption features from the secondary star, we find its radialvelocity semi-amplitude to be KR ¼ 205 6 5 km s¹1 and its rotational velocity to bev sin i ¼ 138 6 5 km s¹1. We also measure the radial velocity semi-amplitude of the primarystar to be KR ¼ 170 6 10 km s¹1. From these parameters we obtain a mass of 1:04 6 0:06 M(
for the white dwarf primary star and a mass of 0:87 6 0:06 M( for the G8 V secondary star.The inclination of the system is found to be 828: 2 6 38: 2 and we estimate that the system lies ata distance of 1700 6 300 pc. The high mass of the white dwarf and our finding that BT Monwas probably a fast nova together constitute a new piece of evidence in favour of thethermonuclear runaway model of classical nova outbursts. The emission lines are single-peaked throughout the orbital cycle, showing absorption around phase 0.5, high-velocityS-wave components and large phase offsets in their radial velocity curves. In each of theserespects, BT Mon is similar to the SW Sex stars. We also find quasi-periodic flaring in thetrailed spectra, which makes BT Mon a candidate intermediate polar.
Key words: accretion, accretion discs – binaries: eclipsing – binaries: spectroscopic – stars:individual: BT Mon – novae, cataclysmic variables.
1 I N T RO D U C T I O N
Old novae are cataclysmic binaries in which a white dwarf primarystar accretes material from a red dwarf secondary star via anaccretion disc or magnetic accretion stream. By definition, an oldnova is an object that has been observed to have undergone a singlenova outburst and then faded back to its pre-eruptive luminosity(see Warner 1995a for a review).
The thermonuclear runaway model (TNR) is the widely acceptedtheory of nova outbursts (see Starrfield 1989). In this model, theprimary star builds up a layer of material, accreted from thesecondary star, on its surface. The temperature and pressure at thebase of the layer eventually become sufficiently high for nuclearreactions to begin. After ignition, the temperature rises rapidly andthe reaction rates run away, to be stopped only when the radiationpressure becomes such that most of the envelope is blown away. Themodel predicts that the fastest and most violent TNRs occur as aresult of the high compression in the gravitational wells of the mostmassive white dwarfs, while slower TNRs occur on lower masswhite dwarfs. As one of the primary parameters in the TNR model isthe mass of the white dwarf, we are motivated to try to measure themasses of novae as a test.
The difficulties of measuring the masses of the components ofcataclysmic variables are well known: they can only be measured ineclipsing systems, and to date only one old nova, DQ Her, has hadits mass tightly constrained (Horne, Welsh & Wade 1993:M1 ¼ 0:60 6 0:07 M(). This was possible because the M3 V sec-ondary star in DQ Her is easily observed through the Na I doubletaround l8190 A. DQ Her was a moderately slow nova taking 67 d tofall 2 mag from its peak luminosity, so its relatively low mass ties inreasonably well with the speed of the nova, according to the TNRmodel.
Nova BT Mon 1939 is another bright (V ¼ 15:8), eclipsing oldnova and hence another obvious candidate for mass determination.It has a longer period than DQ Her so the secondary star is of anearlier spectral type, and because the accretion structures are bright,the secondary star is faint compared with the system as a whole, sowe are forced to adopt different observation and analysis strategiesfrom those of Horne et al. (1993), as described below.
2 O B S E RVAT I O N S
On the night of 1995 January 23–24 we obtained 47 red and 49 bluespectra of the old nova BT Mon, covering ,1:0 orbits from cycle18 718.87 to 18 719.86 (according to our ephemeris, see Section4.1) with the 4.2-m William Herschel Telescope (WHT) on
Mon. Not. R. Astron. Soc. 296, 465–482 (1998)
q 1998 RAS
*E-mail: [email protected] (DAS); [email protected] (VSD);[email protected] (TRM)
Downloaded from https://academic.oup.com/mnras/article-abstract/296/3/465/1032168/The-mass-of-the-white-dwarf-in-the-old-nova-BT-Monby University of Sheffield useron 06 October 2017
La Palma. The exposures were all around 600 s with about 15-sdead-time for the dumping of data. The ISIS spectrometer with theR1200R and R600B gratings and the TEK CCD chips gave awavelength coverage of approximately 4570–5370 A at 0:8-A(50 km s¹1) resolution in the blue arm, and 6310–6720 A at 0:4-A(18 km s¹1) resolution in the red arm. We also took spectra of thespectral type templates 61 UMa (G8 V), Gleise 567 (K0.5 V),Gleise 28 (K2 V), Gleise 105 (K3 V), Gleise 69 (K5 V), EQ Vir(K5 V) and Gleise 380 (K6 V). The 1-arcsec slit was oriented tocover a nearby field star in order to correct for slit losses. Com-parison arc spectra were taken every 30–40 min to calibrate flexure.The night was photometric and the seeing ranged from 1.5 to 3arcsec.
3 DATA R E D U C T I O N
We first corrected for pixel-to-pixel variations with a tungsten lampflat-field. After sky subtraction, the data were optimally extracted togive raw spectra of BT Mon and the comparison star. Arc spectrawere then extracted from the same locations on the detector as thetargets. The wavelength scale for each spectrum was interpolatedfrom the wavelength scales of two neighbouring arc spectra.The spectra of the nearby star were used to correct for slit lossesand the observations were placed on an absolute flux scale byusing observations of the standard star Feige 34 (Oke 1990) takenimmediately after the run.
4 R E S U LT S
4.1 Ephemeris
The time of mid-eclipse for our observation was determined byplotting the blue continuum light curve (see Fig. 2, below) about theeclipse (following Robinson, Nather & Kepler 1982, hereafterRNK, whose measurements were approximately in the blue), andthen fitting the midpoints of chords. A linear least-squares fit to theeight eclipse timings of RNK, the timing of Seitter (1984), and oureclipse timing (all of which are presented in Table 1) yield thefollowing ephemeris:
Tmid-eclipse ¼ HJD 244 3491:7159 þ 0:333 813 79 E
6 0:0001 6 0:000 000 01:ð1Þ
We find no evidence of a non-zero value for P, in agreement withSeitter (1984).
4.2 Average spectrum
The average spectrum of BT Mon is displayed in Fig. 1, and inTable 2 we list fluxes, equivalent widths and velocity widths of themost prominent lines measured from the average spectrum.
BT Mon shows broad Balmer and He I lines and high-excitationlines of He II l4686 A and C III/N III ll4640–4650 A. The spectrumhas similarities with those of other high-inclination nova-likes, e.g.SW Sex (Thorstensen et al.1991), and intermediate polars, e.g.FO Aqr (Marsh & Duck 1996), in that the emission lines do notshow the double peaks characteristic of high-inclination accretiondiscs (Horne & Marsh 1986). The weak, narrow absorption featuresaround l6380 and l6620 A show no radial velocity variations andcan be attributed to the interstellar medium (as BT Mon lies at agalactic latitude of ¹38 and at a distance of ,2 kpc). There isevidence for faint absorption features from the secondary star atl5170 and l6500 A.
4.3 Light curves
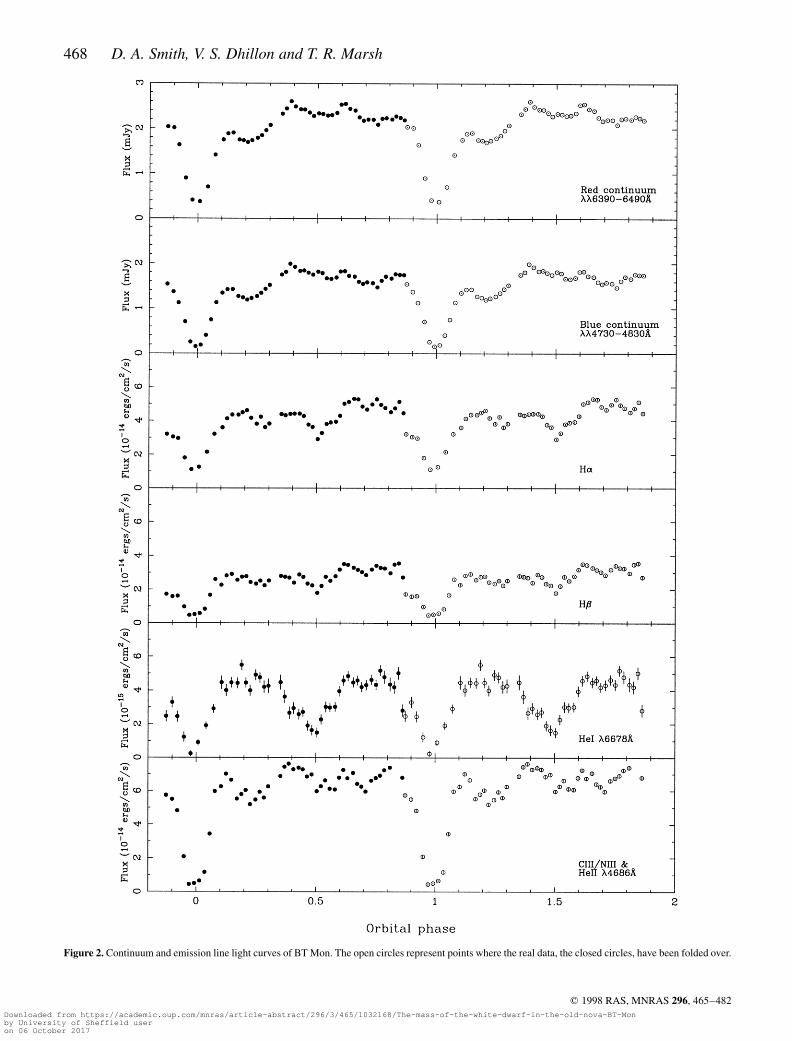
Regions of the spectrum devoid of emission lines were selected inthe red and blue (ll6390–6490 and 4730–4830 A). The red andblue continuum light curves for BT Mon were then computed bysumming the flux in the above wavelength ranges. A third-orderpolynomial fit to the continuum was subtracted from the red andblue spectra and the emission line light curves were then computedby summing the residual flux in the interval 62000 km s¹1 for theBalmer lines, 61000 km s¹1 for He I l6678 A and ll4620–4730 Afor He II and C III/N III.
The resulting light curves are plotted in Fig. 2 as a function ofphase, following our new ephemeris. The continuum shows a deepsymmetrical eclipse, the blue light curve having a deeper eclipsethan the red. There is no sign of an orbital hump at f , 0:9, as seenby Seitter (1984), but there is flickering throughout. The continuumlight curves of BT Mon in the red and the blue are similar to those ofthe well-known eclipsing cataclysmic variables DQ Her, RW Triand UX UMa, as noted by RNK.
The eclipses of the Balmer lines have a different shape from thecontinuum, there being a distinctive shoulder in the light curve as itenters eclipse. A similar shoulder is seen in the light curve of theweak He I line, but the light curve of He II shows only a hint of it. Thelines are all deeply eclipsed, even appearing flat-bottomed in theBalmer and He II lines, with the eclipse in Ha being shallower thanin the other lines, which almost vanish completely. There isflickering in all of the emission line light curves, and a significantdrop in the Balmer and He I line flux at f , 0:5. The emission linelight curves of BT Mon are similar to those of SW Sex (Dhillon,Marsh & Jones 1997) and the other systems in the SW Sex class,especially with regard to the phase 0.5 absorption.
4.4 Line profile evolution
We rebinned all of the spectra on to a uniform wavelength scale, andplaced the data into 10 binary phase bins by averaging all the spectrafalling into each bin. A multiple of 2.8 was then added to eachspectrum in order to displace the data in the y-direction. The result isplotted in Fig. 3.
The Balmer line profiles vary dramatically over one orbital cycle.The Ha line grows from a small bump at f , 0:0 to a narrow spikeat f , 0:2, then evolves into a broader, multi-peaked hump atf , 0:5, rising again to a spike at f , 0:7, mirroring that at f , 0:2,and finally declining on the way to eclipse. Hb and He I undergo
466 D. A. Smith, V. S. Dhillon and T. R. Marsh
q 1998 RAS, MNRAS 296, 465–482
Table 1. Times of mid-eclipse for BT Mon.
Cycle HJD at mid-eclipse O–C Reference(E) (2,440,000+) (secs)
0 3491:7168 6 0:0020 81.3 RNK3 3492:7144 6 0:0006 –250.6 RNK81 3518:7540 6 0:0002 –67.0 RNK3176 4551:9097 6 0:0002 107.0 RNK3179 4552:9098 6 0:0002 –8.8 RNK3182 4553:9125 6 0:0002 99.9 RNK3188 4555:9134 6 0:0002 –71.4 RNK3433 4637:6971 6 0:0002 –130.1 RNK5488 5323:6875 6 0:0002 134.2 Seitter1
18719 9740:3758 6 0:0002 –36.7 This paper
1 Seitter’s uncertainty is taken to be the same as ours.
Downloaded from https://academic.oup.com/mnras/article-abstract/296/3/465/1032168/The-mass-of-the-white-dwarf-in-the-old-nova-BT-Monby University of Sheffield useron 06 October 2017

similar changes, but they seem to be single-peaked throughout,although this could be an artefact of the lower resolution. Theybecome narrow at f , 0:2 and f , 0:7 and broader at f , 0:5,vanishing altogether at f , 0:0. The high-excitation lines of He II
and C III/N III vary little over one binary orbit, except for their totaldisappearance during eclipse, and seem to be single-peaked at allphases.
4.5 Trailed spectra
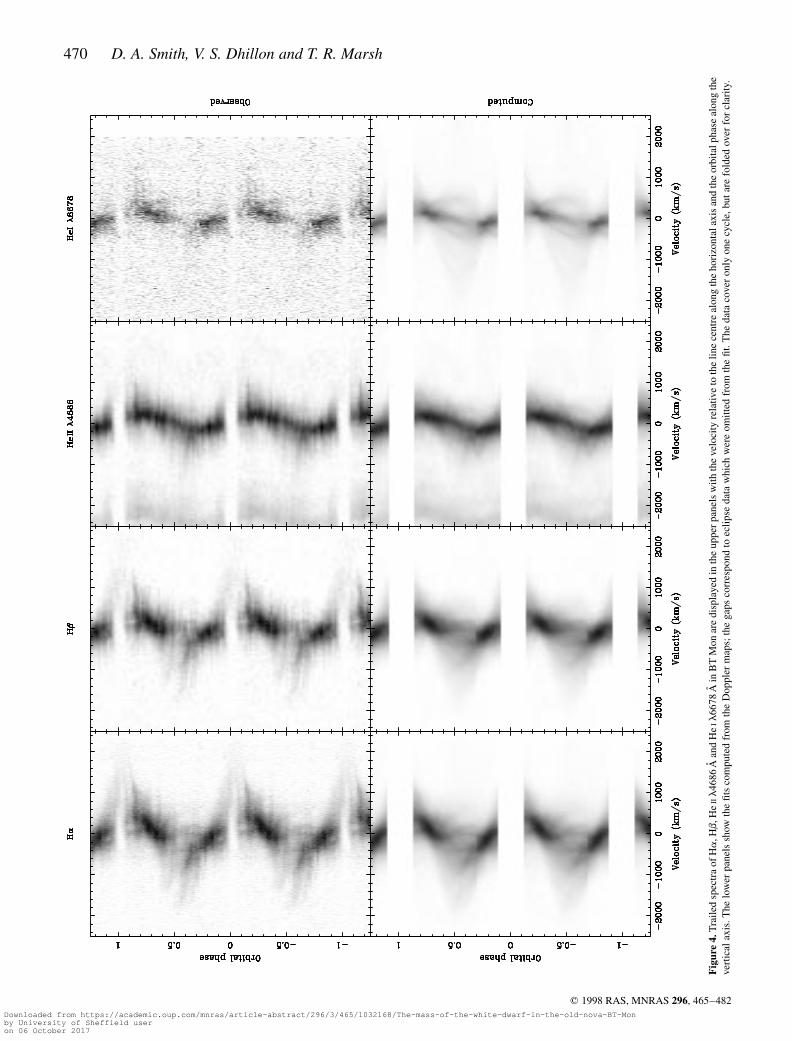
We subtracted the continua from the spectra using a third-orderpolynomial fit and then rebinned the spectra on to a constantvelocity interval scale centred on the rest wavelengths of thelines. The upper panels of Fig. 4 show the trailed spectra of the
Ha, Hb, He II l4686-A and He I l6678-A lines in BT Mon. Eachshows the characteristic sine waves of orbital motion in the coreof the emission line, but in addition to this there are clear signs ofhigh-velocity Balmer emission moving from ,2000 km s¹1 atf , 0 to , ¹ 2000 km s¹1 at f , 0:5. The high-velocity emissionis also present in the He II line but is weaker. Looking at Fig. 4 onenotices that the semi-amplitudes of the emission line cores vary,with Ha having the highest velocity semi-amplitude, Hb the nexthighest, and He II the lowest. This agrees with the observations ofSeitter (1984) and White, Schlegel & Honeycutt (1996). Note alsothe periodic flaring in the trailed spectra, visible in the horizontallystriped appearance of the upper panels. This will be discussed inmore detail in Section 4.7. The cores of the Balmer lines almostdisappear due to the phase 0.5 absorption, and the eclipse shows
The old nova BT Mon 467
q 1998 RAS, MNRAS 296, 465–482
Figure 1. The average spectrum of BT Mon, uncorrected for orbital motion.
Table 2. Fluxes and widths of prominent lines in BT Mon, measured from the average spectrum.
Line Flux EW FWHM FWZI× 10¹14 A km s¹1 km s¹1
erg cm¹2 s¹1
Ha 3:9 6 0:1 28:3 6 0:1 950 6 100 4500 6 500Hb 2:4 6 0:1 13:1 6 0:1 750 6 100 3500 6 500He I l6678 A 0:3 6 0:1 2:5 6 0:1 600 6 100 1500 6 500He II l4686 A 4:2 6 0:1 21:4 6 0:1 750 6 100 4500 6 500C III/N III ll4640-4650 A 1:6 6 0:1 8:5 6 0:1 1000 6 100 3500 6 500
Downloaded from https://academic.oup.com/mnras/article-abstract/296/3/465/1032168/The-mass-of-the-white-dwarf-in-the-old-nova-BT-Monby University of Sheffield useron 06 October 2017
468 D. A. Smith, V. S. Dhillon and T. R. Marsh
q 1998 RAS, MNRAS 296, 465–482
Figure 2. Continuum and emission line light curves of BT Mon. The open circles represent points where the real data, the closed circles, have been folded over.
Downloaded from https://academic.oup.com/mnras/article-abstract/296/3/465/1032168/The-mass-of-the-white-dwarf-in-the-old-nova-BT-Monby University of Sheffield useron 06 October 2017

nothing other than the high-velocity S-wave emission in the Balmerlines, which is never totally eclipsed. There are also faint com-ponents running vertically through the trailed Balmer linespectra, which could be lines from the nebula (Marsh, Wade &Oke 1983).
4.6 Doppler tomography
Doppler tomography is an indirect imaging technique which can beused to determine the velocity-space distribution of line emission incataclysmic variables. In this study we used the maximum entropymethod to create the Doppler maps. Full technical details of themethod, including a number of test simulations, are given by Marsh& Horne (1988). Examples of the application of Doppler tomo-graphy to real data are given by Marsh & Horne (1990) and Marshet al. (1990).
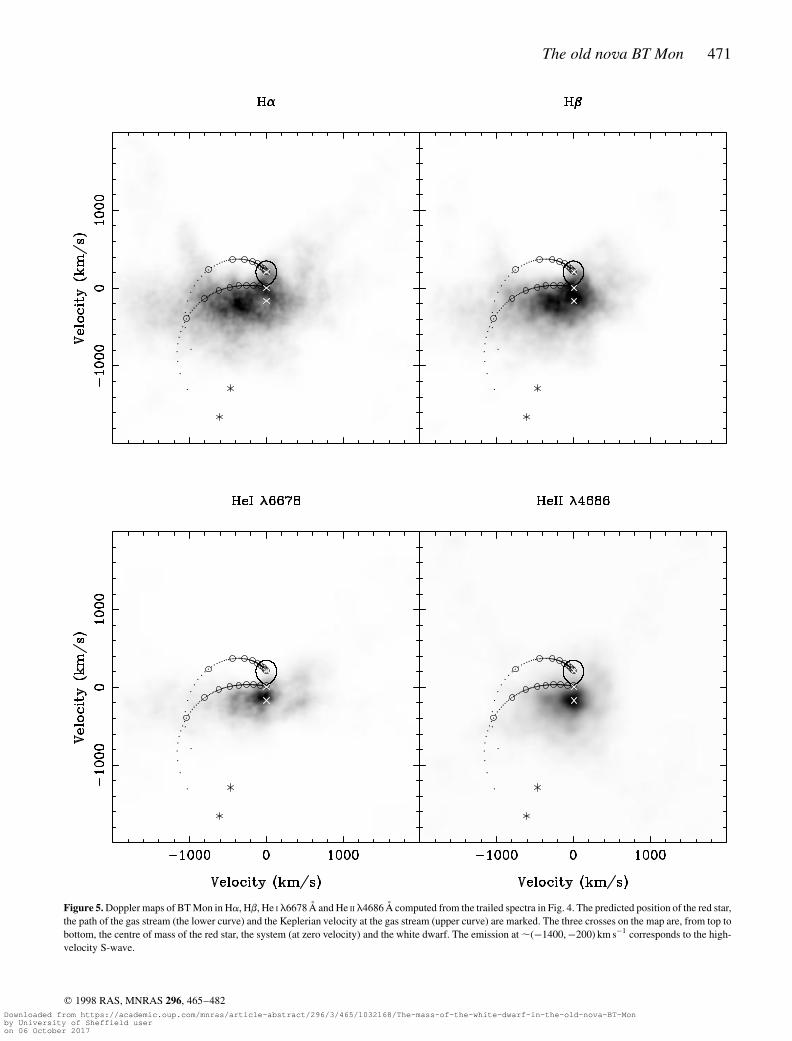
Fig. 5 shows the Doppler maps of the Ha, Hb, He I l6678-A andHe II l4686- A lines in BT Mon, computed from the trailed spectraof Fig. 4 but with the eclipse spectra removed. The three crosses onthe Doppler maps represent the centre of mass of the secondary star(upper cross), the centre of mass of the system (middle cross) andthe centre of mass of the white dwarf (lower cross). The Roche lobeof the secondary star and the predicted trajectory of the gas streamhave been plotted using the mass ratio, q ¼ M2=M1 ¼ 0:84, derivedin Section 4.12. The series of circles along the path of the gas streammark the distance from the white dwarf at intervals of 0:1L1,ranging from 1:0L1 at the red star to 0:1L1 at the point of closestapproach, marked by an asterisk.
It is clear from the Doppler maps that the emission regions do notcoincide with either the gas stream or the secondary star. A ring-likeemission distribution, characteristic of a Keplerian accretion discabout the primary star, is also absent from the maps. As in mostnova-likes the bulk of the Balmer emission is mapped to the lowerleft quadrant of the tomogram, with the high-velocity feature fromthe trailed spectra mapped to a zone extending out toVx ¼ ¹2000 km s¹1. The He II emission seems to be centred on ornear the expected position of the white dwarf. A likely origin of theline emission is discussed in Section 5.1.
Trailed spectra have been computed from the Doppler maps andcompared with the original trailed spectra as a check. They areplotted in the lower panels of Fig. 4 with the eclipse spectra omitted.They compare favourably, showing the original S-waves and high-velocity features.
4.7 Flares in the trailed spectra
The trailed spectra of Fig. 4 show periodic flaring similar to thefeatures seen more clearly in the trailed spectra of intermediatepolars, e.g. FO Aqr (Marsh & Duck 1996). Because the flares areweak in BT Mon we attempted to enhance them by removing thecore of the line emission and the high-velocity S-wave. This wasachieved by smoothing the trailed spectra images and subtractingthe smoothed image from the original. The resulting trailed spectraare displayed in the top panel of Fig. 6 and appear to show aperiodicity of ,30 min.
The flare spectra were then straightened in the velocity
The old nova BT Mon 469
q 1998 RAS, MNRAS 296, 465–482
Figure 3. Orbital emission line variations in BT Mon. The data have been averaged into 10 binary phase bins with a multiple of 2.8 added to each spectrum inorder to displace the data in the y-direction.
Downloaded from https://academic.oup.com/mnras/article-abstract/296/3/465/1032168/The-mass-of-the-white-dwarf-in-the-old-nova-BT-Monby University of Sheffield useron 06 October 2017
470 D. A. Smith, V. S. Dhillon and T. R. Marsh
q 1998 RAS, MNRAS 296, 465–482
Fig
ure
4.T
raile
dsp
ectr
aof
Ha
,Hb
,He
IIl
4686
Aan
dH
eIl
6678
Ain
BT
Mon
are
disp
laye
din
the
uppe
rpa
nels
with
the
velo
city
rela
tive
toth
elin
ece
ntre
alon
gth
eho
rizo
ntal
axis
and
the
orbi
talp
hase
alon
gth
eve
rtic
alax
is.T
helo
wer
pane
lssh
owth
efit
sco
mpu
ted
from
the
Dop
pler
map
s;th
ega
psco
rres
pond
toec
lips
eda
taw
hich
wer
eom
itted
from
the
fit.T
heda
taco
ver
only
one
cycl
e,bu
tare
fold
edov
erfo
rcl
arity
.
Downloaded from https://academic.oup.com/mnras/article-abstract/296/3/465/1032168/The-mass-of-the-white-dwarf-in-the-old-nova-BT-Monby University of Sheffield useron 06 October 2017
The old nova BT Mon 471
q 1998 RAS, MNRAS 296, 465–482
Figure 5. Doppler maps of BT Mon in Ha, Hb, He I l6678 A and He II l4686 A computed from the trailed spectra in Fig. 4. The predicted position of the red star,the path of the gas stream (the lower curve) and the Keplerian velocity at the gas stream (upper curve) are marked. The three crosses on the map are, from top tobottom, the centre of mass of the red star, the system (at zero velocity) and the white dwarf. The emission at ,ð¹1400;¹200Þ km s¹1 corresponds to the high-velocity S-wave.
Downloaded from https://academic.oup.com/mnras/article-abstract/296/3/465/1032168/The-mass-of-the-white-dwarf-in-the-old-nova-BT-Monby University of Sheffield useron 06 October 2017

472 D. A. Smith, V. S. Dhillon and T. R. Marsh
q 1998 RAS, MNRAS 296, 465–482
Figure 6. Upper panels: trailed spectra of Ha, Hb, and He II l4686 Awith the flares enhanced (see text for details). Central panels: the same as the upper panels,but straightened to account for orbital motion. Lower panels: power spectra computed from the central panels at each velocity, with frequency running vertically.
Downloaded from https://academic.oup.com/mnras/article-abstract/296/3/465/1032168/The-mass-of-the-white-dwarf-in-the-old-nova-BT-Monby University of Sheffield useron 06 October 2017
direction using the value of the white dwarf radial velocityfound in Section 4.12 (KW ¼ 170 km s¹1). The shifted spectraare plotted in the central panels of Fig. 6. Light curves at eachwavelength were calculated for these straightened flare spectraand trailed power spectra of the three lines were then obtainedby applying the Lomb–Scargle periodogram technique (Press &Rybicki 1989) to each of these light curves. The result isplotted in the bottom panels of Fig. 6. Ha shows no clearpeaks, but the Hb and He II l4686-A periodograms have severalpeaks around 45 cycles per day, suggesting that the flares maybe quasi-periodic.
The most obvious model for the multiperiodicity is that of thesystem being an intermediate polar, with material channelled downa magnetic accretion stream on to the magnetic pole of anasynchronously rotating primary star. The polar regions becomehot, emitting X-rays which periodically light up the accretionstream/disc/curtain like a lighthouse. Further evidence, however,is required to be certain of this classification (coherence of pulses,X-ray detection; see Section 5.1).
4.8 Radial velocity of the white dwarf
The continuum-subtracted spectra were binned on to a constant
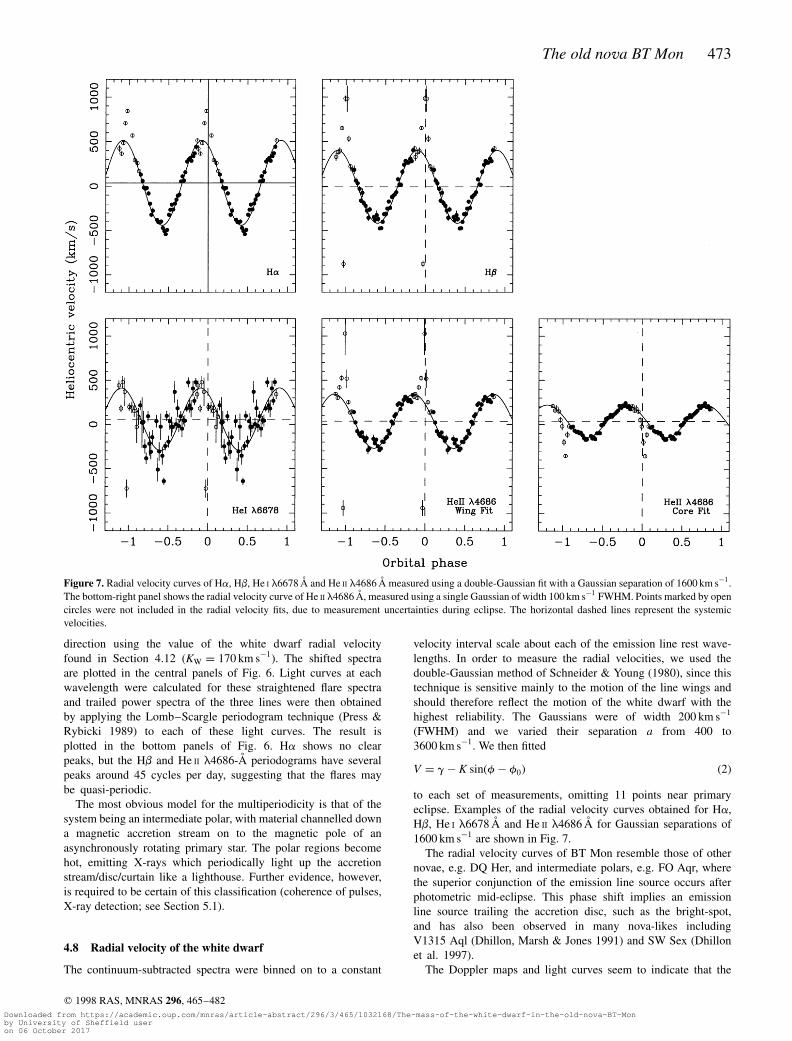
velocity interval scale about each of the emission line rest wave-lengths. In order to measure the radial velocities, we used thedouble-Gaussian method of Schneider & Young (1980), since thistechnique is sensitive mainly to the motion of the line wings andshould therefore reflect the motion of the white dwarf with thehighest reliability. The Gaussians were of width 200 km s¹1
(FWHM) and we varied their separation a from 400 to3600 km s¹1. We then fitted
V ¼ g ¹ K sinðf ¹ f0Þ ð2Þ
to each set of measurements, omitting 11 points near primaryeclipse. Examples of the radial velocity curves obtained for Ha,Hb, He I l6678 A and He II l4686 A for Gaussian separations of1600 km s¹1 are shown in Fig. 7.
The radial velocity curves of BT Mon resemble those of othernovae, e.g. DQ Her, and intermediate polars, e.g. FO Aqr, wherethe superior conjunction of the emission line source occurs afterphotometric mid-eclipse. This phase shift implies an emissionline source trailing the accretion disc, such as the bright-spot,and has also been observed in many nova-likes includingV1315 Aql (Dhillon, Marsh & Jones 1991) and SW Sex (Dhillonet al. 1997).
The Doppler maps and light curves seem to indicate that the
The old nova BT Mon 473
q 1998 RAS, MNRAS 296, 465–482
Figure 7. Radial velocity curves of Ha, Hb, He I l6678 A and He II l4686 A measured using a double-Gaussian fit with a Gaussian separation of 1600 km s¹1.The bottom-right panel shows the radial velocity curve of He II l4686 A, measured using a single Gaussian of width 100 km s¹1 FWHM. Points marked by opencircles were not included in the radial velocity fits, due to measurement uncertainties during eclipse. The horizontal dashed lines represent the systemicvelocities.
Downloaded from https://academic.oup.com/mnras/article-abstract/296/3/465/1032168/The-mass-of-the-white-dwarf-in-the-old-nova-BT-Monby University of Sheffield useron 06 October 2017
source of the He II l4686-A emission is centred on the white dwarf.This would be expected, since the He II line is a high-excitationfeature normally only seen in high-temperature regions, e.g. nearthe surface of the white dwarf. However, the radial velocity curvesproduced by using the double-Gaussian technique show large phaseshifts. Avisual inspection of the trailed spectra seems to show that itis the high-velocity features in the wings that are phase shifted whilethe core is not. As the double-Gaussian approach to measuring thevelocity would then be dominated by emission from the high-velocity feature, we instead attempted to measure the radial velocityof the He II line by fitting the core of the emission line, with a singleGaussian with FWHM ranging from 50 to 800 km s¹1. The radialvelocity curve produced using a single Gaussian of width
100 km s¹1 is also plotted in Fig. 7 and shows a much lowersemi-amplitude and a smaller phase shift, which appears to confirmthat this emission does indeed come from close to the white dwarf.
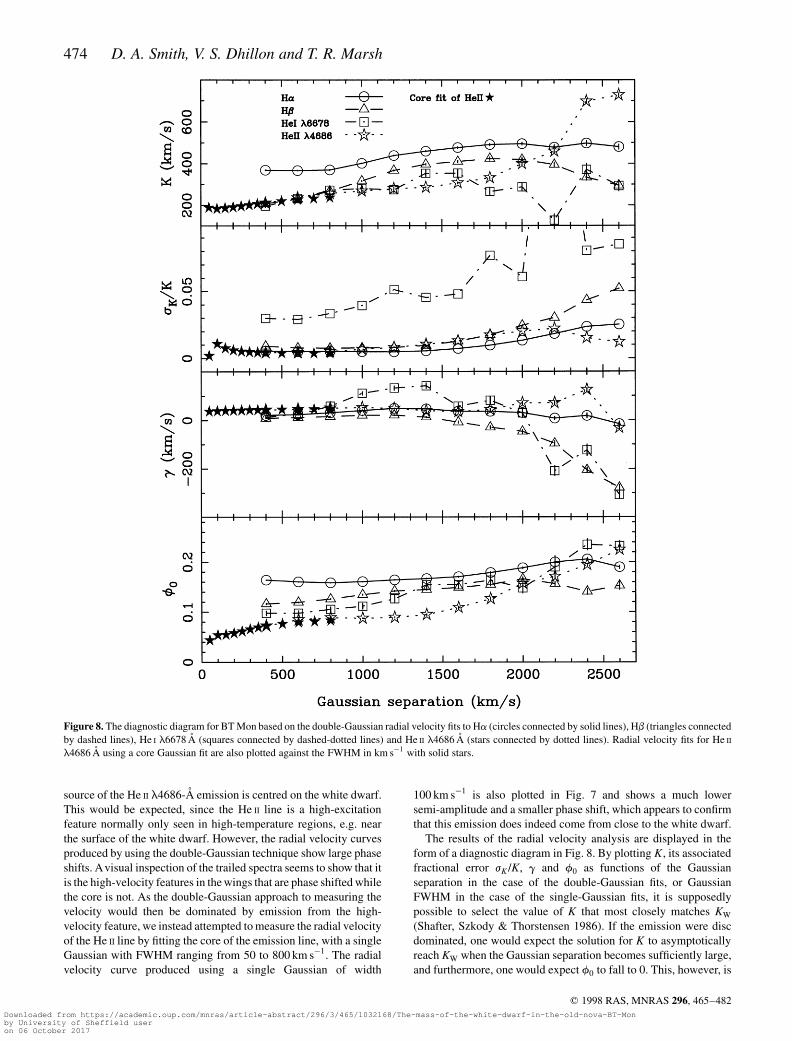
The results of the radial velocity analysis are displayed in theform of a diagnostic diagram in Fig. 8. By plotting K, its associatedfractional error jK =K, g and f0 as functions of the Gaussianseparation in the case of the double-Gaussian fits, or GaussianFWHM in the case of the single-Gaussian fits, it is supposedlypossible to select the value of K that most closely matches KW
(Shafter, Szkody & Thorstensen 1986). If the emission were discdominated, one would expect the solution for K to asymptoticallyreach KW when the Gaussian separation becomes sufficiently large,and furthermore, one would expect f0 to fall to 0. This, however, is
474 D. A. Smith, V. S. Dhillon and T. R. Marsh
q 1998 RAS, MNRAS 296, 465–482
Figure 8. The diagnostic diagram for BT Mon based on the double-Gaussian radial velocity fits to Ha (circles connected by solid lines), Hb (triangles connectedby dashed lines), He I l6678 A (squares connected by dashed-dotted lines) and He II l4686 A (stars connected by dotted lines). Radial velocity fits for He II
l4686 A using a core Gaussian fit are also plotted against the FWHM in km s¹1 with solid stars.
Downloaded from https://academic.oup.com/mnras/article-abstract/296/3/465/1032168/The-mass-of-the-white-dwarf-in-the-old-nova-BT-Monby University of Sheffield useron 06 October 2017
not the case, as the phase shift f0 is over 0.1 and increases withlarger double-Gaussian separation. The phase shift of the single-Gaussian fits for He II l4686 A, however, do seem to fall towardszero with decreasing FWHM.
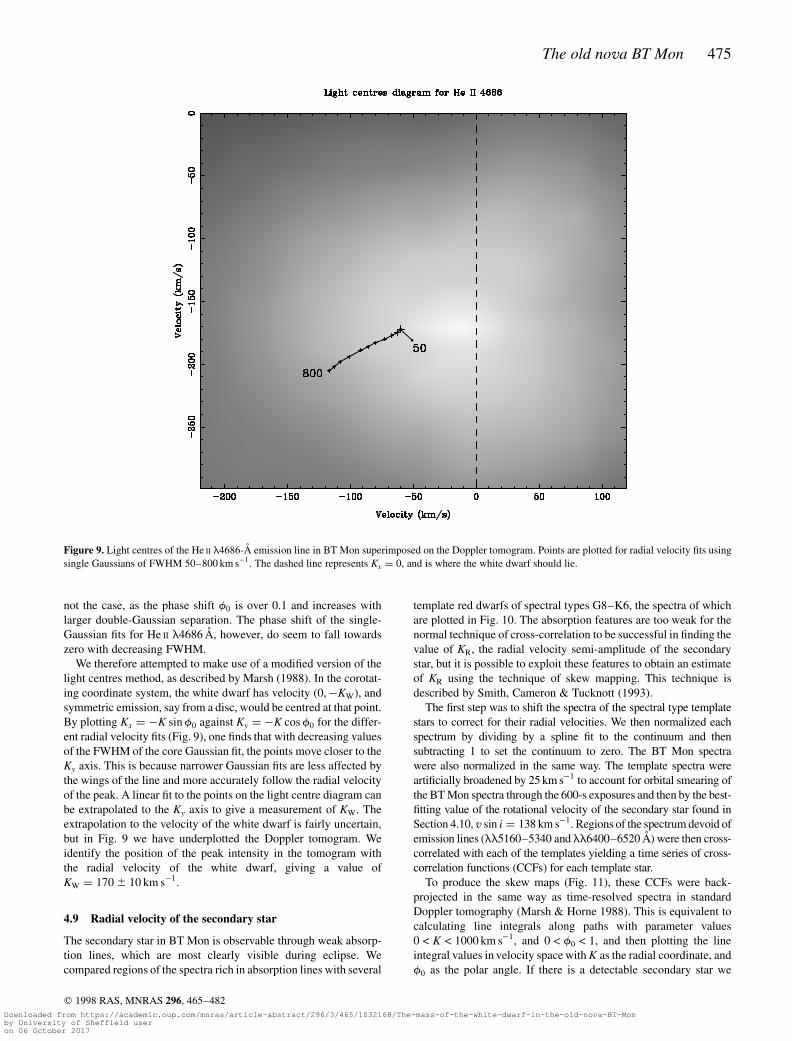
We therefore attempted to make use of a modified version of thelight centres method, as described by Marsh (1988). In the corotat-ing coordinate system, the white dwarf has velocity (0;¹KW), andsymmetric emission, say from a disc, would be centred at that point.By plotting Kx ¼ ¹K sin f0 against Ky ¼ ¹K cos f0 for the differ-ent radial velocity fits (Fig. 9), one finds that with decreasing valuesof the FWHM of the core Gaussian fit, the points move closer to theKy axis. This is because narrower Gaussian fits are less affected bythe wings of the line and more accurately follow the radial velocityof the peak. A linear fit to the points on the light centre diagram canbe extrapolated to the Ky axis to give a measurement of KW. Theextrapolation to the velocity of the white dwarf is fairly uncertain,but in Fig. 9 we have underplotted the Doppler tomogram. Weidentify the position of the peak intensity in the tomogram withthe radial velocity of the white dwarf, giving a value ofKW ¼ 170 6 10 km s¹1.
4.9 Radial velocity of the secondary star
The secondary star in BT Mon is observable through weak absorp-tion lines, which are most clearly visible during eclipse. Wecompared regions of the spectra rich in absorption lines with several
template red dwarfs of spectral types G8–K6, the spectra of whichare plotted in Fig. 10. The absorption features are too weak for thenormal technique of cross-correlation to be successful in finding thevalue of KR, the radial velocity semi-amplitude of the secondarystar, but it is possible to exploit these features to obtain an estimateof KR using the technique of skew mapping. This technique isdescribed by Smith, Cameron & Tucknott (1993).
The first step was to shift the spectra of the spectral type templatestars to correct for their radial velocities. We then normalized eachspectrum by dividing by a spline fit to the continuum and thensubtracting 1 to set the continuum to zero. The BT Mon spectrawere also normalized in the same way. The template spectra wereartificially broadened by 25 km s¹1 to account for orbital smearing ofthe BT Mon spectra through the 600-s exposures and then by the best-fitting value of the rotational velocity of the secondary star found inSection 4.10, v sin i ¼ 138 km s¹1. Regions of the spectrum devoid ofemission lines (ll5160–5340 and ll6400–6520 A) were then cross-correlated with each of the templates yielding a time series of cross-correlation functions (CCFs) for each template star.
To produce the skew maps (Fig. 11), these CCFs were back-projected in the same way as time-resolved spectra in standardDoppler tomography (Marsh & Horne 1988). This is equivalent tocalculating line integrals along paths with parameter values0 < K < 1000 km s¹1, and 0 < f0 < 1, and then plotting the lineintegral values in velocity space with K as the radial coordinate, andf0 as the polar angle. If there is a detectable secondary star we
The old nova BT Mon 475
q 1998 RAS, MNRAS 296, 465–482
Figure 9. Light centres of the He II l4686-A emission line in BT Mon superimposed on the Doppler tomogram. Points are plotted for radial velocity fits usingsingle Gaussians of FWHM 50–800 km s¹1. The dashed line represents Kx ¼ 0, and is where the white dwarf should lie.
Downloaded from https://academic.oup.com/mnras/article-abstract/296/3/465/1032168/The-mass-of-the-white-dwarf-in-the-old-nova-BT-Monby University of Sheffield useron 06 October 2017

would expect a peak at (0, KR) in the skew maps. This can berepeated for each of the templates, and the final skew map is the onethat gives the strongest peak.
When we first back-projected the CCFs, the peak in each skewmap was seen to be displaced to the left by around 40 km s¹1. Thereason was that we had assumed that the centre of mass of thesystem was at rest. The systemic velocity of BT Mon was estimatedfrom the diagnostic diagram to be g ¼ 40 km s¹1. Applying this g
velocity shifts the peak back towards the right of the skew maptowards Kx ¼ 0, without significantly altering Ky, i.e. the value ofKR obtained,
KR ¼ ðK2x þ K2
y Þ1=2 < Ky; K2x p K2
y ;
is almost independent of the g assumed. This can be understood bythe fact that the cross-correlation peaks are strongest at phase 0,where the eclipse spectra lie. Changing g shifts the peak in the Kx
direction but not the Ky direction. The positions of the peaks in theskew maps are plotted in Fig. 12 against the spectral type of thetemplate star, for g ¼ 0 and 40 km s¹1.
The skew maps produced using each of the template stars showwell-defined peaks at Ky < 205 km s¹1, in both the blue and red.The final skew maps for the G8 V template (found to be the best-fitting template for the secondary star in Section 4.10) are shown inFig. 11. From the scatter of the points in Fig. 12, which correspond
to the positions of the peaks in each skew map, we adopt a value forthe radial velocity semi-amplitude of the secondary star from theskew maps of KR ¼ 205 6 5 km s¹1.
4.10 Rotational velocity of the secondary star
Having obtained estimates of KW and KR, the third measurement wemade was the rotational velocity of the secondary star, v sin i, whichwas found in the following way. Using the value of KR obtainedfrom the skew maps in Section 4.9 we corrected for the orbitalmotion when averaging the four mid-eclipse spectra of BT Mon(those that show the strongest absorption features). We thenbroadened the template spectra to account for smearing due to theorbital motion of BT Mon over each 600-s exposure – about25 km s¹1 – and then rotationally broadened the templates by arange of velocities (50–200 km s¹1). Finally we ran an optimalsubtraction routine, which subtracts a constant times the normal-ized template spectra from the normalized, orbitally correctedBT Mon eclipse spectrum, adjusting the constant to minimize theresidual scatter between the spectra. The scatter is measured bycarrying out the subtraction and then computing the x2 betweenthis residual spectrum and a smoothed version of itself. By findingthe value of the rotational broadening that minimizes the reducedx2 we obtain an estimate of both v sin i and the spectral type of
476 D. A. Smith, V. S. Dhillon and T. R. Marsh
q 1998 RAS, MNRAS 296, 465–482
Figure 10. Normalized spectra of the seven template stars. The offset between each is 1. The uppermost spectra are a normalized average of the four mid-eclipsespectra of BT Mon, when its absorption features are most visible. The spectrum below that of BT Mon is that of the best-fitting template star (G8 V) which hasbeen broadened by 25 km s¹1 to account for orbital smearing of the BT Mon spectra during exposure and by 138 km s¹1 to account for the rotational broadeningof the lines in BT Mon.
Downloaded from https://academic.oup.com/mnras/article-abstract/296/3/465/1032168/The-mass-of-the-white-dwarf-in-the-old-nova-BT-Monby University of Sheffield useron 06 October 2017

the secondary star. There should, strictly speaking, be a smallcorrection due to the intrinsic rotational velocity of the templatestar, but as the templates are late-type stars they are assumed to besufficiently old to have lost most of their angular momentum bymagnetic braking and to have a very small v sin i (of the order of1 km s¹1: Gray 1992).
The value of v sin i obtained with this method depends uponseveral factors. Using later spectral types as templates tended toproduce lower values of v sin i by up to 25 km s¹1 in the blue band,but had a smaller effect in the red with a spread of only 6 km s¹1.The wavelength range we used for the optimal subtraction alsoaffected the value, as did the value of the limb-darkening coefficientused in the broadening procedure, and the amount of smoothing ofthe residual spectrum in the calculation of x2 in the optimalsubtraction routine. The values of v sin i for the different templatesin the red and the blue wavelength ranges, calculated using valuesfor the limb-darkening coefficient of 0.5 and the smoothing coeffi-cient of 15 km s¹1, are listed in Table 3.
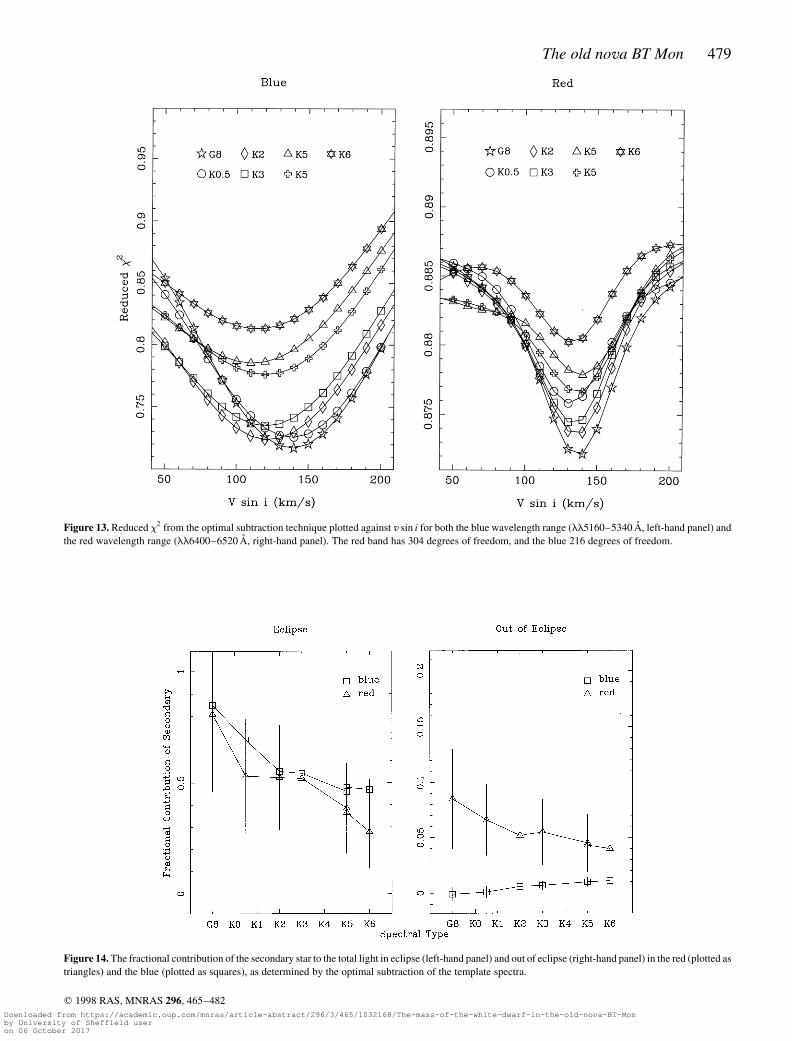
We plotted the values of x2 versus v sin i for each of the spectraltype template stars in Fig. 13. The minimum of the lowest curvegives both the value of v sin i and the spectral type of the secondarystar. The two wavelength ranges used give very consistent values.The blue band gives v sin i < 140 km s¹1, and the spectral typeG8 V, or possibly earlier, since we have no earlier template spectra.The red band also gives a spectral type of the secondary star of G8 Vor earlier, although note the expanded vertical scale in the right-hand panel, and a v sin i < 140 km s¹1. We adopt a value ofv sin i ¼ 138 6 5 km s¹1 for the rotational velocity of the secondarystar, with the notional errors on this estimate reflecting all of thevariations noted in the previous paragraph. The spectral type of thesecondary star is found to be G8 V from these v sin i curves and alsofrom a visual comparison of the absorption line depths, the V ¹ Rcolour found in Section 4.11, and the mass and radius found inSection 4.12.
The optimal subtraction technique also tells us the value of theconstant by which the template spectra were multiplied, which, fornormalized spectra, is the fractional contribution of the secondarystar to the total light. The results are plotted in Fig. 14, incomparison with both the eclipse and non-eclipse spectra. Wefind that the secondary star contributes 85 6 8 per cent of thetotal blue light in eclipse, and 81 6 35 per cent of the total red lightin eclipse.
4.11 The distance to BT Mon
By finding the apparent magnitude of the secondary star from itscontribution to the total light during eclipse, and estimating itsabsolute magnitude, we can calculate the distance to BT Mon. Atmid-eclipse, the apparent magnitude of the system is 17:4 6 0:2in the red wavelength range, which is approximately the R band,of which the secondary star contributes 81 6 35 per cent. In theblue (approximately the V band), the apparent magnitude is18:0 6 0:2 in eclipse, of which the secondary star contributes85 6 8 per cent. This gives us rough apparent magnitudes ofR ¼ 17:6 6 0:5 and V ¼ 18:2 6 0:3 for the secondary star.There are a number of ways of estimating the absolute magnitudeof the secondary star (Serrano 1978; Patterson 1984; Warner1995b; Gray 1992), assuming it is on the main sequence. Wetook each of these into account and adopted an averaged value ofthe absolute magnitude of MV ¼ þ6:0 6 0:5 for the secondarystar and hence mV ¹ MV ¼ 12:2 6 0:5. Duerbeck (1981) calcu-lated the extinction to BT Mon to be AV ¼ 0:63 mag kpc¹1 (weassume the error is small). The distance to BT Mon can then becalculated using the equation
5 logðd=10Þ ¼ mV ¹ MV ¹ d AV =1000 ð3Þ
and is found to be 1700 6 300 pc.Another method of finding the distance is to determine the
The old nova BT Mon 477
q 1998 RAS, MNRAS 296, 465–482
Figure 11. Skew maps of BT Mon computed by cross-correlation with the G8 V template. The cross-correlations were carried out over the range ll5160–5340 A in the blue (left panel), and ll6400–6520 A in the red (right panel). A systemic velocity of 40 km s¹1 has been assumed in each case. The value of KR isgiven by the (Kx;Ky) value at the peak; K2
R ¼ K2x þ K2
y .
Downloaded from https://academic.oup.com/mnras/article-abstract/296/3/465/1032168/The-mass-of-the-white-dwarf-in-the-old-nova-BT-Monby University of Sheffield useron 06 October 2017

angular diameter of the secondary star from the observed flux and asurface brightness calibration that we derive from the Barnes–Evans relation (Barnes & Evans 1976),
Fv ¼ 4:2207 ¹ 0:1V0 ¹ 0:5 log f ¼ 3:977 ¹ 0:429ðV ¹ RÞ0; ð4Þ
where V0 and ðV ¹ RÞ0 are the unreddened V magnitude and(V ¹ R) colour of the secondary star. We take the unreddenedcolour to be ðV ¹ RÞ0 ¼ 0:6 6 0:1 (typical of a late G or early Kdwarf) and V0 ¼ 17:2 6 0:3 (estimating the extinction to be 1.0mag, from above). Using these values and the radius of thesecondary star derived in Section 4.12, we obtain a distance of2300 6 700 pc.
A number of authors have estimated the distance to BT Mon.Sanford (1940) derived a value of 700–900 pc from the strengths ofthe interstellar H and K lines; McLaughlin (1941) assumed theradial velocities of the interstellar lines were due to the differentialrotation of the Galaxy, and, by also assuming that calcium was
uniformly distributed along the line of sight, was able to estimatethe distance to BT Mon. Using his method and the modern valuesfor Oort’s constants, RNK found a distance of 1400 pc to BT Mon.They further constrained the distance to be 1000–2000 pc bycombining the value of the reddening given by Wade (1981) withthe reddening versus distance curves of Deutschman, Davis &Schild (1976). Marsh, Wade & Oke (1983) estimated the distanceto be ,1800 pc from the expansion velocity of the nebula.
4.12 System parameters
Our measurements of the radial velocity of the secondary star,KR ¼ 205 6 5 km s¹1, and the rotational broadening,v sin i ¼ 138 6 5 km s¹1, as well as our measurement of theradial velocity of the primary star, KW ¼ 170 6 10 km s¹1, cannow be used in conjunction with our newly derived period andRNK’s measurement of the eclipse full width at half-depth,
478 D. A. Smith, V. S. Dhillon and T. R. Marsh
q 1998 RAS, MNRAS 296, 465–482
Figure 12. The position of the strongest peak in the skew maps, using g ¼ 0 km s¹1 (left-hand panel) and g ¼ 40 km s¹1 (right-hand panel) plotted againsttemplate spectral type. The skew maps produced by cross-correlation with the blue spectra (ll5160–5340 A) are represented by squares, and those produced bycross-correlation with the red spectra (ll6400–6520 A) are represented by triangles. The dotted lines link the Kx values and the solid lines link the Ky values.
Table 3. Values of v sin i for BT Mon as measured by comparison with the rotationally broadened profiles of G8–K6 dwarftemplates. Also listed are the fractional contributions of the secondary star to the total light during eclipse, and the position ofthe strongest peak in the skew maps for g ¼ 40 km s¹1.
Template v sin i v sin i Fractional Fractional (Kx,Ky) from (Kx,Ky) fromat min x2 at min x2 contribution contribution blue skew map red skew map
(blue) (red) of secondary of secondary g ¼ 40 km s¹1 g ¼ 40 km s¹1
km s¹1 km s¹1 (blue) (red) (km s¹1Þ (km s¹1)
G8V 139 137 0:85 6 0:08 0:81 6 0:35 (27,200) (35,203)K0.5V 139 132 0:69 6 0:07 0:53 6 0:26 (44,195) (48,203)K2V 122 136 0:55 6 0:05 0:52 6 0:23 (8,205) (33,201)K3V 121 134 0:54 6 0:05 0:52 6 0:24 (20,203) (40,203)K5Ve 112 139 0:46 6 0:05 0:38 6 0:20 (13,208) (33,203)K5Vbe 121 137 0:48 6 0:05 0:37 6 0:19 (20,208) (33,201)K6V 115 133 0:47 6 0:05 0:28 6 0:17 (8,205) (50,210)
Downloaded from https://academic.oup.com/mnras/article-abstract/296/3/465/1032168/The-mass-of-the-white-dwarf-in-the-old-nova-BT-Monby University of Sheffield useron 06 October 2017
The old nova BT Mon 479
q 1998 RAS, MNRAS 296, 465–482
Figure 13. Reduced x2 from the optimal subtraction technique plotted against v sin i for both the blue wavelength range (ll5160–5340 A, left-hand panel) andthe red wavelength range (ll6400–6520 A, right-hand panel). The red band has 304 degrees of freedom, and the blue 216 degrees of freedom.
Figure 14. The fractional contribution of the secondary star to the total light in eclipse (left-hand panel) and out of eclipse (right-hand panel) in the red (plotted astriangles) and the blue (plotted as squares), as determined by the optimal subtraction of the template spectra.
Downloaded from https://academic.oup.com/mnras/article-abstract/296/3/465/1032168/The-mass-of-the-white-dwarf-in-the-old-nova-BT-Monby University of Sheffield useron 06 October 2017
Df1=2 ¼ 0:117 6 0:011, to determine accurate system parametersfor BT Mon. Because only four of these five measurements areneeded to calculate the system parameters, and because, as theystand, the measured values of these parameters are not con-sistent with one another, we have opted for a Monte Carloapproach similar to that of Horne et al. (1993) to calculate themasses and other parameters. For a given set of values of KR,v sin i , Df1=2 and P, the other system parameters are calculatedas follows.
R2=a can be estimated because the secondary star fills its Rochelobe; R2 is the equatorial radius of the secondary star and a is thebinary separation. We used Eggleton’s formula (Eggleton 1983)which gives the volume-equivalent radius of the Roche lobe tobetter than 1 per cent, which is close to the equatorial radius of thesecondary star as seen during eclipse,
R2
a¼
0:49q2=3
0:6q2=3 þ ln ð1 þ q1=3Þ: ð5Þ
The secondary star rotates synchronously with the orbital motion,so we can combine KR and v sin i, to get
R2
að1 þ qÞ ¼
v sin iKR
: ð6Þ
This gives us two simultaneous equations so we can calculate themass ratio q and R2=a.
Simple geometric considerations give us�R2
a
�2¼ sin2 pDf1=2 þ cos2 pDf1=2 cos2 i; ð7Þ
which using the value of R2=a obtained using equations (5) and (6)allows us to calculate the inclination of the system. Kepler’s ThirdLaw gives us
K3RP
2pG¼
M1 sin3 i
ð1 þ qÞ2 ð8Þ
which, with the values of q and i calculated using equations (5), (6)and (7), gives the mass of the primary star. The mass of thesecondary star can then be obtained using
M2 ¼ qM1: ð9Þ
The radius of the secondary star is obtained from the equation
v sin iR2
¼2p sin i
P; ð10Þ
and the separation of the components, a, is calculated fromequations (6) and (10) with q and i now known.
The Monte Carlo simulation takes 10 000 sample values of KR,v sin i and Df1=2, treating each as being normally distributed abouttheir measured values with standard deviations equal to the errorson the measurements. We then calculate the masses of the compo-
480 D. A. Smith, V. S. Dhillon and T. R. Marsh
q 1998 RAS, MNRAS 296, 465–482
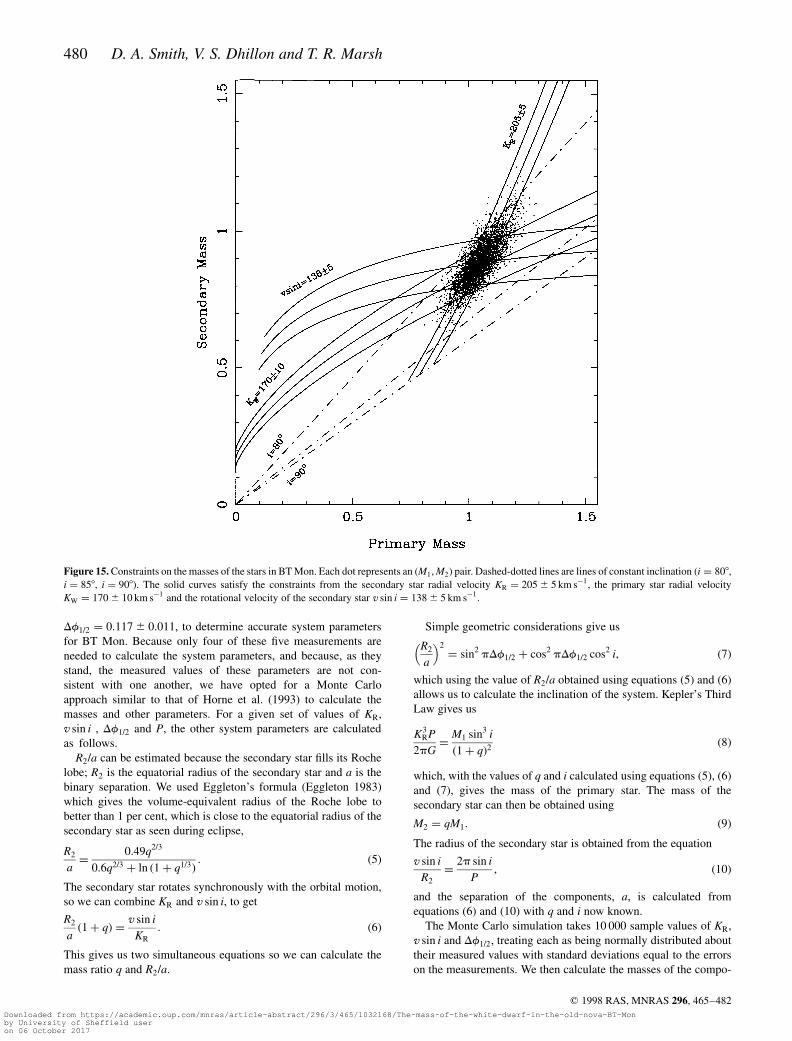
Figure 15. Constraints on the masses of the stars in BT Mon. Each dot represents an (M1;M2) pair. Dashed-dotted lines are lines of constant inclination (i ¼ 808,i ¼ 858, i ¼ 908). The solid curves satisfy the constraints from the secondary star radial velocity KR ¼ 205 6 5 km s¹1, the primary star radial velocityKW ¼ 170 6 10 km s¹1 and the rotational velocity of the secondary star v sin i ¼ 138 6 5 km s¹1.
Downloaded from https://academic.oup.com/mnras/article-abstract/296/3/465/1032168/The-mass-of-the-white-dwarf-in-the-old-nova-BT-Monby University of Sheffield useron 06 October 2017

nents, the inclination of the system, the radius of the secondary star,and the separation of the components, as outlined above, omittingðKR; v sin i;Df1=2Þ triplets which are inconsistent with sin i # 1.Each triplet is also subject to rejection if the calculated value of KW
(implied by the triplet) is inconsistent with the measured value ofKW (implied by Fig. 9). This was carried out accordance with aGaussian probability law, i.e. if the calculated value of KW lies 1j
(with j equal to the measured error on KW) from the mean (themeasured value of KW), the probability of rejection is 68 per cent, at2j it is 95 per cent, etc. Each accepted ðM1;M2Þ pair is then plottedas a point in Fig. 15, and the masses and their errors are computedfrom the mean and standard deviation of the distribution of spots.The solid curves in Fig. 15 satisfy the white dwarf radial velocityconstraint, KW ¼ 170 6 10 km s¹1, the secondary star radial velo-city constraint KR ¼ 205 6 5 km s¹1 and the rotational velocity ofthe secondary star, v sin i ¼ 138 6 5 km s¹1. We find thatM1 ¼ 1:04 6 0:06 M( and M2 ¼ 0:87 6 0:06 M( The values ofall the system parameters deduced from the Monte Carlo computa-tion are listed in Table 4.
The mass and radius of the secondary star are consistent withinthe error bars with those of a main-sequence star according to thevalues published by Gray (1992) for a G8 dwarf (M ¼ 0:89 M(,R ¼ 0:88 R() and the empirical relation obtained by Warner(1995b) between mass and radius for detached stars in binariesand the secondary stars in CVs,
R=R( ¼ ðM=M(Þ13=15: ð11Þ
The secondary star in BT Mon appears to be a main-sequence star inall respects.
5 D I S C U S S I O N
5.1 The nature of the system
The emission lines in the spectrum of BT Mon show single-peakedprofiles, instead of the double-peaked profiles expected of high-inclination accretion discs (Horne & Marsh 1986). These profiles,and the phase 0.5 absorption in the Balmer lines, are characteristicsof the SW Sex stars, a class of the nova-like variables (Thorstensenet al. 1991).
There are several competing models to explain the line emissionfrom the SW Sex objects. Honeycutt, Schlegel & Kaitchuck (1986)
invoked the existence of an accretion disc wind which dominatesthe Balmer emission and remains unobscured during primaryeclipse. Williams (1989) has suggested that the accretion disc isdisrupted by a strong magnetic field arising from the white dwarf,and accretion occurs via the field lines directly on to the whitedwarf. The single-peaked Balmer lines would then be produced bygas flowing in an accretion curtain lying above the orbital plane.Dhillon et al. (1997) attribute the emission to an extended bright-spot, the secondary star and an accretion disc. Hellier & Robinson(1994) suggests that the emission line peculiarities of PX And andother SW Sex stars can be explained by an accretion stream whichoverflows the initial impact with the accretion disc and continues toa later re-impact close to the white dwarf.
The flares we have discovered in the line emission lead us tofavour the intermediate polar (IP) interpretation of the system, inwhich material is accreted on to the magnetic poles of the primarystar, giving rise to hotspots on its surface. As the white dwarf rotatesasynchronously, these hotspots illuminate the inner parts of the disc,the accretion stream or the accretion curtain like a lighthouse, andwe observe a flare. This is consistent with the apparent slant to theflares; if the flares were the result of blobby accretion or some otherform of quasi-periodic flickering then the flares would presumablyappear horizontal in the trailed spectra. White et al. (1996) dis-missed the IP model for BT Mon, which identifies the high-velocityemission as coming from a magnetic accretion funnel, because thehigh-velocity spike they observed in the radial velocity curvesuggested to them that the feature only appeared during eclipse,whereas in our data it is visible, as it should be according to thismodel, throughout the whole orbital cycle. It would be of interest tosearch for the flares seen in BT Mon in the SW Sex stars.
The high-velocity component we see in the Balmer emission ofBT Mon is visible throughout the orbital cycle and does not appearto be eclipsed, implying that the source lies above the orbital plane.It is similar to that seen in some polar systems, e.g. HU Aqr(Schwope, Mantel & Horne 1997), in which the source of thehigh-velocity emission is thought to be the magnetic accretionfunnel. An accretion funnel may be the source of the high-velocitycomponent in BT Mon, or it may come from the accretion streamoverflowing the (undetected) disc, as suggested by Hellier &Robinson (1994) as a possible mechanism for the SW Sex stars,but our Doppler maps are not fully consistent with BT Monsatisfying either of these models.
For us to be sure of the classification of BT Mon as anintermediate polar, the flares need to be observed to be coherent,and our data set has neither the time resolution nor the baseline togive positive evidence of coherence. The system would also beexpected to show X-ray pulsations and, if it were strongly magnetic,circular and linear polarization (not observed by Stockman et al.1992). The luminosity of BT Mon in soft X-rays is low since it hasnot been detected by ROSAT in a survey of classical novae (MarinaOrio, private communication). BT Mon lies at a low galacticlatitude at a distance of ,2 kpc, so even if it were intrinsicallyluminous in X-rays, it is possible that the high level of extinctionwould severely diminish its apparent brightness in the soft X-rayband, although hard X-rays should still be visible.
5.2 The TNR model
The motivation for studying BT Mon was to obtain a tight constrainton the mass of the white dwarf, which we have done successfully, inorder to test the thermonuclear runaway model for nova outbursts,which broadly predicts that the higher the mass of the white dwarf,
The old nova BT Mon 481
q 1998 RAS, MNRAS 296, 465–482
Table 4. System parameters for BT Mon.
Parameter Measured Monte CarloValues Values
Porb (d) 0.33381379KR (km s¹1) 205 6 5 205 6 5v sin i (km s¹1) 138 6 5 136 6 4Df1=2 0:117 6 0:011 0:109 6 0:007KW (km s¹1) 170 6 10 171 6 8q 0:84 6 0:04i8 82:2 6 3:2M1=M( 1:04 6 0:06M2=M( 0:87 6 0:06R2=R( 0:89 6 0:02a=R( 2:46 6 0:05Distance (pc) 1700 6 300Spectral type G8 Vof secondary
Downloaded from https://academic.oup.com/mnras/article-abstract/296/3/465/1032168/The-mass-of-the-white-dwarf-in-the-old-nova-BT-Monby University of Sheffield useron 06 October 2017

the faster the nova outburst. Unfortunately the literature is dividedover the speed class of BT Mon.
Nova Mon 1939 was not discovered until 1939 October 8 (San-ford 1940), by which time it had declined from its maximumbrightness to around 8th or 9th magnitude, its rise to maximumfailing to be observed because this occurred when it was in thedaytime sky. Schaefer & Patterson (1983) looked back over archivalphotographic plates, taken in the month prior to the first observa-tions by Whipple (1940), which they believed to show the nova atmaximum light, with a magnitude of 8.5 (although Duerbeck 1987anotes an observation which gives the magnitude of BT Mon as 7.6),and combined these with later observations to produce an eruptionlight curve which suggests that BT Mon was a slow nova, givingt2 ¼ 140 d, and t3 ¼ 190 d, where t2 and t3 are the times for the novato decline by 2 and 3 mag from its maximum brightness.
This contradicts the earlier work of McLaughlin (1941) whocompared the spectra of 1939 December 26 and 1940 January 17with those of other novae. Assuming normal behaviour, the spectraof BT Mon corresponded to declines of 5.4 and 5.9 mag, respec-tively, from maximum. The observed apparent magnitudes were 9.6and 10.0 (Whipple 1940) which tells us that the faintest it couldhave been at maximum brightness was an apparent magnitude of4.2. McLaughlin extrapolated the light curve back, and found that itcorresponded to that of a fast nova; he later published a value for t3
of 36 d (McLaughlin 1945).One possible resolution of this problem is to image the nebula.
Fast novae generally give rise to almost spherical shells, slow novaeto more aspherical shells (Slavin, O’Brien & Dunlop 1995; Lloyd,O’Brien & Bode 1997). An image of the shell of BT Mon has beenobtained by Duerbeck (1987b), who found it to be very weak with anearly circular outline, which makes us favour the interpretation ofBT Mon as a fast nova.
6 C O N C L U S I O N S
We have shown that BT Mon has a white dwarf with a high mass(1:04 6 0:06 M() and that the observational evidence supports theclassification of BT Mon as a fast nova, in keeping with thethermonuclear runaway model of nova outbursts. The calculatedmass and radius, and the spectral features of the secondary star, areall consistent with it being a G8 main-sequence star. We have alsofound weak, regular flaring in the line emission, which couldindicate that the system is an intermediate polar.
AC K N OW L E D G M E N T S
We are indebted to Marina Orio for the communication of theresults of her BT Mon ROSAT observations. DAS is supported by aPPARC studentship and TRM by a PPARC advanced fellowship.The William Herschel Telescope is operated on the island of LaPalma by the Royal Greenwich Observatory in the Spanish Obser-vatorio del Roque de los Muchachos of the IAC.
R E F E R E N C E S
Barnes T., Evans D. S., 1976, MNRAS, 174, 489Deutschman W. A., Davis R. J., Schild R. E., 1976, ApJS, 30, 97Dhillon V. S., Marsh T. R., Jones D. H. P., 1991, MNRAS, 252, 342Dhillon V. S., Marsh T. R., Jones D. H. P., 1997, MNRAS, 291, 694Duerbeck H., 1981, PASP, 93, 165Duerbeck H., 1987a, Space Sci. Rev., 45, 1Duerbeck H., 1987b, ESO Messenger, 50, 9Eggleton P., 1983, ApJ, 268, 368Gray D. F., 1992, The Observation and Analysis of Stellar Photospheres.
Cambridge Univ. Press, CambridgeHellier C., Robinson E. L., 1994, Astrophys. Lett., 431, 107Honeycutt R. K., Schlegel E. M., Kaitchuck R. H., 1986, ApJ, 302, 388Horne K., Marsh T. R., 1986, MNRAS, 218, 761Horne K., Welsh W. F., Wade R. A., 1993, ApJ, 410, 357Lloyd H. M., O’Brien T. J., Bode M. F., 1997, MNRAS, 284, 137McLaughlin D. B., 1941, ApJ, 93, 417McLaughlin D. B., 1945, PASP, 57, 69Marsh T. R., 1988, MNRAS, 231, 1117Marsh T. R., Duck S. R., 1996, New Astron., 1, 97Marsh T. R., Horne K., 1988, MNRAS, 235, 269Marsh T. R., Horne K., 1990, ApJ, 349, 593Marsh T. R., Wade R. A., Oke J. B., 1983, MNRAS, 205, 33P
Marsh T. R., Horne K., Schlegel E. M., Honeycutt R. K., Kaitchuck R. H.,1990, ApJ, 364, 637
Oke J. B., 1990, AJ, 99, 1621Patterson J., 1984, ApJS, 54, 443Press W. H., Rybicki G. B., 1989, ApJ, 338, 277Robinson E. L., Nather R. E., Kepler S. O., 1982, ApJ, 254, 646 (RNK)Sanford R. F., 1940, PASP, 52, 35Schaefer B. E., Patterson J., 1983, ApJ, 268, 710Schneider D. P., Young P., 1980, ApJ, 238, 946Schwope A. D., Mantel K.-H., Horne K., 1997, A&A, 319, 894Seitter W. C., 1984, Ap&SS, 99, 95Serrano A., 1978, PhD thesis, Univ. SussexShafter A. W., Szkody P., Thorstensen J. R., 1986, ApJ, 308, 765Slavin A. J., O’Brien T. J., Dunlop J. S., 1995, MNRAS, 276, 353Smith R. C., Cameron A. C., Tucknott D. S., 1993, in Regev O., Shaviv G.,
eds, Cataclysmic Variables and Related Physics. IOP Publ., Bristol, p. 70Starrfield S., 1989, in Bode M. F., Evans A., eds, Classical Novae. John
Wiley & Sons Ltd, Chichester, p. 39Stockman H. S., Schmidt G. D., Berriman G., Liebert J., Moore R. L.,
Wickramasinghe D. T., 1992, ApJ, 401, 628Thorstensen J. R., Ringwald F. A., Wade R. A., Schmidt G. D.,
Norsworthy J. E., 1991, AJ, 102, 272Wade R. A., 1981, PhD thesis, California Institute of TechnologyWarner B., 1995a, Cataclysmic Variable Stars. Cambridge Univ. Press,
CambridgeWarner B., 1995b, Ap&SS, 232, 89Whipple F., 1940, Harvard Bull., 912, 5White J. C., Schlegel E. M., Honeycutt R. K., 1996, ApJ, 456, 777Williams R. E., 1989, AJ, 97, 1752
This paper has been typeset from a TEX=LATEX file prepared by the author.
482 D. A. Smith, V. S. Dhillon and T. R. Marsh
q 1998 RAS, MNRAS 296, 465–482Downloaded from https://academic.oup.com/mnras/article-abstract/296/3/465/1032168/The-mass-of-the-white-dwarf-in-the-old-nova-BT-Monby University of Sheffield useron 06 October 2017