THE MARS ODYSSEY GAMMA-RAY SPECTROMETER INSTRUMENT SUITE · THE MARS ODYSSEY GAMMA-RAY SPECTROMETER...
47
THE MARS ODYSSEY GAMMA-RAY SPECTROMETER INSTRUMENT SUITE w. V. BOYNTON I *, W. C. FELDMAN2, I. G. MITROFANOy 3 , L. G. EYANS 4 , R. C. REEDy5, S. W. SQUYRES 6 , R. STARR7, J.I. TROMBKA 8 , C. D'USTON 9 , J. R. ARNOLDlO, P. A. J. ENGLERT I I, A. E. METZGERI2, H. WANKEI3, .. 13 14 I I 1. BRUCKNER , D. M. DRAKE , C. SHINOHARA , C. FELLOWS , D. K. HAMARAI, K. HARSHMAN I , K. KERRyl, C. TURNERI, M. WARDI, H. BARTHE 9 , K. R. FULLER2, S. A. STORMS 2 , G. W. THORNTON 2 , J. L. LONGMIRE2, M. L. LITYAK 3 and A. K. TON'CHEy 3 I University of Arizona, Lunar and Planetary Laboratory, Tucson, AZ 85721, U.S.A. 2 Los Alamos National Laboratory, Los Alamos, NM 87545, U.S.A. 3 Space Research Institute, Moscow 4Science Programs, Computer Sciences Corporation, Lanham, Maryland 20706, U.S.A. 51nstitute of Meteoritics, University of New Mexico, Albuquerque NM 87131, U.S.A. 6Cornell University, Center for Radiophysics & Space Research, Ithaca, NY 14853, U.S.A. 7 Department of Physics, The Catholic University of America, Washington, DC 20064, U.S.A. 8NASA/Goddard Space Flight Center, Greenbelt, MD 20771, U.S.A. 9Centre d'Etude Spatiale des Rayonnements, Toulouse, France 10 University of California San Diego, Department of Chemistry, La Jolla, CA 92093, U.S.A. II University of Hawaii, Manoa, HI, U.s.A. 12 Jet Propulsion Laboratory, California Institute of Technology, Pasadena, CA 91109, U.S.A. 13 Max-Planck-Institut fur Chemie, 6500 Mainz, Federal Republic of Germany 14 TechSource, Sante Fe, NM 87505, U.S.A. (* Author for correspondence, E-mail: [email protected]. edu) (Received l3 September 2002; Accepted in final form 28 March 2003) Abstract. The Mars Odyssey Gamma-Ray Spectrometer is a suite of three different instruments, a gamma subsystem (GS), a neutron spectrometer, and a high-energy neutron detector, working together to collect data that will permit the mapping of elemental concentrations on the surface of Mars. The instruments are complimentary in that the neutron instruments have greater sensitivity to low amounts of hydrogen, but their signals saturate as the hydrogen content gets high. The hydrogen signal in the GS, on the other hand, does not saturate at high hydrogen contents and is sensitive to small differences in hydrogen content even when hydrogen is very abundant. The hydrogen signal in the neutron instruments and the GS have a different dependence on depth, and thus by combining both data sets we can infer not only the amount of hydrogen, but constrain its distribution with depth. In addition to hydrogen, the GS determines the abundances of several other elements. The instruments, the basis of the technique, and the data processing requirements are described as are some expected applications of the data to scientific problems. Space Science Reviews 110: 37-83, 2004. © 2004 Kluwer Academic Publishers.
Transcript of THE MARS ODYSSEY GAMMA-RAY SPECTROMETER INSTRUMENT SUITE · THE MARS ODYSSEY GAMMA-RAY SPECTROMETER...

THE MARS ODYSSEY GAMMA-RAY SPECTROMETER INSTRUMENT SUITE
w. V. BOYNTONI*, W. C. FELDMAN2, I. G. MITROFANOy3, L. G. EYANS4 ,
R. C. REEDy5, S. W. SQUYRES6 , R. STARR7, J.I. TROMBKA8 , C. D'USTON9,
J. R. ARNOLDlO, P. A. J. ENGLERT I I , A. E. METZGERI2, H. WANKEI3, .. 13 14 I I 1. BRUCKNER , D. M. DRAKE , C. SHINOHARA , C. FELLOWS ,
D. K. HAMARAI, K. HARSHMANI, K. KERRyl, C. TURNERI, M. WARDI, H. BARTHE9, K. R. FULLER2, S. A. STORMS2, G. W. THORNTON2,
J. L. LONGMIRE2, M. L. LITYAK3 and A. K. TON'CHEy3
I University of Arizona, Lunar and Planetary Laboratory, Tucson, AZ 85721, U.S.A. 2 Los Alamos National Laboratory, Los Alamos, NM 87545, U.S.A.
3 Space Research Institute, Moscow 4Science Programs, Computer Sciences Corporation, Lanham, Maryland 20706, U.S.A.
51nstitute of Meteoritics, University of New Mexico, Albuquerque NM 87131, U.S.A. 6Cornell University, Center for Radiophysics & Space Research, Ithaca, NY 14853, U.S.A.
7 Department of Physics, The Catholic University of America, Washington, DC 20064, U.S.A. 8NASA/Goddard Space Flight Center, Greenbelt, MD 20771, U.S.A.
9Centre d'Etude Spatiale des Rayonnements, Toulouse, France 10 University of California San Diego, Department of Chemistry, La Jolla, CA 92093, U.S.A.
II University of Hawaii, Manoa, HI, U.s.A. 12 Jet Propulsion Laboratory, California Institute of Technology, Pasadena, CA 91109, U.S.A.
13 Max-Planck-Institut fur Chemie, 6500 Mainz, Federal Republic of Germany 14 TechSource, Sante Fe, NM 87505, U.S.A.
(* Author for correspondence, E-mail: [email protected]. edu)
(Received l3 September 2002; Accepted in final form 28 March 2003)
Abstract. The Mars Odyssey Gamma-Ray Spectrometer is a suite of three different instruments, a gamma subsystem (GS), a neutron spectrometer, and a high-energy neutron detector, working together to collect data that will permit the mapping of elemental concentrations on the surface of Mars. The instruments are complimentary in that the neutron instruments have greater sensitivity to low amounts of hydrogen, but their signals saturate as the hydrogen content gets high. The hydrogen signal in the GS, on the other hand, does not saturate at high hydrogen contents and is sensitive to small differences in hydrogen content even when hydrogen is very abundant. The hydrogen signal in the neutron instruments and the GS have a different dependence on depth, and thus by combining both data sets we can infer not only the amount of hydrogen, but constrain its distribution with depth. In addition to hydrogen, the GS determines the abundances of several other elements. The instruments, the basis of the technique, and the data processing requirements are described as are some expected applications of the data to scientific problems.
Space Science Reviews 110: 37-83, 2004. © 2004 Kluwer Academic Publishers.

38 w. V. BOYNTON ET AL.
1. Introduction
The Mars Odyssey Gamma-Ray Spectrometer (GRS) is designed to record the spectra of gamma rays emitted from the martian surface as the spacecraft passes over different regions of the planet. The gamma rays arise from both radioactive decay and the nuclear interaction of elements with cosmic-ray particles. The energies of the gamma rays identify the elements responsible for the emissions, and their intensities determine the concentrations. In addition, the instrument also has the capability to determine the fluxes of thermal, epithermal, and high-energy neutrons coming from the surface of the planet. From these data, we can determine the ability of the surface materials to moderate and absorb neutrons and thus gain important information about the abundances and distributions of light elements, especially hydrogen. In addition, the neutron data are useful for determining the excitation flux for the gamma-rays made by nuclear reactions.
In this work, we first provide a simplified review of the basis of the gamma-ray and neutron spectrometry technique followed by a description of the GRS detectors and the analysis of their data. We then describe the instrumentation in detail and discuss its scientific objectives. Planetary gamma-ray and neutron spectroscopies were both proposed in the early 1960's by Arnold, Lingenfelter, and others (e.g., Lingenfelter et aI., 1961; Arnold et aZ., 1962; Van Dilla et aZ., 1962). On the Apollo 15 and 16 missions in 1971 and 1972, NaI(Tl) scintillation gamma-ray spectrometers were flown to the Moon, and spectra were accumulated over about 20% of the lunar surface. Abundances of magnesium, potassium, iron, titanium, and thorium were produced from the Apollo gamma-ray data (e.g., Bielefeld et aZ., 1976; Davis 1980, Etchegaray-Ramirez et aZ., 1983). The Apollo gamma-ray results confirmed that planetary gamma-ray spectroscopy is a useful tool in determining elemental compositions and that the theoretical calculations used in interpreting the data (e.g., Reedy, 1978) were basically correct. More recently, the Lunar Prospector mission flew both a bismuth germanate (BGO) gamma-ray instrument and a 3Hebased neutron instrument on a spacecraft in a low polar orbit (Feldman et aZ., 1999). The Lunar Prospector gamma-ray spectrometer was used to make useful geochemical maps of the entire Moon (Lawrence et at., 1999, 2002; Prettyman et at., 2002), and its neutron instrument provided strong evidence for hydrogen near the lunar poles (Feldman et aZ., 2001), probably in the form of ice trapped on the permanently-shadowed floors of polar impact craters.
Most recently, a gamma-ray spectrometer was flown to the asteroid Eros as part of the Near Earth Asteroid Rendezvous (NEAR) mission (Trombka et aZ., 2000). This instrument was similar in many respects to the Apollo GRS instrument. However, instead of being mounted on a boom to reduce background from the spacecraft, the NEAR GRS was partially surrounded by a BGO detector that could be operated in anticoincidence mode to reject spacecraft background. The NEAR GRS produced only limited compositional results for Eros during the spacecraft's orbital mission, due to the low gamma-ray emission rate from the asteroid. How-

GAMMA-RAY SPECTROMETER SUITE 39
ever, the mission was terminated by gently landing the spacecraft on the asteroid. In the landed configuration the GRS was in direct physical contact with the asteroidal regolith, and the counting statistics improved markedly. The spacecraft survived in this configuration for a considerable period of time, and over 200 hours of gammaray data were collected, providing significant new information on the elemental composition of the asteroid at the landing location (Evans et ai., 2001).
Gamma-ray spectroscopy at Mars has been considered for many years (e.g., Metzger and Arnold, 1970), but has not yet been carried out with any success. The Soviet Mars-5 and Phobos missions included CsI(Tl) gamma-ray spectrometers that obtained limited data at Mars but few quantitative results on elemental abundances (Surkov, 1984; Surkov et ai., 1989; Trombka et aZ., 1992). The Mars Observer spacecraft, launched in 1992, carried a combined gamma and neutron spectrometer (Boynton et ai., 1992) that was similar in many respects to the instrumentation carried on Mars Odyssey. However, Mars Observer was lost three days prior to orbit insertion, and no gamma-ray data from Mars were obtained. The Mars Odyssey GRS experiment is therefore the first highly capable elemental chemical mapping instrument to successfully orbit Mars.
Most papers on planetary gamma-ray spectroscopy consider only instruments that use inorganic scintillator technology: low-resolution spectrometers ,0.EIE. 8% full-width at half maximum at 662 keY) like NaI(Tl), CsI(Tl) and bismuth germanate (BGO). Substantial improvements in overall scientific performance are possible, however, via use of more advanced detector technology. The idea of using high-resolution solid-state gamma-ray spectrometers ,0.EIE ~ 0.3%) made with detectors of germanium (Ge) dates back to Metzger et aZ. (1975), who discussed the virtues of having high spectral resolution even though the net efficiency of the detector for gamma rays is smaller than that of a scintillator spectrometer (cf. Metzger and Drake, 1990). Gamma-ray spectrometers using Ge detectors have been flown for astrophysical investigations for many years (e.g., Mahoney et aI., 1980). Several problems with the use of high-resolution gamma-ray spectrometers in space have been identified in simulation experiments, such as radiation damage (e.g., Pehl et aZ., 1978; Bruckner et ai., 1991) and unusual peaks in the spectra (e.g., Bruckner et aI., 1987) and are discussed below.
2. Basis of the Technique
2.1. SOURCES AND TRANSPORT OF NEUTRONS
The ultimate source of almost all neutrons and most gamma rays in a planet are the galactic cosmic rays (GCR). The GCR are mainly (about 87%) protons (nuclei of IH), about 12% alpha particles (nuclei of 4He), and ~ 1% heavier nuclei that arrive in the solar system with energies typically of ~ 0.1-10 Ge V Inucleon. At these high energies, most of the GCR particles react before they are slowed much

40 w. V. BOYNTON ET AL.
by energy-loss mechanisms when interacting with matter. The interaction of these GCR particles in a planet's surface results in a cascade of secondary particles, including rv 10 neutrons, most with energies of rv 0.1-20 Me V, per incident primary particle (Reedy and Arnold, 1972). Charged secondary particles, such as protons, with such energies are fairly rapidly stopped by ionization energy losses. Secondary neutrons, however, travel until they undergo an interaction with a nucleus in the planet's surface or escape to space.
Free neutrons (those outside a nucleus) are radioactive, beta-decaying to a proton and electron with a half-life of 615 seconds. Neutrons are made in planetary surfaces by reactions induced by cosmic-ray particles. The 'birth' of a neutron depends to some extent on the composition of the planet. More neutrons per incident cosmic-ray particle are produced from heavier elements, especially those with more neutrons than protons in their nuclei, such as titanium and iron (Drake et at., 1988; Masarik and Reedy, 1994). The flux of fast (about 0.6 to 8 MeV) neutrons measured by Lunar Prospector varied over the Moon's surface, with more fast neutrons being observed over regions with higher average atomic mass (Gasnault et ai., 2001). The production of neutrons decreases roughly exponentially with depth in a planetary surface, with an e-folding length of'" 150 g/cm2.
The transport of neutrons in the planet depends very much on composition. The use of neutron spectroscopy to study the composition of a planet's surface was first discussed over four decades ago (Lingenfelter et al., 1961). Elastic scattering from nuclei slows neutrons, and the amount of slowing is dependent on the mass of the nucleus from which the neutron scatters; the lighter the nucleus, the more energy a neutron can lose per scatter (Fermi, 1950: Drake et ai., 1988). The neutrons also have non-elastic interactions with nuclei. The cross sections for nuclei to interact with energetic (Me V) neutrons are all roughly the same, but the cross sections for the interaction with neutrons having thermal energies (below'" 0.1 e V) or epithermal energies ('" 0.1-1000 e V) can vary drastically among nuclei. For example, carbon and oxygen have very low absorption cross sections for neutrons with energies below '" 1 ke V, but iron, titanium, and chlorine all have very high cross sections for absorbing low-energy neutrons. The trace elements gadolinium and samarium have such huge cross sections that even at very low (a few parts per million by weight) elemental concentrations they can significantly affect neutron transport (e.g., Lingenfelter et ai., 1972; Lapides, 1981).
A sizable fraction of neutrons made within the regolith are transported to the surface of a planet and escape to space. Most of these leakage neutrons are from the top few tens of centimeters ('" 100 g/cm2) of the planet. Their energy spectrum reflects the transport properties in this top layer of the planet, including the martian atmosphere and any layers, such as water or carbon dioxide frost, deposited on the regolith. Leakage neutrons with energies below the gravitational binding energy (0.132 eV for Mars) can return to the surface (Feldman et ai., 1989).
Neutrons with energies above the first excited levels of nuclei ('" 0.5 MeV for light nuclei) can interact with nuclei both by scattering elastically or by nonelastic

GAMMA-RAY SPECTROMETER SUITE 41
scattering. Neutrons with energies above "-' 8 MeV can make more neutrons by reactions such as (n,2n), where two neutrons are emitted by a reaction induced by the first one. The flux of fast ("-'0.5-10 MeV) neutrons in Mars increases with depth near the very surface to a maximum near a depth of about 50 glcm2 and then decreases with depth (Masarik and Reedy, 1996).
2.1.1. Neutron moderation The dominant energy-loss mechanism for neutrons having energies between about 0.1 e V and 0.5 MeV is elastic scattering. Energy loss, or moderation, results from the recoil of the struck nucleus leading to a constant, angle-averaged fractional energy reduction per collision. In the absence of other energy-loss mechanisms, such as absorption or leakage, continuous downscattering leads to an equilibrium neutron flux spectrum, which decreases with increasing energy as E- 1• This process, and the resultant energy spectrum, defines the epithermal component of the energy spectrum of neutrons.
Although the shape of the neutron flux spectrum in the epithermal range is determined by the elastic scattering process, its intensity is determined by the nuclear properties of the elements that constitute the planetary material. Most important are the atomic mass, which determines the amount of energy transferred from the neutron to the nucleus in each elastic collision, and the magnitude of the elastic cross section. Hydrogen is special in both respects; its mass is closely equal to that of the neutron, leading to an average transfer of half the neutron energy per collision, and the cross section for elastic n-p scattering is very high. Both effects promote fast moderation leading to a very low amplitude of the epithermal component of the equilibrium neutron spectrum. Detection of a significantly depressed epithermal amplitude therefore provides a unique signature of near-surface planetary hydrogen.
The dominant reaction types below about 0.1 e V are elastic collisions, which equilibrate the thermal motions of the neutron population with that of the nuclei of planetary matter, and neutron absorption reactions, which terminates the neutron. The resultant equilibrium neutron energy spectrum of these thermal neutrons is Maxwellian.
As with epithermal neutrons, the interaction processes for thermal neutrons define the Maxwellian shape of the equilibrium flux spectrum. However, the amplitude of the thermal-neutron flux is determined by the importance of absorption and leakage relative to the down-scattered injection rate. For these processes, carbon and oxygen are special. They both have extremely low neutron absorption cross sections yet moderately low atomic weights. Because thermal neutrons are gravitationally bound to Mars, the dominant neutron loss mechanism for a pure carbon dioxide deposit, such as is expected over the winter polar caps, is due to trace abundances of argon and nitrogen in the atmosphere and to neutron beta decay. Resultant thermal amplitudes should therefore be greatly enhanced (Drake et al., 1988; Feldman et al., 1993a). In general, however, the thermal neutron

42 w. V. BOYNTON ET AL.
amplitude does not provide a unique signature of enhanced carbon and oxygen in surface material, such as might result from a large carbonate deposit, because of the possible presence of other elements such as Fe, Ti, and Cl, which have large neutron absorption cross sections. Identification of such deposits therefore requires a combined analysis of gamma-ray and neutron data for a complete specification of the surface chemistry (Feldman and Jakosky, 1991). The flux-versus-depth profile of thennal neutrons depends strongly on the concentration of hydrogen in the surface. With no H in the surface, the peak flux of thermal neutrons is at a depth of about 150 g/cm2 . With increasing H contents, the depth of the thermal-neutron peak moves towards the surface (Lapides, 1981). In Mars, the thermal-neutron flux at the peak increases until the H content is about 0.5%. For higher H contents, H is the dominant absorber of thermal neutrons, and the flux of thermal neutrons at the peak depth starts to decrease with increasing H content (Feldman et af., 1993a; Masarik and Reedy, 1996).
The neutron components of the Mars Odyssey Gamma-Ray Spectrometer will be used to determine the fluxes of thennal, epithennal, and fast neutrons for each martian surface resolution element. Numerical simulations have shown (e.g., Drake et aZ., 1988; Dagge et aZ., 1991; Feldman et aZ., 1993a) that the epithermal amplitude by itself is a sensitive indicator of the surface hydrogen content. The fluxes of epithermal neutrons measured by Lunar Prospector were used to infer the presence of H at the poles of the Moon (Feldman et al., 2001). The fluxes of thermal and epithermal neutrons escaping from the Moon were also used to constrain chemical compositions of lunar surface regions (Feldman et aZ., 2000). Vertical stratigraphy is also possible using a combination of neutron and gamma-ray data (e.g., Evans and Squyres, 1987, Boynton et aZ., 2002).
The numerical simulations mentioned above have also shown that the thennal neutron amplitude is a sensitive indicator of carbon dioxide frost. Although this result is not unique because of the effects of nonnally abundant neutron absorbing nuclei in the Martian regolith as noted above, the fact that the underlying surface composition will not change during the winter season should allow use of the neutron data alone to map the growth and decay of the carbon-dioxide frost polar caps.
2.2. SOURCES OF GAMMA RAYS
A large variety of mechanisms produce gamma rays in a planet. Some, such as bremsstrahlung by energetic charged particles and the decay of cosmic-ray-produced neutral pions, produce a spectrum that is a featureless continuum. The gamma rays of interest in mapping elemental abundances, however, are those photons emitted by excited nuclei with very specific energies, typically in the range of 0.2-10 Me V. The excited levels in each nucleus occur at specific quantized energies, and the energy of a gamma ray made by a transition between nuclear levels can usually identify which nucleus produced it. Nuclei can be excited directly by

GAMMA-RAY SPECTROMETER SUITE 43
cosmic-ray particles, by inelastic scattering and capture of neutrons, or in the decay of radioactive nuclei. Details of the production and transport of these gamma rays can be found in Reedy et al. (1973), Reedy (1978), Evans and Squyres (1987), and Evans et al.(1993).
Energetic particles emitted sporadically from the Sun can also result in gammaray production (Reedy et al., 1973), but such solar-particle-produced gamma rays are of very limited use in planetary gamma-ray spectroscopy. The high intensity of solar particles penetrate the gamma-ray detector, yielding a high background signal that makes it difficult to detect prompt gamma rays from the surface of the planet. In addition, because the energy of the solar particles are much lower than that of galactic cosmic rays, most solar particles stop or react in the martian atmosphere and do not reach the surface.
2.2.1. Decay of natural radioelements Several elements have isotopes with half-lives long enough that many nuclei have not decayed since they were formed by nucleosynthetic processes over 4.6 Ga ago. Normal potassium includes 0.012% of the isotope 40K, which has a half-life of 1.25 Ga. When 40K decays, 10.7% of the time the first excited level of 40 Ar at an energy of 1.461 MeV is produced. This excited level almost immediately decays to the 40 Ar ground state by emitting a 1.461 MeV gamma ray. Other naturally radioactive elements that will be mapped using decay gamma rays are l4-Ga 232Th, 4.47-Ga 238U, and 0.70-Ga 235U. Several isotopes in the decay chains of 232Th and 238U actually emit the gamma rays used to map those elements. Thorium is usually mapped using the 2.615 MeV gamma ray emitted by its 20sTI daughter. Other strong gamma rays made in the 232Th decay chain include 0.911 MeV (228 Ac), 0.583 MeV e08Tl), and 0.239 MeV e 12Pb). In the decay chain for 238U, the strongest fluxes of gamma rays are at 1.764,1.120, and 0.609 MeV (all from 214Bi) and 0.352 MeV e14Pb).
If a naturally radioactive element is uniformly distributed in the top ~ 100 g/cm2 of a planet's surface, the fluxes of its decay gamma rays escaping the surface depend only on basic nuclear data, such as half-lives, gamma-ray yields, and the gamma-ray-transport property of overlying media (which is usually not very sensitive to composition) (cf., Reedy et aI., 1973). Non-uniformity in composition as a function of depth in the top layer from which gamma rays escape can be detected because gamma rays of different energies are attenuated by different amounts.
2.2.2. Nonelastic-scattering-produced gamma rays The GCR-produced neutrons discussed above are the major source of gamma rays for most other elements. GCR particles can induce a wide range of reactions. An example of a reaction induced by GCR particles is the production of radioactive 24Na from aluminum by a reaction in which a neutron enters a 27 Al nucleus and an alpha particle exits leaving a 24Na nucleus. The short-hand notation for this reaction is 27 AI(n,a)24Na. Although 24Na emits a pair of gamma rays in its decay,
44 W. Y. BOYNTON ET AL.
these gamma rays are not used to map aluminum, as reactions with magnesium and silicon also produce large amounts of 24Na and several prompt reactions also can produce the same gamma rays. Gamma rays made by the decay of cosmicray-produced radionuclides, such as 24Na, are seldom used in planetary gammaray spectroscopy (Reedy et at., 1973). Most elements are mapped using neutroninelastic-scattering or neutron-capture reactions, which produce excited states of nuclei that decay rapidly to their ground states by emitting characteristic gamma rays.
Most elements produce gamma rays by nonelastic scattering reactions where an excited level in a nucleus is populated by an energetic particle and then almost immediately (typically of the order of a picosecond) decays to a lower level. Por example, the 28Si nucleus has its first excited state at an energy of 1.77903 MeV, and any neutron having energy greater than 1.843 MeV (to conserve momentum, some of the neutron's incident energy goes into kinetic energy of the product nucleus) can excite 28Si to that level. The decay of this level in 28Si results in a gamma ray of 1.77897 MeV (with a very small amount of energy, 0.06 keV, going to the 28Si nucleus for momentum conservation). This population of an excited level in the initial nucleus is called an inelastic-scattering reaction. The notation for this inelastic-scattering reaction is 28Si(n,n(y )28 Si. If a neutron incident on a 28Si nucleus has enough energy (above about 3 MeV), other types of nonelasticscattering reactions can occur (such as the 28Si(n,a)25Mg reaction). A neutron with energy above 11.7 MeV that reacts with 28Si can lead to the emission of both a neutron and alpha particle that results in the population of the first excited level in 24Mg, which then rapidly emits a 1.369 MeV gamma ray. This 28Si(n,na(y)24Mg reaction cannot be used to map silicon but is actually an unwanted interference with the mapping of magnesium via the 1.369 Me V gamma ray from 24Mg(n,n(y)24Mg reactions.
Almost all elements can produce inelastic-scattering gamma rays from neutron interactions, the main exceptions being the very lightest elements like H and He that do not have gamma-ray-emitting excited levels. Some elements, such as those whose most abundant isotope is 'even-even' (i.e., even numbers of both protons and neutrons, like S6Pe), have a strong, dominant gamma ray made by neutron inelastic-scattering reactions. However, a few even-even nuclei, like 40Ca, and most other nuclei, like 27 AI, usually do not produce one dominant inelastic-scattering gamma ray but emit a number of gamma rays, all with relatively low probability. Inelastic-scattering gamma rays that are good for mapping various elements include 6.129 MeV for oxygen, 1.369 MeV for magnesium, 1.014 MeV for aluminum, 1.779 MeV for silicon, 3.737 MeV for calcium, and 0.847 and 1.238 MeV for iron.
A feature shown by a few of these nonelastic-scattering gamma rays is that they are produced with a spread of energies due to Doppler broadening. An example of a Doppler-broadened gamma ray is the 4.438 MeV gamma from 12C, which is emitted from the excited 12C nucleus while that nucleus is still recoiling from the

GAMMA-RAY SPECTROMETER SUITE 45
reaction that made it (cf., Bruckner et al., 1987). Experimental simulations (e.g., Bruckner et al., 1992) show that martian-surface gamma rays emitted from excited levels with life-times greater than'" 0.5 ps should not be broadened. Many gamma rays from aluminum (e.g., many of those above 2 MeV) and most gamma rays from oxygen (the main exceptions being the gamma rays at 6.129 and 3.853 MeV) are Doppler broadened. Most inelastic-scattering gamma rays produced in the martian atmosphere are Doppler broadened, due to the longer time required for the recoiling nucleus to slow down. This feature will help to distinguish them from the narrow gamma-ray lines from the same reactions in the martian surface (Reedy, 1988).
The calculation of the fluxes of nonelastic-scattering gamma rays require knowledge of cross sections for their production over a range of energies (cf., Reedy, 1978) that extend from threshold to many tens or even hundreds of Me V. The energy flux and spectra of GCR particles, and the neutrons that they produce, also need to be known (cf., Masarik and Reedy, 1996). The improved thermalization of the neutrons in a hydrogen-rich environment is accompanied by a slight decrease in the flux of neutrons with energies of a few MeV. Por example, in a soil with 5% water, the flux of inelastic-scattering gamma rays will decrease about 20% relative to the case with no water (Lapides, 1981). Semi-empirical models (Reedy et al., 1973) or neutron-transport codes (Lapides, 1981; Evans and Squyres, 1987; Dagge et al., 1991; Masarik and Reedy, 1996) have been used to calculate the fluxes of inelastic-scattering gamma rays that escape from a planet. Some experiments (e.g., Bruckner et al., 1987; Metzger et al., 1986b; BrUckner et al., 1992) have simulated the production of gamma rays.
2.2.3. Neutron-capture-produced gamma rays Besides the decay of naturally radioactive elements and neutron inelastic-scattering reactions, the other major source of gamma rays used for elemental mapping is from neutron capture. Many elements have high cross sections for capture of neutrons at thermal energies. In most cases after the low-energy neutron is absorbed, one or more gamma rays are emitted. Por example, titanium in the Moon was mapped by the 48Ti(n,(y)49Ti reaction, using mainly the 6.418 and 6.760 MeV gamma rays and iron was mapped using the 7.631 and 7.646 MeV gamma rays from neutron-capture reactions with 56Pe. The elements best mapped by the neutroncapture gamma rays have high cross sections for the capture of a thermal neutron and have one or more gamma rays emitted in high yields. In Mars, such elements include chlorine at 6.111 Me V and hydrogen at 2.223 MeV. Gadolinium, on the other hand, has a very high cross section for neutron capture, but no gamma ray is emitted with a high yield, making the detection of Gd by neutron-capture gamma rays difficult.
The fluxes of neutron-capture gamma rays are harder to predict, because many elements with high neutron-capture cross sections can affect the thermalization and transport of neutrons. Por example, when only 0.1 % hydrogen is present, the flux of thermal neutrons is considerably increased and the peak of the depth-versus-

46 w. V. BOYNTON ET AL.
flux distribution is moved significantly closer to the surface than when hydrogen is absent (e.g., Drake et al., 1988; Feldman et aI., 1989). Neutron-transport codes are used to calculate the distribution of low-energy neutrons in a surface with a given composition (or in layers with different compositions) (e.g., Lingenfelter et aI., 1972; Lapides, 1981; Evans and Squyres, 1987; Drake et al., 1988; Dagge et al., 1991; Masarik and Reedy, 1996). Because these differences in the flux of thermal neutrons affect all elements analyzed via neutron capture equally, the ratio of elements is much less sensitive to composition than absolute abundances. These elemental ratios can be normalized to absolute abundances by comparison of the abundances of Fe and Si determined via gamma rays made by both thermal capture and inelastic scattering reactions. These elements produce high fluxes of gamma rays by both processes. In the case of the Mars Odyssey investigation, however, we will be able to calculate the neutron fluxes on the surface directly from the measurements of thermal and fast neutron fluxes at the spacecraft, which will help to recover the absolute abundances directly.
2.3. TRANSPORT OF GAMMA RAYS
In addition to the rate at which gamma rays are produced, their transport from their sources to the detector must be considered. Gamma rays can be scattered by interaction with other atoms, losing energy in the process. These scattered gamma rays add to the continuum at lower energies in the spectrum and decrease the signalto-noise ratio for the discrete lines and are generally not useful for the quantitative analysis of Mars composition. In some special cases, however, this continuum can be used to study or confirm compositional variations among measured spectra (Thakur, 1997). The exponential attenuation coefficients for gamma rays range from about 0.125 cm2/g at 0.2 MeV to 0.063 cm2/g at 1.0 MeV to 0.024 cm2/g at 10 MeV. Gamma rays escaping into space without undergoing an energy-loss interaction, therefore come from depths of several tens of g/cm2 .
For the gamma-ray detector on Mars Odyssey, which is roughly equally sensitive to gamma rays incident from all directions, the planet from horizon to horizon is the source of gamma rays detected. For a planet with no atmosphere, the spatial resolution of an orbiting gamma-ray spectrometer varies slightly with the type of reaction producing the gamma ray as different types of reactions produce gamma rays with different depth distributions (Reedy et al., 1973). The radius of the spatialresolution circle below an orbiting gamma-ray spectrometer is approximately one half of its altitude above the planet's surface (Figure 1).
An atmosphere will attenuate and collimate gamma rays that escape from the planet's surface, especially the low-energy gamma rays. The Earth's atmosphere is too thick (1000 g/cm2) for surface gamma rays to penetrate, but the ~ IS g/cm2 thick martian atmosphere transmits a significant fraction of surface gamma rays (cf., Masarik and Reedy, 1996). The transmission of gamma rays passing through the atmosphere normal to the martian surface is about 25% at 0.5 MeV and about

GAMMA-RAY SPECTROMETER SUITE 47
100
-e- U - 609.3 keY -t:t- K -1460.8 keY ~ 0 - 6129.4 keY
80
50%
90%
20
0'T--_,r---.---,----r--~--_,----r_--._--._--_r--_,--_,
o 50 100 150 200 250 JOO 350 400 450 500 550 600 ~istance lrom Nadir (km)
Figure 1. Signal intensity as a function of distance from the sub-spacecraft point (nadir) for three different gamma-ray energies. The signal increases with distance from nadir because the area of each annulus gets bigger, but it then drops off due to attenuation through greater path length through the regolith and atmosphere. The distance is indicated inside of which 50% of the signal is collected. This diagram is generated for a nominal Mars atmospheric thickness of 15 g/cm2 . At low elevations on Mars, where there is a thicker atmosphere, the spot size is smaller, and at higher elevations it is greater.
65% at 5 MeV. The average atmospheric transmission from all points on the Martian surface to the Mars Odyssey GRS at 400 km altitude, however, drops to about 7% at 0.5 MeV and 30% at 8 MeV because most of these gamma rays travel through more atmosphere. Since the gamma rays from near the horizon are most attenuated by the atmosphere, the spatial resolution for martian surface features is improved compared to the case of no atmosphere, and the amount of improvement is greatest for low energies and low orbits (Metzger and Arnold, 1970).
2.3.1. Gamma-ray inteiferences There are some interferences with the gamma rays used to map elements in a planetary surface with other sources of the same gamma rays or gamma rays with energies similar enough that they will be difficult to separate in the analyses of gamma-ray spectra. For example, as noted above, the 1.369 Me V gamma ray from the 24Mg(n,n(y)24Mg reaction will also be made by reactions with aluminum and silicon. The relative contributions from these other elements need to be known to get the component due only to magnesium. Another inelastic-scattering gamma ray that is produced in significant fluxes by other nonelastic-scattering reactions is the

48 W. Y. BOYNTON ET AL.
4.438 MeV gamma ray from 12C, which is readily made by the 160(n,na(y)12C reaction (Reedy, 1978). Inelastic-scattering gamma rays for minor elements will often be overwhelmed by nonelastic-scattering gamma rays from major elements slightly higher in atomic mass and atomic number, such as the 1.434 MeV gamma ray in 52Cr made from iron (cf., Reedy, 1978). For most minor elements, like chromium, neutron-capture reactions are best (such as its capture gamma ray at 8.885 Me V), as interferences are much less likely.
In a gamma-ray spectrometer with high energy resolution, such as that on the Mars Odyssey, the probabilities of spectral peak overlap are fairly rare, the 6.4 I 96 MeV neutron-capture gamma ray from 40Ca and the 6.4 I 84 MeV one from 48Ti being such a case. A more serious interference is from gamma rays produced in the gamma sensor head or the material surrounding it. For example, titanium and magnesium were used in the construction of the gamma sensor head and they will produce a significant flux of gamma rays that will significantly interfere with our ability to map these elements in the martian surface. These locally-produced gamma rays and ways to reduce or correct for such interferences from the instrument or spacecraft are discussed in Arnold et al. (1989). Backgrounds observed in the Mars Observer GRS during the cruise to Mars are presented in Boynton et al. (1998). Another source of background is from the energy deposited by charged cosmic-ray particles in the active region of the GRS (e.g., Evans et at., 1998).
3. GRS Instrumentation
The GRS instrument suite consists of four components: the gamma sensor head (GSH), the neutron spectrometer sensor (NS), the high-energy neutron detector (HEND), and the central electronics box (CEB). The GSH is separated from the spacecraft by a 6-m boom, which was extended several months after the spacecraft entered the mapping orbit at Mars in order to minimize the spacecraft contribution to the gamma ray signal. The CEB houses the electronics for the gamma subsystem (GS), the NS, and various interface, power distribution, housekeeping and command and data-handling electronics. The HEND has its electronics contained in its sensor package but uses the CEB for command and control and as an electronic and data interface.
3. I. GAMMA SENSOR HEAD
A drawing of the GSH is shown in Figure 2. Its major components are the Ge detector assembly, the two-stage cooler subsystem, the door, and the Gamma Pulse Amplifier (GPA). It differs from the Mars Observer design in several important ways. First it uses a two-stage cooler versus the single-stage v-groove cooler of the Mars Observer instrument. Second the neutron subsystems are not an integral part of the sensor head as they were on Mars Observer. The neutron detector on

Detector Housing
GAMMA-RAY SPECTROMETER SUITE
-_.c~r.., ___ Boom Tip Plate
Figure 2. Drawing of the GRS gamma sensor head.
49
Mars Observer was incorporated as part of the anti-coincidence shield, which was designed to reduce the background due to charged particles. This charged-particlerejection feature is not part ofthe Mars Odyssey GRS; it was removed as the result of a trade favoring greatly improved cooler performance. which yields greatly increased resistance to resolution degradation due to radiation damage (discussed below).
The solid-state detector is a large single crystal of n-type ultrahigh-purity germanium (HPGe), about 6.7 cm in diameter and 6.7 cm long, with semiconductor electrodes implanted or diffused such that the crystal becomes a diode, i.e. it will pass current in only one direction. The diode is operated in the reverse-bias mode with a potential of about 3000 V and a leakage current of less than 1 nA. The detector must be operated cold, less than about 140 K, to maintain high resolution and a low leakage current.
When a gamma ray interacts with the detector, hole-electron pairs are created that are quickly swept to the appropriate electrodes. This small charge is collected by a sensitive preamplifier, which produces a pulse whose height (voltage) is proportional to the energy deposited in the crystal. This pulse is then shaped and amplified and passed to a pulse-height analyzer, which counts the events in the form of a histogram sorted according to energy.
In the laboratory, HPGe detectors are generally operated near the boiling point of liquid nitrogen, 77 K; but in space it is difficult to attain this temperature, and the detector must be operated somewhat warmer. As mentioned above, detectors can normally operate at temperatures up to 140 K with little loss of energy resolution, but when they have been exposed to the radiation equivalent to about a one-year exposure in space, they need to be operated at 100 K or less (Bruckner et al., 1990). If they are irradiated with a sufficiently high dose of energetic particles, such as neutrons or protons, HPGe detectors will have their resolution degraded. During

50 W. Y. BOYNTON ET AL.
the mission the detector will be exposed to cosmic radiation for at least 5 years. As a result, the energy resolution of the detector will degrade to such a degree that it is substantially compromised for further measurements.
Bruckner et al. (1991) incrementally exposed several large-volume n-type highpurity germanium detectors to a particle ftuence of up to 108 protons/cm2 (proton energy = 1.5 Ge V) to induce radiation damage. The detectors were held at operating temperatures of 89, 100, and 120 K to cover temperature ranges expected for the mission. They found that the resolution degradation was correlated with higher operating temperature. In addition, the peak shapes in the recorded gamma ray spectra showed a significant change from a Gaussian shape to a broad complex structure. After a proton ftuence equivalent to an exposure of I year in space, only the detector that was held at 89 K showed an energy resolution less than 3 ke V; all other detectors had resolutions near or above 6 ke V, a performance that is marginal for high-resolution spectroscopy (Bruckner et al., 1990).
The radiation damage can be removed by heating the germanium crystal to temperatures of the order of 345 K for several days. The GS detector will operate at about 85 K, and thus, based on the above data, we expect to anneal it with onboard heaters about every two years based on normal GCR ftuxes. Any increased ftuence due to a coronal mass ejection (CME), however, could require us to anneal the detector more often.
3.2. NEUTRON SPECTROMETER DETECTOR
The Mars Odyssey NS detector consists of a cubical block of boron-loaded plastic scintillator. It is segmented into four prism-shaped quadrants as shown in Figure 3. The prism segments are optically isolated from one another, and each is viewed by a separate 3.8-cm diameter photomultiplier tube (PMT). Both ends of the scintillator assembly are covered with a 0.069-cm thick sheet of cadmium to shield the ends of all prisms from thermal neutrons coming from those directions. In addition, the downward looking prism (N) has its downward looking face covered by an identical cadmium sheet so that it only responds to neutrons having energies larger than about 0.4 eV, which corresponds to the epithermal and fast neutron energy ranges.
Neutrons lose energy in the neutron detector through multiple elastic scattering collisions with the hydrogen and carbon nuclei that comprise the scintillator. Most of the energy is lost to proton recoils because protons and neutrons have close to the same mass and the cross section for (n,p) scattering is about four times larger than that for (n, 12C) at low energies. As the recoil protons slow down in the scintillator, they produce multiple ion-electron pairs that eventually recombine to produce photons. Collection of these photons by the PMTs produces pulses of charge that are then amplified and digitized by the neutron detector analog electronics to generate histograms. If the neutrons deposit all of their energy in the scintillator, they will eventually be captured by a lOB nucleus to produce a second

GAMMA-RAY SPECTROMETER SUITE
y
- 3.9 [100mm)
2.'I"m~ l "J~
PMT
1f
MARS
~
r 3.9 [100mm) 1
CJ BC454 Prism .Element
MARS
Scintillator Orientations
51
Figure 3. Drawing of the GRS neutron spectrometer sensor head showing two of the four BC454 prisms in cross section with their associated photomultiplier tubes (PMT). The four NS prisms are oriented with their faces viewing nadir (N), the direction of spacecraft velocity (+ V), zenith (Z), and the direction opposite to spacecraft velocity (-V). A schematic of the interaction of neutrons and gamma rays with the boron-loaded plastic is also indicated.
pulse in the electronics. Although the Q-value of the IOB(n,a fLi reaction is about 2.8 MeV; 478 keY of this energy goes to the gamma-ray de-excitation of the first excited state of 7Li, which is populated 94% of the time in this reaction, and the remaining 2.3 MeV is split between the a and 7Li recoils. Because of a pulse-height defect in the plastic scintillator, the recoil energy appears like a 93-ke V electron. The sequence of events just described, is shown schematically in the upper part of Figure 3.
The signature of a thermal or epithermal neutron in the scintillator, is therefore a single pulse that has an amplitude that is characteristic of the IOB(n,a fLi reaction. A histogram showing the response of one of the prisms to thermal neutrons measured before launch at Los Alamos National Laboratory, is shown in Figure 4. The single peak centered in channel 8 reflects the detection of the charged particle

52 w. Y. BOYNTON ET AL.
a) Big Pile, 270, (NCd- Cd), 7Spec
1 10'
910' ~
:0 u ,:,
610' U ~ v E VI 410' -c Q:. VI
E ;j 210' 0 U
0 --0 10 20 30 40 SO 60 70
Channel
b) Big Pile, 270, (NCd- Cd), 7Spec
SOOO • T Y 1 '-. , r~--' 'I • Iii I i 1"1
4000
~ U
I
"0 3000 U ~ v E 2000 VI (\ r--c I' "1
Cl.. r</V 'V'/"~' \ VI
E 1000 ;j 0 U , I
a l~ \. "'.-
-1000 -.&.- 1, .A..J i · I I I I I I I I I I I I I I I I I I I ,---'
0 10 20 30 40 SO 60 70
Channel
Figure 4. Histogram of NS photomultiplier tube output due to neutron interaction with one of the prisms. 4a. The peak is from the detection of the charged particle recoils from the IOB(n,a)7Li reaction. 4b. The plateau at higher energies seen in this expanded scale is due to detection of both the charged particle recoil energy and energy lost by the 478 keY gamma ray from the 7Li excited state.

U)
"E :::::J o
1000
o 100
10 a
GAMMA-RAY SPECTROMETER SUITE 53
Counts - - - Lat~-T im~ Fit --TTSP - C hanc~ Coinc. -- Expon~ntia l Fit
. , .. .. . .. .,. ..
III _ .. <.. I
.. \ .. ,. III III III III
-. III .. III:. • I .. III ...... III.. III III.. III
"III ......... :.: ' ..... pl I ...... III: _ __ .----._ ...... _ .. .....J _ _ .:-:_ ....... _.
...... III.. III" _ .,.:..... ~ .... .... .. .. • I . .. - .
S 10 1S 20 2S
e to Second Pulse, Microseconds Figure 5. A time-to-second-pulse histogram using an AmB fast-neutron source. The counts show initially show an exponential decay followed by a constant count rate due to chance coincidences. The coincident rate is determined from the late counts and yield the horizontal dashed line. The raw counts are corrected for the chance coincidences by subtraction, yielding the points connected by the thin solid line. These corrected points are then fit by an exponential curve with an exponentiation time of ;0;:; 2 f-LS.
recoils alone (Figure 4a), and the broad plateau in the expanded-ordinate scale (Figure 4b) reflects the coincident detection of both the charged-particle recoil and the Compton interaction of the 478 keY gamma ray from 7Li* in the same prism.
The signature of a fast neutron that has lost all of its energy in the scintillator is a time-correlated double pulse. The amplitude of the first pulse provides a measure of the energy of the neutron and that of the second pulse is the same as that for a thermal or epithermal neutron as shown in Figure 4. The time-to-secondpulse histogram for a calibration run using an AmB fast-neutron source at Los Alamos before launch is shown in Figure 5. The measured counts spectrum shows a constant counting rate at late times and a sharp upturn at early times, times less than about 8 fLS after detection of a first interaction. The late-time portion of the spectrum reflects chance coincidences and can be fit by a constant, shown by the horizontal dashed line. A constant chance-coincident counting rate is expected for the low total counting rate that was present during this calibration run. Subtraction of the chance-coincidence background from the early-time counting rates yields an exponential decay (Figure 5). It has an exponentiation time of "'-' 2 fLS, which is
54 w. V. BOYNTON ET AL.
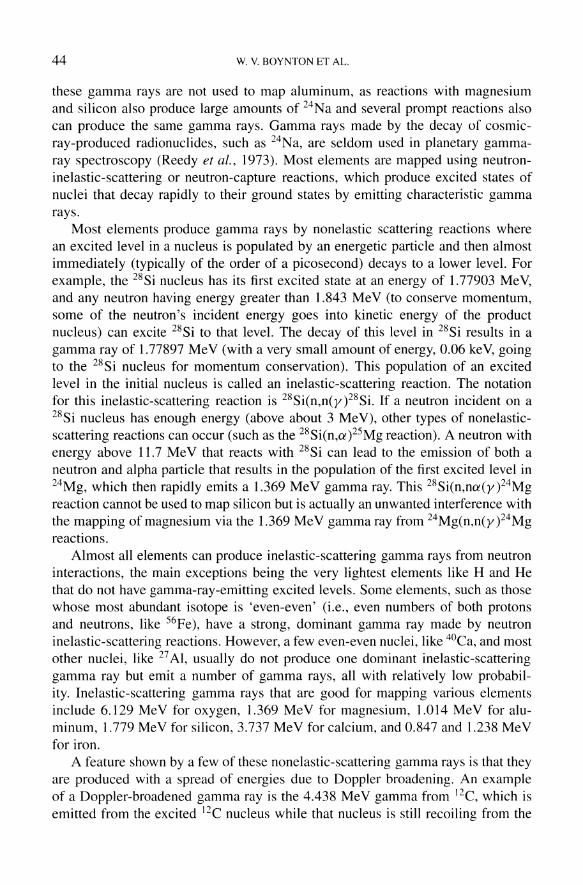
Figure 6. General view of HEND on engineering supports (the seale of ruler is in em).
expected for a plastic scintillator containing 5% natural boron by weight as used in the Mars Odyssey neutron spectrometer.
The orientation of the outward normals to each of the four prism elements of the neutron spectrometer relative to the spacecraft velocity vector will be fixed throughout the mapping orbit. One face will view forward, one will view backward, one views downward and one views upward. These orientations are shown in the inset diagram to the lower right in Figure 3. Separation of the thermal and epithermal components will be possible using the relative counting rates of the forward and backward-directed prisms and a Doppler-filter technique (Feldman and Drake, 1986). Such a separation is made possible by the fact that the Mars Odyssey spacecraft will travel faster (3.4 km S-I) than a thermal neutron (2.2 km S-I) while in mapping orbit. The forward directed prism will therefore scoop up thermal neutrons and the backward directed one will outrun them. The difference in counting rates between forward- and backward-directed faces thus yields a measure of the flux of thermal neutrons. A measure of epithermal neutrons is provided by the downward facing prism because it is completely shielded from the outside by sheets of cadmium and the other three prisms.
n o
GAMMA-RAY SPECTROMETER SUITE
Moderator
Screened
Can
Detector LND 2517
--- Moderator
IIWVV,JV.II ,/"/
Plug --Moderator
55
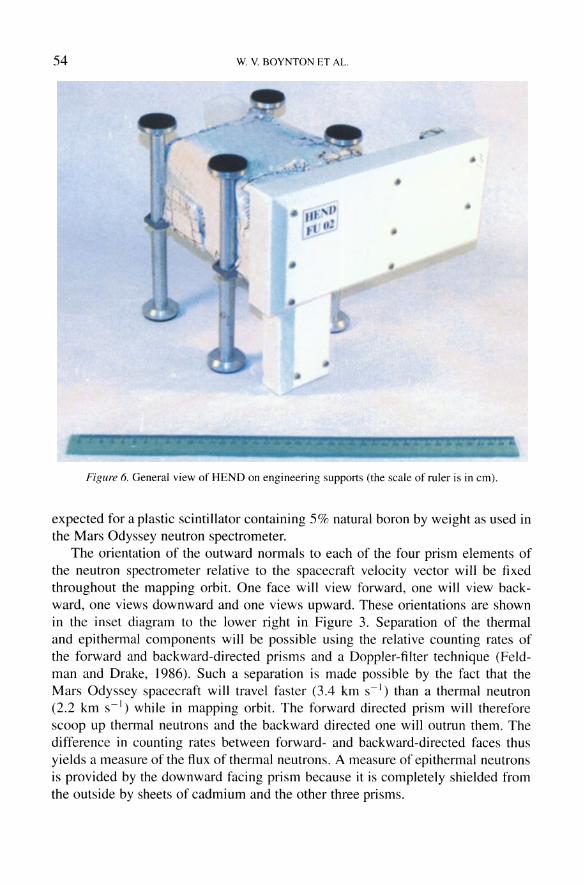
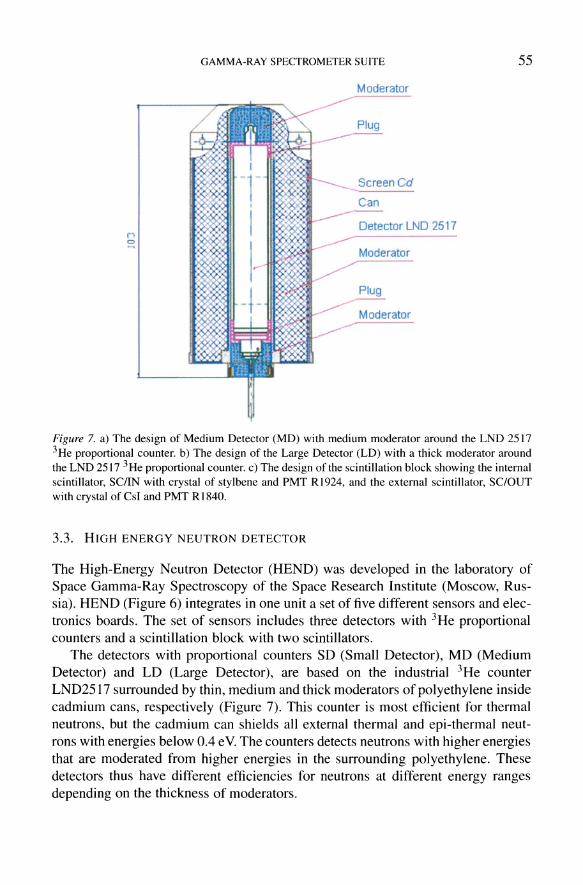
Figure 7. a) The design of Medium Detector (MD) with medium moderator around the LND 2517 3He proportional counter. b) The design of the Large Detector (LD) with a thick moderator around the LND 2517 3 He proportional counter. c) The design of the scintillation block showing the internal scintillator, SC/IN with crystal of stylbene and PMT R 1924, and the external scintillator, SC/OUT with crystal of CsI and PMT R 1840.
3.3. HIGH ENERGY NEUTRON DETECTOR
The High-Energy Neutron Detector (HEND) was developed in the laboratory of Space Gamma-Ray Spectroscopy of the Space Research Institute (Moscow, Russia). HEND (Figure 6) integrates in one unit a set of five different sensors and electronics boards. The set of sensors includes three detectors with 3He proportional counters and a scintillation block with two scintillators.
The detectors with proportional counters SD (Small Detector), MD (Medium Detector) and LD (Large Detector), are based on the industrial 3He counter LND2517 surrounded by thin, medium and thick moderators of polyethylene inside cadmium cans, respectively (Figure 7). This counter is most efficient for thermal neutrons, but the cadmium can shields all external thermal and epi-thermal neutrons with energies below 0.4 e V. The counters detects neutrons with higher energies that are moderated from higher energies in the surrounding polyethylene. These detectors thus have different efficiencies for neutrons at different energy ranges depending on the thickness of moderators.
56 W. Y. BOYNTON ET AL.
Moderator
Electronics board
Photomultiplier Rl840
Crystall Csi
Stylbene
Photomultiplier R 1924
Electronics board
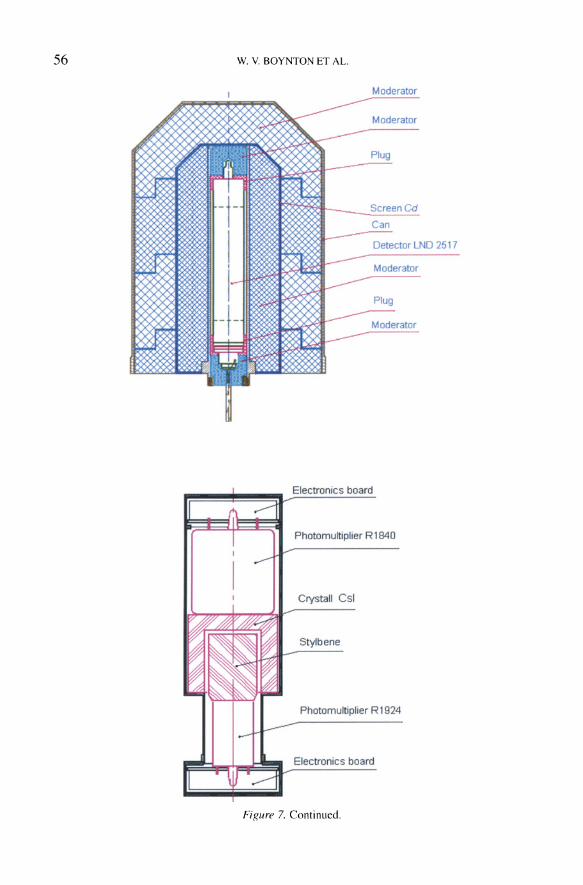
FiRure 7. Continued.
GAMMA-RAY SPECTROMETER SUITE 57
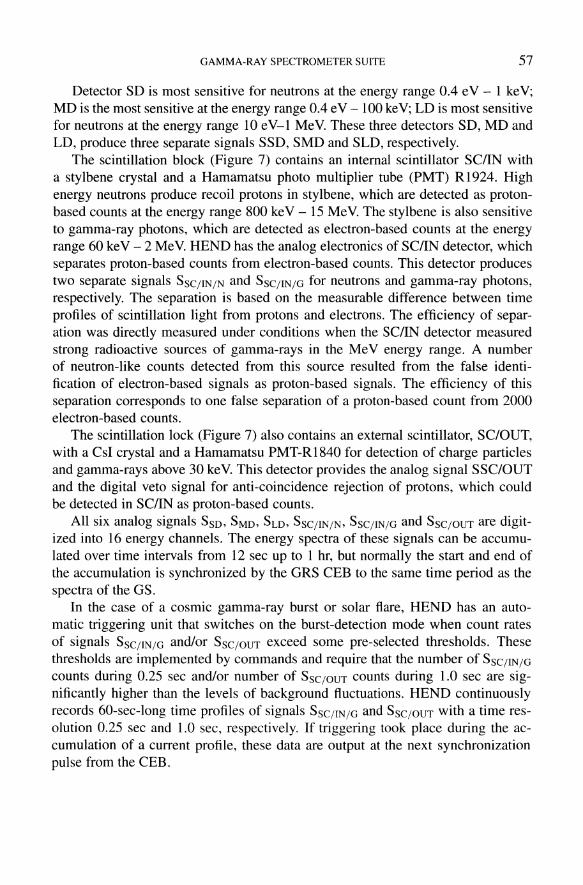
Detector SD is most sensitive for neutrons at the energy range 0.4 e V - I ke V; MD is the most sensitive at the energy range 0.4 e V-I 00 ke V; LD is most sensitive for neutrons at the energy range 10 eV-I MeV. These three detectors SD, MD and LD, produce three separate signals SSD, SMD and SLD, respectively.
The scintillation block (Figure 7) contains an internal scintillator SCIIN with a stylbene crystal and a Hamamatsu photo multiplier tube (PMT) Rl924. High energy neutrons produce recoil protons in stylbene, which are detected as protonbased counts at the energy range 800 keY - 15 MeV. The stylbene is also sensitive to gamma-ray photons, which are detected as electron-based counts at the energy range 60 keY - 2 MeV. HEND has the analog electronics of SCIIN detector, which separates proton-based counts from electron-based counts. This detector produces two separate signals SSC/IN/N and SSC;IN/G for neutrons and gamma-ray photons, respectively. The separation is based on the measurable difference between time profiles of scintillation light from protons and electrons. The efficiency of separation was directly measured under conditions when the SCIIN detector measured strong radioactive sources of gamma-rays in the Me V energy range. A number of neutron-like counts detected from this source resulted from the false identification of electron-based signals as proton-based signals. The efficiency of this separation corresponds to one false separation of a proton-based count from 2000 electron-based counts.
The scintillation lock (Figure 7) also contains an external scintillator, SC/OUT, with a CsI crystal and a Hamamatsu PMT-RI840 for detection of charge particles and gamma-rays above 30 ke V. This detector provides the analog signal SSC/OUT and the digital veto signal for anti-coincidence rejection of protons, which could be detected in SCIIN as proton-based counts.
All six analog signals SSD, SMD, SLD, SSC/IN/N, SSC/IN/G and SSC/OUT are digitized into 16 energy channels. The energy spectra of these signals can be accumulated over time intervals from 12 sec up to 1 hr, but normally the start and end of the accumulation is synchronized by the GRS CEB to the same time period as the spectra of the GS.
In the case of a cosmic gamma-ray burst or solar flare, HEND has an automatic triggering unit that switches on the burst-detection mode when count rates of signals SSC/IN/G and/or SSC/OUT exceed some pre-selected thresholds. These thresholds are implemented by commands and require that the number of SSC/IN/G counts during 0.25 sec and/or number of SSC/OUT counts during 1.0 sec are significantly higher than the levels of background fluctuations. HEND continuously records 60-sec-long time profiles of signals SSC/IN/G and SSC/OUT with a time resolution 0.25 sec and 1.0 sec, respectively. If triggering took place during the accumulation of a current profile, these data are output at the next synchronization pulse from the CEB.

58 w. V. BOYNTON ET AL.
/0 1000
~ .... ~ 0 :c
100 <J)
C ~ 0 ()
10
1000 2000 3000 4000 5000 6000 7000 8000 9000 10000 Energy (keV)
Figure 8. A GS spectrum of Mars taken from June 10 through July 16, 2002. Several emission lines are labeled with their energy in keV and the element responsible for the line. This shows our full-scale energy range of 10 MeV at our nominal gain setting. The continuum above about 8 MeV is due mostly to charged particle interactions in the detector. The broad continuum at lower energies is due mostly to scattered gamma rays that have lost a fraction of their energy. Scattering can occur in the regolith, the atmosphere, or the instrument itself. The line labeled e+ is due to one of the two 511-keV gamma rays that occur when positrons and electrons annihilate. Positrons are made in one of the processes by which high-energy gamma-rays can interact with matter. The high-energy lines in the spectrum occur in threes, with the lines separated by 511 keY. The lower-energy lines are due to the loss of one or both of the 511 ke V gamma rays made when a high-energy photon interacts with the detector via the pair production process.
3.4. THE CENTRAL ELECTRONICS BOX
The CEB contains all of the electronics associated with the GRS, except for the preamplifiers and the REND electronics. It contains the power supplies, the main amplifiers, the analog-to-digital converters (ADCs), the GS and NS pulse-height analyzers (PHAs), and the central processing units and memory. It is mounted inside the spacecraft on the bottom of the instrument deck. The GS and NS PHAs generate a spectrum by counting each photon that the detector sees. They contain ADCs that digitize the height of each pulse, generating a number that is proportional to the energy deposited in the detector. This number is then used as an address of a memory location, or channel, corresponding to that energy. The PHAs increment the value stored in that location and thus generate spectra that are histograms of the number of events in each energy channel. The GS, which has a large energy range and high spectral resolution, uses 16,384 channels to store its spectrum, and the NS uses only 16 channels. A sample spectrum taken shortly after arriving at Mars is shown in Figure 8.

GAMMA-RAY SPECTROMETER SUITE
TABLE I
Significant GRS events in mission timeline.
Operation
GRS power on
NS and REND data collection
GS door open, GS data collection
GS off due to coronal mass ejection
GS door close for MOl
GRS power off for MOl
Begin
25-Apr-200l
2-May-2001
27-Jun-2001
16-Aug-200l
31-Aug-2001
24-Sep-200l
End
17-Aug-2001
GRS post-aerobreaking chek out 14-Jan-2002
Spacecraft in mapping configuration 19-Feb-2002
GS door open, GS data collection 20-Feb-2002
GS warm anneal at 323 K
GS warmer anneal at 345 K
GS door close for boom erection
GS door open, GS data collection
8-Mar-2002 22-Mar-2002
6-May-2002 21-May-2002
I-Jun-2002
6-Jun-2002
59
The GS also has several counters that are used to monitor count rates in several energy bands. One is defined by the lower-level discriminator (LLD), which is setable in the range from 0 to 1000 ke V and is used to determine which events are to be digitized by the ADC. There is also an upper-level discriminator (ULD), which has an energy range from I to 24 Me V and determines the maximum energy that the ADC will digitize. By setting the LLD and ULD to appropriate values, the ADC will not waste time digitizing low-energy noise or high-energy gamma-rays that would be off scale. Three other discriminators define energy windows, E2-EI, E3-E2, and >E3, that are used to define energy bands for triggering on gammaray bursts. When the count rate in any of these energy windows exceed a setable number of standard deviations above the mean value, the GS will switch into burst mode and return count-rate data in these windows with a time resolution setable from 10 to 64 msec.
The CEB also collects a variety of engineering data from the NS and GS. These include temperatures, voltages, currents and a variety of status bits. The temperature data of some of the GS subsystems are very important, as they are used to correct the data for temperature drift as discussed in the next section.

60 W. Y. BOYNTON ET AL.
4. Mission Operations and Data Analysis
4.1. MISSION OPERATIONS
The Mars Odyssey Mission is described elsewhere (Saunders et al., 2004). Just the events as they relate to the GRS will be discussed here. Table I provides a time line of significant events during cruise and early mapping. At 18 days into cruise, the GRS was powered on (CEB only), and the three instrument subsystems were powered on and data collection was begun 7 days later. At this time the gamma detector was still warm, so no gamma data was returned. On day 79 the door on the GSH was opened allowing the sensor to cool. After two days the detector had cooled sufficiently that the high voltage could be applied and GS data collection began. The instrument was turned off twice during cruise for spacecraft operation testing. At one point late in cruise the GS shut down autonomously, as intended, due to a high-current condition caused by a coronal mass-ejection (CME) event. The instrument is designed to remove the high-voltage bias on the detector if the ground-selectable setpoints on the detector temperature or current are exceeded. The bias was reapplied two days later and data collection resumed. At 55 days before arrival at Mars, the high voltage to the GSH was removed and its door was closed, so the spacecraft team did not have to be concerned about its closure in the final stages of preparation for Mars orbit insertion (MOl). Finally, at 30 days before arrival, the entire instrument suite was powered down until after MOL
The mapping phase began on Feb 19, 2002. We turned on the GRS and began to collect data from HEND and NS during instrument check out 36 days earlier. We opened the GS door one day earlier and began to collect gamma data until one day after mapping had begun. We found the resolution of the GS detector had suffered badly due to a very large CME event that occurred after we shut down in preparation for MOL We annealed the detector twice, first at a modest temperature of 323 K, and later, in preparation for boom deployment, we did it again at our maximum qualification temperature of 345 K. The first anneal was moderately effective at removing the radiation damage, but we still had significant degradation that we were able to remove with the higher-temperature anneal. The second anneal improved the resolution at 1461 keY from 5.0 keY (full width at half maxium) and 15.1 keY (full width at tenth maximum) to 3.9 and 11.1, respectively.
4.2. REDUCTION OF GS DATA
The purpose of the cruise data collection is both to check out instrument performance and to measure the spacecraft background. In addition, some cruise science can be performed with the detection of cosmic gamma-ray bursts and solar flares. The materials in the spacecraft can have a significant effect on the signal in both the neutron and the gamma sensors. The spacecraft provides mass with which the cosmic rays can interact to produce fast neutrons via the same spallation process that happens on Mars. There is only a modest amount of mass however, so many

GAMMA-RAY SPECTROMETER SUITE 61
neutrons escape without being moderated. There is a large amount of fuel in the spacecraft during cruise, and the hydrogen in it is very effective at moderating neutrons. The fuel, N2H2 , also has a large amount of nitrogen, which is a very effective absorber of neutrons. Consequently during cruise the thermal neutron flux measured near the spacecraft was very low (Feldman et aI., 2002b).
The elements in the spacecraft will also give off gamma rays via the same process described above for Mars itself. By being close to the spacecraft we can determine the signal from the spacecraft with greater sensitivity than its contribution in Mars orbit. On the other hand, because the thermal neutron excitation flux during cruise was so low, even with the greater sensitivity we could not detect any thermal neutron capture gamma rays except for a very weak one due to hydrogen. For the gamma lines formed via fast-neutron processes, the cruise data will be a good measure of the spacecraft background.
A thorough discussion of background subtraction is beyond the scope of this work. We make use of the extendable boom to measure the signal in orbit both before and after the boom extension, but this extension only partially helps us to make a background correction. The background is complicated by the fact that we also have a background contribution from the instrument construction materials, and obviously when we extend the boom, our sensor does not move away from this source of background. In addition, some elements provide such a small signal that we may not be able to detect them during the period before boom extension. Another means of determining the background that appears to work well for strong lines, is based on the signal over the winter poles. The polar regions in winter are covered by a thick CO2 frost that is opaque to gamma rays, so except for lines due to carbon and oxygen, we get a good measure of our background, including lines from the instrument, when we are over these regions.
Figure 8 shows a GS spectrum taken after boom deployment. It shows the characteristic sharp gamma-ray emission lines superimposed on a continuum. The lines reflect gamma rays from discrete nuclear transitions that pass un scattered to the detector through the intervening material. This material includes the regolith, the atmosphere and the materials used in the GSH itself. Most of the gamma rays will be Compton scattered on their way to the detector, which causes them to lose a fraction of their energy and thus they do not get counted as an event in the full-energy peak of the spectrum. Much of the continuum in the spectrum is produced by these scattered gamma rays. Owing to the finite energy resolution of the detector, the lines are recorded as peaks that are generally Gaussian in shape. The spectra are analyzed by determining the energy and the area of each peak of interest. The energy identifies the element responsible for the gamma ray emission, and the area above the continuum (number of counts) is proportional to the amount of that element in the surface. The determination of the proportionality constant that relates these counts in the spectrum to the concentration of the element is far from trivial, however.

62 w. V. BOYNTON ET AL.
The precise determination of the peak area in a gamma ray spectrum is important for the determination of element concentrations. There are a number of peakfitting routines, which perform a peak-area determination for laboratory gamma ray spectra. In prompt gamma ray spectrometry the spectral shape of the gamma-ray spectra is more complex, and certain peaks differ from the normal narrow Gaussian shape. Doppler broadening, caused by a rapid emission of a gamma ray from a fast-moving excited nucleus, is usually the reason for these oddly shaped peaks. In addition, build-up of radiation damage in the HPGe detector can give rise to an asymmetrical peak broadening.
The number of counts in a peak depends on the efficiency of the detector. The efficiency is the probability that a photon of a certain energy striking the detector will register a count in the peak corresponding to that photon energy. Typical values range from about 20% at 1 MeV to 1.5% at 10 MeV. The losses are due to gamma rays passing through the detector with no interaction or scattering inside the detector with only a partial energy deposition. The flux of photons entering the sensor then must be corrected for the attenuation from the intervening material, which includes the detector packaging hardware as well as the planetary atmosphere, and for the solid angle of the planet relative to the instrument.
By far the most difficult task is the calculation of the relationship between the concentration of the element and the gamma-ray flux at the surface from that element. This relationship depends on the succession of processes that are not measured directly but must be modeled or inferred from the measured gammaray spectra. Because the neutron flux is dependent on composition, models are first used to estimate the concentration, and model calculations are then made to determine the neutron and gamma spatial and energy distributions from which a revised composition can be calculated. An iterative process is then used to determine both the final elemental composition and the neutron flux.
4.3. SPATIAL RESOLUTION AND SENSITIVITIES
A key characteristic of the GRS data will be that individual spectra, typically acquired during "-' 20-s integration intervals, will have inadequate signal-to-noise ratio to be statistically significant. Instead, spectra taken at different times over the same region must be summed before spectral line intensities can be derived. It takes many hours of accumulated data to yield a spectrum that can be analyzed to return compositional results with reasonable uncertainty. As noted earlier, the diameter of a spatial resolution element (from which 50% of the signal is received) on the Martian surface is about 360 to 450 km depending on the gamma-ray energy (Figure 1). Table II shows the time available to measure gamma rays above one spatial resolution element for the complete 917 -day Mars Odyssey mission as a function of latitude. Due to the higher density of orbital trajectories at the poles, the time spent over a given resolution element at high latitudes (>80°) is about 50

GAMMA-RAY SPECTROMETER SUITE
TABLE II
Accumulation times in a 450-km GRS footprint over the course of the 917 -day Odyssey Mission.
Latitude Time
(deg) (hr)
80 51.0
70 24.8
60 16.9
50 13.1
40 10.9
30 9.7
20 8.9
10 8.5
0 8.4
63
hours per Mars year, while at the equator the available accumulation time is about 8 hours.
Table III gives the expected gamma-ray count rates for 13 elements. These results were calculated using the neutron and gamma ray transport codes used by Masarik and Reedy (1996) for the model composition given in the table. To first order, if different calculated count rates are needed for a different composition of Mars, the count rates will be proportional to the concentration of the element in question. For differences in concentration of elements like Fe, CI, and H that have a large effect on the neutron flux distribution, the count rates cannot simply be scaled to obtain new results as discussed above. Nevertheless, the observed count rates and the resulting accumulation times required to measure the concentration of an element to 10% uncertainty in Table III can be used to calculate approximate sensitivities and uncertainties for other compositions and counting times as long as the composition is not greatly different from that used in the model. The sensitivities scale inversely with the square root of the counting time, and for lines that are small compared to the background, inversely with the concentration.
In order to get adequate statistics, spectra taken at different times and places need to be added together. Because of the narrow peaks, a few ke V, relative to the full scale range of the spectrometer, 10,000 ke V, small drifts in the gain or offset of the spectrometer will result in shifts that are significant compared to the width of the peaks. We need to correct for this gain drift so that we do not get an artificial peak broadening due to the addition of spectra taken at slightly different gains. Because the'" 2-hr orbital temperature variations occur on a time scale rapid compared to that needed to determine peak positions that would permit a determ-

04 w. V. BOYNTON ET AL.
TABLE III
Calculated accumulation times required to achieve 10% percision.
Element Energy Mode Model Signal Continuum Time for 100/,
(keY) Composition (cis) (cis) precision (hr)
H 2223 Capture O.llo/c 0.0017 0.24 2400
0 6129 Inelastic 42.3% 0.0223 0.34 20
Mg 1369 Inelastic 5.2% 0.0124 0.37 70
Al 2210 Inelastic 4.2% 0.0029 0.24 820
Al 7724 Capture 4.2% 0.0008 0.25 12000
Si 1779 Inelastic 19.8% 0.0468 0.29 4
Si 3539 Capture 19.8% 0.0035 0.15 370
S 5424 Capture 2.7% 0.0021 0.37 2200
CI 6111 Capture 0.55% 0.0081 0.34 ISO
K 1461 Radioactive 0.51% 0.1074 0.35 I
Ca 1943 Capture 4.7% 0.0018 0.27 2300
Mn 7244 Capture 0.4% 0.0009 0.28 9100
Fe 847 Inelastic 17.3% 0.0268 0.59 24
Fe 7632 Capture 17.3% 0.0130 0.26 44
Th 2614 Radioactive 0.30 ppm 0.0037 0.20 430
U 1765 Radioactive 0.078 ppm 0.0011 0.30 6800
ination of the gain and offset, we make corrections based on the temperature of the different components in the signal chain and laboratory determined coefficients of gain and offset variations with temperature.
For all but the strongest emission lines, it will be necessary to sum spectra not only over a long time period, but over different footprints. For example, if one wanted to determine an element such as aluminum to a precision of 10%, Table III indicates about 1000 hours are needed. Table II indicates that near the equator we only expect to get about 8 hours of data in each 4S0-km GS footprint. Thus it is necessary to degrade the spatial resolution to sum together spectra taken over different footprint locations to improve the statistics. Figure 9 shows the effect on a portion of the spectrum by increasing the accumulation time. In some cases the resolution can simply be degraded to a regular grid, e.g. 20-degree squares, or we can define larger regions, such as the highlands and the lowlands, based on other criteria and generate an average composition for those independently-defined regions.
Spectra that are collected over a large region, however, are more difficult to analyze, since the counts in the peaks depend on the thickness of the atmosphere, which attenuates the gamma rays, and the abundances of other elements that can

GAMMA-RAY SPECTROMETER SUITE 65
'" § 8
1400 1500 1600 1700 1800 1900 2000 2100 2200 2300 Energy (keV)
Figure 9. An expanded portion of the full-Mars GS spectrum shown in Figure 8 with a similar spectrum but with a much shorter accumulation time. The nature of the peak shapes can be seen; the area of the peak above the continuum is proportional to the concentration of the element responsible for the gamma-ray emission. The short-duration spectrum, collected for 12 hours, is what is expected for a 450-km footprint at middle latitudes. The uranium line is barely detectable in this spectrum, which shows the importance of being able to sum spectra together over larger regions to improve statistics for weak peaks.
moderate or absorb the neutrons. The surface composition will vary from place to place, and the atmospheric thickness will vary over both space and time based on elevation and season. It is thus difficult to solve the inverse problem of calculating the average composition based on the counts in the spectrum. Instead, we calculate the expected counts in the spectrum based on individual spatial elements, each having its own composition and atmospheric thickness, the latter including its time variation. The problem will be solved by iteration of the composition. Because the sensitivity is only weakly dependent on composition of other elements, we expect the solution to converge easily.
This method of forward calculation is required, as we already know that hydrogen is not uniformly distributed over the surface (Boynton et al., 2002; Feldman et at., 2002a; Mitrofanov et at., 2002) having a much greater concentration near the poles and in some regions near the equator. As mentioned above, hydrogen has a very strong effect on neutron flux and this effect cannot be neglected.

66 W. Y. BOYNTON ET AL.
4.4. REDUCTION OF NS NEUTRON DATA
The primary information needed from the NS to infer the hydrogen content and its stratigraphy in near-surface layers, or the thickness of carbon dioxide frost that covers the polar caps during winter is the amplitudes of thermal and epithermal fluxes that leak upward from Mars. Of course a more thorough determination of the reservoirs of martian volatiles and their stratigraphy requires a combined analysis of the 2.223 MeV hydrogen neutron capture line with the thermal and epithermal neutron counting rates as was done by Boynton et al. (2002) for the south polar region of Mars. Although possible for some types of neutron detectors, these amplitudes cannot be determined directly from the measured count rates of individual prism faces of NS. They can, however, be derived by combining the data from different faces as outlined below. A more complete description is given by Feldman et al. (1993b, 2002b).
4.4.1. Expected background and foreground count rates The first stage of reduction involves a determination of counts that result from neutron capture by the boron contained in the scintillator prisms of the NS sensor. The spectrum of light output from the prisms resulting from background interactions is expected to be a broad continuum, dominated at low amplitudes by gamma rays and at high amplitudes by penetrating charged particles. In contrast, the spectrum resulting from low-energy neutron absorption will be peaked because of the high energy of the emitted a particle in the IOB(n, a) 7Li reaction relative to the energy of the absorbed neutron. An example of such a spectrum measured at Los Alamos National Laboratory using the flight detector is shown in Figure 4a. The peaked nature of this spectrum allows separation of neutron counts from background counts in spectra measured in Mars orbit through use of the measured calibration spectrum in Figure 4a and a least squares fitting routine. Whereas the background counts under the portion of the neutron peak that will be used in the fit is estimated to be about 5 S-l , that due to planetary neutrons is estimated to range between 1 S-l and 10 S-l. The large range of estimated neutron count rates reflect different surface chemistries as well as differences in the orientation of the trapezoid faces; for example, the backward-looking face outruns thermal neutrons and so will register the fewest planetary neutron counts.
4.4.2. Adjustment for sutface area response functions Because the separate prisms of the NS have different orientations relative to the velocity vector of the Mars Odyssey spacecraft, they respond preferentially to neutrons evolving from different surface areas of Mars. This effect is shown for the forward and backward-facing prisms in Figure 10. Inspection shows that the response function of the forward-facing prism is offset from the nadir point in the direction of the velocity vector and that of the backward-facing prism is offset in the opposite direction. Thus the next step in the neutron data reduction chain must
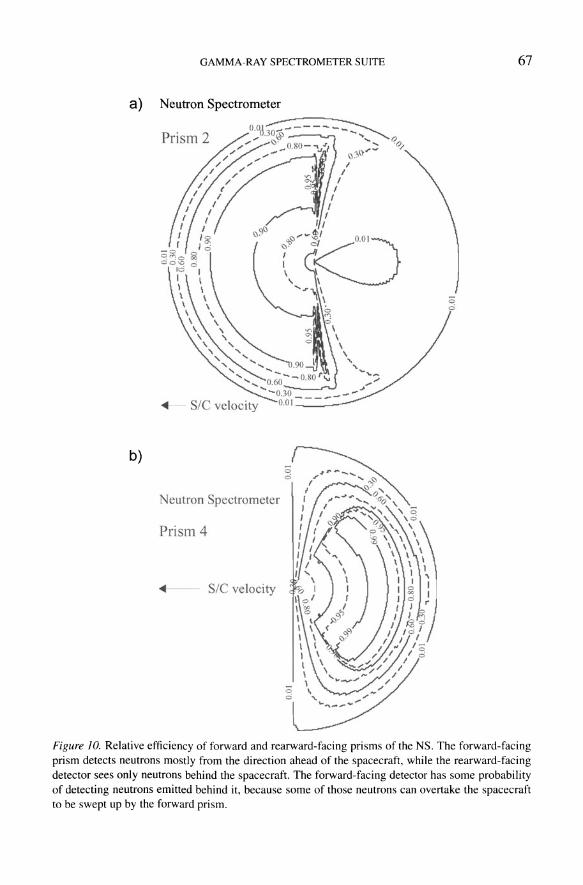
GAMMA-RAY SPECTROMETER SUITE
a) Neutron Spectrometer
<111 - SIC velocity
b)
Neutron Spectrometer
Prism 4
I velocity
;:; .,;
67
Figure 10. Relative efficiency of forward and rearward-facing prisms of the NS. The forward-facing prism detects neutrons mostly from the direction ahead of the spacecraft, while the rearward-facing detector sees only neutrons behind the spacecraft. The forward-facing detector has some probability of detecting neutrons emitted behind it, because some of those neutrons can overtake the spacecraft to be swept up by the forward prism.

68 W. Y. BOYNTON ET AL.
a) --Y= 76.614 *x"(-14578) R= 0.99692
10
8 f ! ·.··.-----t,.-.- ·-···-'·----·'T'· .. ·'---··'···-·'·-~ .. "··· .. ·'·'···· .. ·'·'·'i .. '······· .. ·,· .. _···,,··; ... ·_······,· .. ···_·I ..... ····-....... -.~"
I 6 .... _._. ---... --~ , . ··········_--... ·--r-.--·--_._··· .... ··I ..... ··.··._.·.-0 .. --·-f
4 . .
·······-t--····----·--···-·i .. ·· ·-·-··-·--·-·--·I'.·--·~···-· ········I' .. _·······_··········t, -'--" -,--, .,'.
l l
i ~ -... ---.-.. -.--.! ........•. -.-..•.... -.-.~.--.•. --.,-......... j., ..• _ ..••.• __ •••. , ~ ! 2
o o 10 20 30 40 50 60 70
Channel Figure 11. NS spectra of Mars showing how the net thermal neutron counts are removed from the continuum. (a) prism I, nadir direction. (b) prism 2, velocity direction. (c) prism 3, zenith direction. (d) prism 4, anti-velocity direction.
be to rearrange the neutron counts measured by each of the sensor prisms during successive pixel intervals to fill the portions of the Martian surface overlain by their respective surface response functions.
A preliminary analysis of the response function of the Neutron Spectrometer and the angular emission of neutrons from the top of the Martian atmosphere shows that the size of the surface response functions, about 600 km full width at half maximum, is comparable to the sizes of the Martian polar caps. Because photomosaic maps of Mars from Viking show many other regional features that have sizes of this scale or smaller, we expect that neutron count rates may vary significantly as a function of orbital location. Variations in measured count rates will therefore not reflect actual variations in leakage neutron fluxes but will appear more muted. Inversion of the raw rates to obtain thermal and epithermal amplitudes using an algorithm based on simulations of a globally uniform chemistry will therefore incorrectly identify these amplitudes. A specific example of this effect, tailored to the measured configuration of the south polar cap of Mars, was presented by Feldman et al. (1993a). Minimization of errors therefore requires a deconvolution
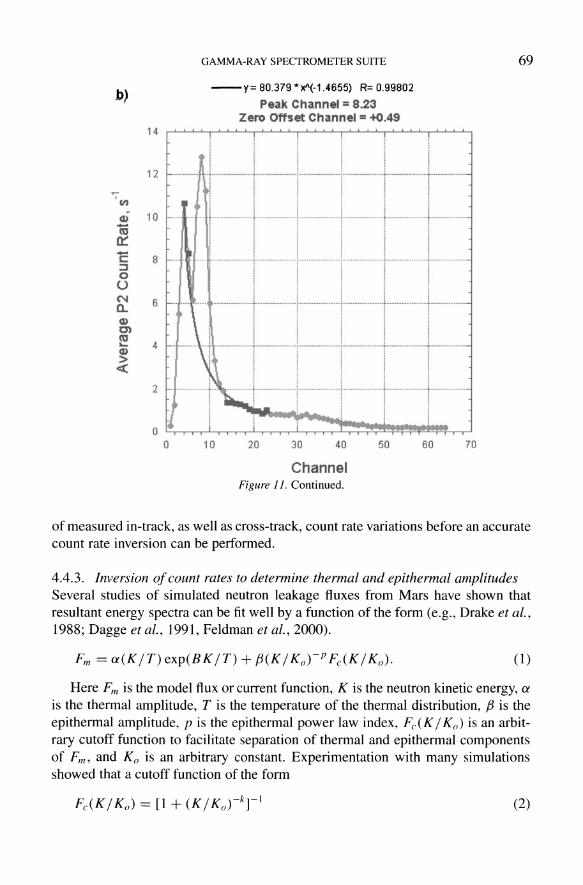
b)
«;-III
<l) -m a:: -c: :::J 0 U C\I 0.. Q) C'I m ~
Q)
> «
14
12
10
B
6
4
2
GAMMA-RAY SPECTROMETER SUITE
--y= BO.379 "x"(-1.4655) R= 0.99B02
Peak Channel = 8.23 Zero Offset Channel = +0.49
I ! i ! i
! i
! . ! i , ! ., •• M.MM.... ,·j·····,················ .. j··········_··········-i·········_·_···_-·····r······_·_·_·--·'r-············_· .. ·····r····--·,······· .. ···
! f I i j J
..... , .. , , ... I. .............. u ...... .l .......... u •••• _ ...... ' ... _.H ....... __ ...... 1-...................... 1 ........................ 1 ........... ,., ...... . i j i i . .
Ii! I ! I I i I I , -.-,-.. ,,···········,·,,··,··,·+· .. ········,· .. ··•· .. ···1·············· .. • .. ···_+· .. ··-······ __ ······f····· .. · __ ··· __ ·········7·············.,···_-: I 1 ; l I
l iii I
............... 1 .. -........... J ....... -............ -1.-....... _ ........... ; ..... _ ......... _ .. .J ................... . \~ I I I I I •· ••• J:::I:::=OIL
i ! 1 ! i i ~ ! i
o L"' ~~::r:~~i .1 ~ o 10 20 30 40
Channel Figure 11. Continued.
50 60 70
69
of measured in-track, as well as cross-track, count rate variations before an accurate count rate inversion can be performed.
4.4.3. Inversion of count rates to determine thermal and epithermal amplitudes Several studies of simulated neutron leakage fluxes from Mars have shown that resultant energy spectra can be fit well by a function ofthe form (e.g., Drake et al., 1988; Dagge et ai., 1991, Feldman et ai., 2000).
Fm = a(KjT) exp(BKjT) + f3(Kj Ko)-P Fc(K j Ko). (1)
Here Fm is the model flux or current function, K is the neutron kinetic energy, a is the thermal amplitude, T is the temperature of the thermal distribution, f3 is the epithermal amplitude, p is the epithermal power law index, Fc(K j Ko) is an arbitrary cutoff function to facilitate separation of thermal and epithermal components of Fm , and Ko is an arbitrary constant. Experimentation with many simulations showed that a cutoff function of the form
(2)

70
c)
-C ::J o o (of)
Q.. eI) C) (U Lei)
> «
w. V. BOYNTON ET AL.
--y= 123.04 "xA(·1.6403) R= 0.9978
Peak Channel'" 11.95
14
1 2 ..... .------+-------.. ----.--.--..• --------....... --s .......... M •• __ •••••• _.!. .... _ ..... _" ............. " ................... , .. ' ..... N ... ~ .... . ; j ! r ! i . Iii i !!!:
1 0 .... M. ·_·_·-t··· .. ···· .. ····_·_···· t··_···_·····_····-t· .... ,·· .. ·"· .. ·-·····~········-····-·-·-·t-·--·-·---·--t--·-·-··. __ .M._.
! i I ., i
8 .... ·····t···············l··········_····,········· .. ·· .. ·· .. ··:·· .. · .. · .... · .. · .. · ... ·· ;· .. · .. · .. ·· .. · .... ·· .. ··t···· .. ··· .. · .... ·
-..1 ...... _ ............. : ........................ , .... _ ...... __ ....... ; I 6 . ......... i ! ! ! ····· .. i· .. ···· .. ·········:--············
1 l ~ ~';, 1 !! i: ;
4 ............ -•. _ ................... , ........................ , ......................... ! ........................ l ....................... l .................... . • . ; ~ : i
2
o o 10
! i' ; ! .. _ ... __ .. !. ____ ... _ ...... ___ .. .!.,_ ............... _ ... :,.,'m ..... _ ....... _ .................................... , .......... .
; : ~ i i
!! ! l
1 !
20 30 40
Channel Figure J J. Continued.
50 60 70
provided both good fits to simulated spectra and clean thermal-epithermal separations with the choices of Ko = 0.15 eV and k = 5. Although this procedure has been revisited using results from Lunar Prospector (Feldman et ai., 2000), the new procedure is essentially the same as that just presented.
Count rates of the prisms of the NS sensor have been calculated for an extensive set of assumed Martian surface chemistries using a calculated energy-dependent efficiency function (Feldman et al., 1993a). Best fit thermal and epithermal amplitudes, a and f3 from 0), were also calculated for each of the simulated neutron spectra. Intercomparison showed that the thermal amplitude is primarily related to the difference in count rates measured using the forward- and backward-facing prisms, and the epithermal amplitude can be determined by the count rates measured using both the downward- and backward-facing prisms. The number of neut· rons from Mars that is reprocessed by the spacecraft can be continuously monitored using the upward-facing prism and removed using calibration data measured during the transition to the mapping orbit about Mars.

0, 1
d)
'E ::::J o U v a.. a> C) co .... a> > <C
12
10
8
6
4
2
o
Cdlto'''lIOId
foraHtI''lrH
0 .01 senson
o
GAMMA-RAY SPECTROMETER SUITE
--Y= 115,2 "x"(-l ,61 89) R= 0,9965
Peak Channel = 10.64
•• ,' , •• ~ •• , •• , •• .:.. " •• ,.~ ..... , •• , •• ~.,.:.., •• , •• _.~., •• ~ •• , •• .;."'~"""""'N""":""""""""""""~""'"._._._ ••••••• l ....... _.~ __ ... . : . . ! . -! i
... ..... .. .. · .. ·1· .. ···· .. · ............. \······ .. ·· .. · .. ······+ .. · .. ···· .... ····· .. · .. ·1 .. · .. ············· .. ·-t·· .. ·_ .. · .. ·_ .. ·-+-_···· __ ·· .. i! i i! ! i! i ! t i
··_·l··········· ·· ·· t················ ·I········ ·· ·_···I····· ··········· .. ·j······ .... · .. ·-···· .. ··1··· .. · .. · .. · .. ······· i i f I . i t I
! ! I .. -... ,.!~-~.-,.-... ··········I,·····,·· .. ··-··-·······!··· ··· -·-·~·····-····l· .. · .. ·· .. · .. ···· .... ···t .. · .. · .. · .. _· .. _··
I ! I M •..• H·'··· .. f··_···········H ....... ! .................... ·····t······.······.··.··----f·-·-·-···.·····---··f·.·.--.----.-.-.-.. .
i i ! i
10 20 30 40
Channel Figure II. Continued.
(3)
Numerical calculations
(1) effective area for SO
(2) effective area for MO
(3) effective area for LO
50 60 70
1E-3 L-~~~~~~~~&-~~w_~~ __ ~~ __ ~~~~~~~~WL~W
1 E-8 1E-1 1E-6 1 E-5 1 E-4 lE-3 0,0 1 0 ,1 10 MeV
71
Figure 12. Calculated and measured efficiency (expressed as effective cross-sectional area) of the HEND neutron detectors. The low-energy cut off is due to the Cd filter.

72 w. V. BOYNTON ET AL.
4.5. ANALYSIS OF REND NEUTRON DATA
REND neutron data are presented in four signals SSD, SMD, SLD and SSCjINjN, which all together cover the energy range from 0.4 eV up to 15 MeV. Four detectors of these signals SO, MD, LD and SCIININ have different dependence of cross-section on energy, and one may perform the spectral deconvolution of the detected neutron flux using the REND calibration data (Figure 12). During the mission REND data will be synchronized with pixels of the GS data, and all four REND signals for neutrons will be accumulated in pixels for a global map of Mars.
The data from REND will be combined with the data from the NS, which represent other energy ranges of neutrons. These two instruments provide the comprehensive description of Martian neutrons from thermal energy up to 15 MeV.
5. Science
The data obtained by the Mars Odyssey GRS will address a variety of scientific issues in several different areas of space sciences. The following sections describes the most important of these applications of the data from the GRS instrument suite.
5.1. GEOSCIENCE INVESTIGATIONS AT MARS
5.1.1. Crust and mantle composition Processes of crustal formation on Mars are poorly known. Crustal formation is likely to have been complex; for example, in the most ancient cratered terrains, one sees clear evidence for nearly concurrent action of intense impact and volcanic processes. On other bodies in the inner solar system, crustal differentiation processes have concentrated some elements (e.g., Ca, AI) in crustal materials. We do not yet have a good understanding of the extent to which this has taken place on Mars. The abundances of refractory incompatible elements like Th and U should provide particularly useful information about the degree of fractionation of the martian crust with respect to the mantle. Th, U, and also K abundances in the martian crust are, of course, also important as constraints on the magnitude of radiogenic heating sources present, and K/U and Kffh ratios may be used to estimate the abundances of K and other moderately volatile elements in the planet.
Recent data from the Mars Global Surveyor Thermal Emission Spectrometer (TES) have provided insight into the mineralogy of martian crustal materials (e.g., Bandfield et al., 2000). TES data show two primary mineralogical signatures in low-albedo regions on the martian surface. One is an apparently basaltic composition dominated by plagioclase and clinopyroxene, while the other appears more andesitic and is dominated by plagioclase and volcanic glass. The former is concentrated in the ancient cratered terrain of the southern highlands, while the latter predominates in the younger northern lowlands. While these data yield important mineralogical information, they provide no direct indication of chemistry. For the

GAMMA-RAY SPECTROMETER SUITE 73
Pathfinder landing site, APXS elemental analyses of rocks (e.g., Rieder et aZ., 1997) have revealed a chemistry consistent with the andesite interpretation, and have placed some useful constraints on crustal evolution processes there, suggesting, for example, derivation from a high-alumina parent magma produced via early melting of a relatively primitive martian mantle (McSween et aZ., 1999). The synergistic use of TES and GRS data together has the potential to further constrain the crustal composition inferences derived so far from the TES data, and (unlike the Pathfinder data) to do so on a global scale.
Determining the composition of the martian mantle is another major goal of geochemical investigation of the planet. The Mars Odyssey GRS may be able to perform analyses of volcanic materials derived from partial melting of the mantle, and from these to infer something about mantle composition. As one example, we can derive information about mantle chemistry from the concentration in volcanic rocks of elements, such as Fe and Mn, that do not fractionate substantially between solids and melts.
5.1.2. Weathering processes Much of the martian surface appears to be dominated by fine-grained dust. The elemental chemistry of this material was investigated to first order by the Viking landers, and later by the Sojourner rover. The composition has been found to be rather similar at all three sites, suggesting that the materials at all of these locations are dominated by eolian deposits that have been largely homogenized on a global scale by dust storms. To the extent that compositional variations are observed in martian soils, they are explicable primarily as a result of varying admixtures of sulfate/chloride cement and local rock fragments (McSween and Keil, 2000).
The fines are clearly weathering products of some sort, but only a limited amount of information about the source rocks may be derived from our present knowledge of their elemental composition. Compared to most terrestrial materials, martian fines are high in Fe and Mg, and low in Si, AI, and K. These characteristics are consistent with weathering from mafic or ultramafic source rocks. However, our knowledge of dust chemistry is incomplete, and will be improved by the GRS. Moreover, it is not known to what extent the source rock composition implied by the chemistry of the fines is representative of martian surface rocks as a whole. For example, if the fines that are now globally distributed were generated primarily by local palagonitization of basaltic lavas via interaction with ground ice and water, the composition of the fines may be essentially unrelated to that of much of the planet. We will therefore attempt to compare the global average dust composition to the compositions of rocks determined at a range of sites.
It is clear that our signal will always represent some mixture of signal from both rock and fines. It was found at the Mars Pathfinder site that the fines were much lower in potassium than were the rocks (Wanke et aZ., 2001). We may find some element, e.g. chlorine, which is enriched in fines that can be used as a tracer for the amount of fines. In cases where likely source rock chemistry can be iden-

74 W. Y. BOYNTON ET AL.
tified, comparison of the compositions of source rocks and weathering products will yield insight into the weathering process. An element particularly important in this regard is hydrogen. Viking results suggested that some water of hydration was present in martian fines, but the amount was poorly determined. Results from the GRS should give the H concentration in the martian soil with high accuracy, indicating the degree of hydration that the source rocks have undergone.
At both of the Viking landing sites, near-surface fines were found to be cemented. Viking x-ray florescence data indicate that the cemented soil is higher in Sand perhaps CI than are the other materials analyzed. Pathfinder APXS measurements did not show any difference in Sand Cl between the normal soils and a cemented deposit, called "Scoopy Doo" (Wanke et aI., 200 l). Therefore, it is still open as to how the cemented deposits were formed, since only their physical properties (hardness) seem to be different. Both soils and cemented deposits have high S and Cl concentrations. The S probably is present as sulfates; no sulfur-containing species were detected by the Viking GCMS experiment, as would be expected if the S was present in sulfides. The possible enhanced concentration of Cl in duricrust may indicate the presence of NaCl. The MO GRS should allow global investigation of the concentration of CI and possibly S in the martian soil, permitting us to search for correlations of salt concentration with other geological indicators of the action of water.
5.1.3. The SNC connection According to their trace element ratios and oxygen isotope characteristics, the SNC meteorites form a genetically related group of more than a dozen differentiated meteorites. The low crystallization ages and the trapped gases with element and isotope ratios of the martian atmosphere observed in one of them are considered to provide strong evidence for the proposition that the SNC meteorites represent martian surface rocks, ejected into space by large impacts. Based on the chemistry of the SNC meteorites and their mineralogy, precise information about the bulk composition (crust, mantle, and core) and structure of their assumed parent body Mars has been obtained (e.g., Wanke and Dreibus, 1988).
The GRS should further elucidate the connection between the SNC meteorites and Mars. Pairs of elements occurring globally in invariant abundance ratios, e.g. KIU or KfTh, will be most helpful in this respect. However the KIU ratio is quite variable in SNC meteorites and the preliminary value derived from the gammaray experiment of Phobos 2 falls outside the SNC range (Trombka et al., 1992). Nevertheless, the KlV and KITh ratios obtained by GRS will be of great importance to this question. In addition, the Fe/Mn ratios have potential importance. For all invariant ratios, integration over large areas or even over whole planet is possible, reducing the uncertainties by large factors. However, the possible shift of element ratios due to the weathering process may cause problems.

GAMMA-RAY SPECTROMETER SUITE 75
5.104. Volcanism Volcanism has been a very important process in shaping the martian surface, and volcanic units are widespread on the planet. While the intensity of volcanic activity has generally diminished with time, volcanism appears to span almost all of recorded martian geologic history. Volcanic activity has been dominated throughout the planet's history by the extrusion of very fluid lavas, with yield strengths and viscosities (where they can be estimated) comparable to or lower than those of terrestrial basalts. In many instances, lavas have been emplaced as broad, flat volcanic plains. These plains range in age from the very old units interspersed through the ancient cratered terrain and on the floor of the Hellas basin, to the somewhat younger ridged plains of Lunae Planum, Chryse Planitia, and elsewhere, to the still younger plains of Elysium and, finally, Tharsis. It is not known to what extent there are systematic changes in the composition of these plains units with age, or what such changes might tell us about, say, changes in the depth of magma production with time. The Mars Odyssey GRS will be able to map the compositions of these units and to search for evidence of compositional changes.
Interspersed with and lying atop volcanic plains units, particularly in the Elysium and Tharsis regions, are Mars' spectacular shield volcanoes. These, too, span a considerable range in age, from the old, highly degraded shields of Hadriaca and Tyrrhena Paterae, through Alba Patera and the Elysium volcanoes, to the very young shields of Olympus Mons and on the Tharsis ridge. Again, little is known about variations in volcano composition with location and age. The largest martian volcanoes will be resolvable in the Odyssey GRS data, allowing us to search for variations in chemistry among them.
5.1.5. Volatile reservoirs and transport The Mars Odyssey GRS experiment will also address a number of problems having to do with volatiles - primarily H20 and CO2 - at and below the martian surface. Both cosmochemical considerations and widespread evidence for fluvial activity indicate that a substantial amount of water was outgassed early in martian history. Much of that water may now reside beneath the ground as ice. Using simple models of heat and vapor transport in the martian regolith, it is possible to show that ground ice may be stable within tens of cm of the martian surface at latitudes within 30 to 40 degrees of the poles (e.g., Zent et al., 1986). In fact, Mars Global Surveyor MOC images have shown strong evidence for recent localized melting of ground ice at some high-latitude locations (Malin and Edgett, 2000). Already the GRS has found evidence for subsurface ice at Mars, with a subsurface ice content of about 35% by mass buried by amounts of ice-free regolith that vary from 150 g/cm2 to 30 g/cm2 between -45 and -75 degrees latitude (Boynton et aI., 2002).
Overlying the layered deposits at both poles are deposits of perennial ice. The thickness of these deposits is poorly known, and it is not known to what extent their ice/dust ratio may differ from that of the underlying layered deposits. At the south pole, there is evidence from Viking that the perennial ice surface is CO2 rather

76 W. Y. BOYNTON ET AL.
than H20 (Kieffer, 1979), although this may not be the case in all years (Jakosky and Haberle, 1990). The perennial ice at both poles covers large enough areas to be resolved by the GRS, and it should be possible to determine the abundances of H20, CO2, and dust accurately. Again, gamma-ray and neutron data may be used together to establish whether there are any vertical variations in composition over depths of tens of g/cm2 .
Overlying both poles in the winter and extending down to the middle latitudes are the seasonal frost caps. These caps are composed of CO2 condensed from the atmosphere, and contain little H20 (Kieffer et al., 2000). Using GRS data, it should be possible to make maps of polar cap thickness as a function of time through the martian year, observing the caps through their full cycle of advance and retreat. The topographic thickness of these caps has recently been measured by the Mars Global Surveyor MaLA instrument to be tens of cm (Smith et ai., 2001). Their column density (in g/cm2) may be determined both by using neutron data and by observing the changing attenuation of strong gamma-ray lines from the underlying regolith. These gamma and neutron data will therefore provide an independent measure of the mass distribution of CO2 within the evolving cap. Combining these data on column density with the MaLA data on thickness, will yield the density of the CO2 ice.
As noted above, Viking XRF (Clark et al., 1982) and Mars Pathfinder APXS (Rieder et al., 1997) analyses yielded high concentrations of sulfur and chlorine in the martian soil at all three landing sites. It seems unlikely that sulfur was added to the soil in the form of Mg- or Ca-sulfate because neither Mg or Ca is in excess when compared to the Shergotty meteorite, which otherwise matches the Viking soil very closely if normalized to Si02. It may be that sulfur was introduced via a gas-solid reaction of S02 or S03 to the material of the martian surface rocks comminuted by impacts.
In accordance with the volatile content of terrestrial magmas, H20 vapor dominates in terrestrial volcanic gases, followed by CO2 and S02. The H20 content of SNC meteorites is more than one order of magnitude below that of comparable terrestrial rocks while sulfur is about equal. Hence if SNC meteorites are indeed representatives of martian crustal rocks, S02 and CO2 could be the dominant volatile species on Mars. Gases from volcanic intrusions can be expected to migrate through the regolith toward the surface. In the absence of a strong greenhouse effect, only CO2 would stay in gaseous form, while S02 gas would feed solid liquid S02 tables and only slowly find its way to the atmosphere where it would quickly be oxidized to S03 consuming H20.
Although the sensitivity of GRS for sulfur is limited (Table II), it can be hoped that the distribution of sulfur and chlorine can be studied on a global scale and some information can be gained on the thickness of the regolith containing sulfur and chlorine and on the total inventory of these two elements in the martian surface layers. The presence of sulfuric acid would, of course, place strong constraints on carbonate formation.

GAMMA-RAY SPECTROMETER SUITE 77
5.1.6. Atmospheric processes The 16-glcm2-thick martian atmosphere will attenuate gamma rays that escape from the martian surface, especially those with the lowest energies (Metzger and Arnold, 1970). The thickness of the martian atmosphere can be determined by the differential attenuation of two gamma rays with different energies (Metzger, 1984; Metzger et al., 1986a). The best sets of gamma rays for atmospheric-thickness studies will be those with well known ratios for their fluxes and the best spread in their attenuation coefficients, such as the 0.9112 and 2.6146 MeV gamma rays in the thorium decay chain. The same approach can be used to monitor the deposition and disappearance of polar caps over a surface of a different composition.
As the seasonal CO2 frost forms on the winter pole of Mars, a significant fraction of the atmosphere condenses in the polar region. It is likely that this transport of atmosphere to the polar regions will carry the minor constituents of the atmosphere, Ar and N2, with it to be concentrated in the polar regions as the CO2 condenses, only to be replaced by more atmosphere containing more Ar and N2. Depending on the mixing between the mid latitudes and polar regions, it is possible that a substantial enrichment of Ar and N2 could be observed over the winter poles. This enrichment could be observed by the effect of thermal neutron attenuation caused by N or by gamma rays emitted by Ar or N.
5.2. ASTROPHYSICAL INVESTIGATIONS
Measurements of interest in the fields of Astrophysics, Space Physics and Solar Physics will be carried out as part ofthe mission utilizing the GRS. A few examples of the types of investigations planned will be described.
5.2.1. Gamma-ray bursts One of the most puzzling and present mysteries in astrophysics is the question of the origin of gamma-ray bursts. Because these powerful and energetic cosmic bursts of gamma radiation occur at random times from random directions in the sky, their studies can be the best facilitated by non-oriented instruments with broad field of view. These gamma-ray instruments do not have angular resolution, and the only way that the source directions of the transient events can be accurately determined is through the timing of arrival of a transient at several widely separated detectors in space.
There are several instruments now in Earth orbit, e.g. KONUSlWind and HETE-2. The Ulysses mission, launched in 1990 could be used as one distant interplanetary point. At least one more far-separated detector is necessary for accurate localization by the triangulation method, and GRS with HEND does provide this second interplanetary point.
The program of interplanetary triangulation of gamma-ray bursts has already been started by GRS and HEND during the Odyssey cruise flight. About 30 bursts were detected by HEND during 4.5 months of cruise, and several of them were

78 W. Y. BOYNTON ET AL.
localized with small error boxes on the sky (Hurley et aI., 2002). This program will be continued during the mapping stage of Odyssey mission, and detection of about 24 new bursts per year could be expected from the Martian orbit.
5.2.2. Extragalactic gamma-ray background The extragalactic gamma-ray background (EGB) is of great interest in cosmology and also is of potential significance for astrophysics. The first measurement of the EGB was obtained with a gamma-ray spectrometer aboard the Ranger spacecraft in 1961 (Metzger et aI., 1964). Models for the origin of this radiation can be divided up into truly diffuse or very highly redshifted processes and source superposition models. The diffuse and redshifted (as opposed to source) production models involve cosmic-ray interaction, matter anti-matter annihilation, or exoticparticle decays. These processes are presumed to occur typically in the early history of the universe and involve the basic physical processes leading to the current form of the universe as we know it. It is for this reason that investigations of the low-energy gamma-ray background radiation studying both spectral and spatial characteristics will be of fundamental importance to our understanding of the universe. The observed low energy (1-10 MeV) gamma-ray background has been shown to have a general isotropy of at least 80% by NaI scintillator experiments (Trombka et al., 1977; Mazetz, Golenetskii and It'Inskii, 1977) and at least 90% by double-Compton telescope observations.
5.2.3. Solar processes Impulsive energy release and high-energy particle acceleration often occur in cosmic plasmas at many sites throughout the Universe, ranging from planetary magnetospheres to accretion disks around compact objects. Nowhere can one pursue the study of this basic physics better than in the active Sun, where solar flares are the direct result of impulsive energy release and particle acceleration. Here, the acceleration of electrons is revealed by hard X-ray and gamma-ray bremsstrahlung; the acceleration of protons and nuclei is revealed by nuclear gamma-rays and neutrons. Understanding the processes that convert energy into high-energy particles is a major goal of astrophysics, and observations of solar flares offer a unique opportunity to study these processes. Gamma-ray line and hard X-ray continuum emissions have been observed from solar flares for many years and by many different instruments, yet measurements with the high-energy resolution necessary to extract all of the detailed information available from the gamma rays and hard X-rays are extremely limited.
Measurements of large Solar Particle Events (SPE) by the GRS will also be especially useful when the Mars Odyssey spacecraft is in position to view the hemisphere of the Sun not seen from the Earth. Such identifications will be very useful for global studies of traveling inter-planetary disturbances that affect cosmic-ray modulation. Also, flux measurements made by the Mars Odyssey GRS of energetic particles in the galactic cosmic rays and from the Sun will be compared with those
GAMMA-RAY SPECTROMETER SUITE 79
from other spacecraft to help study the transport of these particles in the inner solar system.
Acknowledgements
The authors wish to thank the following people for their great help in supporting the design, fabrication and testing of the GRS instrument: S. Bailey, S. Battel, M. Berst, E. Boudreau, D. Burke, 1. Crow, G. Davidson, H. Enos, D. Ferguson, M. Fitzgibbon, P. Gill, J. Goldsten, R. Hubble, S. Jung, M. Kennedy, W. J. Ko, D. Landis, C. Lansil, C. Lashley, B. Lawrie, L. Lebeau, R. Marcialis, S. Murphy, J. Odom, A. Post, L. Proctor, M. Rippa, R. Schmidt, D. Shepard, C. H. Song, N. Stevens, R. Stringfellow, M.-H. Tran, W. Verts, M. Williams, C. Wiswal.
References
Anders, E. and Ebihara, M.: 1982, 'Solar System Abundances of the Elements', Geochim. Cosmochim. Acta 46,2363-2380.
Arnold, J. R., Metzger, A. E., Anderson, E. C. and Van Dilla, M. A.: 1962, 'Gamma Rays in Space, Ranger 3', f. Geophys. Res. 67, 4878-4880.
Arnold, J. R., Boynton, W. v., Englert, P. A. J., Feldman, W. c., Metzger, A. E., Reedy, R. c., Squyres, S. W., Trombka, J. I. and Wanke, H.: 1989, Scientific Considerations in the Design of the Mars Observer Gamma-Ray Spectrometer. In High-energy Radiation Background in Space (A. C. Rester, Jr. and J. I. Trombka, eds.), AlP Con! Proc. 186,453-466.
Bandfield, J. L., Hamilton, V. E., and Christensen, P. R.: 2000, 'A Global View of Martian Surface Compositions from MGS-TES', Science 287, 1626-1630.
Bielefeld, M. J., Reedy, R. c., Metzger, A. E., Trombka, J. I. and Arnold, J. R.: 1976, 'Surface Chemistry of Selected Lunar Regions', Proc. Lunar Sci. Con! 7th, 2661-2676.
Boynton, W. v., Trombka, J. I., Feldman, W. c., Arnold, J. R., Englert, P. A. J., Metzger, A. E., Reedy, R. C., Squyres, S. W., Wanke, H., Bailey, S. H., Bruckner, J., Callas, J. L., Drake, D. M., Duke, P., Evans, L. G., Haines, E. L., McCloskey, E C., Mills H., Shinohara, C. and Starr, R.: 1992, 'Science Application of the Mars Observer Gamma Ray Spectrometer', fGR 97,7681-7698.
Boynton, W. v., Evans, L. G., Starr, R., Bruckner, J., Bailey, S. H. and Trombka, J. I.: 1998, 'Induced Backgrounds in the Mars Observer Gamma-Ray Spectrometer', in Conference on the High Energy Radiation Background in Space, IEEE Nuclear and Plasma Sciences Society, The Institute of Electrical and Electronic Engineers, Inc., Workshop Record 97TH8346, pp. 30-33.
Boynton, W. v., Feldman, W. C., Squyres, S. W., Prettyman, T. H., Bruckner, J., Evans, L. G., Reedy, R. c., Starr, R., Arnold, J. R., Drake, D. M., Englert, P. A. J., Metzger, A. E., Mitrofanov, Igor, Trombka, J. I., d'Uston, c., Wanke, H., Gasnault, 0., Hamara, D. K., Janes, D. M., Marcialis, R. L., Maurice, S., Mikheeva, I., Taylor, G. J., Tokar, R. and Shinohara, c.: 2002, 'Distribution of Hydrogen in the Near Surface of Mars: Evidence for Subsurface Ice Deposits', Science 297, 81-85.
Brilckner, J., Koerfer, M., Wanke H., Schroeder, A. N. E, Filges D., Dragovitsch P., Englert P. A. J., Starr R., Trombka J., Taylor I., Drake D. and Shunk, E.: 1990, Radiation damage in germanium detectors: Implications for the gamma-ray spectrometer of the Mars Observer spacecraft. In: Lunar and Planetary Science XXI (Lunar and Planetary Institute, Houston), 137 -138.

80 w. V. BOYNTON ET AL.
Bruckner, J., Koerfer, M., Wanke, H., Schroeder, A. N. F., Filges, D., Dragovitsch, P., Englert, P. A. J., Starr, R., Trombka, 1. I., Taylor, I., Drake, D. M. and Shunk, E. R.: 1991, 'ProtonInduced Radiation Damage in Germanium Detectors', IEEE Transactions on Nuclear Science NS-38,209-217.
Bruckner, 1., Fabian, U., Patnaik, A., Wanke, H., Cloth, P., Dagge, G., Druke, v., Filges, D., Englert,P. A. J., Drake, D. M., Reedy, R. C. and Parlier, B.: 1992, 'Simulation Experiments for Planetary Gamma-Ray Spectroscopy by Means of Thick Target High-Energy Proton Irradiations,' in Lunar and Planetary Science XXIII (Lunar and Planetary Institute, Houston), pp. 169 -170.
Bruckner, 1., Wanke, H. and Reedy, R. c.: 1987, Neutron-Induced Gamma-Ray Spectroscopy: Simulations for Chemical Mapping of Planetary Surfaces. In Proceedings of the 17th Lunar and Planetary Science Conference, Part 2, 1. Geophys. Res. 92, B4, E603-E616.
Clark, B. C., Baird, A. K., Weldon, R. J., Tsusaki, D. M., Schnabel, L. and Candelaria, M. P.: 1982, 'Chemical Composition of Martian Fines', 1. Geophys. Res. 87, 10,059-10,067.
Dagge, G., Dragovitsch, P., Filges, D. and Bruckner, 1.: 1991, 'Monte Carlo Simulation of Martian Gamma-Ray Spectra Induced by Galactic Cosmic Rays', Proc. Lunar Planet. Sci. Conf. 21, 425 -435.
Drake, D. M., Feldman, W. C. and Jakosky, B. M.: 1988, 'Martian neutron leakage spectra', 1. Geophys. Res. 93,6353-6368.
Etchegaray-Ramirez, M. I., Metzger, A. E, Haines, E. L. and Hawke, B. R.: 1983, 'Thorium concentrations in the lunar surface: IV. Deconvolution of the Mare Imbrium, Aristarchus, and adjacent regions', 1. Geophys. Res. 88, A529-A543.
Evans, L. G. and Squyres, S. W.: 1987, 'Investigation of Martian H20 and C02 via orbital gammaray spectroscopy', 1. Geophys. Res. 92,9153-9167.
Evans, L. G., Trombka, J. I. and Boynton, W. v.: 1986, 'Elemental analysis of a comet nucleus by passive gamma-ray spectrometry from a penetrator', 1. Geophys. Res. 91, B4, 0525-0532.
Evans, L. G., Reedy, R. C. and Trombka, 1. I.: 1993, Introduction to Planetary Remote Sensing Gamma Ray Spectroscopy, in Remote Geochemical Analyses: Elemental and Mineralogical Composition (c. M. Pieters and P. A. 1. Englert, Eds.) (Cambridge Univ. Press, New York), pp.167-198.
Evans, L. G., Trombka, J. I., Starr, R., Boynton, W. V. and Bailey, S. H.: 1998, Continuum Background in Space-Borne Gamma-Ray Detectors, in Conference on the High Energy Radiation Background in Space, IEEE Nuclear and Plasma Sciences Society, The Institute of Electrical and Electronic Engineers, Inc., Workshop Record 97TH8346, pp. 101-103.
Evans, L. D., Starr, R. D., Bruckner, J., Reedy, R. c., Boynton, W. v., Trombka, J. I., Goldstein, J. 0., Masarik, 1., Nittler, L R. and McCoy, T. 1.: 2001, 'Elemental composition from gamma-ray spectroscopy of the NEAR-Shoemaker landing site on 433 Eros', Meteortitics Planetary Sci. 36, 1639-1660.
Feldman, W. C. and Drake, D. M.: 1986, 'A Doppler filter technique to measure the hydrogen content off planetary surfaces', Nucl. Instrum. Methods Phys. Res. A245, 182-190.
Feldman, W. c., Drake, D. M., O'Dell, R. D., Bringley, F. w., Jr. and Anderson, R. c.: 1989, 'Gravitational effects on planetary neutron flux spectra', 1. Geophys. Res. 94, 513 -525.
Feldman, W. C. and Jakosky, B. M.: 1991, 'Detectability of martian carbonates from orbit using thermal neutrons', 1. Geophys. Res. 96, 15,589-15,598.
Feldman, W. c., Boynton, W. v., Jakosky, B. M. and Mellon, M. T.: 1993, 'Redistribution of subsurface neutrons caused by ground ice on Mars', 1. Geophys. Res. 98, #E II, 20855 - 20870.
Feldman, W. c., Boynton, W. V. and Drake, D. M.: 1993b, Planetary neutron spectroscopy from orbit, in Remote Geochemical Analysis: Elemental and Mineralogical Composition, C. M. Pieters, P. A. 1. Englert, eds., pp. 213-234, Cambridge Univ. Press, New York.
GAMMA-RAY SPECTROMETER SUITE 81
Feldman, W. c., Barraclough, B. L., Fuller, K. R, Lawrence, D. J., Maurice, S., Miller, M. c., Prettyman, T. H. and Binder, A. B.: 1999, 'The Lunar Prospector Gamma-Ray and Neutron Spectrometers', Nucl. lnstr. Methods Phys. Res. A 422, 562-566.
Feldman, W. c., Lawrence, D. J., Elphic, R. c., Vaniman, D. T., Thomsen, D. R, Barraclough, B. L., Maurice S. and Binder, A. B.: 2000, 'Chemical information content of lunar thermal and epithermal neutrons', 1. Geophys. Res. 105,20347-20363.
Feldman, W. C., Maurice, S., Lawrence, D. 1., Little, R. C., Lawson, S. L., Gasnault, 0., Wiens, R c., Barraclough, B. L., Elphic, R. c., Prettyman, T. H., Steinberg, J. T and Binder, A. B.: 2001, 'Evidence for Water Ice Near the Lunar Poles' , 1. Geophys. Res. Planets 106, #E I 0, 23231 -23252.
Feldman, W. c., Boynton, W. v., Tokar, R. L., Prettyman, T. H., Gasnault, 0., Squyres, S. W., Elphic, R. c., Lawrence, D. J., Lawson, S. L., Maurice, S., McKinney, G. W., Moore, K. R and Reedy, R c.: 2002a, 'Global Distribution of Neutrons from Mars: Results from Mars Odyssey', Science 297,75-78.
Feldman, W. c., Prettyman, T. H., Tokar, R. L., Boynton, W. v., Byrd, R. C., Fuller, K. R, Gasnault, 0., Longmire, 1. L., Olsher, R H., Storms, S. A. and Thornton, G. W.: 2002b, 'Fast neutron flux spectrum aboard Mars Odyssey during cruise', 1. Geophys. Res. 107, 1O.10291200lJA000295.
Fermi, E.: 1950, Nuclear Physics, Univ. Chicago Press, p. 248. Gasnault, 0., Feldman, W. c., Maurice, S., Genetay, 1., d'Uston, c., Prettyman, T. H. and Moore,
K. R: 2001, 'Composition from Fast Neutrons: Application to the Moon', Geophys. Res. Lett. 28,3797-3800
Jakosky, B. M. and Haberle, R. M.: 1990, 'Year-to-year instability of the Mars south polar cap', 1. Geophys. Res. 95, 1359-1365.
Kieffer, H. H.: 1979, 'Mars south polar spring and summer temperatures: A residual C02 frost', 1. Geophys. Res. 84, 8263-8288.
Kieffer, H. H., Titus, T. N., Mullins, K. F. and Christensen, P. R.: 2000, 'Mars south polar spring and summer behavior observed by TES: Seasonal cap evolution controlled by frost grain size', 1. Geophys. Res. 105,9653-9699.
Lapides, J. R: 1981, Planetary gamma-ray spectroscopy: The effects of hydrogen and the macroscopic thermal-neutron absorption cross section on the gamma-ray spectrum. Thesis, University of Maryland, College Park, 115 pp.
Lawrence, D. 1., Feldman, W. c., Barraclough, B. L., Elphic, R c., Maurice, S., Binder, A. B., Miller, M. C. and Prettyman, T. H;: 1999, 'High Resolution Measurements of Absolute Thorium Abundances on the Lunar Surface', Geophys. Res. Lett. 26, No. 17,2681-2684.
Lawrence, D. J., Feldman, W. c., Elphic, R c., Little, R. c., Prettyman, T. H., Maurice, S., Lucey, P. G. and Binder, A. B.: 2002, ' Iron abundances on the lunar surface as measured by the Lunar Prospector gamma-ray and neutron spectrometers', 1. Geophys. Res. Planets, in press.
Lingenfelter, R E., Canfield, E. H. and Hampel, V. E.: 1972, 'The lunar neutron flux revisited', Earth Planet. Sci. LeU. 16,355-369.
Lingenfelter, R. E., Canfield, E. H. and Hess, W. N.: 1961, 'The lunar neutron flux', 1. Geophys. Res. 66,2665-267l.
Mahoney, W. A., Ling, 1. c., Jacobson, A. S. and Tapphorn, R. M.: 1980, 'The HEAO 3 gamma-ray spectrometer', Nucl. lnstrum. Methods 178, 363-38l.
Malin, M. C. and Edgett, K. E.: 2000, 'Evidence for recent groundwater seepage and surface runoff on Mars', Science 288,2330-2335.
Masarik, J. and Reedy, R c.: 1994, 'Effects of Bulk Composition on Nuclide Production Processes in Meteorites', Geochim. Cosmochim. Acta 58,5307 -5317.
Masarik, J. and Reedy, R. C.: 1996, 'Gamma Ray Production and Transport in Mars', 1. Geophys. Res. 101, 18,891-18,912.
Mazets, E. P., Golenetskii, S. V. and Il'Inski, V. N.: 1977, P.s'ma V Astron. Zh (USSR), Vol. 2, No. 12,563.

82 W. Y. BOYNTON ET AL.
McSween, H, Y., Murchie, S, L., Crisp, J. A., Bridges, N. T., Anderson, R. c., Bell, J. F. III, Britt, D. T., Briickner, J., Dreibus, G., Economou, T., Ghosh, A., Golombek, M. P., Greenwood, J. P., Johnson, J. R., Moore, H. 1., Morris, R. V, Parker, T. 1., Rieder, R., Singer, R. and Wanke, H.: 1999, 'Chemical, multispectral, and textural constraints on the composition and origin of rocks at the Mars Pathfinder landing site', 1. Geophys. Res. 104,8679-8715.
McSween, H. Y. and Keil, K.: 2000, 'Mixing relationships in the Martian regolith and the composition of globally homogeneous dust', Geochim. Cosmochim. Acta 64, 2155 - 2166.
Metzger, A. E.: 1984, 'Climatology capabilities of a gamma-ray spectrometer at Mars', Bull. Am. Astron. Soc. 16, 678-679.
Metzger, A. E., Anderson E. c., Van Dilla M. A. and Arnold, J. R.: 1964, 'Detection of an interstellar flux of gamma-rays', Nature 204, 766-767.
Metzger, A. E. and Arnold, J.R.: 1970, 'Gamma-ray spectroscopic measurements of Mars', Appl. Opt. 9, 1289-1303.
Metzger, A. E., Arnold, J. R., Reedy, R. C., Trombka, J. I. and Haines, E. L.: I 986a, The application of gamma-ray spectroscopy to the climatology of Mars. In: Lunar and Planetary Science XVII (Lunar and Planetary Institute, Houston), 549-550.
Metzger, A. E. and Drake, D. M.: 1990, 'Identification of lunar rock types and search for polar ice gamma ray spectroscopy', 1. Geophys. Res. 95, 449-460.
Metzger, A. E. and Haines, E. L.: 1990, 'Atmospheric measurements at Mars via gamma ray spectroscopy', 1. Geophys. Res. 95,14,695-14,715.
Metzger, A. E., Parker, R. H., Arnold, J. R., Reedy, R. C. and Trombka, J. 1.: 1975, 'Preliminary design and performance of an advanced gamma-ray spectrometer for future orbiter missions', Proc. Lunar Sci. Con! 6th, 2769-2784.
Metzger, A. E., Parker, R. H. and Yellin, J.: 1986b, 'High energy irradiations simulating cosmic-rayinduced planetary gamma ray production. I. Fe target', 1. Geophys. Res. 91, 0495 - 0504.
Mitrofanov, 1., Anfimov, D., Kozyrev, A., Litvak, M., Sanin, A., Tret'yakov, V, Krylov, A., Shvetsov, V, Boynton, W., Shinohara, c., Hamara, D. and Saunders, R. S.: 2002, 'Maps of Subsurface Hydrogen from the High Energy Neutron Detector, Mars Odyssey', Science 297, 78-81.
Pehl, R. H., Varnell, L. S. and Metzger, A. E.: 1978, 'High-energy proton radiation damage of highpurity germanium detectors', IEEE Trans. Nucl. Sci. NS-25, 409-417.
Prettyman, T. H., Feldman, W. c., Lawrence, D. J., McKinney, G. W., Binder, A. B., Elphic, R. c., Gasnault, O. M., Maurice, S. and Moore, K. R.: 2002, 'Library least squares analysis of Lunar Prospector Gamma-ray spectra', 33rd Lunar and Planetary Science Conference, Abstract #2012.
Reedy, R. c.: 1978, 'Planetary gamma-ray spectroscopy', Proc. Lunar Planet. Sci. Conf. 9th, 2961-2984.
Reedy, R. c.: 1988, Gamma-ray and neutron spectroscopy of planetary surfaces and atmospheres. In: Nuclear Spectroscopy of Astrophysical Sources (N. Gehrels and G. Share, eds.), AlP Conf. Proc. 170 (American Institute of Physics, New York), 203-210.
Reedy, R. C. and Arnold, 1. R.: 1972, 'Interaction of solar and galactic cosmic-ray particles with the Moon',l. Geophys. Res. 77,537-555.
Reedy, R. c., Arnold, J. R. and Trombka, J. 1.: 1973, 'Expected gamma ray emission from the lunar surface as a function of chemical composition', 1. Geophys. Res. 78,5847 -5866.
Rieder, R., Economou, T. Wanke, H., Turkevich, A., Crisp, J., Briickner, J., Dreibus, G. and McSween, H. Y. Jr.: 1997, 'The chemical composition of Martian soil and rocks returned by the mobile alpha proton X-ray spectrometer: Preliminary results from the X-ray mode', Science 278, 1771-1774.
Saunders, R. S., Arvidson, R. E., Badhwar, G. D., Boynton, W. V .. Christensen, P., Cucinotta, F. A., Gibbs, R. G., Kloss, Jr. C., Landano, M. R., Mase, R. A., Meyer, M., Pace, G., Plaut, J. J., Sidney, w., McSmith, G. w., Spencer, D. A., Thompson, T. W. and Zeitlin, C. J.: 2004, '2001 Mars Odyssey Mission Summary', Space Sci. Rev., 110, 1-36.
GAMMA-RAY SPECTROMETER SUITE 83
Smith, D. E., Zuber, M. T, and Neumann, G. A.: 2001, 'Seasonal variations of snow depth on Mars', Science 294, 2141 - 2146.
Surkov, Y. A.: 1984, 'Nuclear-physical methods of analysis in lunar and planetary investigations', Isotopenpraxis 20, 321-329.
Surkov, Y. A., Barsukov, V. L., Moskaleva, L. P., Kharyukova, V. P., Zaitseva, S. Y., Smirnov, G. G. and Manvelyan, O. S.: 1989, 'Determination of the elemental composition of martian rocks from Phobos 2', Nature 341, 595-598.
Thakur, A. N.: 1997, 'Analysis Of Gamma-Ray Continuum Spectra to Determine the Chemical Composition',l. Radioanal. Nucl. Chem. 215,161-167.
Trombka, J. I., Dyer, C. S., Evans, L. G., Bielefeld, M. J., Seltzer, S. M. and Metzger, A. E.: 1977, 'Reanalysis of the Apollo Cosmic Gamma-Ray Spectrum in the 0.3 to 10 MeV Energy Region', Astrophys. 1. 212, 925-935.
Trombka, J. I., Evans, L. G., Starr, R., Floyd, S. R, Squyres, S. w., Whelan, J. T, Bamford, G. J., Coldwell, R L., Rester, A. c., Surkov, Y. A., Moskaleva, L. P., Kharyukova, V. P., Manvelyan, O. S., Zaitseva, S. Y. and Smirnov, G. G.: 1992, 'Analysis of Phobos Mission Gamma-Ray Spectra from Mars', Proc. Lunar Planet. Sci. Can! 22, 22-39.
Trombka,1. I., Squyres, S. W., BrUckner, J., Boynton, W. V., Reedy, R c., McCoy, T J., Gorenstein, P., Evans, L. G., Arnold, J. R., Starr, RD., Nittler, L. R., Murphy, M. E., Mikheeva, I., McNutt Jr., R L., McClanahan, T P., McCartney, E. Goldsten, J. 0., Gold, R. E., Floyd, S. R, Clark, P. E., Burbine, T. H., Bhangoo, J. S., Bailey, S. H. and Petaev, M.: 2000, 'The Elemental Composition of Asteroid 433 Eros: Results of the NEAR-Shoemaker X-ray Spectrometer', Science 289, 2101 -2105.
Van Dilla, M. A., Anderson, E. c., Metzger, A. E. and Schuch, R .. L.: 1962, 'Lunar composition by scintillation spectroscopy', IRE Trans. Nucl. Sci. NS-9, 405 -412.
Wanke, H. and Dreibus, G.: 1988, 'Chemical Composition and Accretion History of Terrestrial Planets', Phil. Trans. R. Soc. Lond. A 325, 545-557.
Wanke H., BrUckner J., Dreibus G., Rieder R. and Ryabchikov I.: 2001, Chemical composition of rocks and soils at the Pathfinder site, Space Science Reviews, 96, 317-330.
Yadav, J. S., Briickner, J. and Arnold, J. R.: 1989, 'Weak Peak Problem in High Resolution GammaRay Spectroscopy', Nucl. Instrum. Methods Phys. Res. A277, 591-598.
Zent, A. P., Fanale, F. P., Salvail, J. R. and Postawko, S. E.: 1986, 'Distribution and state of H20 in the high-latitude shallow subsurface of Mars', Icarus 67,19-36.