The Marketing Research Process Mark Rosenbaum,Ph.D. University of Hawaii.
24
The Marketing Research Process Mark Rosenbaum,Ph.D. University of Hawaii
-
Upload
mia-miah-hardacre -
Category
Documents
-
view
218 -
download
0
Transcript of The Marketing Research Process Mark Rosenbaum,Ph.D. University of Hawaii.

The Marketing Research Process
Mark Rosenbaum,Ph.D.
University of Hawaii
The Marketing Research Process: 11 Steps
• Step One: Establishing the Need for Marketing Research
• Step Two: Defining the Problem• Step Three: Establishing Research Objectives• Step Four: Determining Research Design• Step Five: Identifying Information Types and
Sources• Step Six: Determining Methods of Accessing
Data

The Marketing Research Process: 11 Steps cont…
• Step Seven: Designing Data Collection Forms• Step Eight: Determining Sample Plan and Size• Step Nine: Collecting Data• Step Ten: Analyzing Data• Step Eleven: Preparing and Presenting the Final
Research Report
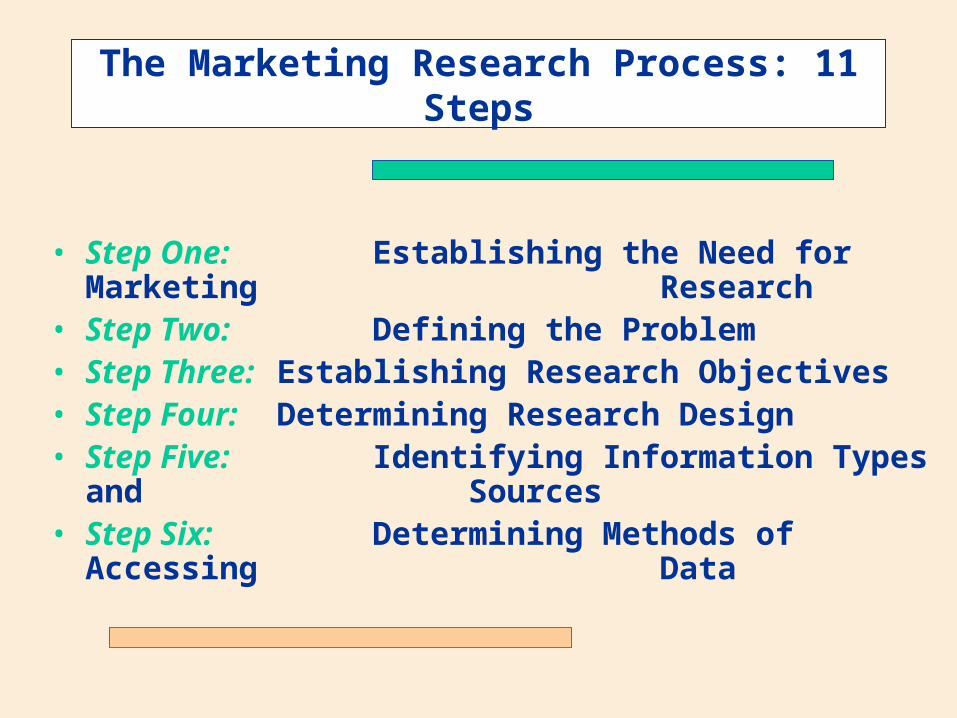
The Marketing Research ProcessStep One: Establish the Need for Marketing
Research
• When Marketing Research is not needed• The information is already available• Decisions need to be made now• You can’t afford research• Costs outweigh the value of the research
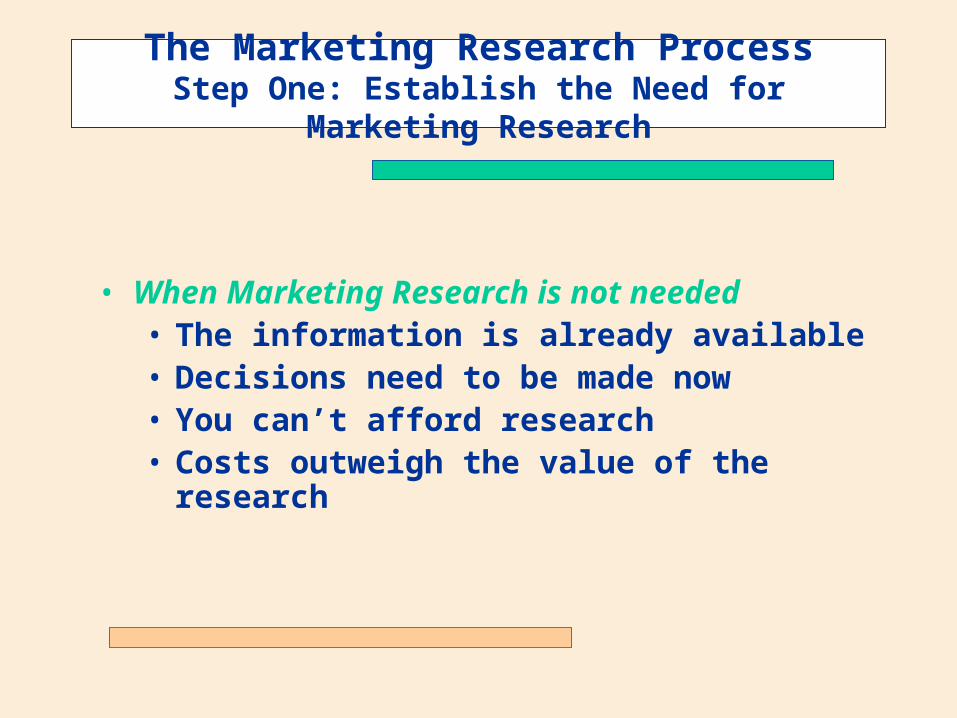
The Marketing Research ProcessStep Two: Define the Problem
• The most important step in the marketing research process is defining the problem.
• What is your team’s problem?
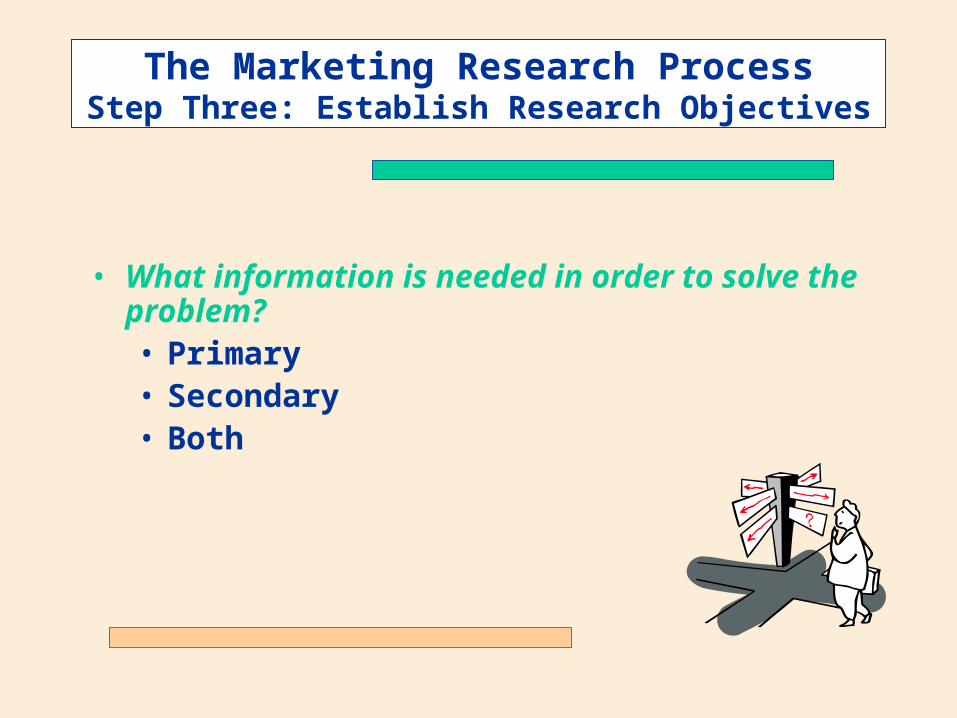
The Marketing Research ProcessStep Three: Establish Research Objectives
• What information is needed in order to solve the problem?• Primary• Secondary• Both
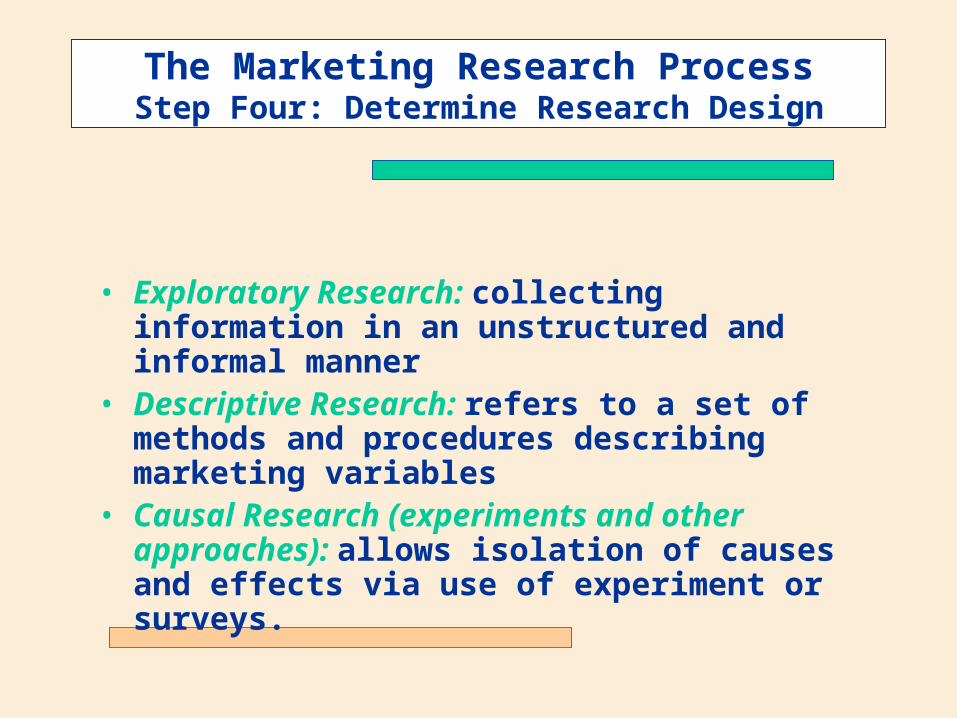
The Marketing Research ProcessStep Four: Determine Research Design
• Exploratory Research: collecting information in an unstructured and informal manner
• Descriptive Research: refers to a set of methods and procedures describing marketing variables
• Causal Research (experiments and other approaches): allows isolation of causes and effects via use of experiment or surveys.

The Marketing Research ProcessStep Five: Identify Information Types and
Sources
• Secondary Data: information that has been collected for some other purpose other than the research at hand
• Primary Data: information that has been gathered specifically for the research objectives at hand
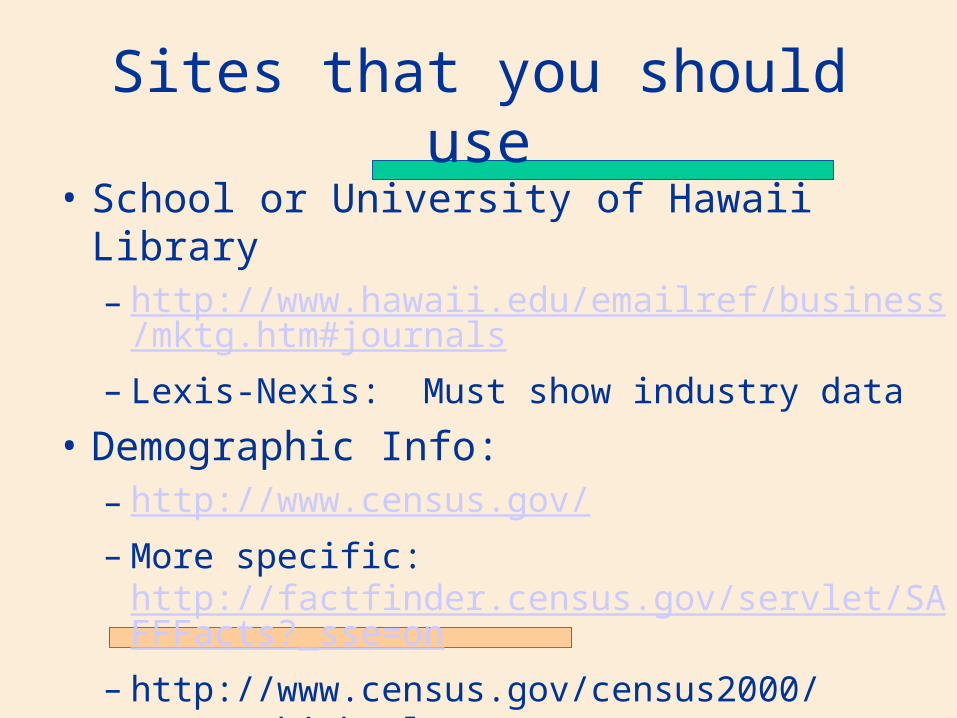
Sites that you should use
• School or University of Hawaii Library– http://www.hawaii.edu/emailref/business/mktg.htm#j
ournals– Lexis-Nexis: Must show industry data
• Demographic Info:– http://www.census.gov/– More specific:
http://factfinder.census.gov/servlet/SAFFFacts?_sse=on
– http://www.census.gov/census2000/states/hi.html

Other sites
• Claritas– http://www.clusterbigip1.claritas.com/claritas/Defa
ult.jsp– You are your zip code
• Reference USA– Only available at University of Hawaii at Manoa
• The goal:– Present facts and figures in your marketing plans.
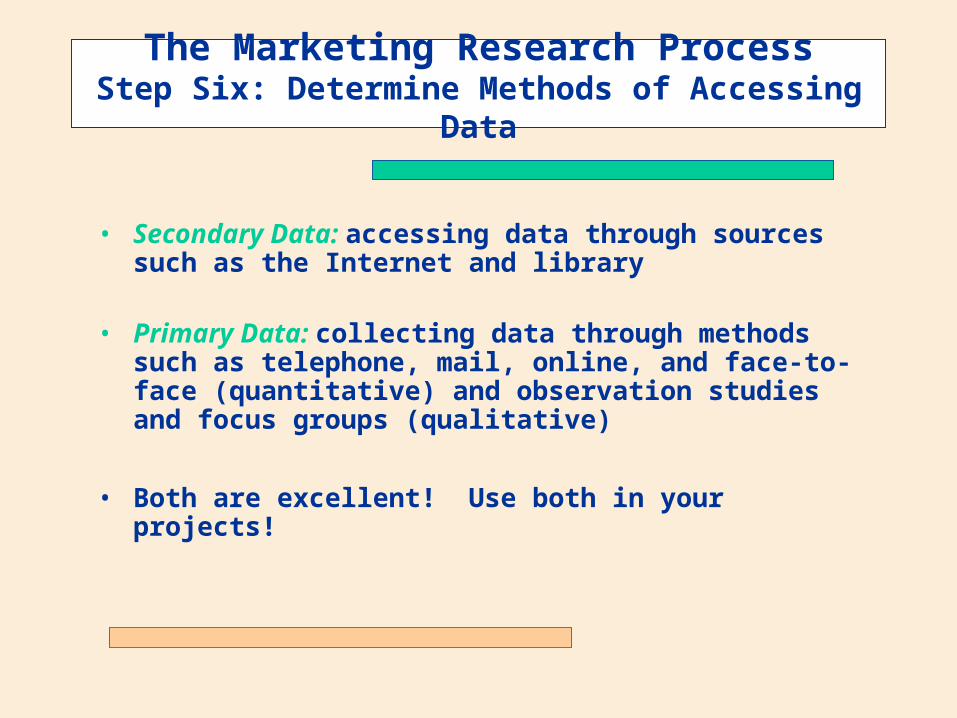
The Marketing Research ProcessStep Six: Determine Methods of Accessing
Data
• Secondary Data: accessing data through sources such as the Internet and library
• Primary Data: collecting data through methods such as telephone, mail, online, and face-to-face (quantitative) and observation studies and focus groups (qualitative)
• Both are excellent! Use both in your projects!
The Marketing Research ProcessStep Seven: Design Data Collection Forms
• The design of the data collection form that is used to ask or observe and record information in marketing research projects is critical to the success of the project. It is easy to write a set of questions but very difficult to construct a questionnaire.• Questionnaires• Observation Studies
The Marketing Research ProcessStep Eight: Determine Sample Plan and
Size
• Sample plan: refers to the process used to select units from the population to be included in the sample
• Sample size: refers to determining how many elements of the population should be included in the sample
The Marketing Research ProcessStep Nine: Collect Data
• Data collection is very important because, regardless of the data analysis methods used, data analysis cannot “fix” bad data. 12
Nonsampling errors may occur during data collection. These are related to poor design and/or execution of the data gathering.
• Sampling errors may occur based purely on chance
• Trying to make a decision on a population from a sample
The Marketing Research ProcessStep Ten: Analyze Data
• Data analysis: involves entering data into computer files, inspecting data for errors, and running tabulations and various statistical tests
• Data cleaning: process by which raw data are checked to verify that the data have been correctly input from the data collection form to the computer software program
The Marketing Research ProcessStep Eleven: Prepare and Present the Final
Research Report
• The last step is one of the most important phases of marketing research.
• Its importance cannot be overstated because it is the report, or its presentation, that properly communicates the results to the client.
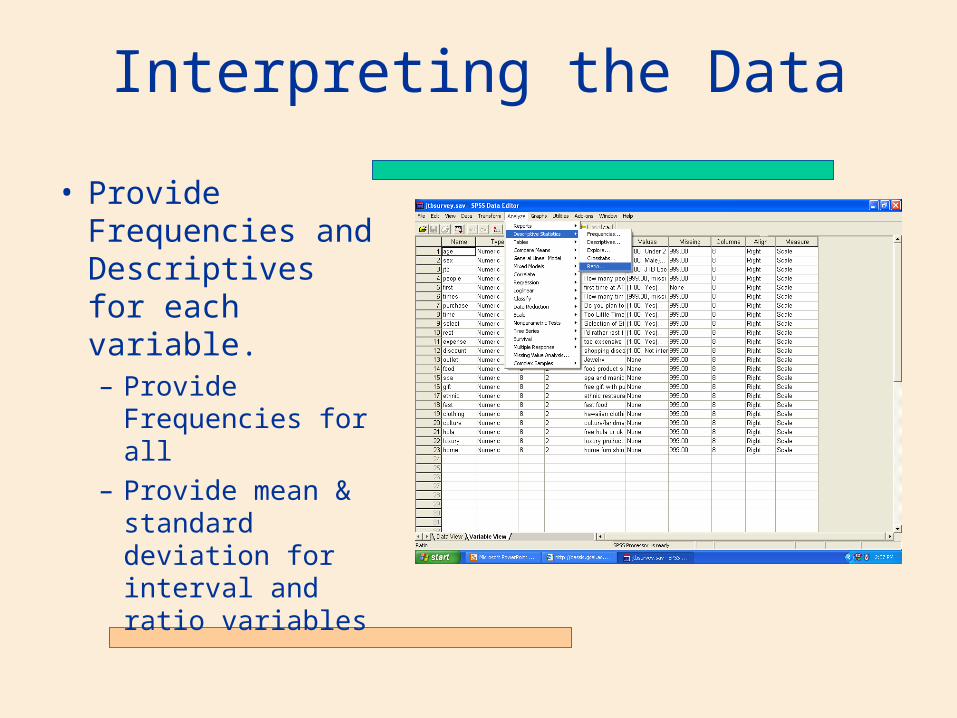
Interpreting the Data
• Provide Frequencies and Descriptives for each variable.– Provide
Frequencies for all
– Provide mean & standard deviation for interval and ratio variables

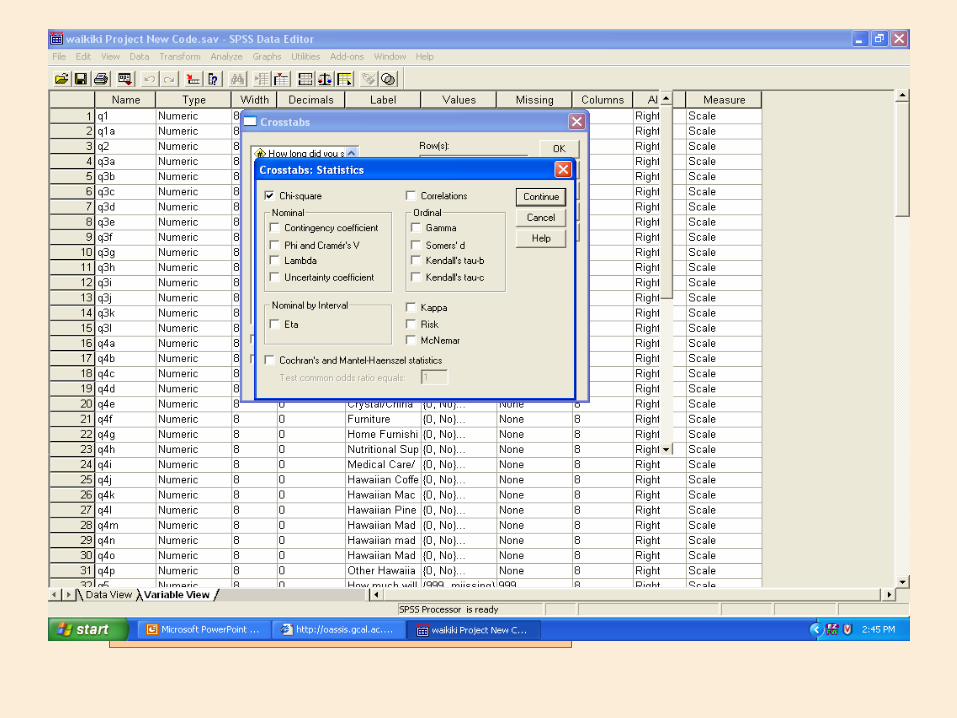
Crosstabulation
• Is there a significant difference between an independent variable (nominal/ordinal) and the response to a dependent variable (nom/ord)?
• What were asking is “are the proportions the same?”
• The dependent variable is your variable of interest.
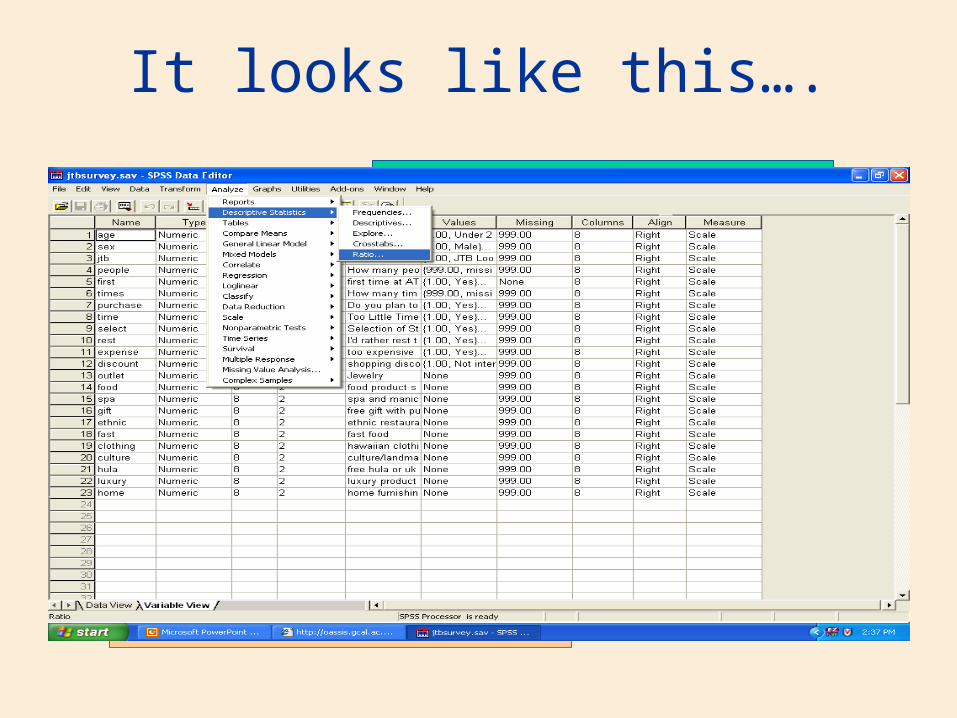
It looks like this….

Independent Variable
Dependent Variable
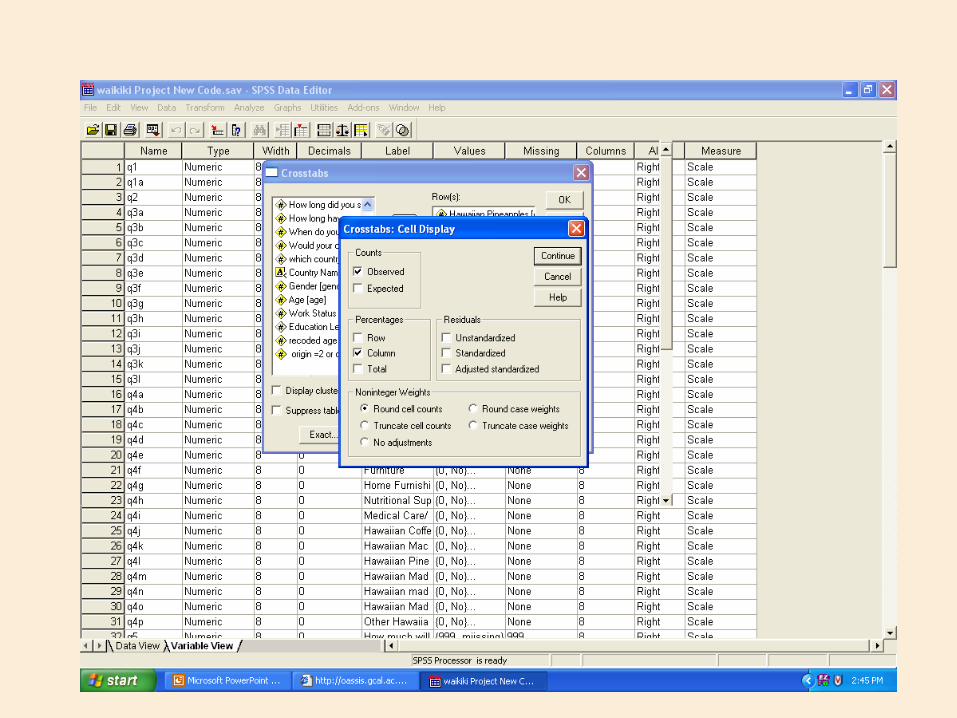

The results
Hawaiian Pineapples * country of origin Crosstabulation
328 316 74 48 766
62.6% 92.7% 69.8% 63.2% 73.2%
196 25 32 28 281
37.4% 7.3% 30.2% 36.8% 26.8%
524 341 106 76 1047
100.0% 100.0% 100.0% 100.0% 100.0%
Count
% within country of origin
Count
% within country of origin
Count
% within country of origin
No
Yes
Hawaiian Pineapples
Total
USA/Canada JapanChina/South
Korea All other
country of origin
TotalChi-Square Tests
Chi-Square Tests
100.357a 3 .000
116.519 3 .000
7.870 1 .005
1047
Pearson Chi-Square
Likelihood Ratio
Linear-by-LinearAssociation
N of Valid Cases
Value dfAsymp. Sig.
(2-sided)
0 cells (.0%) have expected count less than 5. Theminimum expected count is 20.40.
a.
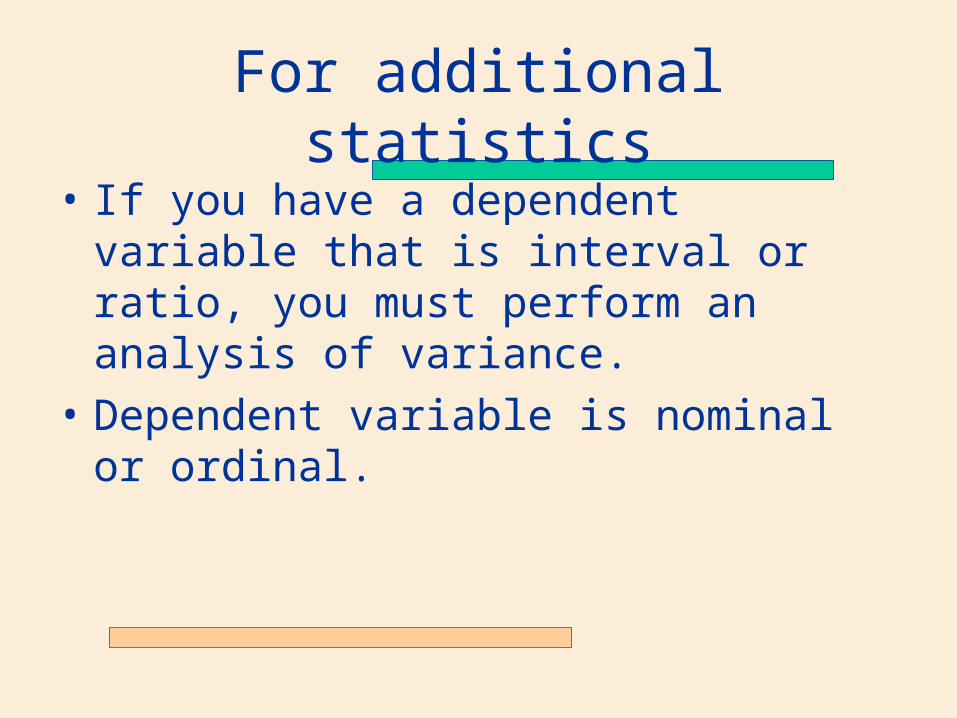
For additional statistics
• If you have a dependent variable that is interval or ratio, you must perform an analysis of variance.
• Dependent variable is nominal or ordinal.