
The market for papaya from Fiji and other Pacific Islands ...
54
Japan Market Analysis – Fiji and Pacific Island Papaya 1 The market for papaya from Fiji and other Pacific Islands – Japan Study Project Authors Fiji and Pacific Island Papaya Market Study A Project Under the EU –Funded Facilitating Agricultural Commodity Trade Project (FACT) Kalara McGregor and Andrew McGregor September 2009
Transcript of The market for papaya from Fiji and other Pacific Islands ...
Japan Market Analysis – Fiji and Pacific Island Papaya
1
The market for papaya from Fiji and other Pacific Islands – Japan Study
Project
Authors
Fiji and Pacific Island Papaya Market Study
A Project Under the EU –Funded Facilitating Agricultural Commodity Trade Project (FACT)
Kalara McGregor and Andrew McGregor
September 2009

Japan Market Analysis – Fiji and Pacific Island Papaya
2
1 The Japanese market for Papaya
1.1 Introduction
The Japanese component of the market study comprised of a preliminary desk survey followed by a visit to Tokyo and Kyoto by Kalara McGregor for importer consultations from April 13th – 17th 2009. Kalara McGregor and Andrew McGregor and prepared this report.
Trip logistics were organised by Ms.Kelera Savu(Fiji Embassy, Japan).Arrangements for meetings with buyers was provided by Mr. Tadamichi Shiramatsu(Deputy Director, Pacific Islands Centre, Tokyo).His assistance and support is gratefully acknowledged. Supplementary translations were undertaken by Ms. Yoshiko Murata.
At the time of the study, the YEN FJD exchange rate was 53.96. The current (Sept 1st,2009) exchange rate is 46.62.
1.2 An overview of fresh papaya imports and trends
In broad terms, the Japanese market for fresh fruit and vegetables has traditionally been supplied from local produce, with imports limited to a narrow range of products. However, following the deregulation of the fresh and processed fruit marketing 1992, Japan has seen a steady increase in imports of these products.
1.2.1 Fresh fruit imports
In 2005, Japan imported 1.790 million tonnes (JPY164.9.9 Billionof fresh fruits (table 1).
Bananas dominate Japan’s fruit imports, accounting for around 60% of the volume and 50% of
value. Papaya imports in 2005 were 4,075 tonnes, for a landed value of JPY 1.2 billion (JETRO
2006).

Japan Market Analysis – Fiji and Pacific Island Papaya
3
Table 1. Japan’s imports of fresh fruit 2005
Volume Value unit price
(tonnes) (share %) (JPY million) (share %) (JPY/kg)
Bananas 1,066,873 59.59%
64,706 39.24% 60.7
Grapefruits 205,961 11.50%
21,383 12.97% 103.8
Kiwifruits 59,435 3.32%
17,089 10.36% 287.5
Oranges 115,433 6.45%
11,493 6.97% 99.6
Cherries 12,363 0.69%
10,493 6.36% 848.7
Lemons 76,686 4.28%
9,815 5.95% 128.0
Pineapples 155,426 8.68%
9,800 5.94% 63.1
Avocados 28,150 1.57%
6,641 4.03% 235.9
Mangoes 12,139 0.68%
4,459 2.70% 367.3
Melons 39,262 2.19%
4,041 2.45% 102.9
Grapes 10,955 0.61%
2,185 1.32% 199.5
Papayas 4,075 0.23% 1,198 0.73% 294.0
Limes
2,208 0.12% 939 0.57% 425.3
Rambutans
654 0.04% 337 0.20% 515.3
Guava/mangosteens
238 0.01% 196 0.12% 823.5
Durian
338 0.02% 111 0.07% 328.4
Apples
124 0.01% 32 0.02% 258.1
Total
1,790,320 100.0% 164,918 100.00% 92.1
Source: Trade Statistics Ministry of Finance
As illustrated in Table 1, Papaya ranks 12th amongst imported fruits in terms of volume and
value. In 2005, papaya had a 0.23% share of imported fruit in terms of volume and 0.73% in
terms of value. The average unit landed price of papaya in 2005 was 294 JPY/kg, ranking it 7th
amongst imported fruits, behind cherries, mangoes, limes, rambutans, guavas, mangosteens
and durian (ASEAN 2001).In 2005, the average unit import value of papaya (JPY 294 /kg) is
approximately equivalent to kiwifruit (JPY 287/kg ) but lower than mango (JPY 367/kg). The
landed price of bananas (JPY 61/kg) and pineapples (JPY 63/kg) was substantially lower.

Japan Market Analysis – Fiji and Pacific Island Papaya
Trends in major tropical fruit imports over the period 2000 to 2005 are shown in table 2.
has been little overall growth in the
the period 2000 to 2005), with banana imports static at around 1 million tonnes. There has
however been significant growth in pineapple and avocado imports
actually fallen from 5,796 tonnes in 2000
papaya imports in 2003 when imports from the Philippines were severely restricted under Japan
quarantine regulations relating to fruit flies.
steadily falling since the outbreak of papaya r
Table 2. Trends in Japan’s tropical fruit imports
Volume (tonnes)
2000 2001
Bananas 1,078,655 990,554
Pineapples 100,092 118,344
Avocados 14,070 10,831
Mangoes 9,627 8,892
Papayas 5,796 6,869
Value (million JPY)
2000 2001
1 1 figures derived from Japan Ministry of Finance statistics:
stat.go.jp/SG1/estat/OtherListE.do?bid=000001008801&cycode=1
0
200,000
400,000
600,000
800,000
1,000,000
1,200,000
2000 2001 2002
Fiji and Pacific Island Papaya
Trends in major tropical fruit imports over the period 2000 to 2005 are shown in table 2.
the volumes of tropical fruit imported in recent years
, with banana imports static at around 1 million tonnes. There has
however been significant growth in pineapple and avocado imports. Papaya imports have
actually fallen from 5,796 tonnes in 2000, to 4,075 tonnes in 2005. There was a sharp drop in
papaya imports in 2003 when imports from the Philippines were severely restricted under Japan
quarantine regulations relating to fruit flies. Hawaiian papaya exports to Japan have been
since the outbreak of papaya ring spot virus (PRSV) in 1996.
Trends in Japan’s tropical fruit imports1
Volume (tonnes)
2001 2002 2003 2004 2005
990,554 936,272 986,643 1,026,014 1,066,873
118,344 122,871 122,690 142,281 155,426
10,831 13,646 23,973 28,991 28,150
8,892 8,875 10,307 12,336 12,139
6,869 6,606 3,986 4,763 4,075
Value (million JPY)
2001 2002 2003 2004 2005
figures derived from Japan Ministry of Finance statistics: http://www.e-stat.go.jp/SG1/estat/OtherListE.do?bid=000001008801&cycode=1
2002 2003 2004 2005
Bananas
Pineapples
Avocados
Mangoes
Papayas
4
Trends in major tropical fruit imports over the period 2000 to 2005 are shown in table 2. There
of tropical fruit imported in recent years (12% over
, with banana imports static at around 1 million tonnes. There has
. Papaya imports have
re was a sharp drop in
papaya imports in 2003 when imports from the Philippines were severely restricted under Japan
Hawaiian papaya exports to Japan have been
2005
1,066,873
155,426
28,150
12,139
4,075
2005
Japan Market Analysis – Fiji and Pacific Island Papaya
Bananas 59,301 54,80
Pineapples 5,330 7,154
Avocados 3,026 3,031
Mangoes 2,940 3,093
Papayas 1,778 1,995
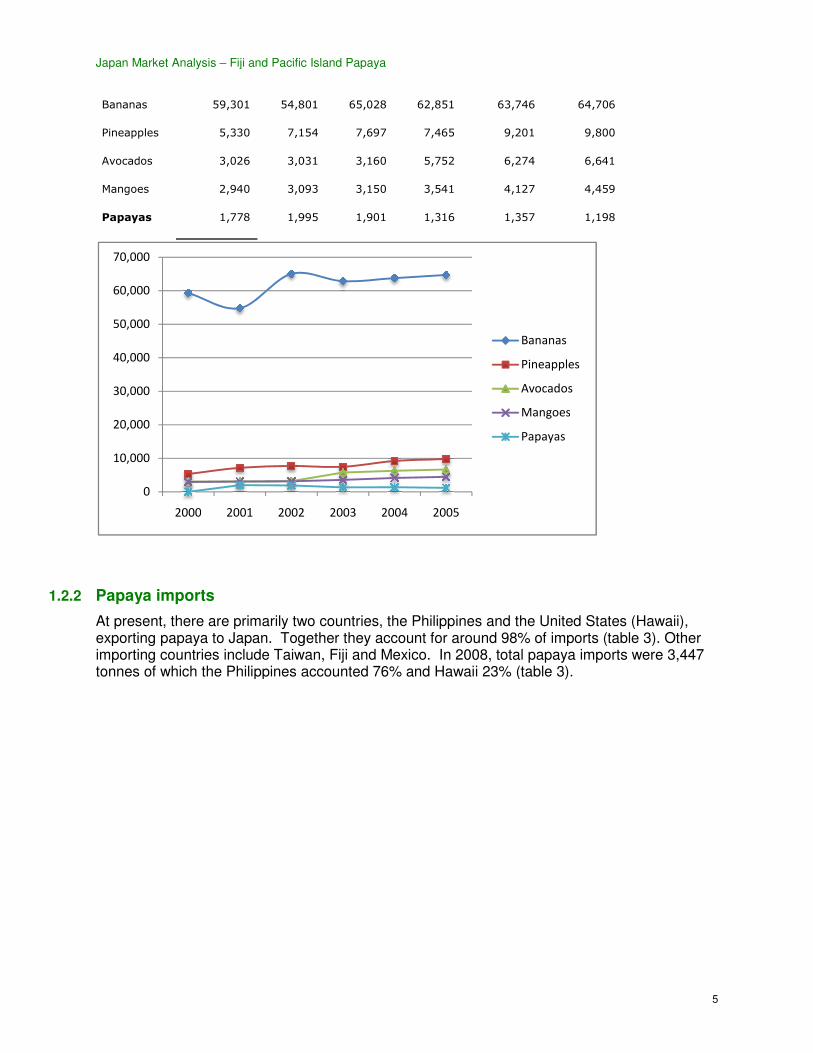
1.2.2 Papaya imports
At present, there are primarily two countries, exporting papaya to Japan. Together they account for around 98% of imports (table 3). Other importing countries include Taiwan, Fiji and Mexico. tonnes of which the Philippines accounted 76% and Hawaii 23% (table
0
10,000
20,000
30,000
40,000
50,000
60,000
70,000
2000 2001 2002
Fiji and Pacific Island Papaya
54,801 65,028 62,851 63,746 64,706
7,154 7,697 7,465 9,201 9,800
3,031 3,160 5,752 6,274 6,641
3,093 3,150 3,541 4,127 4,459
1,995 1,901 1,316 1,357 1,198
primarily two countries, the Philippines and the United States (Hawaii), Together they account for around 98% of imports (table 3). Other
importing countries include Taiwan, Fiji and Mexico. In 2008, total papaya imports were tonnes of which the Philippines accounted 76% and Hawaii 23% (table 3).
2002 2003 2004 2005
Bananas
Pineapples
Avocados
Mangoes
Papayas
5
64,706
9,800
6,641
4,459
1,198
Philippines and the United States (Hawaii), Together they account for around 98% of imports (table 3). Other
total papaya imports were 3,447

Japan Market Analysis – Fiji and Pacific Island Papaya
Table 3. 2008 statistics for major importers of papaya
Importingcountry Volume
(tonnes)
Philippines 2,626
Hawaii 812
Taiwan 9.5
According to Japanese papaya import statisticsin 2004 and 2007, respectively (table 4)was significantly higher than other major importing countries, apart from Taimore than double Filipino imports and 23% higher than the landed price of Hawaiian papaya.
2 figures derived from Japan Ministry of Finance statistics:
stat.go.jp/SG1/estat/OtherListE.do?bid=000001008801&cycode=1
76%
0.003%
Fiji and Pacific Island Papaya
. 2008 statistics for major importers of papaya2
(tonnes) Market share
76%
23%
.003%
panese papaya import statistics, Mexico and Fiji last imported papaya to Japan (table 4). As outlined in Table 4, the landed price of Fiji papaya
was significantly higher than other major importing countries, apart from Taiwan in 2007 more than double Filipino imports and 23% higher than the landed price of Hawaiian papaya.
from Japan Ministry of Finance statistics: http://www.e-stat.go.jp/SG1/estat/OtherListE.do?bid=000001008801&cycode=1
23%
Phillipines
Hawaii
Taiwan
6
, Mexico and Fiji last imported papaya to Japan , the landed price of Fiji papaya
wan in 2007 – at more than double Filipino imports and 23% higher than the landed price of Hawaiian papaya.
Japan Market Analysis – Fiji and Pacific Island Papaya
7
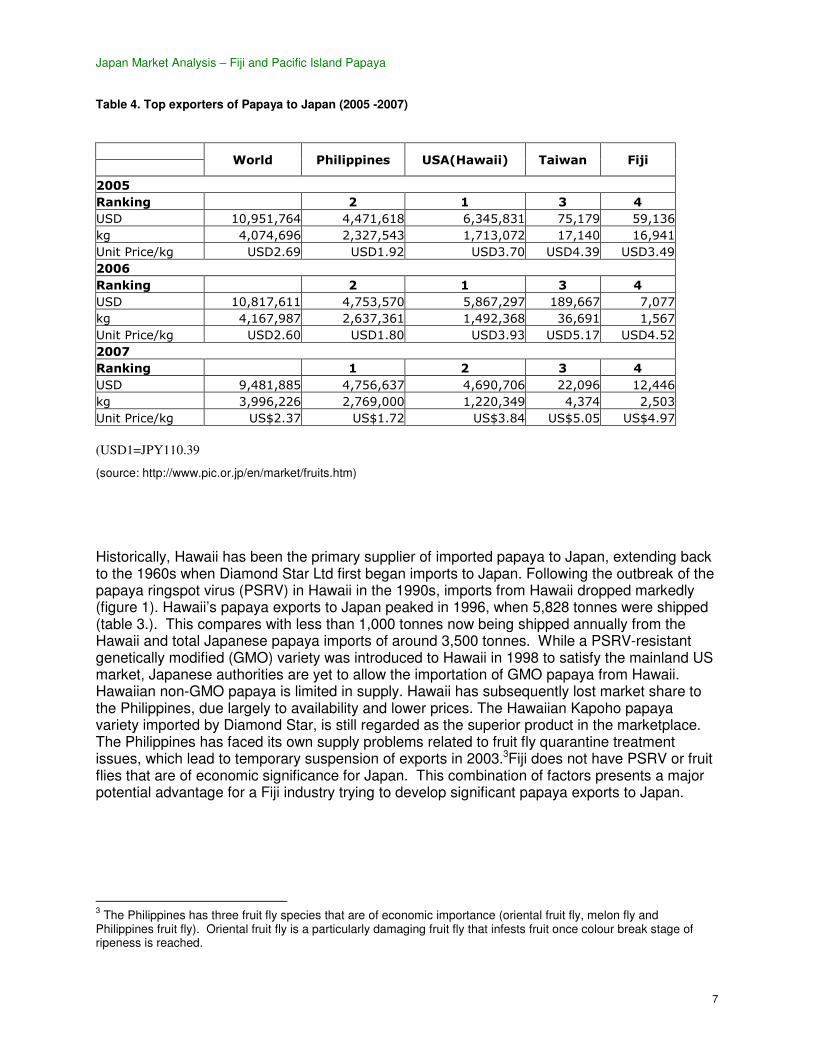
Table 4. Top exporters of Papaya to Japan (2005 -2007)
World Philippines USA(Hawaii) Taiwan Fiji
2005
Ranking 2 1 3 4
USD 10,951,764 4,471,618 6,345,831 75,179 59,136
kg 4,074,696 2,327,543 1,713,072 17,140 16,941
Unit Price/kg USD2.69 USD1.92 USD3.70 USD4.39 USD3.49
2006
Ranking 2 1 3 4
USD 10,817,611 4,753,570 5,867,297 189,667 7,077
kg 4,167,987 2,637,361 1,492,368 36,691 1,567
Unit Price/kg USD2.60 USD1.80 USD3.93 USD5.17 USD4.52
2007
Ranking 1 2 3 4
USD 9,481,885 4,756,637 4,690,706 22,096 12,446
kg 3,996,226 2,769,000 1,220,349 4,374 2,503
Unit Price/kg US$2.37 US$1.72 US$3.84 US$5.05 US$4.97
(USD1=JPY110.39
(source: http://www.pic.or.jp/en/market/fruits.htm)
Historically, Hawaii has been the primary supplier of imported papaya to Japan, extending back to the 1960s when Diamond Star Ltd first began imports to Japan. Following the outbreak of the papaya ringspot virus (PSRV) in Hawaii in the 1990s, imports from Hawaii dropped markedly (figure 1). Hawaii’s papaya exports to Japan peaked in 1996, when 5,828 tonnes were shipped (table 3.). This compares with less than 1,000 tonnes now being shipped annually from the Hawaii and total Japanese papaya imports of around 3,500 tonnes. While a PSRV-resistant genetically modified (GMO) variety was introduced to Hawaii in 1998 to satisfy the mainland US market, Japanese authorities are yet to allow the importation of GMO papaya from Hawaii. Hawaiian non-GMO papaya is limited in supply. Hawaii has subsequently lost market share to the Philippines, due largely to availability and lower prices. The Hawaiian Kapoho papaya variety imported by Diamond Star, is still regarded as the superior product in the marketplace. The Philippines has faced its own supply problems related to fruit fly quarantine treatment issues, which lead to temporary suspension of exports in 2003.3Fiji does not have PSRV or fruit flies that are of economic significance for Japan. This combination of factors presents a major potential advantage for a Fiji industry trying to develop significant papaya exports to Japan.
3 The Philippines has three fruit fly species that are of economic importance (oriental fruit fly, melon fly and
Philippines fruit fly). Oriental fruit fly is a particularly damaging fruit fly that infests fruit once colour break stage of ripeness is reached.

Japan Market Analysis – Fiji and Pacific Island Papaya
8
Figure 1. Japanese papaya import statistics for major countries 1998-20084
Figure 1 illustrates two significant trends in papaya imports to Japan:
• The substantial decline of imports from Hawaii and; • the entry of the Philippines as a significant supplier of papaya.
1.2.3 Fiji exports to Japan
Exports of Fiji papaya to Japan began in the early 1980s. The highest exports were achieved in 2003, peaking at 100 tonnes (figure 2). Exports to Japan have since been in steady decline, whereby there is currently no papaya exported to Japan from Fiji.
4 derived from Japan Ministry of Finance statistics: http://www.e-
stat.go.jp/SG1/estat/OtherListE.do?bid=000001008801&cycode=1
0
500
1000
1500
2000
2500
3000
3500
4000
4500
98 99 00 01 02 03 04 05 06 07 08
tonnes
Phillipines
USA
Mexico
Taiwan
Fiji

Japan Market Analysis – Fiji and Pacific Island Papaya
9
Figure 2. Fiji papaya exports 1996 -2008
1.2.4 Japan’s domestic papaya production
In terms of local production, recent years have seen an increase in local papaya production, from the warmer prefectures of Japan, namely Okinawa and Miyazaki. Trade statistics from 9 Tokyo wholesale markets indicate, this increase, against imports traded in the wholesale markets – peaking at 110 tonnes in 2007 (figure 3).While local production has risen against imports traded in the wholesale markets, these figures do not include the increasing number of importers that deal directly with large supermarkets.
0
50
100
150
200
250
300
350
400
450
New Zealand
Australia
Japan
Japan Market Analysis – Fiji and Pacific Island Papaya
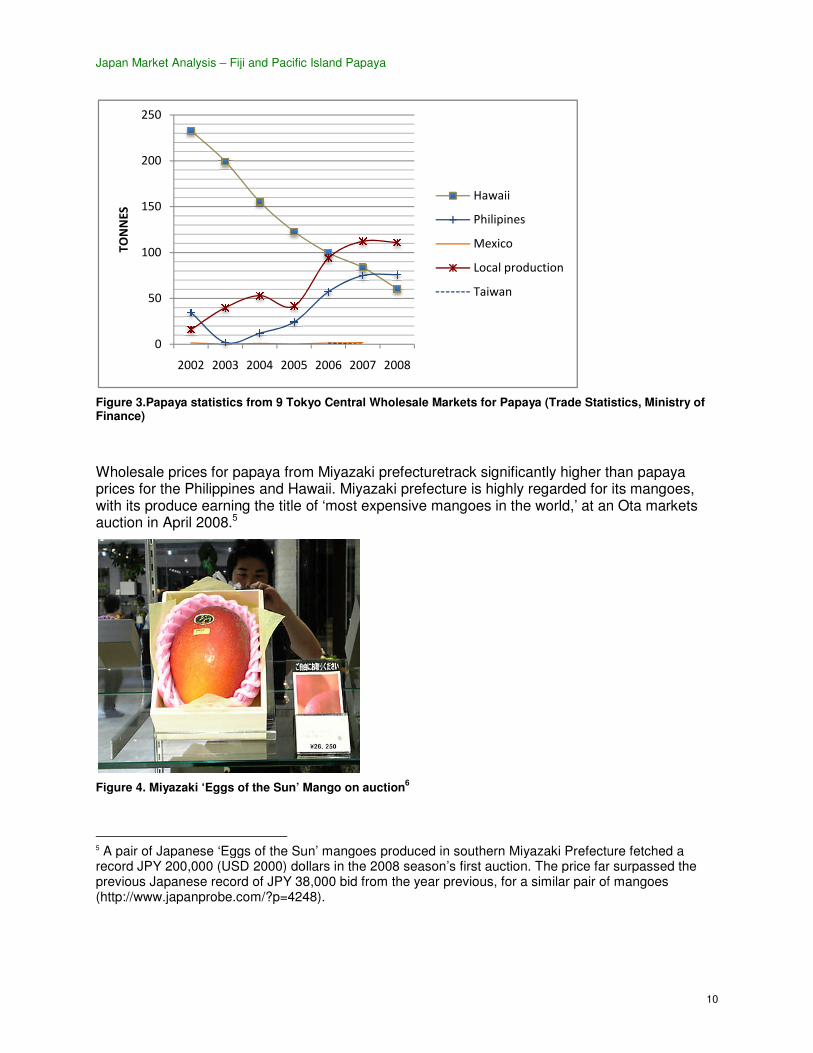
Figure 3.Papaya statistics from 9 Tokyo Central WholFinance)
Wholesale prices for papaya from prices for the Philippines and Hawaii. Miyazaki prefecture is hiwith its produce earning the title of auction in April 2008.5
Figure 4. Miyazaki ‘Eggs of the Sun’ Mango on
5 A pair of Japanese ‘Eggs of the Sun’ mangoesrecord JPY 200,000 (USD 2000) dollars in the 2008 season’s first auction. previous Japanese record of JPY 38,000 bid from the year previous, for a similar pair of mangoes (http://www.japanprobe.com/?p=4248).
0
50
100
150
200
250
2002 2003 2004 2005
TONNES
Fiji and Pacific Island Papaya
tatistics from 9 Tokyo Central Wholesale Markets for Papaya (Trade Statistics, Ministry of
or papaya from Miyazaki prefecturetrack significantly higher than pines and Hawaii. Miyazaki prefecture is highly regarded for its mangoes,
the title of ‘most expensive mangoes in the world,’ at an Ota markets
azaki ‘Eggs of the Sun’ Mango on auction6
A pair of Japanese ‘Eggs of the Sun’ mangoes produced in southern Miyazaki Prefecturerecord JPY 200,000 (USD 2000) dollars in the 2008 season’s first auction. The price far surpassed the previous Japanese record of JPY 38,000 bid from the year previous, for a similar pair of mangoes
://www.japanprobe.com/?p=4248).
2005 2006 2007 2008
Hawaii
Philipines
Mexico
Local production
Taiwan
10
esale Markets for Papaya (Trade Statistics, Ministry of
er than papaya ghly regarded for its mangoes,
at an Ota markets
produced in southern Miyazaki Prefecture fetched a The price far surpassed the
previous Japanese record of JPY 38,000 bid from the year previous, for a similar pair of mangoes
Japan Market Analysis – Fiji and Pacific Island Papaya
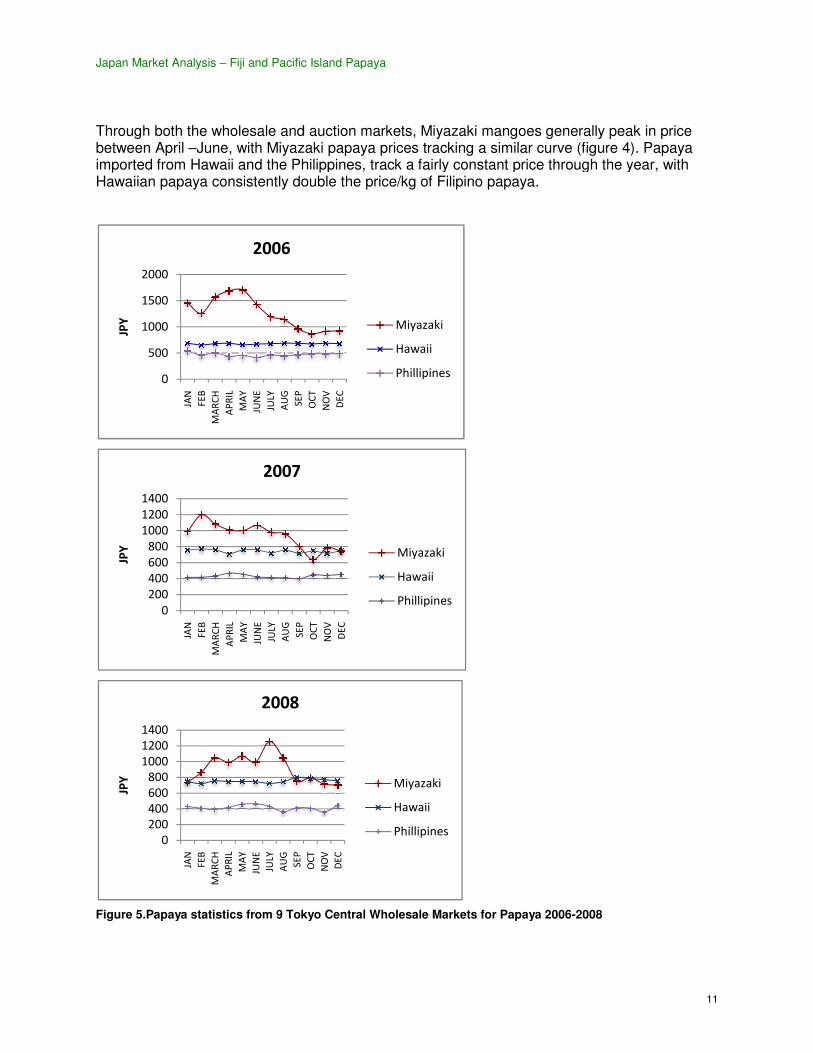
Through both the wholesale and auction between April –June, with Miyazaki papaya prices imported from Hawaii and the PhiliHawaiian papaya consistently doubl
Figure 5.Papaya statistics from 9 Tokyo Central Wholesale Markets for Papaya
0
500
1000
1500
2000
JAN
FE
B
MA
RC
H
AP
RIL
MA
Y
JUN
E
JULY
AU
G
SE
P
JPY
2006
0
200
400
600
800
1000
1200
1400
JAN
FE
B
MA
RC
H
AP
RIL
MA
Y
JUN
E
JULY
AU
G
SE
P
JPY
2007
0
200
400
600
800
1000
1200
1400
JAN
FE
B
MA
RC
H
AP
RIL
MA
Y
JUN
E
JULY
AU
G
SE
P
OC
T
JPY
2008
Fiji and Pacific Island Papaya
and auction markets, Miyazaki mangoes generally peak in price Miyazaki papaya prices tracking a similar curve (figure 4). Papaya
and the Philippines, track a fairly constant price through the year, with double the price/kg of Filipino papaya.
Papaya statistics from 9 Tokyo Central Wholesale Markets for Papaya 2006-2008
OC
T
NO
V
DE
C
Miyazaki
Hawaii
Phillipines
SE
P
OC
T
NO
V
DE
C
Miyazaki
Hawaii
Phillipines
OC
T
NO
V
DE
C
Miyazaki
Hawaii
Phillipines
11
markets, Miyazaki mangoes generally peak in price a similar curve (figure 4). Papaya
pines, track a fairly constant price through the year, with

Japan Market Analysis – Fiji and Pacific Island Papaya
1.3 The nature of the Japanese market
1.3.1 Consumer tastes
Pesante(2003) noted that consumer demand factors in the Japanese market includeof year, and quality. Fruits are traditionally eaten as a snack or given as gifts.generally and papaya specifically,December, where consumers will pay up to three times the to the ‘first of the season’ and unique and well packaged fruit to send to their loved ones acrossJapan. Fiji’s peak papaya production period from Octothe second gift-giving period. Importers, wholesalers and retailers interviewed for this study indicated an overall consumer preferencevarieties. This preference was attributed to the historical association that Japan has with Hawaiian Kapoho papaya – “consumers in Japan know papaya as yellow(Royal Co representatives, pers. comm.).
In broad terms, consumption of fresh and processed fruits in Japan steady in recent years – yearly consumption per person was 43.1 kg in representing a 3.9% growth from 2000 (ASEAN
Figure 6. Trends in the volume of consumption of fresh and proc
Despite overall growth in processed fruits and imports, fresh fruits as a percentage of the volume of total fruit supplied is declining that the percentage of fresh fruits had declined from 64% in 1995 to 51% in 20042001). Market analysts attribute this drop simplify meals, and thus a movement towards pre(ASEAN 2001, JETRO 2006,). Running concurrent with this trend is the proactive consumption of fruit amongst health-conscious middle
38
39
40
41
42
43
44
45
1990 1995 2000 2001
kg
Fiji and Pacific Island Papaya
The nature of the Japanese market
ted that consumer demand factors in the Japanese market includeare traditionally eaten as a snack or given as gifts. Demand for
generally and papaya specifically, peaks in Japan in the ‘gift-giving’ months of July and consumers will pay up to three times the normal price of fruit, to have access
to the ‘first of the season’ and unique and well packaged fruit to send to their loved ones acrossFiji’s peak papaya production period from October-December fortunately coincides with
Importers, wholesalers and retailers interviewed for this study preference for yellow-fleshed Kapoho papaya, over other papaya
as attributed to the historical association that Japan has with “consumers in Japan know papaya as yellow and bell shape
pers. comm.).
In broad terms, consumption of fresh and processed fruits in Japan has remained somewhat yearly consumption per person was 43.1 kg in the 2005
representing a 3.9% growth from 2000 (ASEAN 2001).
. Trends in the volume of consumption of fresh and processed fruits 1990-2005 (ASEAN 200
Despite overall growth in processed fruits and imports, fresh fruits as a percentage of the volume of total fruit supplied is declining - Japan Fruit Growers Association estimates indicate
uits had declined from 64% in 1995 to 51% in 2004. Market analysts attribute this drop to an increasing desire amongst Japanese youth to
simplify meals, and thus a movement towards pre-packaged, easy access meals and snacks ). Running concurrent with this trend is the proactive consumption
conscious middle-aged and senior Japanese (ASEAN 2001
2001 2002 2003 2004 2005
Unit volume per person
12
ted that consumer demand factors in the Japanese market include age, time Demand for fruit July and
normal price of fruit, to have access to the ‘first of the season’ and unique and well packaged fruit to send to their loved ones across
December fortunately coincides with Importers, wholesalers and retailers interviewed for this study
papaya, over other papaya as attributed to the historical association that Japan has with
bell shaped
has remained somewhat 2005 fiscal year,
(ASEAN 2001)
Despite overall growth in processed fruits and imports, fresh fruits as a percentage of the Japan Fruit Growers Association estimates indicate
uits had declined from 64% in 1995 to 51% in 2004 (ASEAN to an increasing desire amongst Japanese youth to
packaged, easy access meals and snacks ). Running concurrent with this trend is the proactive consumption
2001).
Unit volume per person

Japan Market Analysis – Fiji and Pacific Island Papaya
13
1.3.2 Food safety certification and product labelling requirements
Imported fresh and processed fruits are subject to a range of provisions under the Food Sanitation Law and the Japanese Agricultural Standards (JAS) Law, pertaining to food safety standards and labelling of agricultural and forestry products. Fresh fruits are also subject to phyto-sanitary requirements under the Plant Protection Law, which in recent years has severely impacted on exports from Philippines and increases the cost of papaya from Hawaii.
The procedural requirements under these laws are discussed briefly below.
Plant Protection Law
Figure 7. Plant Protection Law Procedures (JETRO 2006)
Food Sanitation Law The Food Sanitation Law defines residual agricultural chemical standards for all fresh fruit and processed fruits. Figure 5 defines procedures required under the Food Sanitation Law.
Figure 8. Procedures required under the Food Sanitation Law (JETRO 2006)
The Marketing Guidebook for Major Products 2006 notes that to expedite the quarantine clearance process, samples of the forthcoming products may be taken to laboratories registered
Japan Market Analysis – Fiji and Pacific Island Papaya
14
with relevant government agencies of the exporting countries. This requirement does not appear to currently apply to fresh exports of papaya from Fiji to Japan.
JAS Law
Under the JAS Law, fresh fruit is subject to Japan’s ‘Fresh Food Product Quality Labelling Standards.’ Under these standards, the following details are required on the container or packaging, or adjacent to the fresh fruit item, in a readily visible location:
1. Product name
2. Country of origin
3. Seller’s name and address (when selling in packaging or containers)
4. Net contents (when selling in packaging or containers)
(JETRO 2006)
For processed fruits, sealed in packaging or containers, the following details must be listed:
1. Product name
2. Country of origin
3. Net contents
4. Preservation method (if defined)
5. List of ingredients and food additives, if any
6. Best-before date
7. Importer’s name and address
(JETRO 2006)
Organic labelling requirements under the JAS Law are discussed in Section 1.3.6.
1.3.3 The structure of the Japanese papaya market: who are the buyers
The Japanese food retail sector accounts for JPY 424 billion worth of annual sales and generates 45% of total food retail consumption in the Asian region (Azuma and Fernie 2001). A range of regulatory factors related to unique consumer behaviours and a complex distribution system have prohibited international grocery retailers from entering the Japanese market. Over 80% of domestic fresh produce and approximately 40% of imported fresh produce are distributed through the 2000-odd wholesale markets in Japan (Jussaume 1994).Imported commodities sold through wholesale markets are generally not sold at auction. In general, sales are made directly via importing firms and market wholesalers. The primary reason is that price has been pre-determined, while prices in the auction markets move more frequently and with a greater degree of volatility (Jussaume 1994).In recent years, the increase in fresh fruit imports has led to an increase in distribution outside the wholesale market channel. Multinational companies and trading companies are noted as ‘absorbing wholesalers as affiliates while doing a greater degree of volume directly with large supermarkets’ (JETRO 2006). According to Japan’s Ministry of Agriculture, Forestry and Fisheries (MAFF) the percentage of fresh fruit handled via wholesalers is in decline; from 78 % in 1989 to 54 % in 2003 (ASEAN 2001).
Japan Market Analysis – Fiji and Pacific Island Papaya
15
In the food retail industry, imports and domestically produced fresh fruit are evenly purchased through the wholesale markets and outside the wholesale market channel. JETRO 2006 notes that 54.5% of domestically grown fruit and 43.5% of imports in 2005were purchased through the wholesale markets.The restaurant industry procured the largest percentage of fresh fruit from the retail food industry at 32.9% of domestically grown fruit and 27.6% of imports (JETRO 2006). These figures are of particular relevance to the Fiji industry if it is looking at marketing to the hotel and restaurant segment.
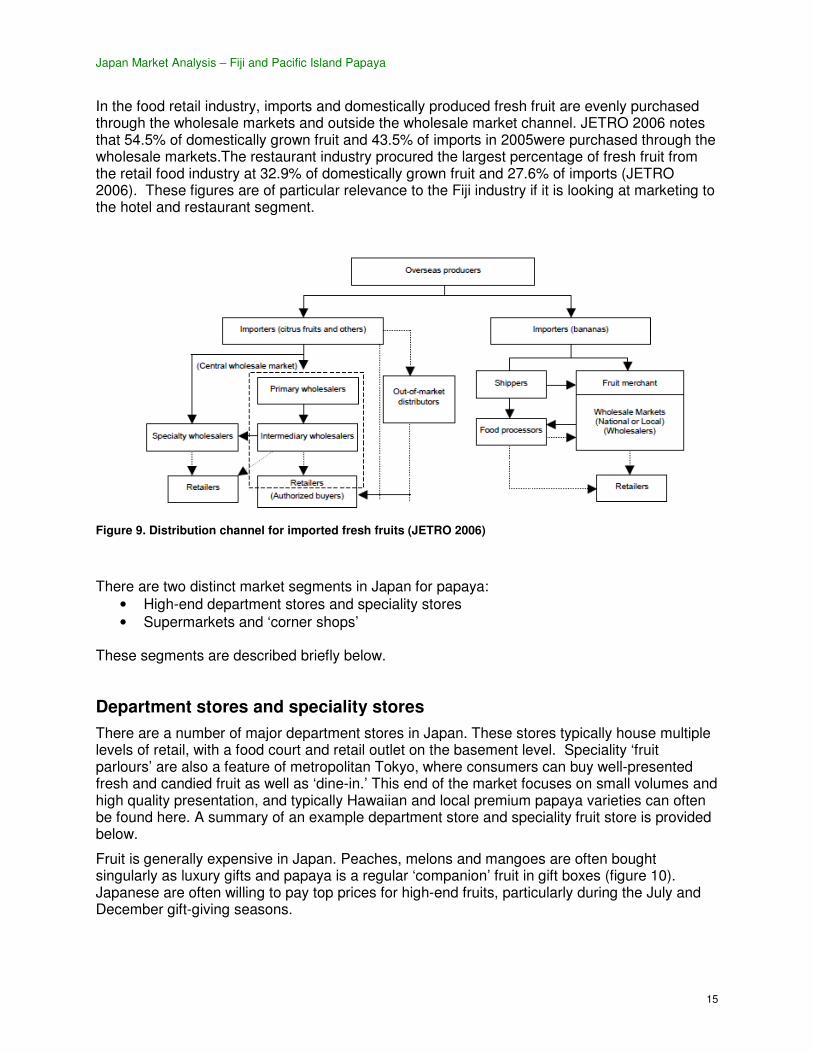
Figure 9. Distribution channel for imported fresh fruits (JETRO 2006)
There are two distinct market segments in Japan for papaya: • High-end department stores and speciality stores • Supermarkets and ‘corner shops’
These segments are described briefly below.
Department stores and speciality stores
There are a number of major department stores in Japan. These stores typically house multiple levels of retail, with a food court and retail outlet on the basement level. Speciality ‘fruit parlours’ are also a feature of metropolitan Tokyo, where consumers can buy well-presented fresh and candied fruit as well as ‘dine-in.’ This end of the market focuses on small volumes and high quality presentation, and typically Hawaiian and local premium papaya varieties can often be found here. A summary of an example department store and speciality fruit store is provided below.
Fruit is generally expensive in Japan. Peaches, melons and mangoes are often bought singularly as luxury gifts and papaya is a regular ‘companion’ fruit in gift boxes (figure 10). Japanese are often willing to pay top prices for high-end fruits, particularly during the July and December gift-giving seasons.
Japan Market Analysis – Fiji and Pacific Island Papaya
16
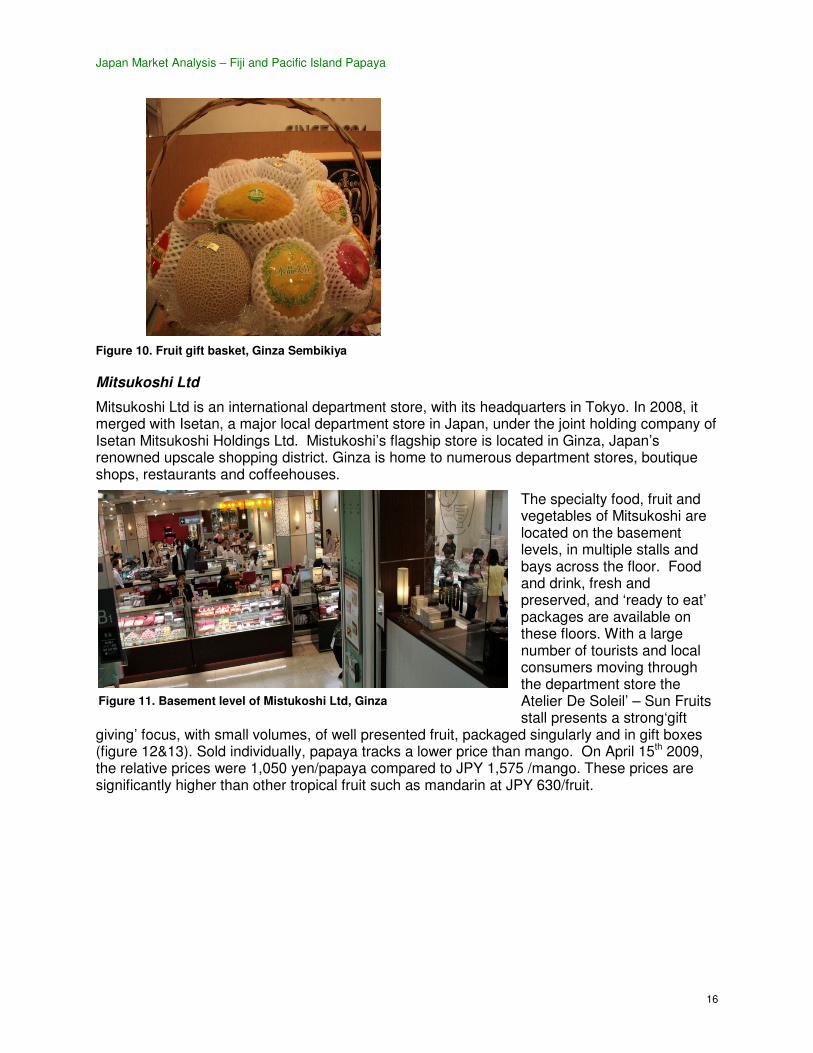
Figure 10. Fruit gift basket, Ginza Sembikiya
Mitsukoshi Ltd
Mitsukoshi Ltd is an international department store, with its headquarters in Tokyo. In 2008, it merged with Isetan, a major local department store in Japan, under the joint holding company of Isetan Mitsukoshi Holdings Ltd. Mistukoshi’s flagship store is located in Ginza, Japan’s renowned upscale shopping district. Ginza is home to numerous department stores, boutique shops, restaurants and coffeehouses.
The specialty food, fruit and vegetables of Mitsukoshi are located on the basement levels, in multiple stalls and bays across the floor. Food and drink, fresh and preserved, and ‘ready to eat’ packages are available on these floors. With a large number of tourists and local consumers moving through the department store the Atelier De Soleil’ – Sun Fruits stall presents a strong‘gift
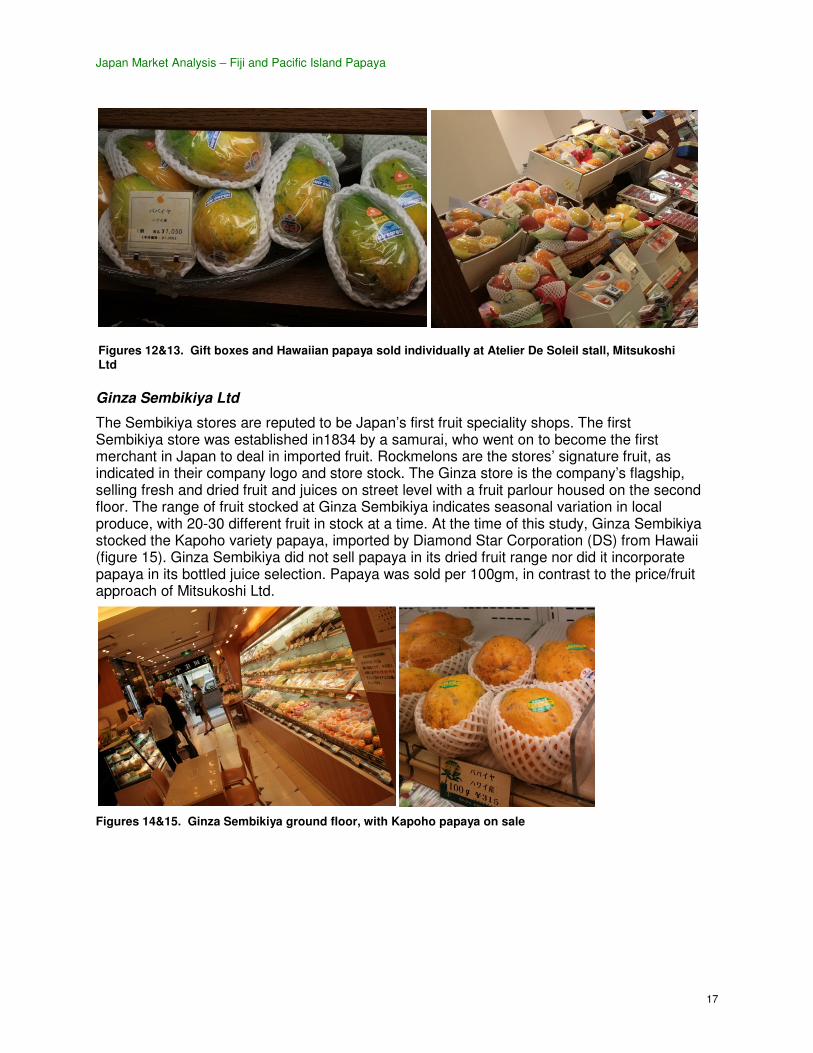
giving’ focus, with small volumes, of well presented fruit, packaged singularly and in gift boxes (figure 12&13). Sold individually, papaya tracks a lower price than mango. On April 15th 2009, the relative prices were 1,050 yen/papaya compared to JPY 1,575 /mango. These prices are significantly higher than other tropical fruit such as mandarin at JPY 630/fruit.
Figure 11. Basement level of Mistukoshi Ltd, Ginza
Japan Market Analysis – Fiji and Pacific Island Papaya
17
Ginza Sembikiya Ltd
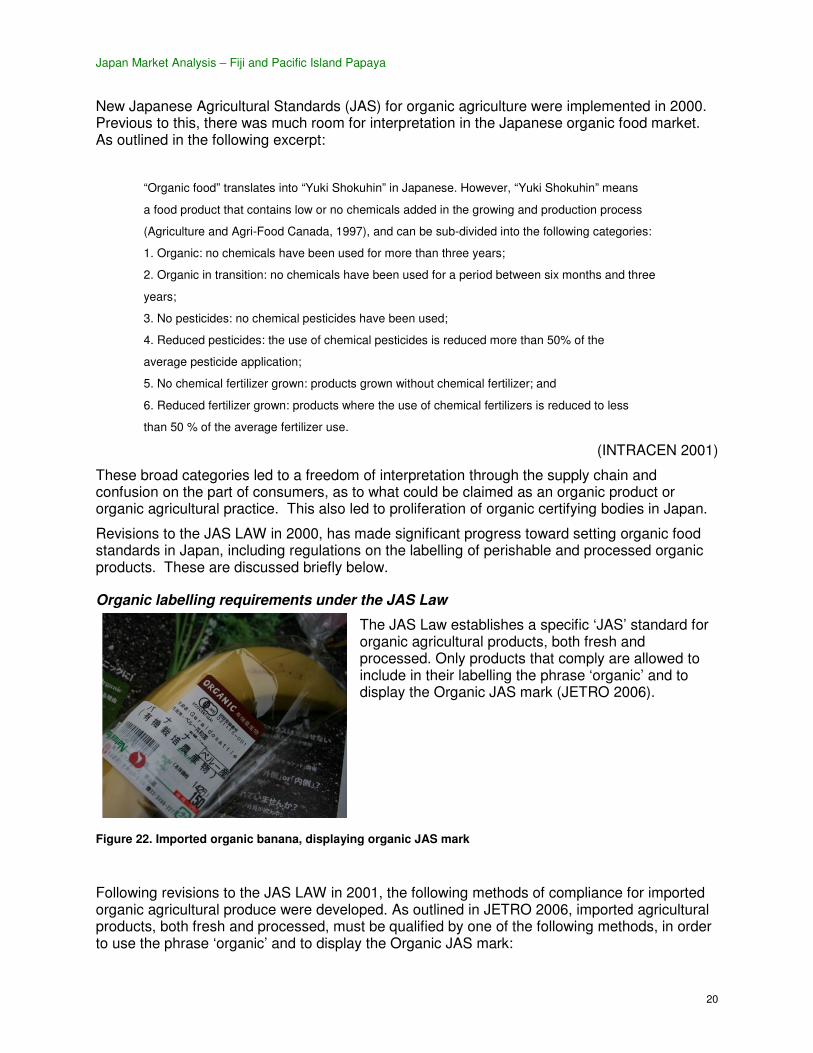
The Sembikiya stores are reputed to be Japan’s first fruit speciality shops. The first Sembikiya store was established in1834 by a samurai, who went on to become the first merchant in Japan to deal in imported fruit. Rockmelons are the stores’ signature fruit, as indicated in their company logo and store stock. The Ginza store is the company’s flagship, selling fresh and dried fruit and juices on street level with a fruit parlour housed on the second floor. The range of fruit stocked at Ginza Sembikiya indicates seasonal variation in local produce, with 20-30 different fruit in stock at a time. At the time of this study, Ginza Sembikiya stocked the Kapoho variety papaya, imported by Diamond Star Corporation (DS) from Hawaii (figure 15). Ginza Sembikiya did not sell papaya in its dried fruit range nor did it incorporate papaya in its bottled juice selection. Papaya was sold per 100gm, in contrast to the price/fruit approach of Mitsukoshi Ltd.
Figures 14&15. Ginza Sembikiya ground floor, with Kapoho papaya on sale
Figures 12&13. Gift boxes and Hawaiian papaya sold individually at Atelier De Soleil stall, Mitsukoshi Ltd

Japan Market Analysis – Fiji and Pacific Island Papaya
18
Mr. Kenji Komiya, senior importer with Ginza Sembikiya outlined that the store had been dealing with papaya for over a decade, selling produce from both the Philippines and Hawaii. At the time
of this study, Ginza Sembikiya were only dealing in Hawaiian varieties. As a speciality fruit store, consumption trends at Ginza Sembikiya correlated with the gift-giving months of July and December. Sales in singular and fruit boxes increase three-fold in this3-4 week period. Outside of the peak season, Ginza Sembikiya purchased an estimated 150 papaya/week, through ‘nakagai’ or middlemen, who in turn buy from primary wholesalers. Fruit is sold at the ‘1/2 ripe’ stage, with the intent that fruit can be consumed within 4-5 days from placement on the retail shelf.
Mr. Komiya perceived the demand trend for papaya was low with Japanese consumers, whom he described as fairly conservative with their fruit eating. From his perspective, papaya was generally popular with women over 40, who generally valued the ‘mild’ aroma of papaya. Mr. Komiya was uncertain about the long-term demand for papaya, noting that he was not particularly enamoured with its flavour himself. Mr. Komiya’s experience with Fiji papaya was limited to a 2008 trade show – in his time at Sembikiya, they had not retailed Fiji papaya. His opinion of Fiji papaya was that “it was ok, not much different from what we’re already selling apart from being a little sweeter” (pers. comm.). Within the recently opened fruit parlour, papaya was presented in a mixed fruit salad form, and not served singularly.
Figure 17. Kapoho papaya, prepared in fruit parlour for interview
Figure 16. Dried fruit and bottled juice selection

Japan Market Analysis – Fiji and Pacific Island Papaya
19
Supermarkets and corner shops
The main general merchandising stores (GMS) in Japan include Ito-Yokoda, Daiei and Aeon, with food accounting for approximately 60% of total revenue of these stores(Worsely 2008). Smaller grocers are also common through Tokyo’s business and hotel districts, including
Maruetsu and Azuma.
Figures18&19. Azuma supermarket, with Hawaiian papaya sold individually
The GMS have shares in the smaller grocers, with Aeon having a 33% stake in Maruetsu. Fruit is generally cheaper in these retailers than in the department stores, with Maruetsu and Azuma both selling solo varieties imported from Hawaii. Philippine papaya was not observed in the supermarkets visited.
Figures 20&21. Maruetsu supermarket, with Hawaiian Queen imported papaya sold by weight
Organics: a potential market niche?
Fiji grows non-GMO papaya varieties and does not use chemicals or irradiation as a quarantine treatment. On this basis, a substantial market opportunity was identified in the United States for organic papaya from Fiji. It is thought that there might be a similar opportunity in Japan for organic papaya.
Japan Market Analysis – Fiji and Pacific Island Papaya
20
New Japanese Agricultural Standards (JAS) for organic agriculture were implemented in 2000. Previous to this, there was much room for interpretation in the Japanese organic food market. As outlined in the following excerpt:
“Organic food” translates into “Yuki Shokuhin” in Japanese. However, “Yuki Shokuhin” means
a food product that contains low or no chemicals added in the growing and production process
(Agriculture and Agri-Food Canada, 1997), and can be sub-divided into the following categories:
1. Organic: no chemicals have been used for more than three years;
2. Organic in transition: no chemicals have been used for a period between six months and three
years;
3. No pesticides: no chemical pesticides have been used;
4. Reduced pesticides: the use of chemical pesticides is reduced more than 50% of the
average pesticide application;
5. No chemical fertilizer grown: products grown without chemical fertilizer; and
6. Reduced fertilizer grown: products where the use of chemical fertilizers is reduced to less
than 50 % of the average fertilizer use.
(INTRACEN 2001)
These broad categories led to a freedom of interpretation through the supply chain and confusion on the part of consumers, as to what could be claimed as an organic product or organic agricultural practice. This also led to proliferation of organic certifying bodies in Japan.
Revisions to the JAS LAW in 2000, has made significant progress toward setting organic food standards in Japan, including regulations on the labelling of perishable and processed organic products. These are discussed briefly below.
Organic labelling requirements under the JAS Law
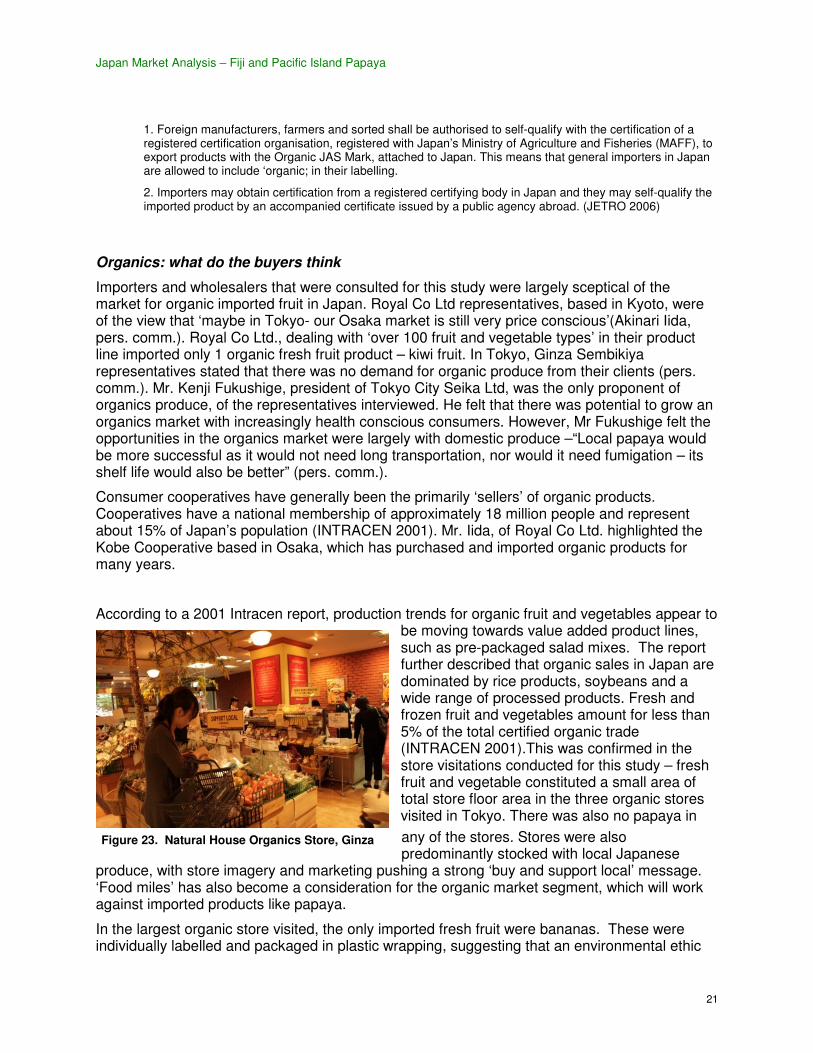
The JAS Law establishes a specific ‘JAS’ standard for organic agricultural products, both fresh and processed. Only products that comply are allowed to include in their labelling the phrase ‘organic’ and to display the Organic JAS mark (JETRO 2006).
Figure 22. Imported organic banana, displaying organic JAS mark
Following revisions to the JAS LAW in 2001, the following methods of compliance for imported organic agricultural produce were developed. As outlined in JETRO 2006, imported agricultural products, both fresh and processed, must be qualified by one of the following methods, in order to use the phrase ‘organic’ and to display the Organic JAS mark:
Japan Market Analysis – Fiji and Pacific Island Papaya
21
1. Foreign manufacturers, farmers and sorted shall be authorised to self-qualify with the certification of a registered certification organisation, registered with Japan’s Ministry of Agriculture and Fisheries (MAFF), to export products with the Organic JAS Mark, attached to Japan. This means that general importers in Japan are allowed to include ‘organic; in their labelling.
2. Importers may obtain certification from a registered certifying body in Japan and they may self-qualify the imported product by an accompanied certificate issued by a public agency abroad. (JETRO 2006)
Organics: what do the buyers think
Importers and wholesalers that were consulted for this study were largely sceptical of the market for organic imported fruit in Japan. Royal Co Ltd representatives, based in Kyoto, were of the view that ‘maybe in Tokyo- our Osaka market is still very price conscious’(Akinari Iida, pers. comm.). Royal Co Ltd., dealing with ‘over 100 fruit and vegetable types’ in their product line imported only 1 organic fresh fruit product – kiwi fruit. In Tokyo, Ginza Sembikiya representatives stated that there was no demand for organic produce from their clients (pers. comm.). Mr. Kenji Fukushige, president of Tokyo City Seika Ltd, was the only proponent of organics produce, of the representatives interviewed. He felt that there was potential to grow an organics market with increasingly health conscious consumers. However, Mr Fukushige felt the opportunities in the organics market were largely with domestic produce –“Local papaya would be more successful as it would not need long transportation, nor would it need fumigation – its shelf life would also be better” (pers. comm.).
Consumer cooperatives have generally been the primarily ‘sellers’ of organic products. Cooperatives have a national membership of approximately 18 million people and represent about 15% of Japan’s population (INTRACEN 2001). Mr. Iida, of Royal Co Ltd. highlighted the Kobe Cooperative based in Osaka, which has purchased and imported organic products for many years.
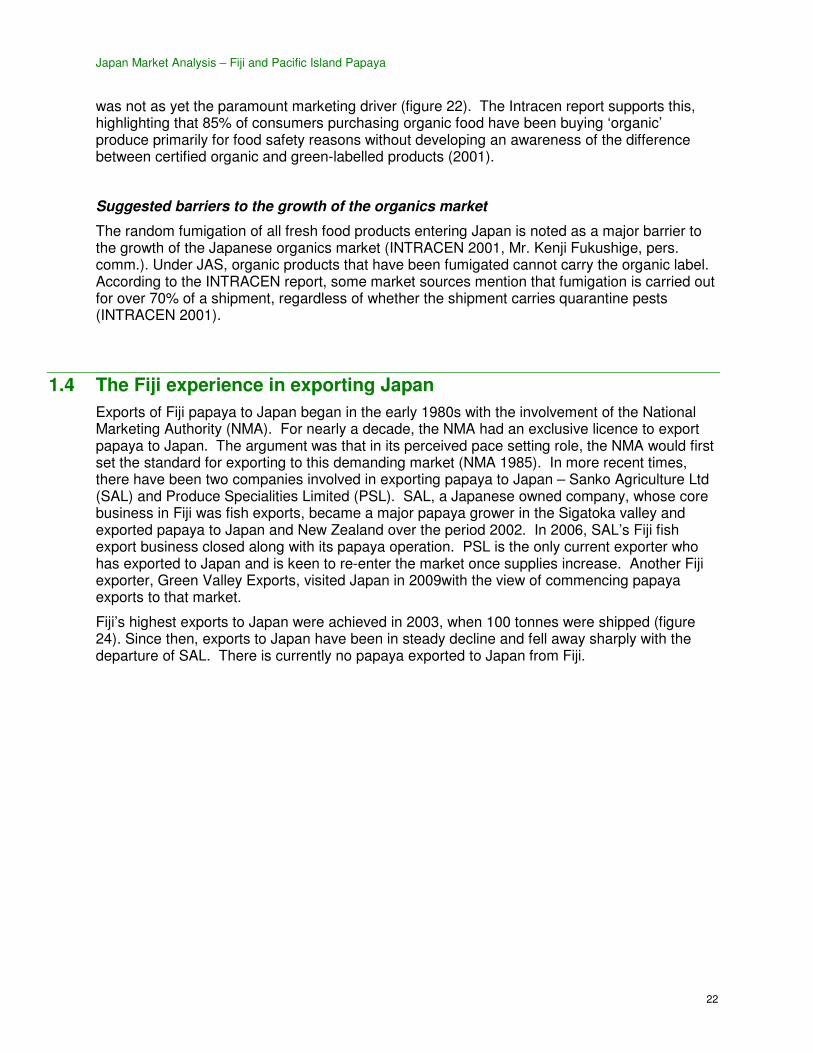
According to a 2001 Intracen report, production trends for organic fruit and vegetables appear to be moving towards value added product lines, such as pre-packaged salad mixes. The report further described that organic sales in Japan are dominated by rice products, soybeans and a wide range of processed products. Fresh and frozen fruit and vegetables amount for less than 5% of the total certified organic trade (INTRACEN 2001).This was confirmed in the store visitations conducted for this study – fresh fruit and vegetable constituted a small area of total store floor area in the three organic stores visited in Tokyo. There was also no papaya in
any of the stores. Stores were also predominantly stocked with local Japanese
produce, with store imagery and marketing pushing a strong ‘buy and support local’ message. ‘Food miles’ has also become a consideration for the organic market segment, which will work against imported products like papaya.
In the largest organic store visited, the only imported fresh fruit were bananas. These were individually labelled and packaged in plastic wrapping, suggesting that an environmental ethic
Figure 23. Natural House Organics Store, Ginza
Japan Market Analysis – Fiji and Pacific Island Papaya
22
was not as yet the paramount marketing driver (figure 22). The Intracen report supports this, highlighting that 85% of consumers purchasing organic food have been buying ‘organic’ produce primarily for food safety reasons without developing an awareness of the difference between certified organic and green-labelled products (2001).
Suggested barriers to the growth of the organics market
The random fumigation of all fresh food products entering Japan is noted as a major barrier to the growth of the Japanese organics market (INTRACEN 2001, Mr. Kenji Fukushige, pers. comm.). Under JAS, organic products that have been fumigated cannot carry the organic label. According to the INTRACEN report, some market sources mention that fumigation is carried out for over 70% of a shipment, regardless of whether the shipment carries quarantine pests (INTRACEN 2001).
1.4 The Fiji experience in exporting Japan
Exports of Fiji papaya to Japan began in the early 1980s with the involvement of the National Marketing Authority (NMA). For nearly a decade, the NMA had an exclusive licence to export papaya to Japan. The argument was that in its perceived pace setting role, the NMA would first set the standard for exporting to this demanding market (NMA 1985). In more recent times, there have been two companies involved in exporting papaya to Japan – Sanko Agriculture Ltd (SAL) and Produce Specialities Limited (PSL). SAL, a Japanese owned company, whose core business in Fiji was fish exports, became a major papaya grower in the Sigatoka valley and exported papaya to Japan and New Zealand over the period 2002. In 2006, SAL’s Fiji fish export business closed along with its papaya operation. PSL is the only current exporter who has exported to Japan and is keen to re-enter the market once supplies increase. Another Fiji exporter, Green Valley Exports, visited Japan in 2009with the view of commencing papaya exports to that market.
Fiji’s highest exports to Japan were achieved in 2003, when 100 tonnes were shipped (figure 24). Since then, exports to Japan have been in steady decline and fell away sharply with the departure of SAL. There is currently no papaya exported to Japan from Fiji.

Japan Market Analysis – Fiji and Pacific Island Papaya
23
Figure 24. Fiji papaya exports 1996 -2008
Two importers with previous experience with Fiji papaya were consulted for this market study. These were Royal Co. Limited and Diamond Star Corporation. Royal’s experience with Fiji papaya was the most recent, with discussions with Produce Speciality Limited(PSL)stalling following the Fiji January floods 2009. As outlined by Mr. Akinari Iida, Overseas Business Division Manager for Royal the intention was to air-freight papaya via Korean Air, targeting the high end retailers, such as Sembikiya Ltd. Contacts had been forged with Sembikiya and their buyer at the time had shown particular interest in Fiji papaya. Royal subsequently developed visual presentations to market Fiji papaya. Royal have not heard from PSL since the January floods. Mr. Iida, who personally had a high regard for the Fiji red papaya product, lamented that this was an unfortunate lost opportunity for the Fiji papaya industry (pers. comm.). However, Royal remains open for reengagement.
Vinning (2008) noted that the continued success of Fiji papaya on the Japanese market depended on:
• Growing Hawaiian (yellow fleshed) varieties; • High grading standards; • Uniformity of fruit size (interviews confirmed that the size should be 550 gm per fruit);
and, • Careful packaging, with fruit individually wrapped in mesh-knit sleeves and separated by
dividers(interviews confirmed that the packaging should be 5 kg cartons, with 8-9 fruit per carton).
In addition to these points, Royal and DS concurred on the following key requirement of Fiji papaya are consistent supply, both in volume and quality
0
50
100
150
200
250
300
350
400
450
New Zealand
Australia
Japan
Japan Market Analysis – Fiji and Pacific Island Papaya
24
1.5 The competition: how does Fijian papaya compare?
An assessment of Fiji’s competitors on the Japanese papaya market is made below.
1.5.1 Hawaii
The product
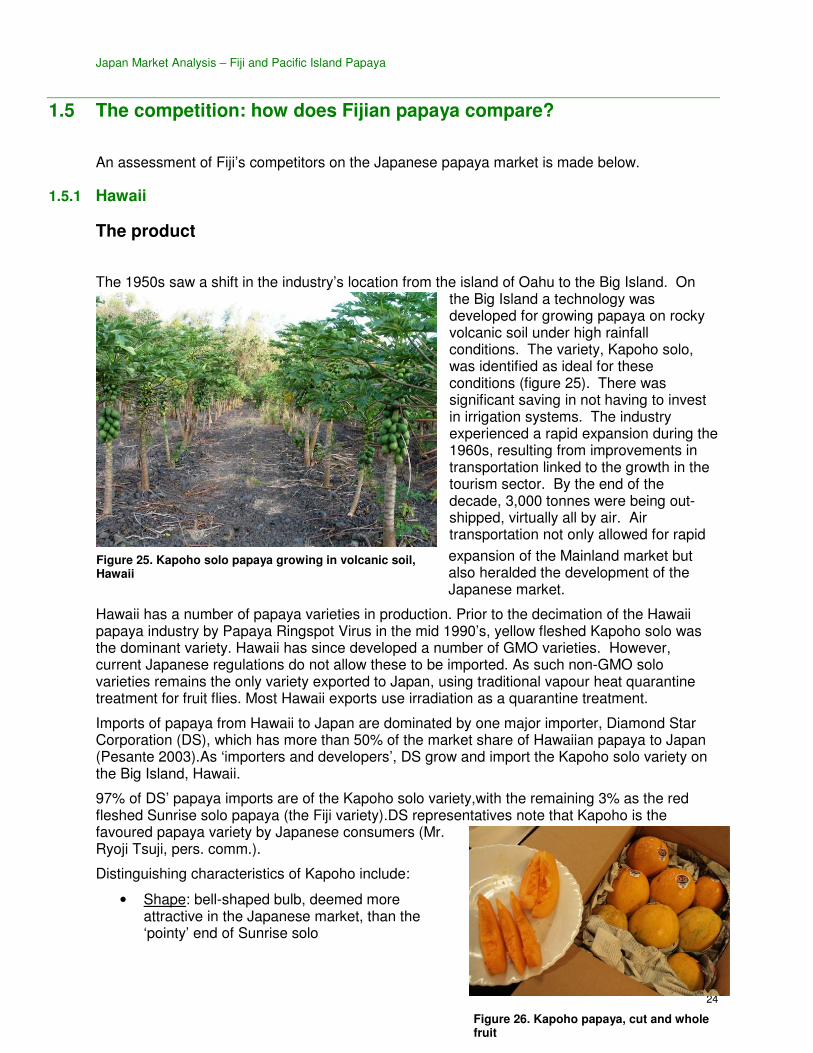
The 1950s saw a shift in the industry’s location from the island of Oahu to the Big Island. On the Big Island a technology was developed for growing papaya on rocky volcanic soil under high rainfall conditions. The variety, Kapoho solo, was identified as ideal for these conditions (figure 25). There was significant saving in not having to invest in irrigation systems. The industry experienced a rapid expansion during the 1960s, resulting from improvements in transportation linked to the growth in the tourism sector. By the end of the decade, 3,000 tonnes were being out-shipped, virtually all by air. Air transportation not only allowed for rapid
expansion of the Mainland market but also heralded the development of the Japanese market.
Hawaii has a number of papaya varieties in production. Prior to the decimation of the Hawaii papaya industry by Papaya Ringspot Virus in the mid 1990’s, yellow fleshed Kapoho solo was the dominant variety. Hawaii has since developed a number of GMO varieties. However, current Japanese regulations do not allow these to be imported. As such non-GMO solo varieties remains the only variety exported to Japan, using traditional vapour heat quarantine treatment for fruit flies. Most Hawaii exports use irradiation as a quarantine treatment.
Imports of papaya from Hawaii to Japan are dominated by one major importer, Diamond Star Corporation (DS), which has more than 50% of the market share of Hawaiian papaya to Japan (Pesante 2003).As ‘importers and developers’, DS grow and import the Kapoho solo variety on the Big Island, Hawaii.
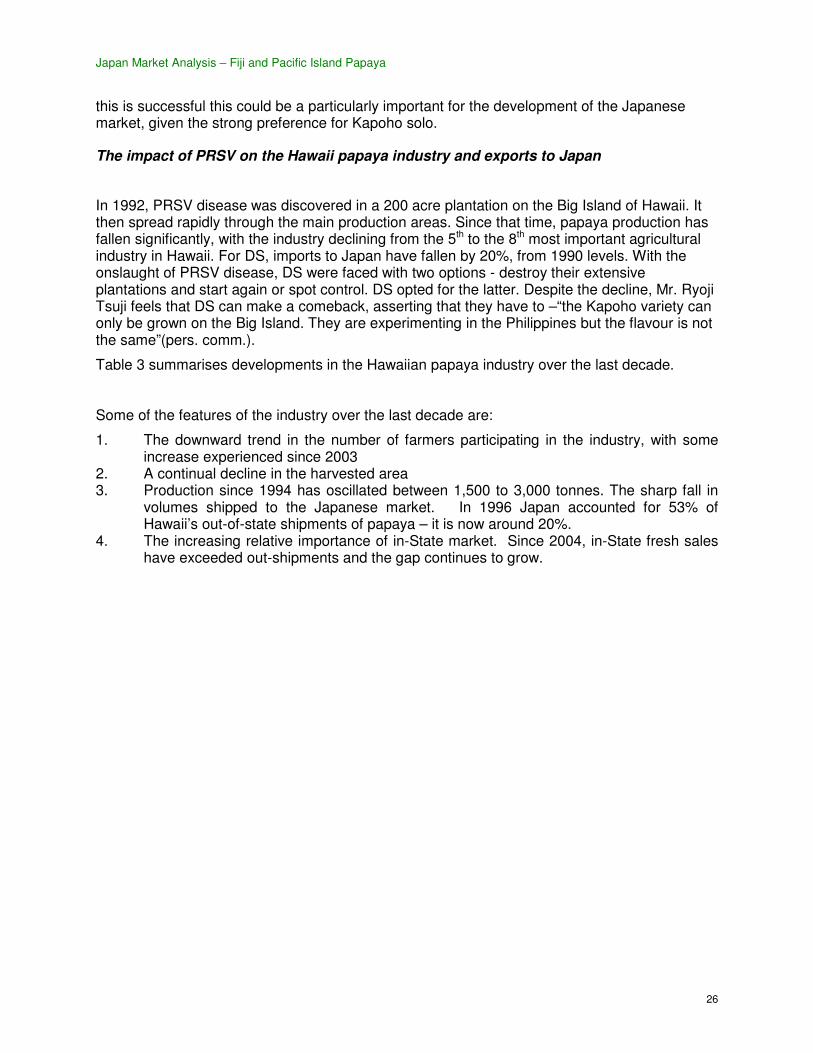
97% of DS’ papaya imports are of the Kapoho solo variety,with the remaining 3% as the red fleshed Sunrise solo papaya (the Fiji variety).DS representatives note that Kapoho is the favoured papaya variety by Japanese consumers (Mr. Ryoji Tsuji, pers. comm.).
Distinguishing characteristics of Kapoho include:
• Shape: bell-shaped bulb, deemed more attractive in the Japanese market, than the ‘pointy’ end of Sunrise solo
Figure 26. Kapoho papaya, cut and whole fruit
Figure 25. Kapoho solo papaya growing in volcanic soil, Hawaii

Japan Market Analysis – Fiji and Pacific Island Papaya
25
• size: 500-550 gm/fruit
• Taste: mild flavour that is not overpowering “like mango can sometimes be” (Mr. Ryoji Tsuji, pers. comm.).
A further favourable characteristic of Kapoho papaya is the consistency of production volumes, as noted by Mr. Ryoji Tsuji, General Manager, Sales, at Diamond Star Corporation -“the Kapoho variety is also good because it is consistent, while Sunrise solo isn’t, from all markets, including Hawaii” (pers. comm).
Across all solo varieties, Hawaiian papayas are sold in 5 kg boxes with only hermaphrodite (bell shaped) fruit. Fruit are individually wrapped in newspaper or plastic netting and have individual stickers that identify the origin and the importer.
Figure 27&28. Hawaiian Queen imported papaya packaging and labelling, Tsukuji Markets
Figure 29. Diamond Star imported papaya, upon arrival at retailer, Ginza
The Kapoho solo variety that grows in lava rock on the Hawaii Big Island, has not performed well when grown under Fiji conditions. The variety was found to be particularly susceptible to phytophthora root rot when grown in soil in Fiji and elsewhere. In contrast, the Sunrise solo variety was found to perform particularly well under Fiji conditions. However, the ACIAR Fiji Papaya plans to relook at developing a package of practices for growing Kapoho solo in Fiji. If
Japan Market Analysis – Fiji and Pacific Island Papaya
26
this is successful this could be a particularly important for the development of the Japanese market, given the strong preference for Kapoho solo.
The impact of PRSV on the Hawaii papaya industry and exports to Japan
In 1992, PRSV disease was discovered in a 200 acre plantation on the Big Island of Hawaii. It then spread rapidly through the main production areas. Since that time, papaya production has fallen significantly, with the industry declining from the 5th to the 8th most important agricultural industry in Hawaii. For DS, imports to Japan have fallen by 20%, from 1990 levels. With the onslaught of PRSV disease, DS were faced with two options - destroy their extensive plantations and start again or spot control. DS opted for the latter. Despite the decline, Mr. Ryoji Tsuji feels that DS can make a comeback, asserting that they have to –“the Kapoho variety can only be grown on the Big Island. They are experimenting in the Philippines but the flavour is not the same”(pers. comm.).
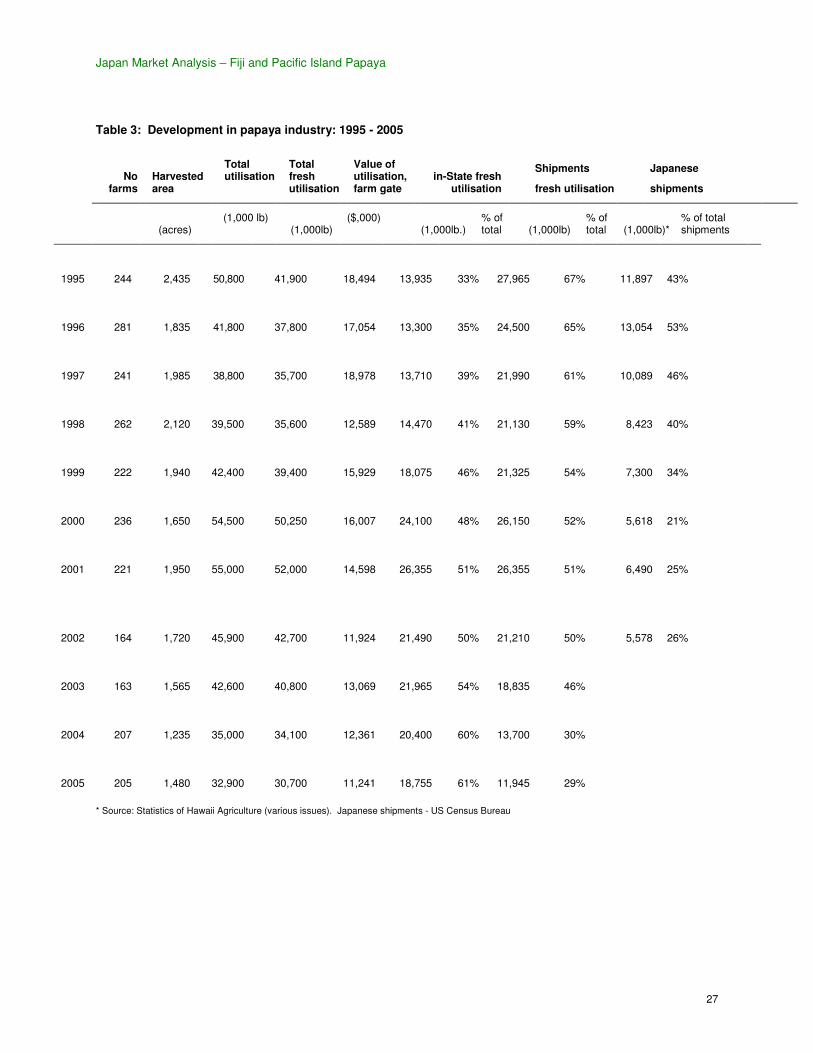
Table 3 summarises developments in the Hawaiian papaya industry over the last decade.
Some of the features of the industry over the last decade are:
1. The downward trend in the number of farmers participating in the industry, with some increase experienced since 2003
2. A continual decline in the harvested area 3. Production since 1994 has oscillated between 1,500 to 3,000 tonnes. The sharp fall in
volumes shipped to the Japanese market. In 1996 Japan accounted for 53% of Hawaii’s out-of-state shipments of papaya – it is now around 20%.
4. The increasing relative importance of in-State market. Since 2004, in-State fresh sales have exceeded out-shipments and the gap continues to grow.
Japan Market Analysis – Fiji and Pacific Island Papaya
27
Table 3: Development in papaya industry: 1995 - 2005
No
farms Harvested area
Total utilisation
Total fresh utilisation
Value of utilisation, farm gate
in-State fresh utilisation
Shipments
fresh utilisation
Japanese
shipments
(acres) (1,000 lb)
(1,000lb) ($,000)
(1,000lb.) % of total (1,000lb)
% of total (1,000lb)*
% of total shipments
1995 244 2,435
50,800 41,900
18,494 13,935 33% 27,965 67% 11,897 43%
1996 281 1,835
41,800 37,800
17,054 13,300 35% 24,500 65% 13,054 53%
1997 241 1,985
38,800 35,700
18,978 13,710 39% 21,990 61% 10,089 46%
1998 262 2,120
39,500 35,600
12,589 14,470 41% 21,130 59% 8,423 40%
1999 222 1,940
42,400 39,400
15,929 18,075 46% 21,325 54% 7,300 34%
2000 236 1,650
54,500 50,250
16,007 24,100 48% 26,150 52% 5,618 21%
2001
221
1,950
55,000
52,000
14,598 26,355
51%
26,355
51%
6,490
25%
2002 164 1,720
45,900 42,700
11,924 21,490 50% 21,210 50% 5,578 26%
2003 163 1,565
42,600 40,800
13,069 21,965 54% 18,835 46%
2004 207 1,235
35,000 34,100
12,361 20,400 60% 13,700 30%
2005 205 1,480
32,900 30,700
11,241 18,755 61% 11,945 29%
* Source: Statistics of Hawaii Agriculture (various issues). Japanese shipments - US Census Bureau

Japan Market Analysis – Fiji and Pacific Island Papaya
28
Medium term industry prospects for Hawaii papaya
Of all fruit consumed in Japan, papaya is perceived as a uniquely Hawaiian product.It is not uncommon for solo papaya types to be referred to as ‘Hawaiian papaya’ regardless of source. This quintessential Hawaiian image somewhat enshrines the Hawaiian papaya product in the marketplace.
The regulatory requirements of the Japanese market are as such that Hawaiian papaya faces the twin barriers of the non-acceptance of irradiation and genetic modification. However, major importer Diamond Star Corporation have developed vapour heat treatment facilities and through spot control of PRSV, have been able to maintain their non-GMO plantations, albeit at significantly reduced levels. Furthermore, DS have developed systems for ‘fixing’ fruit colour, according to what colour they want it to be on arrival in Japan (figure 30).
An assessment of Fiji competitive position with respect to papaya from Hawaii
The major advantages of Hawaii papaya
Papaya from Hawaii shipped to Japan has a number of major advantages compared with Fiji papaya:
1. Hawaiian papaya is well known in the Japanese market Importers and high-end retailers expressed a familiarity and preference for Hawaiian yellow Kapoho papaya. Hawaii is also a favourite holiday destination for many Japanese and there is certain ‘nostalgia and romance’ attached to Hawaiian products.
2. Substantially reduced transportation costs for Hawaii papaya
Papaya from Hawaii is shipped to Japan by air freight. With daily flights between Japan and Hawaii, Japanese importers benefit from significantly reduced air freight rates due to the large volumes of available capacity returning from Hawaii to Japan.
3. Infrastructure and marketing system already in place to handle large volumes The Hawaiian papaya industry, and DS in particular, have been serving the Japanese market for 40 years and have good supply chain systems in place. While the impacts of PSRV have been marked, the system delivers a reliable supply of fruit of consistent quality. PSRV has become reasonably under control with the implementation of appropriate management systems. While Diamond Star experimented with importing Fiji
Figure 30. DS papaya packaging, indicating fruit count and stage of ripeness

Japan Market Analysis – Fiji and Pacific Island Papaya
29
papaya in the late 1990s, they found both quality and production levels were not as high, nor consistent as Hawaii.
1.5.2 Philippines: the dominant player on the market
Over the period 1999 to 2004, the Philippines produced an average of 77,000 tonnes of papaya - making it the world’s 14th largest papaya producer (JETRO 2006). In the early 1990s, the Philippines were able to negotiate a bilateral quarantine agreement with Japan for the export of papaya using the Japanese technology vapour heat treatment for fruit flies. Since then,Japan has become the dominant export market for Philippine papaya. Over the period 1999-2004, 93% of the Philippines papaya exports went to Japan (JETRO 2006).The multi-national enterprises of Dole and Sumitomo Fruits have steadily expanded production and export of papaya from the Philippines, in conjunction with banana exports. As noted by Mr. Akinari Iida, of Royal Co Limited, an estimated 70% of Dole papaya is shipped with banana, with 30% of Sumitomo papaya shipped with banana. Shipping generally takes a relatively short 4-5 days, which provides a major cost advantage when compared with air freighted fruit from Hawaii or Fiji.
Papaya imported from the Philippines is a yellow fleshed solo-type variety. Philippine papaya products have successfully infiltrated the Japanese market, with a cheap product in constant supply. As such, Philippine papaya is generally sold in the supermarkets and not high end retailers, at half the wholesale and retail price of Hawaiian
papaya. Diamond Star sales representatives concede that the future of Philippine papaya production is bright, as both Dole and Sumimoto Fruit work to develop new solo varieties (pers. comm.). Mr. Ryoji Tsuji, General Manager, Sales, at Diamond Star Corporation noted that while Philippine growers claim to have developed a Kapoho “blend”, “its flavour is more bitter and not the same as what is grown on the Big Island of Hawaii(pers. comm.).”
The rise of Philippine production has not been entirely smooth. Dole established its papaya export operation at Davao, on the southern island of Mindanao, in the mid-1990s. This followed the collapse of Dole’s papaya operation on Oahu, due to papaya ring spot virus (PRSV). However, a destructive strain of PRSV is also present in the Philippines. Pabuayon noted in 2000 that the lower production of papaya in recent years is attributed to papaya ring spot virus (PRSV) infestation in Luzon (2000,p. 13). Noting
that the island of Luzon is further north from Mindanao, this could mean
Figure 27. Dole papaya, Tsukuji markets
Figure 28. Dole papaya labelling
Figure 26. Dole papaya poster, Tsukuji markets
Japan Market Analysis – Fiji and Pacific Island Papaya
30
that Davao is free from the virus, or that Dole is using production practices to limit the spread of the virus7. In 2002, there was also a temporary suspension of Japanese plant quarantine certification for papaya from the Philippines.
1.5.3 Taiwan
Taiwan began exports of papaya to Japan in 2004, after years of negotiations. Beset by fruit fly and disease problems, Taiwan is permitted to export Solo type and Tailung No.2 type of papaya to Japan, provided it meets the standards established by the Minister of Agriculture, Forestry and Fisheries8.
Taiwan has 2 major problems pertaining to papaya exports to Japan:
• Taiwan has two fruit flies of economic importance to Japan. These are the Oriental Fruit Fly and the Melon Fly. As result, Taiwan papaya requires vapour heat treatment operated under the supervision of Japanese quarantine officials.
• A particularly virulent strain of PRSV is a major problem in Taiwan. As a result, Taiwan has embarked on an extensive GMO papaya-growing program, none of which can currently be exported to Japan.
Plagued by the problems listed above, papaya exports to Japan fell away by 25% between 2005 -2007; from 17 tonnes in 2005 to 4 tonnes in 2007 (table 2).
1.5.4 The advantages of Fijian papaya compared with the other exporting countries
While retailers and wholesalers indicated a market familiarity with yellow papaya, indications were also made that red papaya was associated with the hotel sector and “very special occasions” (Tokyo City Seika president, pers. comm.). This would be the market that Fiji would want to tap into and Fiji papaya’s advantages when compared with other imported papaya are in the following areas:
• The inherent fruit quality. The soils and climate in the river valleys of Western Viti Levu offer excellent growing conditions for Hawaiian solo “sunrise” variety papaya. A true type sunrise solo papaya, harvested at colour break or at quarter ripe maturity, consistently produces fruit that combines exceptional sweetness and flavour (high o
brix-11%-13%), strong red coloured flesh, with good size characteristics (400 to 600 gm) and good keeping qualities. Emeritus Professor Henry Nakasone, the world renowned University of Hawaii papaya breeder, in his report to the USAID’s Commercial Agriculture Development (CAD) in the early 1990s commented on the exceptional high level of sweetness of papaya grown in Fiji from Hawaii sourced seed (Nakasone 1990). This product is inherently superior to yellow fleshed Kapoho “blend” solo grown in the Philippines and harvested at mature green. However, if Fijian papaya
7 GMO Compass reports a cooperation project, involving international companies and establishments in
India, Indonesia, Thailand, Malaysia, the Philippines and Vietnam to bioengineer a virus-resistant papaya for the South-East Asian region (www.gmo-compass.org/eng/service/). It is reported that the first GMO papaya field-testing began in 2003.
8 http://www.pps.go.jp/english/law/list2-%28080911-%29.html
Japan Market Analysis – Fiji and Pacific Island Papaya
31
entering the market is to realise this inherent competitive advantage in terms a quality a number conditions must be meet:
o true to type sunrise solo seed must be used to produce vigorous healthy papaya seedlings for planting by farmers;
o farmers must apply the correct package of practices, with a particular emphasis on good drainage, irrigation and plant nutrition;
o fruit must be harvested at the colour break1/4 ripe stage of maturity o fruit needs to be correctly handled, graded and packed.
The consequences of not meeting one or more of these conditions more than offset the inherent quality advantage of Fijian papaya.
• Fiji image. Fiji is not particularly well known in the Japanese market, although a
positive image has been created by Fiji Water and the golfer Vijay Singh. Fiji has become a popular wedding destination for Japanese tourists. The spectacular marketing success of Fiji Water has demonstrated that ‘Product of Fiji’ is a brand that sells provided there is quality product that matches the image.
• Absence of PRSV. The absence of PRSV in Fiji provides a major competitive advantage. A particularly virulent strain of PRSV is present in Hawaii and Taiwan.
o Adopting management strategies to counter PRSV. This essentially means continually moving plantings away from infected locations, which means shorter locations and increased costs.
o The absence of PRSV provides the opportunity to export organic papaya to Japan. It could be expected that organic papaya could command a sufficiently high price premium to offset the very high airfreight costs of exporting to Japan.
A very favourable fruit fly status. Fiji has two fruit flies of economic significance (Bactrocera passiflorae and B. xanthodes) when exporting papaya to New Zealand, Australia and the United States. Thus it is necessary to treat fruit with High Temperature Forced Air (HTFA) quarantine treatment. In marked contrast, Japan does not consider passiflorae and xanthodesas economic fruit fly species in papaya and thus does require quarantine treatment. In the past, Fiji papaya exporters to Japan have used Natures Way Cooperative facility to facilitate the packing, despite it not being required by the Japanese quarantine authorities.
In contrast, both Hawaii Philippines and Taiwan have fruit fly species that are considered to be serious economic pests by the Japanese quarantine authorities9. Thus it is mandatory that papaya exported from these countries must be treated by vapour heat treated. Japan does not accept irradiation as a quarantine treatment. The capital cost of establishing a Japanese technology vapour heat treatment facility is considerably more than that of the HTFA facility used in Fiji. HTFA is not accepted by Japanese regulatory authorities. In addition a Japanese quarantine official must be based at the vapour heat treatment facility to ensure compliance. The cost of this quarantine officer (wages, transport and living expenses) must be meet by the exporters. A Fiji exporter can avoid all these costs, giving them a significant competitive advantage over exporters from the Philippines and Hawaii.
9 Species for the Philippines include oriental fruit fly, melon fly and Philippines fruit fly, for Hawaii
Mediterranean fruit fly, oriental fruit fly, melon fly and Malaysian fruit fly) and for Taiwan oriental fruit fly and melon fly.
Japan Market Analysis – Fiji and Pacific Island Papaya
32
1.5.5 Japan’s domestically grown papaya
Increases in local papaya production over the last decade have correlated with increases in local mango production in the warmer prefectures of Okinawa and Miyazaki. Around 100 tonnes of locally grown papaya are sold annually on the Central Tokyo wholesale markets (Figure 3). Local wholesale market sources interviewed for this study refer to a political dimension to the increases in papaya production in Okinawa but these are yet to be verified.10,
Domestically grown papaya has a number of major advantages compared with Fiji papaya. Proximity to the market allows for harvesting of a riper, more flavoursome fruit, and lower transporation costs11. Driven by the organics and cooperatives movement, there appears to be an increasing preference to buy local produce in Japan. The current economic recession may serve to expand this sentiment. While locally produced papaya was not cited in the retailers or wholesale markets during this study, it is likely that the gift giving seasons of July and December would see an increase in local papaya in the marketplace.
The long-term association that Japanese consumers have of papaya with tropical Hawaii, may serve to counter this preference somewhat and could potentially work in Fiji’s favour.
1.6 The processed papaya market
1.6.1 Dried fruit
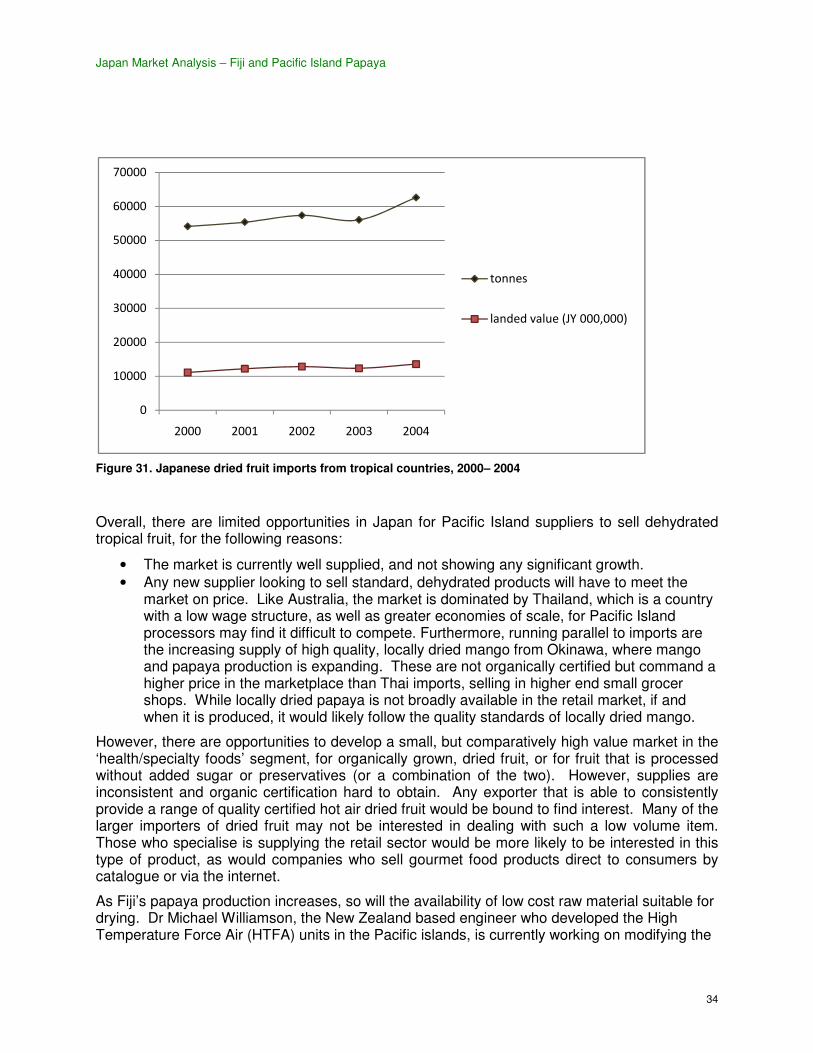
Japan imports around 60,000 tonnes of dried fruit annually, for a landed value of about JPY 13 billion (figure 8). These imports are dominated by raisins and prunes, which account for around 85% of the volume and 80% of the value respectively. With the exception of raisins and prunes, the volume and value of total dried fruit has remained fairly static in recent years, with a fairly broad range and value across products, from an averageJPY164 000/tonne for raisins upward to an average JPY 2.2 million/tonne for berries.
Traditionally, dried fruits have been predominantly used for confectionary and baking purposes, rather than direct consumption. However, recent years have seen an expansion of the Japanese dried fruit market with increasing consumer interest in the nutritional value of dried fruit. Reports note the influence of an intense marketing campaign by the California raisin industry - the campaign extended beyond general advertising and in-store promotion to include alliances with cooking schools and bakery organisations to develop new menu items incorporating raisins (JETRO 2006).
Statistics on dried papaya imports are not available as tropical dried fruit is included in the ‘other’ dried fruit category. Dried fruit imports from tropical countries for the period 2007-08 are articulated in table 7.2007-08 saw negative growth across all dried fruit imports into Japan. Tropical dried fruits were no exception, with 4 of the 7 importing countries from 2007, failing to 10
A wholesale market source interviewed was of the view that the heat from the nuclear reactor at Fukushima is being used to create hot houses to grow papaya and subsequently decrease community opposition to the reactor (pers. comm.).
11 The reported general freight rates from Okinawa to Tokyo was JPY180/kg (FJD 3.87), which can be lower, according to volume (per com. Mr. Akinari Iida, Royal Co Limited, Kyoto). This seems quite high given the current freight rate from Fiji is FJD 3.71/kg. In addition, Fiji exporters must incur the added costs of food safety clearance in Japan (FJD 588/airway bill).

Japan Market Analysis – Fiji and Pacific Island Papaya
33
continue exports into 2008.Tropical dried imports are dominated by Thailand, accounting for 55% of the volume in 2007, jumping to over 90% of the volume and value in 2008 (JETRO 2006). However, the unit value of dried fruit imports from South Africa (USD 4,380/tonne) were 13%higher than that of Thailand in 2008, having been more than 3 times the unit valueof Thai imports only a year prior (USD 8,040/tonne). The dried fruit from Thailand is mainly mango but includes some papaya. These imports average around 40.5 tonnes annually. Running parallel to imports are the increasing supply of high quality, locally dried mango from Okinawa, where mango and papaya production is expanding. These are not organically certified but command a significantly higher price in the marketplace than Thai imports, selling in high-end small grocer shops.
Figure 29 & 30. Imported and local dried mango
Distribution channels
In terms of distribution, dried and processed fruit intended for consumer use is generally distributed through food or confectionary wholesalers to the retail market. For commercial purposes, imported dried fruit is generally distributed in the same way. If required, produce is sent to food processors for preparation and packaging, and then distributed through the wholesaler channels to the retail market. Large-scale purchasers generally purchase direct from the importer or processor while smaller retailers generally purchase from confectionary supply wholesalers (JETRO 2006).
Japan Market Analysis – Fiji and Pacific Island Papaya
34
Figure 31. Japanese dried fruit imports from tropical countries, 2000– 2004
Overall, there are limited opportunities in Japan for Pacific Island suppliers to sell dehydrated tropical fruit, for the following reasons:
• The market is currently well supplied, and not showing any significant growth. • Any new supplier looking to sell standard, dehydrated products will have to meet the
market on price. Like Australia, the market is dominated by Thailand, which is a country with a low wage structure, as well as greater economies of scale, for Pacific Island processors may find it difficult to compete. Furthermore, running parallel to imports are the increasing supply of high quality, locally dried mango from Okinawa, where mango and papaya production is expanding. These are not organically certified but command a higher price in the marketplace than Thai imports, selling in higher end small grocer shops. While locally dried papaya is not broadly available in the retail market, if and when it is produced, it would likely follow the quality standards of locally dried mango.
However, there are opportunities to develop a small, but comparatively high value market in the ‘health/specialty foods’ segment, for organically grown, dried fruit, or for fruit that is processed without added sugar or preservatives (or a combination of the two). However, supplies are inconsistent and organic certification hard to obtain. Any exporter that is able to consistently provide a range of quality certified hot air dried fruit would be bound to find interest. Many of the larger importers of dried fruit may not be interested in dealing with such a low volume item. Those who specialise is supplying the retail sector would be more likely to be interested in this type of product, as would companies who sell gourmet food products direct to consumers by catalogue or via the internet.
As Fiji’s papaya production increases, so will the availability of low cost raw material suitable for drying. Dr Michael Williamson, the New Zealand based engineer who developed the High Temperature Force Air (HTFA) units in the Pacific islands, is currently working on modifying the
0
10000
20000
30000
40000
50000
60000
70000
2000 2001 2002 2003 2004
tonnes
landed value (JY 000,000)

Japan Market Analysis – Fiji and Pacific Island Papaya
HTFA technology to enable it to efficiently produce high quality dried fruit. The combination of low cost raw material and appropriate drying technology can be expected to expand the opportunities for commercial dried fruit production.
1.6.2 Other Pacific island papaya exports
No other Pacific island papaya producer has market access to Japan. None are seen as having the scale or the transportation links to be credible exporters to this market.
1.7 Demand prospect for papaya
1.7.1 Health Benefits
With a growing healthwell as increasingly popularity of nature/comchains like the ‘Body Shop’ there appears to be an opportunity for a clever papaya marketing strategy to tap into these market segments. and G and an excellent source of vitamin C (Mlatex of the green papaya fruit contains tpapain and chymopapain. Papain, the more abundant of the two, has reducpapain is also used as a component in powdered meat tenderizers, and is also marketed in tablet form to remedy digestive problems
The cancer fighting benefits of papaya are also noted, associated with the found in papaya. In particular, epidemiological studies have indicated an inverse relationship between lycopene intake and prostate cancer risk (Minton 2009). Other methe reputed antibiotic strengths of papaya fruit and its seeds. Studies at thave revealed that “extracts of ripe and unripe papaya fruits and seeds are active against grampositive bacteria…with strong doses effective against grambacteria” (Morton 1987). Anecdotally, in a 1977 London hospital opa post-operative infection in a kidneypatient is reputed to have been cured by “strips of papaya” that were left on the wounds for 48 hours, after all other medications had failed (Morton 1987).
Manufacturers and retailers of ‘natur
Figure 32. ‘Carica’ brand soap,Japan
Fiji and Pacific Island Papaya
HTFA technology to enable it to efficiently produce high quality dried fruit. The combination of terial and appropriate drying technology can be expected to expand the
opportunities for commercial dried fruit production.
Other Pacific island papaya exports
No other Pacific island papaya producer has market access to Japan. None are seen as having he scale or the transportation links to be credible exporters to this market.
Demand prospect for papaya
Health Benefits and Nutritional Value
With a growing health-conscious consumer segment in Japan, as well as increasingly popularity of nature/community tradechains like the ‘Body Shop’ there appears to be an opportunity for a clever papaya marketing strategy to tap into these market segments. Papaya is regarded as a good source of vitamins A, B and G and an excellent source of vitamin C (Morton 1987latex of the green papaya fruit contains two proteolytic enzymes papain and chymopapain. Papain, the more abundant of the two, has broad medicinal uses, in the treatment of ulcers, reduction of swelling and fever(Morton 1987). Beypapain is also used as a component in powdered meat tenderizers, and is also marketed in tablet form to remedy digestive problems.
The cancer fighting benefits of papaya are also noted, associated with the compoundaya. In particular, epidemiological studies have indicated an inverse relationship
between lycopene intake and prostate cancer risk (Minton 2009). Other medicinal attributes antibiotic strengths of papaya fruit and its seeds. Studies at the University of Nigeria
have revealed that “extracts of ripe and unripe papaya fruits and seeds are active against grampositive bacteria…with strong doses effective against gram-negative
Morton 1987). Anecdotally, in a 1977 London hospital operation, operative infection in a kidney-transplant
patient is reputed to have been cured by “strips of papaya” that were left on the wounds for 48 hours, after all other medications had failed
of ‘natural skin care’ Figure 33. ‘The Body Shop’ papaya products
35
HTFA technology to enable it to efficiently produce high quality dried fruit. The combination of terial and appropriate drying technology can be expected to expand the
No other Pacific island papaya producer has market access to Japan. None are seen as having
conscious consumer segment in Japan, as munity trade-based
chains like the ‘Body Shop’ there appears to be an opportunity for a clever papaya marketing strategy to tap into these market
apaya is regarded as a good source of vitamins A, B orton 1987). The
wo proteolytic enzymes – papain and chymopapain. Papain, the more abundant of the two,
ulcers, and the fever(Morton 1987). Beyond topical use,
papain is also used as a component in powdered meat tenderizers, and is also marketed in tablet form to remedy
compound lycopene, aya. In particular, epidemiological studies have indicated an inverse relationship
dicinal attributes are he University of Nigeria
have revealed that “extracts of ripe and unripe papaya fruits and seeds are active against gram-
Figure 33. ‘The Body Shop’ papaya products

Japan Market Analysis – Fiji and Pacific Island Papaya
36
products note the benefits of papain for the treatment of dry skin conditions such as eczema and psoriasis12. A number of international skin care brands include papaya extracts in their product range. ‘The Body Shop’ manufacturer and retailer in particular, which has a number of its stores in Tokyo as well as a Japanese online shopping website, retails a papaya-specific range of products. The demand for such products can be further enhanced if they can include ‘fair trade’ certification.
12
http://health-and-beauty.become.com/papaya-enzyme-benefits

Japan Market Analysis – Fiji and Pacific Island Papaya
37
1.8 The projected market size for Fijian papaya in Japan
The size of the Japanese market is projected under two scenarios:
• The Fiji industry continues as is – the status quo remains • There is significant improvement in the Fiji industry
1.8.1 The projected market if the Fiji industry continues as is – the status quo remains
Over the last decade, Fiji has been an intermittent supplier of small volumes of relatively high priced papaya to Japan. Despite the willingness of Royal Co Limited to persevere with importing Fiji papaya, the Japanese market seems to have by and large lost confidence in Fijian papaya. Thus if the status quo remains, there is little realistic prospect for developing a market for Fiji papaya in Japan.
1.8.2 The projected market with significant improvements by the Fiji papaya industry
Improvements in the Fiji papaya industry can be achieved in four broad areas:
• Price competitiveness • Reliability of supply • Quality • Marketing
Price competitiveness
It is estimated that Fiji papaya could currently be landed (to point of customs clearance) at Narita airport for JPY308/kg (FJD 6.60/kg). This estimate is derived in table 5 below. On this basis, Fijian papaya would not be competitive with imports from the Philippines, which had an average landed price of JPY190/kg in 2007 (table 4). However, Fijian papaya landed in Japan at this price would appear to be quite competitive with papaya from Hawaii. The average landed price for Hawaiian papaya in 2007 was JPY 424/kg. Given the inherent quality of Fijian papaya, it is the top end of the market (which is currently occupied by Hawaii) that should be targeted.
Fijian papaya can be made more prices competitive through a combination of the following:
• Improvements in the terms of trade between Fiji and Japan • Reducing the price paid to growers • Reducing the cost of quarantine treatment • Reducing the cost of quarantine clearance • Reducing transportation costs

Japan Market Analysis – Fiji and Pacific Island Papaya
38
Table 5: The cost and returns from exporting a tonne of papaya to Narita, Japan (July 2009)
$/kg exported
$/carton Total shipment($)
Fob costs Cost of fruit
1 Papaya purchased (1.2 tonnes @ $0.90/kg) 1.08 5.4 1,080
Transportation 2 Farm to exporters shed 0.06 0.3
60 Exporters shed to NWC 0.01 0.05
10 3 Materials (Cartons, sponges, tape and
stickers) 0.37 1.835
367
4 Quarantine treatment @ NWC $0.39/kg (VIP)
0.39 1.95 390
Labor Costs Lead Supervisor (8 hours @ $4/hour) 0.03 0.16
32 Pack house supervisor (5 hours @ $3/hour) 0.02 0.1
20 Washing (2 hours @$2.50/hour) 0.01 0.05
10 Grading and packing (3 hours $2.50/hour) 0.01 0.05
10 Overheads
Telecommunications ($150/month spread
over 10 t. of produce) 0.02 0.1
20
Electricity ($210 spread over 10 tonnes) 0.02 0.1 20
Rental of pack house ($150/month spread over 10 t.)
0.02 0.1 20
Miscellaneous ($300/month spread over
10t.) 0.03 0.15
30
Total FOB costs (to point of export) 2.07 10.35 2,069
Exporters Gross Margin (15% Fob cost) 0.31 1.55 310
Fob price 2.38 11.90 2,379
CIF costs 5 Fiji handing fees 0.19 0.95
190 6 Freight to Narita via Korea 3.71 18.55
1,400 7 Australian clearance fees (quarantine and
food safety inspection) 0.32 1.6
250
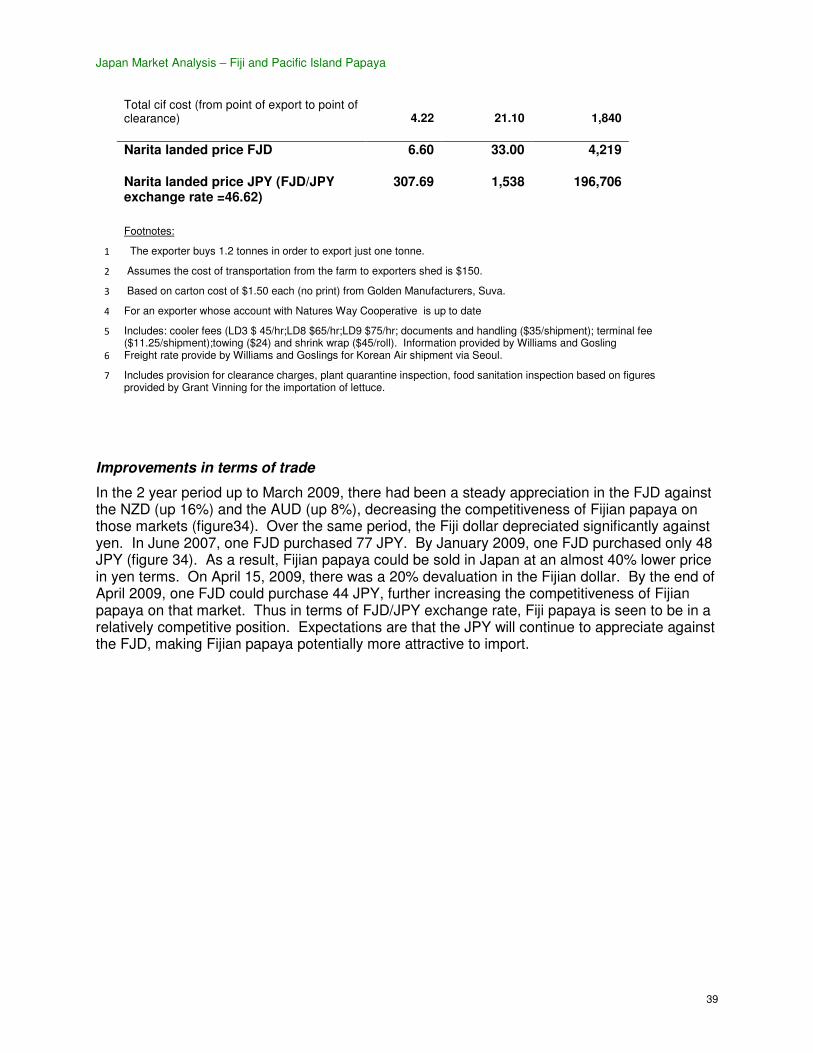
Japan Market Analysis – Fiji and Pacific Island Papaya
39
Total cif cost (from point of export to point of clearance)
4.22
21.10
1,840
Narita landed price FJD 6.60 33.00 4,219
Narita landed price JPY (FJD/JPY
exchange rate =46.62) 307.69 1,538 196,706
Footnotes:
1 The exporter buys 1.2 tonnes in order to export just one tonne.
2 Assumes the cost of transportation from the farm to exporters shed is $150.
3 Based on carton cost of $1.50 each (no print) from Golden Manufacturers, Suva.
4 For an exporter whose account with Natures Way Cooperative is up to date
5 Includes: cooler fees (LD3 $ 45/hr;LD8 $65/hr;LD9 $75/hr; documents and handling ($35/shipment); terminal fee ($11.25/shipment);towing ($24) and shrink wrap ($45/roll). Information provided by Williams and Gosling
6 Freight rate provide by Williams and Goslings for Korean Air shipment via Seoul.
7 Includes provision for clearance charges, plant quarantine inspection, food sanitation inspection based on figures provided by Grant Vinning for the importation of lettuce.
Improvements in terms of trade
In the 2 year period up to March 2009, there had been a steady appreciation in the FJD against the NZD (up 16%) and the AUD (up 8%), decreasing the competitiveness of Fijian papaya on those markets (figure34). Over the same period, the Fiji dollar depreciated significantly against yen. In June 2007, one FJD purchased 77 JPY. By January 2009, one FJD purchased only 48 JPY (figure 34). As a result, Fijian papaya could be sold in Japan at an almost 40% lower price in yen terms. On April 15, 2009, there was a 20% devaluation in the Fijian dollar. By the end of April 2009, one FJD could purchase 44 JPY, further increasing the competitiveness of Fijian papaya on that market. Thus in terms of FJD/JPY exchange rate, Fiji papaya is seen to be in a relatively competitive position. Expectations are that the JPY will continue to appreciate against the FJD, making Fijian papaya potentially more attractive to import.

Japan Market Analysis – Fiji and Pacific Island Papaya
40
Figure 34. Exchange Rates (monthly average middle rate for the FJD) March 2007 to June 2009
There is no doubt that the 20% devaluation has helped the competitiveness of Fijian papaya exports, at least in the short to medium term. The overall improvement in competitiveness is, however, less than 20%. Papaya production and marketing uses significant amounts of imported inputs (fuel, fertiliser and other agro chemicals). The cost of these imported inputs can be expected to increase in the order of 20%. It is estimated that imported items constitute 40% of the cost of growing papaya and 30% of the cost of marketing papaya (see the detailed papaya growing and marketing budgets presented in the New Zealand country study). The duration of any advantage from the devaluation of papaya exports will depend on how much and for how long grower prices and labour wage rates can be contained. What can be said is that the devaluation has given the Fiji industry some breathing space to improve competitiveness through more fundamental efficiency gains.
0.4
0.5
0.6
0.7
0.8
0.9
1
1.1M
ar
Jun
Se
p
De
c
Ma
r
Jun
Se
pt
De
c
Jan
Fe
b
Ma
r
Ap
r
Ma
y
Jun
USD
AUD
NZD
Yen/100
40
45
50
55
60
65
70
75
80
Ma
r
Jun
Se
p
De
c
Ma
r
Jun
Se
pt
De
c
Jan
Fe
b
Ma
r
Ap
r
Ma
y
Jun
FJD/JPY
FJD/JPY
Japan Market Analysis – Fiji and Pacific Island Papaya
41
Reducing the price paid to growers
Table 6 shows the current returns for growing papaya under two different farm gate price scenarios: FJD 0.90/kg (the price prevailing before the January 2009 flood) and FJD 0.80/kg. The farmer depicted plants 1 acre of papaya per annum for 3 years utilising hired labour. The detailed farm management model is presented in appendix 3.
Table 6: The current returns from growing papaya in Fiji under different price scenarios
Farm gate price (FJD/kg) Average gross margin over 5 years from 3 acres planted planting 1 acre per year (FJD)
Average gross margin per acre (FJD)
0.90 11,051 3,684
0.80 9,670 3,223
The impact of the FJD .10/kg reduction in the farm gate price for papaya on the landed price of Fijian papaya at Narita is shown in table 7.
Table 7. Revised Narita landed price, under a .10/kg reduction in the farm gate price of papaya
Farm gate price (FJD/kg) Fob price (FJD/kg) Estimated Narita landed price (JPY/kg)
0.90 2.38 307.69
0.80 2.24 301.17
A farm gate price decrease in the order of FJD 0.10 to 0.20/kg could be expected, as supply expands with increased plantings. These prices are still seen to provide growers a good return, considering the alternatives available from their labour and land resources. Gross margins for planting sugar for farmers wishing to plant papaya, indicated a negative return per acre (Appendix 4).
A decline in the farm gate price does not necessarily mean a decline in farm income derived from growing papaya, if the decrease in price can be offset by increasing yields and reducing reject rates. There can even be an increase in farm income if the gains from increased productivity more than offset the decline in price. In essence, the objective of the Fiji Papaya Project is to simultaneously improve the competitiveness of Fiji papaya exports and increase the income derived from growing papaya.
Reducing the cost of quarantine treatment
No quarantine treatment is required for the export of Fijian papaya to Japan. However, in the past, exporters have used the HTFA facility because they did not have suitable packing/exporting facilities of their own. For this service, they incurred the full treatment cost of FJD 0.40/kg. Thus substantial quarantine cost savings are available for an exporter to Japan who invested in suitable packing/exporting facilities. Diamond Star Corporation (DS) have their own vapour heat treatment facilities, thus the precise cost is unknown. However, in Hawaii, the figure for vapour heat treating papaya is estimated to be generally between USD 0.21-0.32/pound, equivalent to 0.42-0.64/kg (Dr John Armstrong, pers. comm.). According to a recent issue of the Philippines Agri Business Week, the cost of vapour heat treating of mango for
Japan Market Analysis – Fiji and Pacific Island Papaya
42
export to China is USD .40 /kg. It can be assumed that the cost for treating mango and papaya with vapour heat would be the same because the energy use and treatment parameters are similar. Thus Fiji’s exporters to Japan have potentially a huge competitive advantage when it comes to the cost of quarantine treatment charges.
If a would-be Fiji exporter does not have to incur quarantine treatment costs and is able to purchase fruit for FJD .80/kg the current estimated fob price falls to FJD1.79/kg and the landed price at Narita to JPY 280/kg (compared with the estimated landed price of 308 JPY/kg with quarantine treatment and a buying price of FJD.90/kg). Fijian papaya would still not be price competitive with Philippine papaya, but would likely be highly price competitive with imports from Hawaii.
Reducing the cost of transportation
The New Zealand market study, and to some extent the Australian study, identified the shifting from air freight to sea freight as the area in which the greatest gains in price competiveness for Fijian papaya could be achieved. Sea freight, however, is not an option when it comes to exporting papaya to Japan given the voyage time involved. There is probably also little scope for reducing airfreight rates, given that the national carrier no longer flies directly to Japan.
Reliability and consistency of supply
Reliability and consistency of supply will be the key criteria for achieving worthwhile papaya exports to Japan. Fiji has a record of ‘stop-start’ papaya exports to Japan and thus has a reputation as an unreliable supplier. One of the main reasons that Royal Co Limited remains interested in sourcing papaya from Fiji is that they wish to diversify their supply base as a result of declining supply from Hawaii and disruptions to supply from the Philippines due to phytosanitary problems and natural disasters. To be able to take advantage of this opportunity, the Fiji industry needs to seriously consider measures to mitigate against these threats. Some measures to cushion Fiji’s papaya exports from the devastation in a natural disaster include:
• spreading out the geographic distribution of papaya plantings; • use the January 2009 flood as a benchmark for the flood line and only plant in areas
above this flood line’ and • spread planting throughout the year, one planting cycle in April, immediately after the
cyclone season and one planting cycle in August, so that trees are small enough not to be affected by strong winds in the event of a cyclone.
Quality
From consultations with importers, it is clear that Fiji papaya has major quality issues.It is the top end market, occupied by Hawaii and domestic Japanese production that Fiji exporters need to target. It is unlikely that Fiji could complete with the significantly lower cost product from the Philippines. However, to compete with Hawaii,Fiji growers and exporters need to improve on quality. The quality parameters in need of improvement include:
• control of postharvest diseases on the farm • harvest and postharvest handling • grading • packaging and labelling
These quality parameters are discussed in appendix 1.

Japan Market Analysis – Fiji and Pacific Island Papaya
43
Marketing
Branding of Fiji Red
In-store promotion and customer awareness
If Fiji papaya is to significantly increase its market in Japan, the product must be on offer in the department stores and speciality shops.In-store promotion and customer awareness are a critical component of such a strategy. The success of the U.S (California) raisins marketing campaign in Japan, extending beyond mass media advertising to health seminars and in-store promotional support programs, illustrates the value of a targeted marketing strategy. Whilethe scale of the California raisins marketing campaign would be inappropriate for the Fiji papaya industry, it was clear from discussions with industry representatives that marketing of Fiji papaya needed to extend beyond trade shows which have been the basis of promotion to date
(pers.comm.). An in-store promotion campaign would need to be planned and coordinated with the importer and/or intermediary wholesaler, as had started to happen with PSL, driven by Royal Co Limited representatives. Alliances could then extend to retailers to promote the ‘Fiji brand’ in line with improving product quality management in order to emphasise not only exotic, but high quality fruit.
Yellow sunrise Kapohopapaya, the dominant variety in the Japanese marketplace, is recognised for its ‘mild, unoffensive’ flavour(Sembikiya and Diamond Star representatives, pers. comm.). While importers and retailers note that this is what Japanese consumers recognise as ‘papaya,’ there appears to be a rise in the popularity of fruit with high sugar content, with supermarkets actively displaying the sugar content of fruit and marketing taste-testing (ASEAN 2006). This broader trend is one that ‘Fiji Red’ would want to capitalise on, differentiating it from the characteristics of other Hawaiian varieties. However, as part of the ACIAR Fiji Papaya Project, a concerted effort is now warranted to try and develop a package for successfully growing Kapoho solo, or similar non-GMO yellow fleshed types, under Fiji conditions.
Recent years have seen an increasing trend in the fresh fruit markets to sell cut fruit that can be readily eaten in supermarkets and speciality stores, thus meeting the demand for eating a small portion of several different types of fruit at a time (ASEAN 2006). While ‘ready made’ platters were not on sale in the speciality or department stores visited during this study, papaya was included in the tropical ‘fruit salad’ serves at the Ginza Sembikiya fruit parlour. It is worthy of note that peaches, melons and mangoes could be consumed in single fruit bowl serves while papaya could not.Sembikiya, with its newly established fruit parlour, would be well placed to conduct in-store taste testing. If Fiji papaya could establish itself in the marketplace to enable a change to the Ginza Sembikiya fruit menu to include singular papaya serves, that would truly be a marketing achievement for the Fiji papaya industry.
Figure 35. Dole papaya promotional material

Japan Market Analysis – Fiji and Pacific Island Papaya
44
Figure 36. Ginza Sembikiya Fruit parlour menu
Food safety and quality certification
Unlike Australia and New Zealand, Japan’s major retailers do not require formal food safety and quality certification. Food safety issues are managed by MAFF at the point of entry, and the procedural requirements under these laws are discussed in Section 1.3.2. These procedures include testing for Minimal Residue Levels (MRLs) for pesticides.
As such, Japan’s food safety and plant protection laws are stringent – in the past, import bans imposed under the Plant Protection Law had a significant impact on exports of Philippine papaya.
EU’s Facilitating Agricultural Commodity Trade (FACT) and the ACIAR Fiji Papaya Project have an important role to play in assistance the industry achieve the necessary requirements of the various target markets. This has begun with technical assistance to Natures Way Cooperative in meeting Good Manufacturing Practice Standards and, eventually achieving HACCP certification.
Estimated market for Fijian papaya with improved price competitiveness, quality and marketing
The Japanese are only modest consumers of tropical fruit. The country imports around 1.3 million tonnes of tropical fruit. With a population of 127 million, this represents a per capita consumption of 10 kg, of which bananas made up around 8.5 kg. This is less than half the per capita consumption of tropical fruit in New Zealand, where 24.4 kg per head were consumed in 2008. In Japan, there has been little overall growth in tropical fruit consumption, increasing gradually with population growth - although growth in some lines (pineapples and mangoes) has been greater (table 2 and figure 6). Around 3,600 tonnes of papaya are consumed annually in Japan, which includes the small domestic production from Okinawa and Miyazaki Prefecture. This puts per capita consumption at a minuscule level of 0.03 kg. This consumption level is considerably lower than that for Fiji’s other target markets (table 7). Unlike the situation observed in the United States, Australia and New Zealand, Japan’s per capita papaya consumption has not grown and has actually slightly decline. over the last decade. This stagnation is mainly due to the precipitous decline in papaya supply from Hawaii due to PRSV which has not been offset with supply from the Philippines. Recapturing some of the market that was supplied by Hawaii should be the objective of the Fijian papaya industry. At its peak in

Japan Market Analysis – Fiji and Pacific Island Papaya
45
1996, Hawaii exported over 3,000 tonnes of papaya to Japan. A reasonable expectation is that a quality and well-marketed Fijian product could recapture 5-10% of the past Hawaiian market. This would represent a market of between 150 to 300 tonnes.
Table 7. Comparative papaya consumption in Fiji’s target markets*
tonnes population kg/capita
US 150,000 304.2 0.49
Australia 12,000 21.5 0.56
Japan 3,600 127.4 0.03
New Zealand 950 4.3 0.22
* consumption estimates from the various country market studies
A summary of market projections for Fijian papaya in Japan
A summary of the market projection under the two scenarios are as follows:
• The status quo of the Fiji industry remains. – no market • There are significant improvements in the Fiji industry (price competitiveness, quality
and marketing) – 150 to 300 tonnes
1.9 Bibliography
ASEAN 2001. Marketing Guide for ASEAN Exporters to Japan.ASEAN Promotion Centre on Trade, Investment and Tourism:Tokyo.
Azuma N and Fernie J 2001. ‘Retail marketing strategies and logistical operations at a Japanese grocery supermarket chain – case study of Summit Inc’ in International Journal of Retail & Distribution Management, 29:6, pp 282 – 297.
INTRACEN 2001. Japan - World Markets for Organic Fruit and Vegetables.International Trade Centre: Geneva.
JETRO 2006. Marketing Guidebook for Major Imported Products. Japan External TradeOrganisation:Tokyo.
Jussaume, R. 1994. The JapaneseJuice Industry: An Update. Impact Center Report72: Washington State University.

Japan Market Analysis – Fiji and Pacific Island Papaya
46
Morton, J. 1987. Fruits of warm climates source: www.hort.purdue.edu/newcrop/morton/papaya_ars.html date accessed: 20/07/09
Minton, B. 2009. Papaya is a Tasty Way to Fight Cancer and Poor Digestion source: http://www.naturalnews.com/026372_cancer_papaya_enzymes.html date accessed: 24/07/09
National Marketing Authority (NMA)1985. Corporate Plan 1985-1989: Suva.
Pabuayon, I. 2000. Fruits Program Area Research Planning and Prioritisation: Background Analysis. Discussion Paper Series No. 2000-18. Philippines Institute of Development Studies: Manila.
Pesante A. 2003. Market Outlook Report: Fresh Papayas Hawaii:Honolulu.

Japan Market Analysis – Fiji and Pacific Island Papaya
47
Appendix 1: Fijian papaya quality parameters in need of improvement
Control of postharvest diseases on the farm
Damage by disease infectionis a leading cause of post harvest losses in papaya. Like physical damage, the effects are often not seen until the fruit begins to ripen. Therefore fruit can be shipped looking nice and clean but arrive infected with disease which creates a particularly bad impression in the market place.
Anthracnose (Colletotrichumgloespoirides L.) disease is one of the most common post harvest diseases of papaya in Fiji. The disease is present on unripe papayas but is difficult to detect because it is latent (not visible). As the fruit starts to ripen, circular spots begin to appear and gradually enlarge and may become sunken into the fruit.
Phytophthora stem-end rot (Phytophthora nicotianae var. parasitica) is another major post harvest problem affecting Fiji papaya. Phytophthora is characterised by circular spots (lesions) which develop with grey and white ‘fungus’ (mycelium) growing on the surface. Infection of phytophthora is particularly apparent around the stem end.
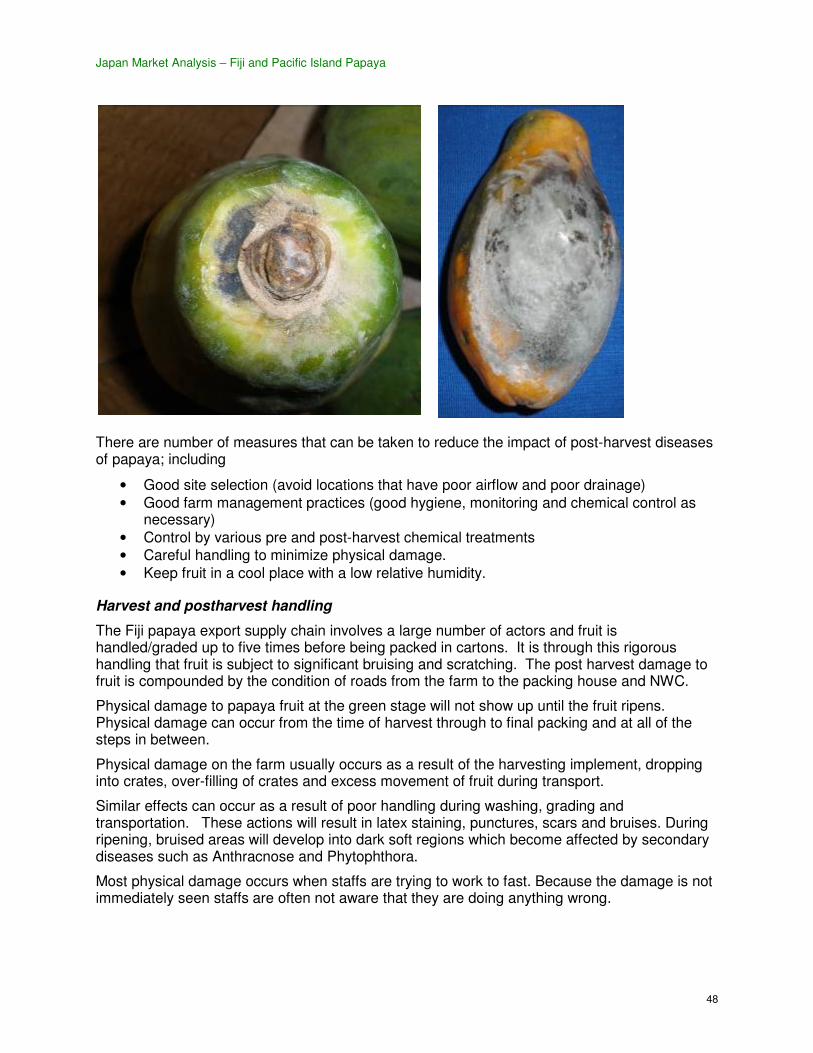
Japan Market Analysis – Fiji and Pacific Island Papaya
48
There are number of measures that can be taken to reduce the impact of post-harvest diseases of papaya; including
• Good site selection (avoid locations that have poor airflow and poor drainage) • Good farm management practices (good hygiene, monitoring and chemical control as
necessary) • Control by various pre and post-harvest chemical treatments • Careful handling to minimize physical damage. • Keep fruit in a cool place with a low relative humidity.
Harvest and postharvest handling
The Fiji papaya export supply chain involves a large number of actors and fruit is handled/graded up to five times before being packed in cartons. It is through this rigorous handling that fruit is subject to significant bruising and scratching. The post harvest damage to fruit is compounded by the condition of roads from the farm to the packing house and NWC.
Physical damage to papaya fruit at the green stage will not show up until the fruit ripens. Physical damage can occur from the time of harvest through to final packing and at all of the steps in between.
Physical damage on the farm usually occurs as a result of the harvesting implement, dropping into crates, over-filling of crates and excess movement of fruit during transport.
Similar effects can occur as a result of poor handling during washing, grading and transportation. These actions will result in latex staining, punctures, scars and bruises. During ripening, bruised areas will develop into dark soft regions which become affected by secondary diseases such as Anthracnose and Phytophthora.
Most physical damage occurs when staffs are trying to work to fast. Because the damage is not immediately seen staffs are often not aware that they are doing anything wrong.

Japan Market Analysis – Fiji and Pacific Island Papaya
49
Bruising and scratching damage from improper handling on the farm.
Stem end damage from dropping fruit into the bins.
There are number of measures that need to be adhered too in order to reduce the damage caused to papaya during harvest and postharvest handling; including;
• Always practice good harvesting techniques and do not rush. • Stems should be removed in the field to prevent puncturing or scratching of other fruit in
the crate. • Foam or newspaper should be placed in the base of field crates and crates should
contain only one layer of fruit. • Fruit should never be dropped or thrown into crates or bins.
• Vehicles used to transport the fruit should be driven slowly and with care
Grading
In order to be competitive the grading of the fruit for export must be improved. Importers demand that all exports are of even size and maturity with very minimal skin blemishes or diseased fruit. Currently Fiji exporters have very poor grading which means that importers, wholesalers and retailers have to do this grading on their end at a much higher cost.
For this very reason it is critical that farmers, exporter staff and NWC handlers understand that the market wants each box to be the same in terms of:
• size (weight) • sex (shape – female, round; hermaphrodite bell shaped) • stage of ripeness.

Japan Market Analysis – Fiji and Pacific Island Papaya
50
At present NWC staff use scales in order get fruit of the same size for final packing. The performance here is mixed and should improve significantly with the installation of the grading machine that is currently being purchased with NWC’s Enterprise Challenge Fund grant.
What is much more difficult is trying to get fruit of the same stage of ripeness – this is where our competitors are doing a much better job.
It is the importers request to an exporter that dictates what should be packed in a box, therefore the onus is on the exporter to strive to meet the exact requirements of his order and to achieve consistency within every box.
Dole papaya in Auckland, February 2009 Fijian papaya in Auckland, February 2009
Packaging and labelling
In order for Fiji papaya to secure a significant share of the main stream papaya market (supermarket chains) in New Zealand it is necessary to have appropriate packaging and labelling. The improvements in packaging and labelling that are described will inevitably require additional costs to the exporter.
The packaging and labelling requirements for the NZ market cab be summarised on three levels;
1. What packaging will ensure that the fruit arrives to the customer in the best possible condition?
2. What labelling is necessary to comply with importers/retailers standards?
3. What packaging and labelling will serve to promote Fiji papaya as a high quality product?
A critical component of maintaining fruit quality through transportation is the carton. In Fiji the quality of cartons varies significantly between different exporters. Physical inspection of Fiji papaya in NZ saw the difference in the two types of cartons and how they hold up.

Japan Market Analysis – Fiji and Pacific Island Papaya
51
A durable waxed carton of Fijian papaya that remains in good shape in an exporters cooler, Auckland (February, 2009)
A much thinner, unwaxed carton of Fijian papaya that has collapsed and started to come apart, Auckland (February, 2009)
Some Fiji exporters also use individual fruit socks to protect fruit from rubbing up against each other. This, or a similar measure is considered critical to ensure the fruit arrives at the market in the best possible condition.
It should be noted that papaya is rarely displayed at the retail level with the fruit sock. This is usually taken off by the stocker at the supermarket. If socks were deemed to be cost prohibitive an exporter could consider use of paper to individually wrap the fruit as is seen in papaya exports from Hawaii and the Philippines below.
Papaya individually wrapped in newspaper from Dole papaya from the Philippines individually wrapped

Japan Market Analysis – Fiji and Pacific Island Papaya
52
Kumu Farms, Molokai, Hawaii, ready for export to the US mainland. (March, 2009)
in newspaper at MG Marketing packhouse, Auckland. (February, 2009)
Japan Market Analysis – Fiji and Pacific Island Papaya
53
.
Appendix 2: InterviewList
1. Tokyo City SEIKA Limited
Mr. Kenji Fukushige
President
email: Kenji.Fukushige@tokyo city –seika.com
2. Ginza Sembekiya
Mr. Kenji Komiya
Procurement and Imports
email: [email protected]
3. Royal Co., Limited
Akinari Iida
Overseas Business Division
email: [email protected]
Atsushi Nakajima
Fruits Division
email: [email protected]
4. Diamond Star Corporation
Takashi Kusube
General Manager, Sales
email: [email protected]
Ryoji Tsuji
General Manager, Sales
email: [email protected]
5. Towa Mokusan Company Limited
Michimasa Mochizuki

Japan Market Analysis – Fiji and Pacific Island Papaya
54
President
email:[email protected]
6. Sadamatsu Co., Limited
Takashi Suzaki
Senior Manager
email: [email protected]


