Mechanisms of Current Terrestrial Carbon Sinks and Future Persistency

The Management of Natural Coastal Carbon SinksEdited by Dan Laffoley and Gabriel GrimsditchNovember 2009
Coastal Carbon091102_irl.indd *1 06.11.2009 13:59:40

The designa on of geographical en es in this book, and the presenta on of the material, do not imply the expression of any opinion whatsoever on the part of IUCN, WCPA, Natural England, the Lighthouse Founda on or UNEP concerning the legal status of any country, territory, or area, or of its authori es, or concerning the delimita on of its fron ers or boundaries. The views expressed in this publica on do not necessarily re ect those of IUCN, WCPA, Natural England, the Lighthouse Founda on or UNEP. This publica on has been made possible in part by funding from Natural England, the Lighthouse Founda on, and UNEP.
Copyright: © 2009 Interna onal Union for Conserva on of Nature and Natural Resources
Reproduc on of this publica on for educa onal or other non-commercial purposes is authorized without prior wri en permission from the copyright holder provided the source is fully acknowledged. Reproduc on of this publica on for resale or other commercial purposes is prohibited without prior wri en permission of the copyright holder.
Cita on of Report: La oley, D.d’A. & Grimsditch, G. (eds). 2009. The management of natural coastal carbon sinks. IUCN, Gland, Switzerland. 53 pp
Cita on of individual chapters: Author(s). 2009. Title of chapter. In: La oley, D.d’A. & Grimsditch, G. (eds). 2009. The management of natural coastal carbon sinks. IUCN, Gland, Switzerland. 53 pp.
ISBN: 978-2-8317-1205-5
Cover design by: Laura RidderingLayout by: Laura RidderingPrinted by: SwissPrinters IRL
Photo credits:Cover: (from top le to bo om right): Mangroves, New Caledonia © Dan La oley; Protoreaster linckii sea star on thalassia hemprichii seagrass, Tanga, Tanzania © Jerker Tamelander; Kelp forest at Lundy Island, UK © Keith Hiscock; Tidal salt marsh, Dipper Harbour, New Brunswick © Gail L. Chmura. Page vii: Biodiversity-rich seagrass bed o Tanga, Tanzania; © Jerker Tamelander/IUCN. Page 4: Tidal salt marsh, Dipper Harbour, New Brunswick, Canada. © Gail L Chmura. Page 12: Complex root structure of Rhizophora mucronata stand, Gazi Bay, Kenya © Steven Bouillon, K.U.Leuven. Page 21: Mangrove forest on the west coast of New Caledonia © Dan La oley/IUCN. Page 22: Thalassia hemprichii at Paje lagoon, Zanzibar Tanzania © Mats Björk. Page 30: Map of Kelp forest distribu on © Proceedings of the Na onal Academy of Sciences (PNAS); Photo: Kelp forest at Snellings Down © Keith Hiscock. Page 38: Coral reefscape, Pemba © Jerker Tamelander, IUCN. Page 46: Pentaceraster sp seastar in Enhalus acoroides meadow, Tanga, Tanzania © Jerker Tamelander, IUCN. Page 53: The dense assemblage of under-story kelps and red algae in a giant kelp (Macrocys s pyrifera) forest o Santa Barbara, California, USA © Clint Nelson. Back cover: (top to bo om) The elkhorn kelp Pelagophycus porra growing o Santa Catalina Island, California USA © Ron McPeak; Rich coral reef ecosystem © Jerker Tamelander, IUCN.
Available from: IUCN (Interna onal Union for Conserva on of Nature) Rue Mauverney 28, 1196 Gland Switzerland Telephone +41 22 999 0217 Fax +41 22 999 0025email: [email protected] website: www.iucn.org/marine
Quality assurance: we are grateful to the following scien sts who kindly gave their me to quality assure part or all of this report:
Richard B. Aronson, Florida Ins tute of TechnologySven Beer, Tel Aviv UniversityMichael Graham, California State UniversityJordan Mayor, University of Florida
Coastal Carbon091102_irl.indd *2 09.11.2009 08:06:31

The Management of Natural Coastal Carbon SinksEdited by Dan Laffoley and Gabriel Grimsditch
Coastal Carbon091102_irl.indd *3 06.11.2009 14:00:21

Coastal Carbon091102_irl.indd *4 06.11.2009 14:00:23

Foreword
Climate change is arguably one of the biggest issues facing humanity. World leaders now recognise that urgent and signi cant reduc ons in our emissions of greenhouse gasses are needed if we are to avoid future dangerous climate change. Alongside such measures is an increasingly strong recogni on that there is a need to properly manage par cular habitats that act as cri cal natural carbon sinks. This is to ensure that they retain as much of the carbon trapped in the system as possible, and don’t tend to become ‘sources’ to the atmosphere through poor management. O en the release of trapped carbon as carbon dioxide is accompanied by the release of other powerful greenhouse gases such as methane, and this situa on exacerbates an already concerning global climate situa on.
In recent decades there has been a signi cant focus, quite rightly, on major carbon sinks on land such as forests, par cular soil types and peatland habitats. These are ecosystems that by their ecology inherently hold vast reser-voirs of carbon, and where management can be put in place to a empt to retain such reserves within the natural systems. The challenge is to recognise other carbon sinks that could contribute and ensure that they too are sub-ject to best prac ce management regimes.
Un l now surprisingly li le a en on appears to have been paid to the ocean, despite the fact that this is a cri cal part of the carbon cycle and one of the largest sinks of carbon on the planet. This lack of a en on may in part be due to a mistaken belief that quan ca on of discreet marine carbon sinks is not possible, and also in the mis-taken belief that there is li le management can do to sustain such marine carbon sinks.
The origin of this report lies within IUCN’s World Commission on Protected Areas and Natural England in the UK, and a joint enthusiasm to address this issue. This ini al enthusiasm sparked the interest of many global partners and scien sts when it became apparent that evidence is available that could change the emphasis on the manage-ment of carbon sinks. There is an urgent need for the global debate and ac on now to encompass marine habitats, just as we already value and try to best protect more familiar forests and peatlands on land.
Over the past two years we have sought out and worked with leading scien sts to document the carbon man-agement poten al of par cular marine ecosystems. It turns out that not only are these habitats highly valuable sources of food and important for shoreline protec on, but that all of them are amenable to management as on land when it comes to considering them as carbon sinks. In the ocean this management would be through tools such as Marine Protected Areas, Marine Spa al Planning and area-based sheries management techniques. This report documents the latest evidence from leading scien sts on these important coastal habitats.
Given the importance of examining all op ons for tacking climate change we hope the evidence in this report will help balance ac on across the land/sea divide so we don’t just think about avoiding deforesta on, but we also think about similarly cri cally important coastal marine habitats. We hope this report will, therefore, serve as a global s mulus to policy advisors and decision makers to encompass coastal ecosystems as key components of the wide spectrum of strategies needed to mi gate climate change impacts.
Carl Gustaf LundinHead,IUCN Global Marine Programme
Dan La oleyMarine Vice ChairIUCN’s World Commission on Protected Areas &Marine Advisor, Chief Scien st’s TeamNatural England
Coastal Carbon091102_irl.indd ii 06.11.2009 14:00:23

Coastal Carbon091102_irl.indd iii 06.11.2009 14:00:23

iv
Scale of Units used
Value Symbol Name
103 g kg kilogram106 g Mg megagram (tonne)109 g Gg gigagram1012 g Tg teragram1015 g Pg petagram1018 g Eg exagram1021 g Zg ze agram
One Gigatonne = 1000 TeragramsOne hectare = 10,000 m2
Table of Contents
Execu ve Summary ................................................................................................................... ................................v
Introduc on ........................................................................................................................... ................................... 1
Tidal Salt Marshes ............................................................................................................ ........................................ 5
Mangroves ..................................................................................................................... ......................................... 13
Seagrass Meadows .............................................................................................................. ................................... 23
Kelp Forests .................................................................................................................. .......................................... 31
Coral Reefs ................................................................................................................... ........................................... 39
Carbon Sequestra on by Coastal Marine Habitats: Important Missing Sinks ....................................................... 47
Next steps for the Management of Coastal Carbon Sinks ..................................................................................... 52
Coastal Carbon091102_irl.indd iv 06.11.2009 14:00:23

v
This report focuses on the management of natural coastal carbon sinks. The produc on of the report has been s mulated by an apparent lack of recogni on and focus on coastal marine ecosystems to comple-ment ac vi es already well advanced on land to ad-dress the best prac ce management of carbon sinks. The produc on of this report is mely as a number of Governments are now introducing legisla on to tackle climate change. In the UK, for example, the Climate Change Act sets out a statutory responsibility to quan- fy natural carbon sink as part of the overall carbon
accoun ng process. It is important that such quan -ca ons and processes work with the latest science and evidence.
To construct this report we asked leading scien sts for their views on the carbon management poten al of a number of coastal ecosystems: dal saltmarshes, mangroves, seagrass meadows, kelp forests and coral reefs. The resultant chapters wri en by these scien sts form the core of this report and are their views on how well such habitats perform a carbon management role. These ecosystems were selected because the belief from the outset was that they are good at sequestering carbon, and are located in situa ons where manage-ment ac ons could secure the carbon sinks. There are of course other features of our ocean that are already established as good carbon sinks – the key focus for this ini al work has, however, been on those ecosystems where management interven on can reasonably read-ily play a role in securing and improving the future state of the given carbon sinks. If proven this work could ex-pand the range of global op ons for carbon manage-ment into coastal marine environments, unlocking many possibili es for ac on and possible nancing of new management measures to protect the important carbon sinks.
The key ndings of this report are:
• These key marine ecosystems are of high im-portance because of the signi cant goods and services they already provide as well as the carbon management poten al recog-nised in this report, thus providing new con-vergent opportuni es to achieve many po-li cal goals from few management ac ons.
• The carbon management poten al of these se-lected marine ecosystems compares favourably with and, in some respects, may exceed the po-ten al of carbon sinks on land. Coral reefs, rather than ac ng as ‘carbon sinks’ are found to be slight ‘carbon sources’ due to their e ect on local ocean chemistry
• The table below highlights some of the key car-bon sink data documented in this report for these coastal habitats. It provides summary data on the comparison of carbon stocks and long-term accu-mula on of carbon in the coastal marine ecosys-tems. Comparisons with informa on on terrestrial carbon sinks are provided in the body of this report.
• The chemistry of some speci c marine sediments (for example salt marshes) suggests that whilst such habitats may be of limited geographical ex-tent, the absolute compara ve value of the car-bon sequestered per unit area may well outweigh the importance of similar processes on land due to lower poten al for the emission of other powerful greenhouse gases such as methane.
• Alongside the carbon management poten al of these ecosystems, another key nding of this report is the lack of cri cal data for some habitat
Execu ve Summary
Ecosystem type
Standing carbon stock (gC m-2) Total global area
(*1012 m2)
Global carbon stocks (PgC)
Longterm rate of carbon accumula on in sediment (gC m-2 yr-1)Plants Soil Plants Soil
Tidal Salt Marshes
Unknown (0.22 reported) 210
Mangroves 7990 0.157 1.2 139Seagrass meadows 184 7000 0.3 0.06 2.1 83
Kelp Forests 120-720 na 0.02-0.4 0.009-0.02 na na
Coastal Carbon091102_irl.indd v 06.11.2009 14:00:23

vi
types. Having comprehensive habitat inventories is cri cally important and this report highlights the urgent need, alongside recognising the carbon role of such ecosystems, to ensure that such inventories are completed for saltmarsh and kelp forests and then all such inventories are e ec vely maintained over me.
• These coastal marine ecosystems are also vital for the food security of coastal communi es in developing countries, providing nurseries and shing grounds for ar sanal sheries. Furthermore, they provide natural coastal defences that mi gate erosion and storm ac on. Therefore, be er protec on of these ecosystems will not only make carbon sense, but the co-bene ts from ecosystem goods and services are clear.
• Signi cant losses are occurring in the global extent of these cri cal marine ecosystems due to poor management, climate change (especially rising sea levels), coupled to a lack of policy priority to address current and future threats.
• Certain human impacts – notably nutrient and sediment run-o from land, displacement of mangrove forests by urban development and aquaculture, and over- shing - are degrading these ecosystems, threatening their sustainability and compromising their capacity to naturally sequester carbon. The good news is that such impacts can be mi gated by e ec ve management regimes.
• Management approaches already exist that could secure the carbon storage poten al of these ecosystems, and most governments have commitments to put such measures in place for other reasons. These include biodiversity protec on or achieving sustainable development. Agreed management approaches that would be e ec ve include Marine Protected Areas, Marine Spa al Planning, area-based sheries management approaches, bu er zones to allow inland migra on of coastal carbon sinks, regulated coastal development, and ecosystem rehabilita on.
• Greenhouse gas emissions that occur as a result of the management of coastal and marine habitats are not being accounted for in interna onal climate change mechanisms (ie UNFCCC, Kyoto, CDM, etc) or in Na onal Inventory Submissions.
Not only does this mean that countries are under-es ma ng their anthropogenic emissions, but also that the carbon savings from measures to protect and restore coastal and marine habitats will not count towards mee ng interna onal and na onal climate change commitments.
This report provides the essen al evidence needed to mo vate discussions and ini a ves on how such coastal ecosystems should be incorporated into interna onal and na onal emission reduc on strategies, na onal greenhouse gas inventories and, poten ally, carbon revenues schemes. The la er could take the marine equivalent of the Reducing Emissions from Deforesta on and Forest Degrada on (REDD) scheme on land to safeguard these cri cal coastal carbon sinks. Don’t just think REDD, think coastal too!
The evidence presented here makes clear why moving forward with e ec ve Marine Protected Areas, Marine Spa al Planning and area-based sheries management techniques is not only a poli cal impera ve for biodiversity conserva on, food security, and shoreline protec on, but also now for helping mi gate climate change.
Outlook on Gazi Bay (Kenya) from Kidogoweni creek, with
Ceriops tagal bearing propagules on the right front side.
© Steven Bouillon, K.U.Leuven
Coastal Carbon091102_irl.indd vi 06.11.2009 14:00:23

Coastal Carbon091102_irl.indd vii 06.11.2009 14:00:27

1
As the evidence grows about the e ects climate change is having on the environment, so too does the interest in and ac ons to address the underlying causes – regula on of anthropogenic emissions of greenhouse gases into the atmosphere, avoiding deforesta on, management and protec on of other natural terrestrial carbon sinks, and the development of scal measures that place a value on carbon and therefore provide an economic incen ve to reduce emissions.
The ocean is the largest carbon sink on Earth but there has been scant a en on paid to coastal and marine ecosystems when considering ac ons to address climate change concerns. Within that context the produc on of this report was s mulated by an interest in why coastal habitats were not being considered as important carbon sinks on a global scale – the focus other than in some popular books on the topic seems to be predominantly on terrestrial ecosystems, par cularly forests, certain soil types and peatlands. This concern was brought into sharp focus in 2007 - 2008 when undertaking the research for a report by Natural England on Carbon Management by Land and Marine Managers (Thompson, 2008). It rapidly became evident that coastal and marine ecosystems are vital global carbon stores but that it was not easy to nd the evidence base to substan ate this claim.
A clear robust ra onale was required to progress e orts to include coastal carbon issues in broader climate discussions or heighten the need to manage be er and protect these ecosystems. Alongside the Natural England work, in 2008 IUCN’s World Commission on
Protected Areas released their global Plan of Ac on (La oley, 2008). This set out the overall framework and direc on for the work of the World Commission in marine environments. Within the framework it includes a strategic ac vity of bringing together work on Marine Protected Areas with ac ons to address climate change, food security and human health. The development of this report on coastal carbon management is a result of the Natural England and IUCN ac vi es, and a par cular contribu on to the global Plan of Ac on for Marine Protected Areas. With ongoing support from the Lighthouse Founda on, the United Na ons Environment Programme (UNEP) has also come on board to collaborate with IUCN and Natural England, further adding weight to this innova ve report.
The logic behind this report is to a empt to quan fy the greenhouse gas implica ons of the management of par cular coastal ecosystems, being careful to choose those whose management can be in uenced by applica on of exis ng policy agreements and well established area-based management tools and approaches. Only the management of natural carbon sinks can be included in a countries na onal inventory of greenhouse gas emissions and sequestra on and therefore count towards their climate change mi ga on commitments.
It follows that if management of such habitats delivers clear and quan able greenhouse gas bene ts, and tools exist to secure their best management, then this opens up a new range of possibili es for be er valuing them in terms of mee ng interna onal climate change
Introduc on
Dan La oley c/o Natural England
Northminster HousePeterborough
PE1 1UAUnited Kingdom
dan.la [email protected]+44 (0)300 0600816
Gabriel GrimsditchUnited Na ons Environment Programme
Gigiri, PO Box 30552, Nairobi, [email protected]
+254 20 762 4124
Coastal Carbon091102_irl.indd 1 06.11.2009 14:00:33
2
Introduc on
objec ves. If we want to maximize the poten al for natural carbon sequestra on, then it is impera ve that we draw together the evidence base and protect these valuable coastal marine ecosystems as an addi onal op on to add to our por olio for mi ga ng climate change. The challenge, however, is that li le concerted a en on has previously been applied to this issue, thus hindering the development of na onal plans that might include recogni on and improved protec on of coastal carbon sinks.
The focus of this report is therefore on colla ng and publishing the science of carbon sinks for an ini al set of ve key coastal ecosystems. These are coastal ecosystems that not only meet the above poten al carbon sink and management criteria, but that are already highly valued for their contribu on to marine biodiversity and the goods and services that they provide: dal saltmarshes, mangroves, seagrass meadows, kelp forests and coral reefs.
Through the goods and services they provide, these coastal ecosystems already play a major role in mi ga ng the e ects of climate change on coastal communi es, as well as providing them with livelihoods, food and income. Marine, coastal and terrestrial systems are interlinked, and o en dependent on each other. For example, these coastal ecosystems act as lters for land-based nutrients and pollu on and thus allow extremely precious coral reefs to exist. Some coastal ecosystems (e.g. mangroves) also act as natural defences, protec ng vulnerable coastal communi es from storm surges and waves, par cularly tsunamis. The roots of mangrove and marsh plants stabilize soils and reduce coastal erosion. They also provide coastal communi es with food from sheries, nurseries for important sh stocks, and income through harves ng of commercially valuable resources. Thus there is an excellent basis of exis ng values to build on when considering their addi onal poten al as carbon sinks.
We believe that this report is the rst a empt to bring the in-depth carbon management role of such coastal ecosystems to interna onal a en on in one volume. In this report we also a empt to make a comparison with terrestrial carbon sinks. Future work will focus on the marine species dimension, deep sea ecosystems and broader coastal shelf processes. The ming of this report, in the run up to the UNFCCC COP-16 Copenhagen, is also par cularly important. The report provides an evidence base on the carbon role of these cri cal coastal habitats and the contribu on that their
sustainable management can make to climate change mi ga on which we hope policy advisors, decision makers and natural resource managers will use to include them in relevant debates, new management approaches and strategies and plans. We also hope that this report will s mulate further research into these important habitats, as we endeavour to increase our knowledge of which species, ecosystems or regions are most cri cal for carbon sequestra on as well as co-bene ts from food security and shoreline protec on. In the same way that we are constantly increasing our understanding of the role their terrestrial counterparts play in the carbon cycle, we need to increase our understanding of these coastal carbon sinks too.
We hope that the evidence presented in this report will s mulate greater interest in the fate of these ecosystems, and a greater policy drive for their e ec ve protec on and management, using a diverse array of exis ng tools such as Marine Protected Areas. Unfortunately, as this report documents, these coastal ecosystems are disappearing at an alarming rate. Human ac vi es such as deforesta on, agricultural and industrial runo , unsustainable coastal development, over shing, oil spills, dredging, lling or drainage that cause sediment-loading, eutrophica on and loss of biodiversity have all taken their toll. Now rising sea-levels are placing some of these ecosystems in a ‘coastal squeeze’, as their ability to expand inland to adapt to the rising water is severely restricted by urban developments and embankments. We hope the new evidence on their important roles as carbon sinks will strengthen the commitment to work already advancing on implemen ng the World Summit on Sustainable Development goal of building networks of MPAs by 2012.
We hope also that this work will s mulate a debate around the poten al for the management, protec on and restora on of coastal marine ecosystems to engage with the emerging carbon market. Fortunately, as this report has been developing, world’s governments are beginning to realize the importance of addressing this situa on and with the Manado Declara on agreed upon at the World Ocean Conference in 2009, they recognized that “healthy and produc ve coastal ecosystems… have a growing role in mi ga ng the e ects of climate change on coastal communi es and economies in the near term” and stressed the need “for na onal strategies for sustainable management of coastal and marine ecosystems, in par cular mangrove, wetland, seagrass, estuary and coral reefs, as protec ve and
Coastal Carbon091102_irl.indd 2 06.11.2009 14:00:33

3
Introduc on
produc ve bu er zones that deliver valuable ecosystem goods and services that have signi cant poten al for addressing the adverse e ects of climate change.”In addressing the needs of these ecosystems addi onal costs may be incurred, but what are the hidden costs of not achieving carbon reduc on goals?
In the following sec ons we set out the views of leading scien sts on the carbon management poten al of coastal ecosystems. The latest scien c informa on and perspec ves on the role of these habitats have been used to develop each sec on, and the resultant chapters have all been subject to independent peer review. The report sequen ally covers seagrass, mangroves, dal salt marshes and kelp forests as carbon sinks, and then uses a di erent format to set out the ocean chemistry on the role of coral reefs in the carbon cycle (as research for this report shows them, perhaps counter intui vely in some peoples’ minds, to be slight carbon sources and not sinks).
We also include a discussion of management requirements and interven ons to maintain these coastal ecosystems as e cient carbon sinks. A further sec on focuses on a comparison of the carbon management role of these selected coastal marine ecosystems and how this relates to the exis ng body of knowledge on terrestrial carbon sinks. Finally a closing chapter examines the next steps to bring ac on, as well as improved recogni on, to the role of these habitats as coastal marine carbon sinks.
ReferencesLa oley, D. d’A., (ed.) 2008. Towards Networks of Marine Protected Areas. The MPA Plan of Ac on for IUCN’s World Commission on Protected Areas. IUCN WCPA, Gland, Switzerland. 28 pp. ISBN: 978-2-8317-1091-4
Thompson, D. 2008. Carbon management by land and marine managers. Natural England Research Report NERR026
Shallow Thalassodendron ciliatum bed mixed with corals,
Zanzibar Tanzania. Photo: Mats Björk
Coastal Carbon091102_irl.indd 3 06.11.2009 14:00:33

Coastal Carbon091102_irl.indd 4 06.11.2009 14:00:38

5
De ni on and global occurrenceTidal salt marshes are inter dal ecosystems vegetated by a variety of primary producers such as macroalgae, diatoms and cyanobacteria, but physically dominated by vascular plants. Vascular plants are absent from the dal ats o en found adjacent to the seaward edge of dal salt marshes. In contrast to eelgrass communi es
which may be found on the edge of the lowermost inter dal zone, survival of the dominant vascular plants is dependent upon exposure to the atmosphere. During photosynthesis the marsh’s vascular plants uptake carbon dioxide from the atmosphere, in contrast to eelgrass which uptakes carbon dioxide dissolved in seawater.
Chapman (1977) described the dominant plant forms of the marsh and how they vary geographically. Perennial grasses such as Spar na alterni ora and Spar na
patens are dominant along much of the Atlan c coast of North and South America. In some other regions perennial broad-leaved herbaceous plants dominate, such as Atriplex portuloides along por ons of Europe’s coast. Perennial succulents such as the related Salicornia, Sarcocornia or Arthrocnemum species that grow to shrub size tend to dominate coastlines of Mediterranean climates where, dry, hot summers cause soils to develop hypersaline condi ons.
Tidal salt marshes occur on sheltered marine and estuarine coastlines in a range of clima c condi ons, from sub arc c to tropical, but are most extensive in temperature climates. Although it is o en reported that mangrove trees replace salt marsh vegeta on on tropical coasts salt marshes may exist above the higher eleva on of the swamp.
Tidal Salt Marshes
Gail L ChmuraDirector
Global Environmental and Climate Change Centre (GEC3) and Associate Professor, Department of Geography
McGill University805 Sherbrooke St W, Montreal, QC H3A 2K6 Canada
+1 514 398-4958www.mcgill.ca/gec3
Fast facts• Inter dal ecosystems dominated by vascular plants.• Occur on sheltered marine and estuarine coastlines from the sub-arc c to the tropics, but most extensive
in temperate climates.• Their soils store 210 g C m-2yr-1. This is a substan al rate and the carbon stored in dal salt marsh soils of
the USA comprises 1-2% of its total carbon sink.• Each molecule of CO2 sequestered in soils of dal salt marshes and their tropical equivalents, mangrove
swamps, probably has greater value than that stored in any other natural ecosystem due to the lack of produc on of other greenhouse gases. In contrast to freshwater wetland soils, marine wetlands produce li le methane gas, which is a more potent greenhouse gas than CO2. The presence of sulphates in salt marsh soils reduces the ac vity of microbes that produce methane.
• Extensive marsh areas have been lost from dredging, lling, draining, construc on of roads and are now threatened by sea level rise.
• Restora on of dal salt marshes can increase the world’s natural carbon sinks. Returning the des to drained agricultural marsh can also signi cantly increase this carbon sink.
• Sustainability of marshes with accelera ng sea level rise requires that they be allowed to migrate inland. Development immediately inland to marshes should be regulated through establishment of bu er zones. Bu er zones also help to reduce nutrient enrichment of salt marshes, another threat to this carbon sink.
Coastal Carbon091102_irl.indd 5 06.11.2009 14:00:42

6
Tidal Salt Marshes
Value – goods and services providedTidal salt marshes provide valuable habitat for plants, birds and sh, many of which serve as food resources. Communi es that provide services and supplies to recrea onal waterfowl hunters receive indirect economic bene ts. In some regions marsh plants are harvested for subsistence consump on or commercial sale, like the glassworts of Europe. Na ve vegeta on of salt marshes is also harvested as fodder or simply used as natural pastures. The salt tolerance of dal salt marsh vegeta on makes them poten al candidates as alterna ve crops and forage in salinized soils (Gallagher 1985), which are likely to become more problema c as climate warms and sea level rises.
Marshes support direct, non-consump ve uses, as well. Their ponds and adjacent dal ats a ract wading birds and large ocks of migratory birds that provide recrea onal opportuni es for bird watching. Marshes also provide opportuni es to educate the public in natural history and ecology. Indirect bene ts from marshes may be just as valuable. These indirect bene ts include storm protec on (Koch et al. 2009) and “ ltering” of nutrients. By uptaking nutrients from ground water the salt marsh ecosystem helps to reduce nutrient enrichment that would endanger sea grass beds. However, gas ux studies have shown that enrichment of wetlands with nitrogen may enhance the release of nitrous oxide, a greenhouse gas with 298 mes the global warming poten al of carbon dioxide (Forster et al. 2007). Thus, the service provided by nutrient regula on may result in an increase in greenhouse gas emissions and loss in marsh sustainability as described below.
Produc vityVascular plant produc on varies considerably (Figure 1). In North America above ground produc on ranges from 60 g C m-2 yr-1 in northern Canada and Alaska to averages as high as 812 g C m-2 yr-1 in the north central Gulf of Mexico (Mendelssohn and Morris 2000). Although es mates of produc vity vary with methods used for calcula on, some trends are evident. For instance, comparison of Spar na alterni ora marshes in North America reveals decreasing produc on with increasing la tude (Turner 1976). Most produc vity studies have been limited to biomass produced by vascular plants aboveground, missing two cri cal components: below-ground vascular plant produc on and non-vascular plant produc on.
The micro ora living on the marsh surface (cyanobacteria and eurkaryo c algae such as diatoms)
0
200
400
600
800
1000
-1 1 3 5 7 9 11 13 15 17average annual minimum temperature (°C)
C s
eq
ue
stra
tion
g m
-2yr-1
Gulf of Mexico Northeastern AtlanticMediterranean Northeastern PacificNorthwestern Atlantic
Figure 1. Rates of global carbon sequestra on in the world’s
dal salt marshes. Adapted from Chmura et al. (2003).
Species Below Above Region Reference ---g m-2 yr-1---
ChenopodieaceaeArthrocnemum macrostachyum 1260 683 Po Delta Ibañez et al. 2000Arthrocnemum macrostachyum 50 190 Ebre Delta Ibañez et al. 2000Arthrocnemum macrostachyum 340 840 Ebre Delta Ibañez et al. 2000Salicornia fructosia 950 580 Ebre Delta Ibañez et al. 2000Atriplex portulacoides 1601 598 Guadiana River Neves et al. 2007PlantaginaceaePlantago mari ma 648 296 Bay of Fundy Connor 1995PoaceaeSpar na patens 1113 500 Bay of Fundy Connor 1995Spar na patens 3300 785 Delaware Bay Roman & Daiber 1984Spar na alterni ora 1575 718 Bay of Fundy Connor 1995Spar na alterni ora 6500 1487 Delaware Bay Roman & Daiber 1984
Table 1. Rates of above and below ground produc on of selected dal salt marsh species from three di erent plant families in
North America and Europe demonstrate the importance of below ground produc on with varied plant forms.
Coastal Carbon091102_irl.indd 6 06.11.2009 14:00:42

7
Tidal Salt Marshes
are an important source of marsh primary produc on. Sullivan and Currin (2000) compared the annual produc on of benthic micro ora to vascular plants in salt marshes of the three U.S. coastlines. Micro oral produc on ranged from 8% of vascular plant produc on in Texas to 140% in a California salt marsh. The biomass of benthic micro ora may comprise a signi cant por on of the diet of the invertebrate fauna (e.g., amphipods, gastropods, polychaetes) that form the base of the marsh food chain.
Another o en overlooked por on of primary produc vity is the belowground produc on of vascular plants. In many marshes more produc on is held below ground as roots and rhizomes (table 1) and salt marshes have signi cantly greater belowground produc on than their freshwater counterparts (Murphy 2009). This soil biomass is much less available for export to detrital food chains and stored in soil un l organic ma er is broken down through decomposi on. Research has addressed how salinity and soil satura on a ect aboveground growth, but we know less about their impact on belowground produc on – the more cri cal contribu on to carbon storage. Hypersaline soils can limit vascular plant produc on and result in soil subsidence. However, the dominant plants of the inter dal zone can tolerate soil pore water salinity levels equal to sea water, but the presence of saline soil water s ll presents a physiological stress. This causes a greater nitrogen demand, thus the need for greater root produc on to obtain the limi ng nutrient.
The value of dal salt marshes in support of secondary produc on, par cularly coastal sheries is widely noted (e.g., Boesch and Turner 1984 and Deegan et al. 2000) and marsh area has been correlated to rates of sh and shrimp produc on in coastal waters. Marsh
creeks, ponds and edges provide refuge to juvenile sh, many which feed on soil fauna when they access higher marsh surfaces during ooding des (La aille et al. 2000). Exported primary produc on becomes part of a detrital food chain where the nutrient value of dead vascular plant ssue is enhanced by microbes.
Role as a carbon sinkA review of carbon stored in dal salt marshes es mated that, globally, at least 430 Tg of carbon is stored in the upper 50 cm of dal salt marsh soils (Chmura et al. 2003). The actual size of the sink is likely to be substan ally greater, for two reasons. First, soils of many salt marshes obtain depths of meters
and amounts of salt marsh carbon do not signi cantly decline with depth (Connor et al. 2001). Second, the aerial extent of salt marshes is not well documented for many regions of the world.
In considering feedbacks to climate the rate of carbon accumula on and storage is cri cal to know. Chmura et al. (2003) calculated that, on average, their soils store 210 g C m-2yr-1 or 770 g of carbon dioxide, one of the most important greenhouse gases. This is a substan al rate and the carbon stored in dal salt marsh soils of the U.S. (which has a comprehensive inventory of salt marsh area) comprises 1-2% of the total yearly carbon sink es mated for the coterminous U.S. When one considers feedbacks to climate, each molecule of carbon dioxide sequestered in soils of dal salt marshes and their tropical equivalents, mangrove swamps, probably has greater value than that stored in any other natural ecosystem, due to the lack of produc on of other greenhouse gases. In contrast to freshwater wetland soils (Bridgham et al. 2006), marine wetlands produce li le methane gas, which is 25 mes more potent as a greenhouse gas (based upon a 100-yr me horizon) than carbon dioxide (Forster et al. 2007).
The presence of sulphates in salt marsh soils reduces the ac vity of microbes that produce methane. In well-drained parts of salt marshes methane produced in lower depths is likely to oxidized as it moves through surface layers.
Tidal oodwaters contribute inorganic sediments to inter dal soils, but more importantly, they saturate the soil and reduce the poten al for aerobic decomposi on. Anaerobic decomposi on is much less e cient, enabling accumula on of organic ma er in the soil, and the e ec ve carbon sink.
Another advantage of the soil carbon sink in dal salt marshes and mangroves is that, unlike dry terrestrial systems, the content of soil carbon does not reach equilibrium. In dry terrestrial ecosystems soil surfaces that adsorb organic carbon eventually become saturated and carbon inputs become balanced by decomposi on and release of carbon dioxide through respira on of decomposers. For instance, improved management of agricultural soils can increase rates of carbon storage, but gains may occur for only 50 year before equilibrium in carbon inputs and outputs occur (Canadell et al. 2007).
If there is adequate accumula on of organic ma er and inorganic sediments in a marsh soil it will increase
Coastal Carbon091102_irl.indd 7 06.11.2009 14:00:42
8
Tidal Salt Marshes
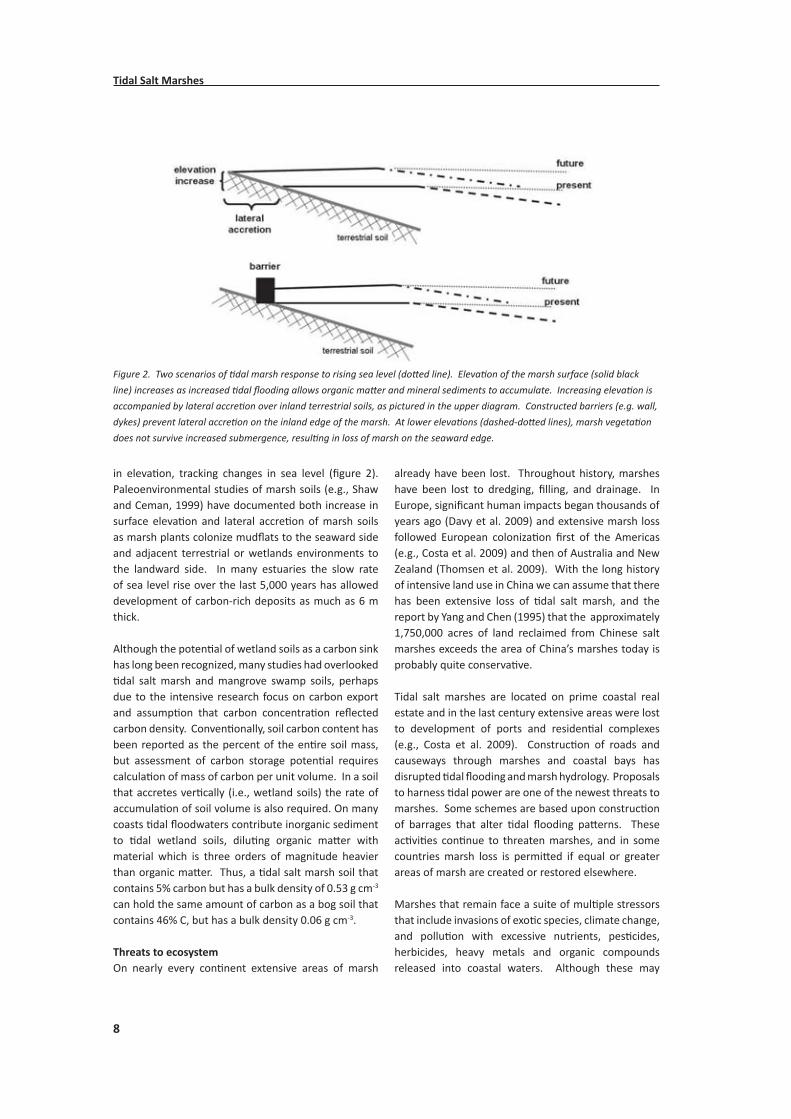
in eleva on, tracking changes in sea level ( gure 2). Paleoenvironmental studies of marsh soils (e.g., Shaw and Ceman, 1999) have documented both increase in surface eleva on and lateral accre on of marsh soils as marsh plants colonize mud ats to the seaward side and adjacent terrestrial or wetlands environments to the landward side. In many estuaries the slow rate of sea level rise over the last 5,000 years has allowed development of carbon-rich deposits as much as 6 m thick.
Although the poten al of wetland soils as a carbon sink has long been recognized, many studies had overlooked dal salt marsh and mangrove swamp soils, perhaps
due to the intensive research focus on carbon export and assump on that carbon concentra on re ected carbon density. Conven onally, soil carbon content has been reported as the percent of the en re soil mass, but assessment of carbon storage poten al requires calcula on of mass of carbon per unit volume. In a soil that accretes ver cally (i.e., wetland soils) the rate of accumula on of soil volume is also required. On many coasts dal oodwaters contribute inorganic sediment to dal wetland soils, dilu ng organic ma er with material which is three orders of magnitude heavier than organic ma er. Thus, a dal salt marsh soil that contains 5% carbon but has a bulk density of 0.53 g cm-3 can hold the same amount of carbon as a bog soil that contains 46% C, but has a bulk density 0.06 g cm-3.
Threats to ecosystemOn nearly every con nent extensive areas of marsh
already have been lost. Throughout history, marshes have been lost to dredging, lling, and drainage. In Europe, signi cant human impacts began thousands of years ago (Davy et al. 2009) and extensive marsh loss followed European coloniza on rst of the Americas (e.g., Costa et al. 2009) and then of Australia and New Zealand (Thomsen et al. 2009). With the long history of intensive land use in China we can assume that there has been extensive loss of dal salt marsh, and the report by Yang and Chen (1995) that the approximately 1,750,000 acres of land reclaimed from Chinese salt marshes exceeds the area of China’s marshes today is probably quite conserva ve.
Tidal salt marshes are located on prime coastal real estate and in the last century extensive areas were lost to development of ports and residen al complexes (e.g., Costa et al. 2009). Construc on of roads and causeways through marshes and coastal bays has disrupted dal ooding and marsh hydrology. Proposals to harness dal power are one of the newest threats to marshes. Some schemes are based upon construc on of barrages that alter dal ooding pa erns. These ac vi es con nue to threaten marshes, and in some countries marsh loss is permi ed if equal or greater areas of marsh are created or restored elsewhere.
Marshes that remain face a suite of mul ple stressors that include invasions of exo c species, climate change, and pollu on with excessive nutrients, pes cides, herbicides, heavy metals and organic compounds released into coastal waters. Although these may
Figure 2. Two scenarios of dal marsh response to rising sea level (do ed line). Eleva on of the marsh surface (solid black
line) increases as increased dal ooding allows organic ma er and mineral sediments to accumulate. Increasing eleva on is
accompanied by lateral accre on over inland terrestrial soils, as pictured in the upper diagram. Constructed barriers (e.g. wall,
dykes) prevent lateral accre on on the inland edge of the marsh. At lower eleva ons (dashed-do ed lines), marsh vegeta on
does not survive increased submergence, resul ng in loss of marsh on the seaward edge.
Coastal Carbon091102_irl.indd 8 06.11.2009 14:00:42

9
Tidal Salt Marshes
disrupt components of the ecosystem, the poten al for carbon storage depends on sustainability of marsh accre on, thus maintenance of vegeta on cover.
Disrup on of coastal food webs can have unan cipated cascade e ects that result in increased popula ons of marsh herbivores whose grazing results in extensive denuda on of marsh vegeta on (Silliman et al. 2005; Holdredge et al. 2008). If vegeta on cover does not return, marshes are subject to subsidence or erosion, thus cessa on of soil carbon storage.
Worldwide, marshes now are threatened by increased rates of sea level rise associated mainly with climate change. Modelling studies show that rates of carbon accumula on will increase as ver cal marsh accre on responds to rising sea levels – un l sea-level rise reaches a cri cal rate that drowns the marsh vegeta on and halts carbon accumula on (Mudd et al. 2009). The cri cal rate varies with inorganic sediment supply and hydrological condi ons – both suscep ble to anthropogenic modi ca ons. Sustainability of dal salt marshes is dependent upon their ability to
ver cally accrete through accumula on of organic ma er and sediments. Anthropogenic ac vi es that alter marsh hydrology, increase soil satura on, or reduce the supply of inorganic sediments are likely to reduce plant produc on and the poten al for ver cal accre on of marsh soil. Increased hydroperiods are expected within marshes around the world, lowering their threshold to withstand the added stresses from anthropogenic impacts. Examples of this problem already exist on coasts where subsurface subsidence results in excep onal levels of rela ve sea level rise, such as the Mississippi Delta in Louisiana (e.g., Turner 1997, Day et al. 2000). There, oil explora on led to extensive dredging of canals and deposi on of spoil banks along their sides that altered marsh hydrology. Impounding of surface water exacerbated anoxic soil condi ons causing physiological stress to plants, reducing the produc on of soil organic ma er and marsh ver cal accre on rates. Marsh surfaces degraded into ponds. The addi onal marsh edges created made marshes more suscep ble to erosion during storms.
Increasing sea levels have already placed marshes on developed coastlines in what has been termed a “coastal squeeze.” On these coasts the ability of marshes to expand inland is severely restricted by urban development or embankments associated with “reclama on” ( g 2). Walls, dikes, and paved surfaces
present physical barriers to marsh expansion inland, and the seaward edge of salt marshes is expected to retreat. This situa on will ul mately result in loss of dal salt marshes. Increased rates of sea level rise
will increase the dura on of dal ooding, limi ng vegeta on produc on at the lower eleva ons along the seaward edge of the marsh. If landward lateral accre on is not possible, these marshes will eventually disappear.
Management recommenda ons to maintain and enhance carbon storage poten alIn many regions dal salt marshes are now protected from direct impacts such as dredging and lling. However, sustainability of protected marshes also requires that they be protected from indirect impacts. Programs designed to protect marshes should encompass ac vi es in the estuarine watershed that a ect discharges of water and sediments. Loss of suspended sediments will decrease the ability of a marsh to maintain eleva ons with rising sea level. In arid regions, in par cular, reduc on of freshwater in ow can result in hypersaline condi ons and loss of vegeta on cri cal to marsh accre on and carbon storage. The impacts of nutrient-laden runo from fer lized watersheds (through agriculture or even suburban landscapes) to many coastal ecosystems are widely recognized, but the nega ve impact of nutrient enrichment on marsh sustainability has only recently been recognized.
Fer liza on experiments show that the two dominant grasses of western Atlan c salt marshes, Spar na alterni ora (Darby and Turner, 2008) and Spar na patens (Chmura, unpublished data) increase their above ground produc on, but decrease their below ground produc on (essen al for ver cal accre on) in response to nutrient addi ons. Turner et al. (2009) determined that long-term fer liza on of a Massachuse s marsh resulted in a signi cant loss of marsh eleva on, equivalent to about half the average rate of global sea level rise. Although dal salt marshes are o en recognized for their value as “nutrient lters,” reducing the threat of eutrophica on of coastal waters; provision of this service is made at the expense of all others performed by a salt marsh. “Filtering of nutrients” by dal salt marshes must not be seen as an acceptable
compromise to be er management of non-point nutrient sources from watersheds or urban sewage.
Terrestrial bu er zones can help to reduce nutrient enrichment of salt marshes, a threat to the marsh carbon sink and the ecosystem’s sustainability. Bu ers
Coastal Carbon091102_irl.indd 9 06.11.2009 14:00:43

10
Tidal Salt Marshes
distance marshes from sites where nutrients are applied and take up nutrients in vegeta on and soils, thus reducing the level reaching the marsh. Terrestrial bu ers can help ensure sustainability of marshes with accelera ng sea level rise, allowing them to migrate inland. Development immediately inland to marshes should be discouraged and, if possible, regulated through establishment of bu er zones.
Restora on of dal salt marshes is an excellent way to increase the world’s natural carbon sinks. Returning the des to drained agricultural marsh can make a signi cant increase in the salt marsh carbon sink. The U.K.’s managed realignment program, to shi embankments inland and restore ooding of agricultural marshes, is a progressive form of coastal management that not only deals with the threat of sea level rise, but promises to enhance carbon sequestra on as dal salt marshes recover. Such policies should be considered in other regions. For example, Connor et al. (2001) es mated that if all of Bay of Fundy marshes “reclaimed” for agriculture could be restored, the rate of carbon dioxide sequestered each year would be equivalent to 4-6% of Canada’s targeted reduc on of 1990-level emissions under the Kyoto Protocol.
ReferencesBoesch, D. F. and Turner, R.E. 1984. Dependence of
shery species on salt marshes: the role of food and refuge. Estuaries 7(4A):460-468.
Bridgham, S.D, Patrick Megonigal, J.P., Keller, J.K., Bliss, N.B, and Tre n, C. 2006. The carbon balance of North American wetlands. Wetlands 26(4):889-916.
Canadell, J.G., Pataki, D, Gi ord R., Houghton, R.A., Lou, Y., Raupach, M.R., Smith, P., Ste en W 2007. Satura on of the terrestrial carbon sink pp. 59-78. In: Canadell, J.G., Pataki, D., Pitelka, L. (eds.), Terrestrial Ecosystems in a Changing World, The IGBP Series. Springer-Verlag, Berlin Heidelberg,
Chapman, V.J. 1977. Chapter 1 Introduc on. Pp 1-30 In Chapman, V.J. (ed.) Ecosystems of the World 1 Wet Coastal Ecosystems. Elsevier, Amsterdam 428 pages.
Childers, D.L., Day, J.W., Jr., and McKellar, H.N., Jr. 2000. Twenty more years of marsh and estuarine ux studies: revisi ng Nixon (1980). Pp. 391-424 In Weinstein, M.P. and Kreeger, D.A. (eds) Concepts and Controversies in Tidal Marsh Ecology. Kluwer Academic Publishers, London, 875 pages.
Chmura, G.L., Anisfeld, S., Cahoon, D. and Lynch. J. 2003. Global carbon sequestra on in dal, saline wetland soils. Global Biogeochemical Cycles 17:1-12.
Connor, R. 1995. An examina on of carbon ow in a Bay of Fundy salt marsh. Unpublished M.Sc. thesis, McGill University.
Connor, R., Chmura, G.L., and Beecher, C.B. 2001. Carbon accumula on in Bay of Fundy salt marshes: implica ons for restora on of reclaimed marshes. Global Biogeochemical Cycles 15(4):943-954.
Costa, C.S.B., Iribarne, O.O., and Farina, J.M. 2009. Chapter 17 Human impacts and threats to the conserva on of South American salt marshes. Pp. 337-359 In Silliman, B.R., Grosholz, E.D., and Bertness, M.D. (eds) Human impacts on salt marshes, a global perspec ve. University of California Press, Berkley, 413 pages.
Darby, F.A. and Turner, R.E. 2008. E ects of eutrophica on on salt marsh root and rhizome biomass accumula on. Marine Ecology Progress Series 363:63-70.
Davy, A.J., Bakker, J.P., and Figueroa, M.E. 2009. Chapter 16 Human modi ca n of European salt marshes. Pp. 311-335 In Silliman, B.R., Grosholz, E.D., and Bertness, M.D. (eds) Human impacts on salt marshes, a global perspec ve. University of California Press, Berkley, 413 pages.
Day, J.W. Jr., Shafer, G.P., Britsch, L.D., Reed D.J., Hawes, S.R., Cahoon D. 2000. Pa ern and process of land loss in the Mississippi Delta: A spa al and temporal analysis of wetland habitat change. Estuaries 23:425–438.
Deegan, L.A., Hughes, J.E. and Rountree, R.A. 2000. Salt marsh ecosystem support of marine transient species. Pp 333-368 In Weinstein, M.P. and Kreeger,
Marsh near the mouth of the Bay of Fundy (at Dipper
Harbour, New Brunswick, Canada). Approximately 3 m of
carbon- rich soil has accumulated here over the last 2500
years. Paleoecological studies show that upper edges of
the marsh prograded over adjacent terrestrial communi es
as sea level rose. As sea level rises more rapidly with global
warming, marshes must migrate inland to survive, but urban
development will prevent this on many coasts. © Olivia Yu
Coastal Carbon091102_irl.indd 10 06.11.2009 14:00:43

11
Tidal Salt Marshes
D.A. (eds) Concepts and Controversies in Tidal Marsh Ecology. Kluwer Academic Publishers, London, 875 pages.
Forster, P., V. Ramaswamy, P. Artaxo, T. Berntsen, R. Be s, D.W. Fahey, J. Haywood, J. Lean, D.C. Lowe, G. Myhre, J. Nganga, R. Prinn,G. Raga, M. Schulz and R. Van Dorland, 2007: Changes in Atmospheric Cons tuents and in Radia ve Forcing. In: Climate Change 2007: The Physical Science Basis. Contribu on of Working Group I to the Fourth Assessment Report of the Intergovernmental Panel on Climate Change [Solomon, S., D. Qin, M. Manning, Z. Chen, M. Marquis, K.B. Averyt, M.Tignor and H.L. Miller (eds.)]. Cambridge University Press, Cambridge, United Kingdom and New York, NY, USA.
Gallagher, J. 1985. Halophy c crops for cul va on at seawater salinity. Plant and Soil 89:323-336.
Holdredge, C., Bertness, M.D. and Al eri, A.H. 2008. Role of crab herbivory in die-o of New England marshes. Conserva on Biology 23:672-679.
Ibañez, C., Curco, A., Day, J.W., Jr., and Prat, N. 2000. Structure and produc vity of micro dal Mediterranean coastal marshes. pp 107-137 In Weinstein, M.P. and Kreeger, D.A. (eds) Concepts and Controversies in Tidal Marsh Ecology. Kluwer Academic Publishers, London, 875 pages.
Kneib, R.T. 20000. Salt marsh ecoscapes and produc on transfers by estuarine nekton in the southeastern United States. Pp 267-292 In Weinstein, M.P. and Kreeger, D.A. (eds) Concepts and Controversies in Tidal Marsh Ecology. Kluwer Academic Publishers, London, 875 pages.
Koch, E.W. Barbier, E.B., Silliman, B.R., Reed, D.J., Perillo, G.M.E., Hacker, S.D., Granek, E.F., Primavera, J.H., Muthiga, N., Polasky, S., Halpern, B.S., Kennedy, C.J., Kappel, C.V., Wolanski, E. 2009. Non-linearity in ecosystem services: temporal and spa al variability in coastal protec on. Fron ers in Ecology and the Environment 7(1):29-37.
La aille, P, Lefeuvre, J.C., and Feunteun, E. 2000. Impact of sheep grazing on juvenile sea bass, Dicentrarchus labrax L., in dal salt marshes. Biological Conserva on 96(3):271-277.
Mendelssohn, I.A. and Morris, J.T. 2000. Eco-physiological controls on the produc vity of Spar na alterni ora Loisel. Pp 59-80 In Weinstein, M.P. and Kreeger, D.A. (eds) Concepts and Controversies in Tidal Marsh Ecology. Kluwer Academic Publishers, London, 875 pages.
Mudd, S.M., Howell, S.M., and Morris, J.T. 2009. Impact of dynamic feedbacks between sedimenta on, sea-level rise, and biomass produc on on near-surface marsh stra graphy and carbon accumula on. Estuarine, Coastal and Shelf Science 82:377-389.
Murphy, M.T. 2009. Ge ng to the root of the ma er: varia ons in vascular root biomass and produc on in peatlands and responses to global change.
Unpublished Ph.D. disserta on, McGill University, Montreal, QC, Canada.
Neves, J. P., Ferreira, L. F., Simões, M. P., and Gazarini, L.C. 2007. Primary produc on and nutrient content in two salt marsh species, Atriplex portulacoides L. and Limoniastrum monopetalum L., in Southern Portugal. Estuaries and Coasts 30(3):459-468.
Nixon, S.W. 1980. Between coastal marshes and coastal water – a review of twenty years of specula on and research on the role of salt marshes in estuarine produc vity and water chemistry. Pages 437-525 IN Hamilton, P. and MacDonald, K.B. (eds.) Wetland processes with emphasis on modeling. Plenum Press, New York, NY.
Odum, E.P. 2000. Tidal marshes as outwelling/pulsing systems. Pp 3-8 In Weinstein, M.P. and Kreeger, D.A. (eds) Concepts and Controversies in Tidal Marsh Ecology. Kluwer Academic Publishers, London, 875 pages.
Roman, C.T. and Daiber, F.C. 1984. Aboveground and belowground primary produc on dynamics of two Delaware Bay dal marshes. Bulle n of the Torrey Botanical Club 3(1):34-41.
Silliman, B.R., van de Kopel, J., Bertness, M.D., Stanton, L.E., and Mendelssohn, I.A. 2005. Drought, snails, and large-scale die-o of southern U.S. salt marshes. Science 310:1803-1806.
Shaw, J. and Ceman, J. 1999. Salt-marsh aggrada on in response to late-Holocene sea-level rise at Amherst Point, Nova Sco a, Canada. The Holocene 9: 439-451.
Sullivan, M.J. and Currin, C.A. 2000. Community structure and func onal dynamics of benthic microalgae in salt marshes. Pp 81-106 In Weinstein, M.P. and Kreeger, D.A. (eds) Concepts and Controversies in Tidal Marsh Ecology. Kluwer Academic Publishers, London, 875 pages.
Thomsen, M.S., Adam, P.A. and Silliman, B.R. 2009. Chapter 18 Anthropogenic threats to Australasian coastal salt marshes. Pp. 361-390 In Silliman, B.R., Grosholz, E.D., and Bertness, M.D. (eds) Human impacts on salt marshes, a global perspec ve. University of California Press, Berkley, 413 pages.
Turner, R.E. 1976. Geographic varia on in salt marsh macrophyte produc on: a review. Contribu ons in Marine Science 20:47-68.
Turner R.E. 1997. Wetland loss in the Northern Gulf of Mexico: mul ple working hypotheses. Estuaries 20: 1–13.
Turner R.E., Howes, B.L., Teal, J.M., Milan, C.S., Swenson, E.M., and Goehringer-Toner, D.D. 2009. Salt marshes and eutrophica on: and unsustainable outcome. Limnology and Oceanography 54:1634-1642.
Yang, S.L. and Chen, J.Y. 1995. Coastal salt marshes and mangrove swamps in China. Chinese Journal of Oceanology and Limnology 13:318-324
Coastal Carbon091102_irl.indd 11 06.11.2009 14:00:46

Global distribution of Mangroves
Mangroves
Coastal Carbon091102_irl.indd 12 06.11.2009 14:00:46
13
Mangroves
Steve BouillonK.U.Leuven
Department of Earth and Environmental SciencesKasteelpark Arenberg 20B-3001 Leuven, Belgium
and Vrije Universiteit BrusselDept. of Analy cal & Environmental Chemistry
Pleinlaan 2, B-1050 Brussels, [email protected]
Victor H Rivera-MonroySchool of the Coast and the Environment
Department of Oceanography and Coastal Sciences, Louisiana State UniversityBaton Rouge
Louisiana USA [email protected]
Robert R TwilleySchool of the Coast and the Environment
Department of Oceanography and Coastal Sciences, Louisiana State UniversityBaton Rouge
Louisiana USA [email protected]
James G KairoKenya Marine and Fisheries Research Ins tute
PO Box 81651, Mombasa, [email protected]
Fast facts• Salt-tolerant, mainly arboreal, owering plants growing in the inter dal zone of tropical and sub-tropical
shores.• Global area of 157,000 km2 to 160,000 km2.• Global carbon burial of approximately 18.4 Tg C yr-1 .• Mangrove forests are es mated to have occupied 75% of the tropical coasts worldwide, but anthropogenic
pressures have reduced the global range of these forests to less than 50% of the original total cover.• These losses are largely due to over-harves ng for mber and fuel-wood produc on, reclama on for
aquaculture and saltpond construc on, mining, oil spills, pollu on and damming of rivers that alter water salinity levels.
• Rehabilita on/restora on or planta on of mangrove forests are not only to be encouraged based on ecological or socio-economical considera ons, but also have the poten al of providing an e cient sink of CO2.
Coastal Carbon091102_irl.indd 13 06.11.2009 14:00:59

14
Mangroves
De ni on and global occurrenceMangrove forests are a dominant feature of many tropical and subtropical coastlines, but are disappearing at an alarming rate. The main causes for the rapid destruc on and clearing of mangrove forests include urbaniza on, popula on growth, water diversion, aquaculture and salt-pond construc on (e.g. Farnsworth & Ellison 1997). On a global scale, mangrove plants are found throughout the tropical and subtropical regions of the world, and two species of Avicennia have penetrated into the warm temperate areas of both hemispheres. The global distribu on of mangroves generally matches the winter 20°C isotherm. Mangroves are trees, shrubs, palms or ground ferns which normally grow above mean sea level in the inter dal zone of marine, coastal, or estuarine environments. Thus, mangrove plants do not form a phylogene cally related group of species but are rather species from very diverse plant groups sharing common morphological and physiological adapta ons to life in the inter dal zone, which have evolved independently through convergence rather than common descent. The most recent global data compila on suggests a current global areal extent of about 152,000 km² (FAO 2007), with Indonesia and Australia together hos ng about 30% of this area.
Mangrove goods & servicesBesides the role mangroves play in the carbon cycle, mangrove ecosystems have a wide range of ecological and socio-economical func ons.
For many communi es living within or near to mangrove forests in developing countries, mangroves cons tute a vital source of income and resources, providing a range of natural products such as wood (for rewood, construc on, fodder, etc), medicines, and as shing grounds. They are known to provide essen al support for a wide range of inter dal and aqua c fauna, and act as nursery habitats for many commercial (and non-commercial) aqua c species such as crabs, prawns and sh (Nagelkerken et al., 2008). Whether this link is due
to the provision of habitat, protec on or preda on, or via a direct trophic link is s ll under debate, but the value of mangroves in suppor ng coastal sheries is unques onable (see e.g., Mumby et al. 2004).
Furthermore, the presence of mangroves has been demonstrated to provide an e cient bu er for coastal protec on: their complex structure a enuates wave ac on, causing reduc on of ow and sedimenta on of suspended material. This topic has received a great deal
of a en on following the 2004 Tsunami which hit SE Asia (e.g., Dahdouh-Guebas et al., 2005; Alongi, 2008; Yanagisawa et al., 2009; Das & Vincent, 2009), although demonstra ng the causal link between mangroves and coastal protec on is not always straigh orward (e.g., see Vermaat & Thampanya 2005). This func on of mangrove forests is also likely to act as an important bu er against sea level rise.
Finally, mangrove ecosystems have been shown to be e ec ve as nutrient traps and ‘reactors’, thereby mi ga ng or decreasing coastal pollu on. The feasibility of using (constructed rather than natural) mangrove wetlands for sewage or shrimp pond e uents has recently been demonstrated (e.g., Boonsong et al., 2003; Wu et al. 2008) and could o er a low-cost, feasible op on for wastewater treatment in tropical coastal se ngs.
Produc vity of mangrovesMangrove forests are considered as highly produc ve ecosystems. Most data on their produc vity are in the form of li er fall es mates, obtained by regularly collec ng all li er in li er traps suspended below the canopy. Unfortunately, much less informa on is available on their biomass produc on in terms of wood and belowground produc on. When es ma ng overall global net primary produc on for mangroves, we therefore need to rely on rela onships between li er fall and wood or belowground produc on to upscale the data on li er fall. Using a global area of mangroves of 160,000 km², the net primary produc on was recently es mated at 218 ± 72 Tg C yr-1 (Bouillon et al. 2008), with root produc on responsible for ~38% of this produc vity, and li er fall and wood produc on both ~31%. There is a general la tudinal gradient in the produc vity of mangroves, being signi cantly higher in the equatorial zone compared to higher-la tude forests – a pa ern recognized for a number of decades (Twilley et al. 1992, Saenger & Snedaker 1993) and con rmed by new data compila ons (Bouillon et al. 2008).
Carbon sinks in mangrove systemsBiomass produced by mangrove forests can ul mately have a number of di erent des na ons (i) part of the biomass produced can be consumed by fauna, either directly or a er export to the aqua c system, (ii) carbon can be incorporated into the sediment, where it is stored for longer periods of me, (iii) carbon can be remineralized and either emi ed back to the atmosphere as CO2, or exported as dissolved inorganic carbon (DIC), (iv) carbon can be exported
Coastal Carbon091102_irl.indd 14 06.11.2009 14:00:59

15
Mangroves
to adjacent ecosystems in organic form (dissolved or par culate) where it can either be deposited in sediments, mineralized, or used as a food source by faunal communi es.
In the context of CO2 sequestra on, the relevant carbon (C) sinks to consider are: • the burial of mangrove C in sediments – locally or
in adjacent systems, • net growth of forest biomass during development,
e.g. a er (re)planta ons. The rst process represents a long-term C sink, while the second should be considered relevant only on the shorter (decennial) term.
Three di erent global es mates for carbon burial within mangrove systems all converge to a value equivalent to ~18.4 Tg C yr-1 (when applying a global area of 160,000 km²). These es mates are derived either from sedimenta on es mates combined with typical organic carbon concentra ons in mangroves (Chmura et al. 2003), or from mass-balance considera ons – despite a number of uncertain es in these es mates there are insu cient data available to be er constrain these values.
The amount of carbon stored within sediments of individual mangrove ecosystems varies widely, from less than 0.5% (on a dry weight basis) to <40%, with a global median value of 2.2 % (Kristensen et al. 2008 – see Figure 1) – extrapola ons to carbon stocks on an areal basis are di cult to make due to varying depths of sediments and the paucity of concurrent data on sediment densi es (i.e. volumetric weight of the sediment). Furthermore, carbon accumula ng is not necessarily all derived from the local produc on by mangroves – organic ma er can be brought in during high de and can originate from rivers, or from adjacent coastal environments. Both the quan ty and origin of carbon in mangrove sediments appear to be determined to a large extent by the degree of ‘openness’ of mangroves in rela on to adjacent aqua c systems: mangroves with low dal amplitude or high on the shoreline have li le opportunity to export organic ma er produced, and also li le other material is brought in: such systems or sites typically have high carbon contents, and the organic ma er accumula ng is locally produced. In contrast, in low inter dal sites or systems with high dal amplitude, a larger frac on of the organic ma er produced can be washed away, and sediment with associated organic ma er from adjacent systems is imported during high de and is deposited
within the system (Twilley 1995). These pa erns are observed not only in mangroves (Bouillon et al. 2003) but also in salt marshes (Middelburg et al. 1997).
Irrespec ve of the origin of carbon in mangrove sediments, the presence of mangroves clearly has an impact on sediment carbon storage, by (i) direct inputs of mangrove produc on to the sediment pool, and (ii) by increasing sedimenta on rates (e.g., Perry & Berkeley 2009). Conversely, clearing of mangroves can rapidly result in signi cantly reduced C stores in sediments (e.g., from up to ~50% over an 8 yr period in the study by Granek & Ru enberg 2008), indica ng that the carbon pool lost through deforesta on substan ally exceeds that of simple removal of standing biomass.
An overview of current quan ta ve es mates of carbon ow in mangrove systems is presented in Table 1.
Two important aspects emerge: (i) carbon burial in mangrove sediments represents a rela vely small
Figure 1: Compila on of literature data on sediment organic
carbon concentra ons in mangrove sediments (from
Kristensen et al. 2008).
Table 1: Overview of current global es mates of net primary
produc on and carbon sinks in mangrove systems (from
Bouillon et al. 2008). All rates reported are in Tg C yr-1.
Net primary produc on 218 ± 72 Li er fall 68 ± 20 Wood produc on 67 ± 40 Root produc on 82 ± 57Fate of mangrove produc on CO2 e ux 42 ± 31 Export as POC and DOC 45 ± 31 Burial 18.4Unaccounted 112 ± 85
Coastal Carbon091102_irl.indd 15 06.11.2009 14:00:59

16
Mangroves
frac on (<10%) of the overall net primary produc on, and (ii) current literature es mates of CO2 e ux from sediments and water, export as organic carbon and burial in sediments together only explain <50% of the primary produc on es mate. This large discrepancy may in part be solved by a large and previously unaccounted ux of dissolved inorganic carbon towards adjacent systems (see Bouillon et al. 2008).
Woody debris and carbon accumula on in mangrove forestsMangrove wetlands support less woody debris than upland forests (Allen et al. 2000, Krauss et al. 2005). Hydrological condi ons of mangrove wetlands, which include a diversity of de, precipita on, and river- ow regimes, can complicate direct comparisons with upland forests. Polit and Brown (1996) showed that lowered stocks of woody debris could be par ally explained by the higher decomposi on rates of woody debris in wetlands. Also, decay of fallen mangrove wood may be quick at rst, rela ve to most temperate systems, due in part to consistently higher temperatures, a prolonged wet season, and a combined terrestrial and marine fungal community in mangroves (e.g., Kathiresan & Bingham 2001).
Woody debris values in mangrove forest a er major disturbances (i.e., massive mortali es due to changes in hydrology, hurricanes) are scarce, making it di cult to determine their role in carbon storage in the long term. However, some studies indicate the poten al role of wood components in nutrient cycling and carbon ux. For example, Rivera-Monroy et al. es mated a range of 16.5-22.3 Mg ha-1 of woody debris in a mangrove forest a ected by hypersalinity condi ons in a deltaic environmental se ng in the Caribbean Sea (Cienaga Grande de Santa Marta, Twilley et al. 1998, Rivera-Monroy et al. 2006). As result of increasing salinity of up to 90 ppt, 271 km2 of mangrove area were lost in a period of 40 years (Simard et al. 2008). A current es mate of live above ground biomass for this forest (using radar interferometry and Lidar data) ranges from 1.2 to 1.7 (±0.1) Tg over the total area, whereas es mated dead biomass was 1.6 Tg, which represent 0.72 Tg of carbon (assuming a 48% carbon content) input for decomposi on and export to adjacent ecosystems. This carbon value is a conserva ve es mate since no informa on of belowground biomass (coarse roots) is available for this site and in mangrove forests overall (Bouillon et al. 2008).Krauss et al. (2005) es mated woody debris in subtropical mangrove forest 9-10 yr a er the impact
of hurricane Andrew in South Florida. The total volume of woody debris for all sites sampled in this study was es mated at 67 m³/ha and varied from 13 to 181 m³/ha depending upon di erences in forest height, proximity to the storm, and maximum es mated wind veloci es. Large volumes of woody debris were found in the eye wall region of the hurricane, with a volume of 132 m³/ha and a projected woody debris biomass of approximately 36 Mg ha-1; this value is lower that the 59 Mg ha-1 dead biomass es mated in the CGSM, Colombia (Simard et al 2008). Smith et al. (1994) in a large spa al survey study immediate to hurricane Andrew, es mated a total woody debris of up 280 Mg ha-1 (135 Mg carbon) including 0.6 and 0.18 Mg of nitrogen and phosphorous.
Rehabilita on and Restora on: biomass produc on in planted/replanted mangrove forestsAs result of the extensive loss of mangrove area and the recognized ecological and economic values of mangrove-dominated ecosystems, there has been an increasing e ort to rehabilitate and restore disturbed forests. Unfortunately, the success has frequently been limited due to the lack of a conceptual framework guiding such e orts, par cularly given the absence of clear objec ves and performance measures to gauge the success of such management strategies (Field 1999, Kairo et al. 2001, Twilley & Rivera-Monroy 2005, Samson & Rollon 2008). Understanding if nutrient and carbon cycling could be rehabilitated in perturbed mangrove forests on a long term basis requires a clear de ni on of terms. Field (1999) proposed that rehabilita on of an ecosystem is the act of “par ally or, more rarely, fully replacing structural or func onal characteris cs of an ecosystem that have been diminished or lost, or the subs tu on of alterna ve quali es or characteris cs than those originally present with proviso that they have more social, economic or ecological value than existed in the disturbed or degraded state”. In contrast, restora on of an ecosystem is “the act of bringing an ecosystem back into, as nearly as possible, its original condi on”. In this conceptual framework, restora on is seen as a special case of rehabilita on. Field (1999) stressed “land use managers are concerned primarily with rehabilita on and are not much concerned with ecological restora on. This is because they require the exibility to respond to immediate pressures and are wary of being obsessed with recapturing the past”. Because this de ni on has not been clearly included in mangrove management plans, it is not surprising that despite the recognized ecological role of mangrove forest there are no long-term studies
Coastal Carbon091102_irl.indd 16 06.11.2009 14:00:59

17
Mangroves
assessing whether the func onal proper es (including carbon sequestra on and primary produc vity) have been restored through management in regions where restora on/rehabilita on projects have been implemented (e.g., Twilley et al. 1998, Samson & Rollon 2008). Recent reviews indicate that newly created mangrove ecosystems may or may not resemble the structure and func on of undisturbed mangrove ecosystems and that objec ves should be clearly established before any major small or landscape level rehabilita on is implemented (Kairo et al. 2001, Lewis 2005, Twilley & Rivera-Monroy 2005).
To our knowledge, there is no published informa on describing projects speci cally aiming to enhance carbon sequestra on through restora on or rehabilita on. However, a good indicator of poten al magnitude of this sink is informa on reported for mangrove planta ons or sites undergoing rehabilita on. Aboveground biomass es mates in replanted mangroves stand have varied from 5.1 Mg ha-1 in a 80 year planta on (Putz & Chan 1986) to 12 Mg ha-1 in a 12 year-old stand (Kairo et al. 2008), with part of the varia on a ributed to the age of planta ons, management systems, species and clima c condi ons (Bosire et al. 2008). Species varia on in root biomass alloca on was observed in a 12-year old replanted mangroves where S. alba allocated higher biomass to the root components (75.5 ± 2.0 Mg ha-1) followed by A. marina (43.7 ± 1.7 Mg ha-1) and R. mucronata 24.9 ± 11.4 Mg ha-1 (Tamooh et al. 2008). From the few data available, it would appear that produc vity of replanted sites is in the same range as expected for natural forests, e.g. li er produc on in 7-year old R. mucronata planta on in Vietnam ranged between 7.1 and 10.4 Mg DW ha-1 yr-1, and 8.9 to 14.2 Mg DW ha-1 yr-1 for R. apiculata monocultures (Nga et al. 2005). Overall, young mangrove forest can store from 2.4 to 5.8 Mg C ha-1 in aboveground biomass while C in root biomass ranges from 21 to 36 Mg C ha-1. These values are rst- order approxima ons based on average carbon content of plant material (48%). The study of McKee & Faulkner (2000) also suggested that produc vity of restored mangrove stands (both above- and belowground) were similar to those of natural stands, and any variability more likely to be related to environmental condi ons rather than to the natural or replanted status. Thus, site selec on and a cri cal assessment of environmental condi ons appears a cri cal factor to ensure that the natural produc vity of replanted mangrove stands is ensured.
Threats to mangrove ecosystemsMangrove forests are es mated to have occupied 75% of the tropical coasts worldwide (Chapman 1976), but anthropogenic pressures have reduced the global range of these forests to less than 50% of the original total cover (Spalding et al.1997, Valiela et al. 2001). These losses have largely been a ributed to anthropogenic pressures such as over-harves ng for mber and fuel-wood produc on, reclama on for
aquaculture and saltpond construc on (Spalding et al., 1997, Farnsworth & Ellison (1997), mining, pollu on and damming of rivers that alter water salinity levels. Oil spills have impacted mangroves drama cally in the Caribbean (Ellison & Farnsworth 1996), but li le documenta on exists for other parts of the world (Burns et al. 1994). Similarly, informa on (if any) about carbon losses associated to clear-falling are di cult to obtain since this ac vity is illegal in most countries; actual records of total biomass extracted to use mangrove area for other purposes (e.g., roads, urban development) is also rare making it di cult to determine this component in global es mates of carbon sequestra on. Field (1999) underlined how, historically, informa on about mangrove use and rehabilita on projects usually remains in the grey literature in government agencies where it is di cult to obtain it for evalua on of management strategies and develop research priori es. Perhaps the major cause of mangrove decline has been conversion of the area to aquaculture. In the Indo-Western Paci c region alone, 1.2 million hectares of mangroves had been converted to aquaculture ponds by 1991 (Primavera 1995). These numbers, given their large magnitude, make it evident that conserva on, rehabilita on and replanta on e orts are cri cally needed to ensure the sustainability of these unique habitats for the future (Duke et al. 2008). There are, however, also posi ve signs emerging: (i) the latest FAO assessments suggests that although the rate of mangrove loss is s ll high, it has decreased signi cantly and was es mated at an annual rela ve loss of ~0.7% the period 2000-2005, (ii) replanta on or rehabilita on ini a ves are increasing, (iii) an increasing number of coastal mangrove wetlands have been designated as Ramsar sites during the past decade.
Management recommenda ons to enhance the poten al of mangroves as a carbon sinkThe data presented above make it clear that rehabilita on/restora on or planta on of mangrove forests are not only to be encouraged based on ecological or socio-economical considera ons, but
Coastal Carbon091102_irl.indd 17 06.11.2009 14:00:59

18
Mangroves
also have the poten al of providing an e cient sink of CO2, both on short and longer me-scales (i.e. biomass produc on during forest establishment and growth, accre on of carbon in mangrove sediments). The magnitude of this carbon sink, however, can be expected to be highly variable, and depends both on factors related to the primary produc on side (i.e. produc vity will depend in part on the species or species assembly, la tude, and site condi ons such as nutrient status, hydrology etc.) and on factors in uencing the degree of longer-term sequestra on of biomass in sediments, such as the rate of sediment deposi on and exchange of carbon with adjacent systems. Indeed, there is a diversity of geomorphological se ngs where mangrove forest growth and develop, and that can be subdivided into a con nuum of landforms based on the rela ve processes of river input, des, and waves (Woodro e, 2002). There is some indica on that these diverse geomorphological habitats, each with di erent vegeta on types, results in speci c mangrove structural and produc vity characteris cs. This correla on between coastal landform and ecological func on has par cularly been documented rela ve to the net primary produc vity (NPP) and detritus exchange across a variety of mangrove loca ons (Twilley & Rivera-Monroy, 2009). Thus, given the paucity of documented case studies, proposing speci c guidelines for mangrove management/rehabilita on in the face of their carbon sink poten al would be premature. Par cularly since mangrove rehabilita on e orts have had mixed success (Field et al. 1998, Kairo et al. 2001 and references therein) and inadequate plan ng strategies can lead to large-scale failures (Samson & Rollon 2008). These ecological and management aspects need to be considered for all mangrove rehabilita on or restora on ini a ves where adequate selec on of the right combina on of both species and sites is cri cal in enabling a successful establishment of mangroves.
One proposed strategy to improve our capability to es mate and forecast mangrove carbon and nutrient cycling pa erns with limited, but robust informa on, is the use of simula on models. This approach, in associa on with eld studies, shows some promises to develop tools for improving and enhancing management plans for mangrove protec on, rehabilita on and restora on; including op mal scenarios for carbon alloca on and CO2 uptake, not only due to landscape-level natural varia ons, but also under the in uence of human disturbances (e.g climate change). Current available models have been useful
in synthesizing current knowledge about mangrove forest dynamics (see Berger et al 2008 and references therein). The modeling approach is suitable for simultaneously evalua ng the e ects of environmental changes and disturbances on ecological processes such as tree recruitment, establishment, growth, produc vity, and mortality (Berger et al. 2008). Such es mates on the sustainability of mangrove resources may contribute not only to evalua ng impacts of mangrove degrada on to socio-economic systems but also help assessing the role of mangrove forest in the global carbon cycle.
A mature Avicennia marina stand during high de (i.e.
ooded) condi ons, Gazi Bay (Kenya) © Steven Bouillon,
K.U.Leuven
Coastal Carbon091102_irl.indd 18 06.11.2009 14:00:59

19
Mangroves
ReferencesAllen JA, Ewel KC, Keeland BD, Tara T, Smith TJ (2000)
Downed wood in Micronesian mangrove forests. Wetlands 20:169-176.
Alongi DM (2008) Mangrove forests: Resilience, protec on from tsunamis, and responses to global climate change. Estuar. Coast. Shelf Sci. 76: 1-13.
Berger U, Rivera-Monroy VH, Doyle TW, Dahdouh-Guebas F, Duke NC, Fontalvo-Herazo ML, Hildenbrandt H, Koedam N, Mehlig U, Piou C, Twilley RR (2008) Advances and limita ons of individual-based models to analyze and predict dynamics of mangrove forests: A review. Aqua c Botany 89: 260-274.
Boonsong K, Piya ra vorakul S, & Patanaponpaiboon P (2003) Poten al use of mangrove planta on as constructed wetland for municipal wastewater treatment. Water Sci. Technol. 48: 257-266.
Bosire JO, Dahdouh-Guebas F, Walton M, Crona BI, Lewis III RR, Field C, Kairo JG, & Koedam N (2008) Func onality of restored mangroves: a review. Aqua c Botany 89: 251-259.
Bouillon S, Borges AV, Castañeda-Moya E, Diele K, Di mar T, Duke NC, Kristensen E, Lee SY, Marchand C, Middelburg JJ, Rivera-Monroy V, Smith TJ, and Twilley RR (2008). Mangrove produc on and carbon sinks: a revision of global budget es mates. Global Biogeochemical Cycles 22, GB2013, doi:10.1029/2007GB003052.
Bouillon S, Dahdouh-Guebas F, Rao AVVS, Koedam N, & Dehairs F (2003) Sources of organic carbon in mangrove sediments: variability and possible implica ons for ecosystem func oning. Hydrobiologia 495: 33-39.
Burns KA, Garrity S, Jorissen D, MacPherson J, Stoel ng M, Tierney J, & Yelle-Simmons L (1994). The Galeta Oil Spill II. Unexpected persistence of oil trapped in mangrove sediments. Estuar. Coast. Shelf Sci. 38: 349–364.
Chapman VJ (1976) Mangrove Vegeta on. J. Cramer, Germany.
Chmura GL, Anisfeld SC, Cahoon DR, & Lynch JC (2003) Global carbon sequestra on in dal, saline wetland soils. Glob. Biogeochem. Cycles, 17, 1111, doi:10.1029/2002GB001917.
Dahdouh-Guebas F, Jaya ssa LP, Di Ni o D, Bosire J, Lo Seen D, & Koedam N (2005) How e ec ve were mangroves as a defence against the recent tsunami? Current Biology 15: R443-R447.
Das S, & Vincent JR (2009) Mangroves protected villages and reduced death toll during Indian super cyclone. PNAS 106: 7357-7360.
Duke NC, Meynecke JO, Di man S, Ellison AM, Anger K, Berger U, Cannicci S, Diele K, Ewel KC, Field CD, Koedam N, Lee SY, Marchand C, Nordhaus I, & Dahdouh-Guebas F (2007) A world without mangroves? Science 317: 41-42.
FAO (2007) The world’s mangroves 1980-2005. FAO Forestry Paper 153, Food and Agriculture Organiza on of the United Na ons, Rome, 2007. Available from h p://www.fao.org/forestry/3643/en/
Farnsworth EJ, & Ellison AM (1997) The global conserva on status of mangroves. Ambio 26 : 328-334.
Field CD (1998) Rehabilita on of mangrove ecosystems: an overview. Mar. Pollut. Bull. 37: 383-392.
Granek E, & Ru enberg BI (2008) Changes in bio c and abio c processes following mangrove clearing. Estuar. Coast. Shelf Sci. 80: 555-562.
Kairo JG, Dahdouh-Guebas F, Bosire J, & Koedam N (2001) Restora on and management of mangrove systems – a lesson for and from the East African region. S. Afr. J. Bot. 67: 383-389.
Kairo, J. G., Lang’at, J. K. S., Dahdouh-Guebas, F., Bosire, J. O and Karachi, (2008) M. Structural Development and Produc vity of Replanted Mangrove Planta ons in Kenya. Forest Ecology and Management 255: 2670 -2677
Kathiresan K, Bingham BL (2001) Biology of mangroves and mangrove ecosystems. In: Advances in Marine Biology 40: 81-251.
Kathiresan K, & Rajendran N (2005) Coastal mangrove forests mi gated tsunami. Estuar. Coast. Shelf Sci. 65: 601-606.
Komiyama A, Ong JE, & Poungparn S (2008) Allometry, biomass, and produc vity of mangrove forests: a review. Aquat. Bot. 89: 128-137.
Krauss KW, Doyle TW, Twilley RR, Smith TJ, Whelan KRT, Sullivan JK (2005) Woody debris in the mangrove forests of South Florida. Biotropica 37: 9-15.
Krauss KW, Lovelock CE, McKee KL, Lopez-Ho man L, Ewe SML, & Sousa WP (2008) Environmental drivers in mangrove establishment and early development: a review. Aquat. Bot. 89: 105-127.
Kristensen E, Bouillon S, Di mar T, & Marchand C (2008) Organic ma er dynamics in mangrove ecosystems. Aquat. Bot. 89: 201-219.
Lewis RR (2005) Ecological engineering for successful management and restora on of mangrove forests. Ecol. Engineer. 24: 403-418.
McKee KL, & Faulkner PL (2000) Restora on of biogeochemical func on in mangrove forests, Restor. Ecol. 8: 247-259.
Middelburg JJ, Nieuwenhuize J, Lubberts RK, & van de Plassche O (1997- Organic carbon isotope systema cs of coastal marshes. Estuar. Coast. Shelf Sci. 45: 681-687
Mumby PJ, Edwards AJ, Arias-Gonzalez JE, Lindeman KC, Blackwell PG, Gall A, Gorczynska MI, Harborne AR, Pescod CL, Renken H, Wabnitz CCC, & Llewellyn G (2004). Mangroves enhance the
Coastal Carbon091102_irl.indd 19 06.11.2009 14:01:06
20
Mangroves
biomass of coral reef sh communi es in the Caribbean. Nature 427: 533-536.
Nagelkerken I, Blaber S, Bouillon S, Green, P, Haywood M, Kirton LG, Kumar S, Meynecke J-O, Pawlik J, Penrose H, Sasekumar A, & Somer eld P (2008). The habitat func on of mangroves for terrestrial and marine fauna: a review. Aqua c Botany 89: 155-185.
Nga BD, Tinh HQ, Tam DT, Sche er M, & Roijackers R (2005) Young mangrove stands produce a large and high quality li er input to aqua c systems. Wetl. Ecol. Manag. 13: 569-576.
Perry C, & Berkely A (2009) Inter dal substrate modi ca ons as a result of mangrove plan ng: impacts of introduced mangrove species on sediment microfacies characteris cs. Estuar. Coast. Shelf Sci. 81: 225-237.
Polit JI, Brown S (1996) Mass and nutrient content of dead wood in a central Illinois oodplain forest. Wetlands 16: 488-494.
Primavera JH (1995) Mangroves and brackishwater pond culture in the Philippines. Hydrobiologia 295: 303-309.
Putz FE, & Chan HT (1986) Tree growth, dynamics and produc vity in a mature mangrove forest in Malaysia. Forest Ecol. Manag. 17: 211-230.
Rivera-Monroy VH, Twilley RR, Mancera E, Alcantara-Eguren A, Castañeda-Moya E, Casas- Monroy O, Reyes F, Restrepo J, Perdomo. L, Campos E, Cotes G, Villoria E (2006) Adventures and misfortunes in Macondo: Rehabilita on of the Cienaga Grande de Santa Martaa Lagoon Complex, Colombia. Ecotropicos 19:72-93.
Saenger P, & Snedaker SC (1993) Pantropical trends in mangrove aboveground biomass and annual li erfall. Oecologia 96: 293-299.
Samson MS, & Rollon RN (2008) Growth performance of planted mangroves in the Philippines: revisi ng forest management strategies. Ambio 37: 234-240.
Simard M, Rivera-Monroy VH, Mancera-Pineda JE, Castaneda-Moya E, Twilley RR (2008) A systema c method for 3D mapping of mangrove forests based on Shu le Radar Topography Mission eleva on data, ICEsat/GLAS waveforms and eld data: Applica on to Cienaga Grande de Santa Marta, Colombia. Remote Sensing of Environment 112: 2131-2144.
Smith TJ, Robble MB, Wanless HR, Doyle TW (1994) aall. BioScience 44: 256-262.
Spalding MD, Blasco F, & Field CD (eds.) (1997) World Mangrove Atlas. Interna onal Society for Mangrove Ecosystems, Okinawa, Japan. 178pp.
Tamooh F, Huxham M, Karachi M, Mencuccini M, Kairo JG & Kirui B (2008) Below-ground root yield and distribu on in natural and replanted mangrove forests at Gazi Bay, Kenya. Forest Ecol Managem. 256: 1290-1297.
Twilley RR (1995) Propier es of mangroves ecosystems and their rela on to the energy signature of coastal environments. In: Hall CAS (ed) Maximum Power. Colorado Press, Colorado, p 43-62.
Twilley RR, Chen RH, & Hargis T (1992) Carbon sinks in mangrove forests and their implica ons to the carbon budget of tropical coastal ecosystems. Water Air Soil Pollut. 64: 265-288.
Twilley RR, Rivera-Monroy VH (2005) Developing performance measures of mangrove wetlands using simula on models of hydrology, nutrient biogeochemistry, and community dynamics. J. Coast. Res. 40:79-93.
Twilley, R.R and Rivera-Monroy, V.H. 2009. Models of Nutrient Biogeochemistry for Mangrove Wetlands. In: Gerardo M. E. Perillo, Eric Wolanski, Donald R. Cahoon, Mark M. Brinson, editors, Coastal Wetlands: An Integrated Ecosystem Approach. Elsevier, 2009, p. 641-683.
Twilley RR, Rivera-Monroy VH, Chen R, Botero L (1998) Adap ng and ecological mangrove model to simulate trajectories in restora on ecology. Mar. Pollut. Bull. 37: 404-419.
Valiela I, Bowen JL, & York JK (2001) Mangrove forests: one of the world’s threatened major tropical environments. BioScience 51: 807-815.
Vermaat JE, & Thampanya U (2005) Mangroves mi gate tsunami damage: a further response. Estuar. Coast. Shelf Sci. 69: 1-3.
Woodro e, C.D., 2002. Coasts: Form, Process, Evolu on. Cambridge University Press, Cambridge, U.K.
Wu Y, Chung A, Tam NFY, Pi N, & Wong MH (2008) Constructed mangrove wetlands as secondary treatment system for municipal wastewater. Ecol. Engineer. 34: 137-146.
Yanagisawa H, Koshimura S, Goto K, Miyagi T, Imamura F, Ruangrassamee A, & Tanavud C (2009) The reduc on e ects of mangrove forest on a tsunami based on eld surveys at Pakarang Cape, Thailand and numerical analysis. Estuar. Coast. Shelf Sci. 81: 27-37
Coastal Carbon091102_irl.indd 20 06.11.2009 14:01:06

Coastal Carbon091102_irl.indd 21 06.11.2009 14:01:06

Global distribution of Seagrasses
Seagrasses
Coastal Carbon091102_irl.indd 22 06.11.2009 14:01:17

23
Seagrass Meadows
Hilary KennedySchool of Ocean Sciences
Bangor UniversityMenai Bridge, Anglesey, LL59 5AB, UK
+44 1248 [email protected]
Mats BjörkAssociate Professor in Marine Plant Physiology.
Botany Department, physiology sec onStockholm University
106 91, Stockholm, [email protected]
Fast facts• Flowering marine plants that form extensive meadows and are globally distributed. Found in shallow
waters of all con nents except the Antarc c.• Responsible for about 15% of total carbon storage in the ocean.• Global extent of seagrass now es mated to be about 0.3 million km2.• Turnover me of seagrass biomass is long (2 weeks to 5 years for leaves and roots, while rhizomes can
some mes persist for millennia), rela ve to that of phytoplankton, making the role of seagrasses in the oceanic carbon budget propor onally more signi cant than expected from their areal cover.
• Long-term carbon burial of 83 g C m-2yr-1. This translates to global storage rates of between 27 and 40 Tg C yr-1.
• The seagrass Posidonia oceanica is currently thought to be the most e ec ve species in terms of long-term carbon storage. It is endemic to the Mediterranean and locally widespread. The capacity of it’s meadows to accumulate carbon exceeds that of many terrestrial ecosystems such as boreal forests and show values commensurate with wetlands.
• However, two-thirds of the world’s seagrass meadows within inhabited areas have been lost through human ac vi es that lead to eutrophica on and silta on.
• Management plans aimed at reducing the nutrient loads and preserving water clarity of coastal waters are a priority.
Seagrasses, a globally distributed group of marine owering plants, form extensive meadows that are
one of the world’s most produc ve ecosystems. The seagrass leaves degrade slowly and, through their roots and rhizomes, seagrasses deposit large amounts of underground, partly mineralised, carbon. Thus, they cons tute an important CO2 sink, responsible for about 15% of the total carbon storage in the ocean. In this chapter, we present a brief overview of what seagrasses are; their ecological func ons and their importance as carbon sinks; the threats to them; as well as recommenda ons on how to manage them to preserve/restore their capacity.
1. Ecosystem de ni on and global occurrenceThe seagrasses, a func onal group of about 60 di erent species of underwater owering plants, have a near global distribu on, and form extensive seagrass meadows in the coastal waters of all the world’s con nents except the Antarc c (Figure 1). In temperate areas, the meadows are usually dominated by one or a few species (e.g. Zostera marina in the North Atlan c), whereas tropical meadows are usually more diverse, o en with up to ten or even thirteen species.
Extent and the func ons they provide in the marine ecosystem: The global extent of seagrass meadows
Coastal Carbon091102_irl.indd 23 09.11.2009 08:00:39

24
Seagrass Meadows
has been es mated to between 0.6 million km2 (Charpy-Roubaud & Sournia, 1990) and 0.3 million km2 (Green & Short, 2003; Duarte et al., 2005), with the la er es mate taking into account reports of long-term decline rates in seagrass coverage. Although seagrass meadows cover a rela vely small por on of the ocean (approx 1%), they play an important role in the coastal zone and provide ecosystem goods and services that have been es mated to be of high value compared with other marine and terrestrial habitats (Costanza et al., 1997). Furthermore, the presence of seagrass meadows is global, unlike mangroves, corals or salt marsh plants, which have a more limited spa al distribu on (Short et al., 2007)
Seagrass meadows provide important services suppor ng the overall func oning of the coastal zone. Some larger animals (like dugongs, turtles, geese, and some sh) are able to digest seagrass leaves. However, more important is the fact that the leaves of seagrasses o en become covered by a wide range of algae and invertebrates, which are eaten by a variety of fauna, which both live within the seagrass meadow and migrate from outside the meadows. The dense cover of seagrass shoots also cons tutes a sheltering structure, a rac ng several species of animals. Fish use the seagrass meadow as a nursery where their fry can hide, prawns se le in the seagrass meadows at their post-larval stage and remain there un l they become adults (Watson et al. 1993). Moreover, several
animals migrate from other habitats, like coral reefs and mangrove areas, to the seagrass meadows to feed (Unsworth et al. 2008), sugges ng that seagrass meadows provide an important link between terrestrial and other marine habitats (Heck et al., 2008).
Other important func ons of seagrass meadows are their sediment trapping and sediment binding capaci es. They trap suspended materials from the currents, and thereby clear the water. The rhizome and root systems stabilise the sediments and help prevent coastal erosion during storms, rains and oods. Seagrass detritus is also important, through export and maintenance of food-webs in deeper waters and as an important carbon sink, due to its slow rate of decomposi on.
Biomass and produc on: The average standing biomass built up within seagrass meadows of 184 gC m-2 (Duarte & Chiscano, 1999) is rela vely low compared with terrestrial ecosystems as it represents les than 1% of the average standing biomass in tropical, temperate and boreal forests combined (Table 1,). In contrast, the absolute rate of seagrass net produc on (400-817 gC m-2 yr-1), which is of comparable magnitude to other coastal plants, is in fact higher than most terrestrial ecosystems (Table 1, Duarte & Chiscano, 1999; Mateo et al., 2006). Added to this, in the marine environment, the turnover me of seagrass leaves is long (15-1827 days), rela ve to the few days of phytoplankton,
Figure 1 Syringodium sp growing in dense meadows o the coast of Tanga, Tanzania. (photo Jerker Tamelander/IUCN)
Coastal Carbon091102_irl.indd 24 06.11.2009 14:01:30

25
Seagrass Meadows
making the role of seagrasses in the oceanic carbon budget propor onally more signi cant than expected from their cover or primary produc on alone (Smith, 1981).
Many seagrasses also deposit considerable amounts of carbon in their below-ground ssues with ra os of below-ground to above-ground biomass ranging from 0.005 to 8.56 (Duarte & Chiscano, 1999). Larger seagrass species tend to develop high below-ground biomass and hence have a greater capacity for accumula on of carbon due to the rela vely slow turnover of the roots and rhizomes (40 days to 19 years). The seagrass species Posidonia oceanica can bury large amounts of the carbon it produces, resul ng in partly mineralised, several metres thick, underground ma es with an organic carbon content of as much as 40 %. These ma es can persist for millennia, thus represen ng a long-term carbon sink (Pergent et al., 1994; Romero et al., 1994; Mateo et al., 1997, 2006).
2. Carbon cycling in the ecosystem and its importance as a carbon sinkFate of carbon: The propor on of biomass produced by seagrasses that is directed into carbon storage is dependent on the extent to which carbon is channelled through herbivory, export and decomposi on.
Es mates of herbivory, decomposi on and export all vary greatly due to the intrinsic proper es of individual species and although carbon uxes in di erent species may follow the same general routes, the rela ve importance of the di erent carbon pathways among seagrass species may di er widely.
Overall, herbivory generally has a limited role in constraining seagrass biomass with most es mates being <10% of plant produc on. In coastal vegeta on, only mangroves have a lower propor on of their net biomass produc on lost through herbivory (Duarte & Cebrian, 1996; Cebrian, 2002). The extent of herbivory in seagrasses re ects speci c intra and inter-species di erences and ranges from negligible values up to 50% of net produc on (Cebrian & Duarte 1998; Mateo et al., 2006). An important fact to note is that few herbivores consume below-ground produc on and yet these ssues (roots and rhizomes) can cons tute 15-50% of the net produc on. Thus, in some species the below-ground deposits can accumulate and contribute strongly to the carbon stored in the sediment.
Thus, only a small propor on of seagrass biomass is lost to herbivory and the major pathway for leaf produc on is to enter the detritus, some frac on of which is exported, while most is decomposed locally.
Ecosystem NPP(gC m-2 a-1)
Standing stock(gC m-2)
Area (*1012 m2)
NPP(PgC a-1)
Global carbon stocks(PgC)
Plants Soil Plants SoilTropical forests 778 12045 12,273 17.6 13.7 212 216Temperate forests 625 5673 9,615 10.4 6.5 59 100Boreal forests 234 6423 34,380 13.7 3.2 88 471Tropical savannas and grasslands
787 2933 11,733 22.5 17.7 66 264
Temperate grasslands and shrublands
424 720 23,600 12.5 5.3 9 295
Deserts and semi-deserts
31 176 4,198 45.5 1.4 8 191
Tundra 105 632 12,737 9.5 1 6 121Croplands 425 188 8,000 16 6.8 3 128Wetlands 1229 4286 72,857 3.5 4.3 15 225Seagrass meadows(Posidonia oceanica)
400-817(60-184a)
184(124b)
7,000c
(40,000-160,000d)
0.3(0.035)
0.49(0.002-0.0064)
0.06(0.004)
2.1(1.4-5.6)
Table 1 Comparison of carbon stocks on a unit area basis in terrestrial ecosystems (Janzen et al., 2004) and seagrass meadows
(Duarte & Cebrian 1996, Duarte & Chiscano 1999,Duarte et al., 2005), with global pools determined by using the reported
surface areas covered by each ecosystems.
a. Pergent et al., 1994, b. Romero et al., 1992, c. Calculated using organic carbon concentra on of 0.7 wt%, porosity of 80% and
dry solid density 2.5 g cm-2, d. Mateo et al., 1997
Coastal Carbon091102_irl.indd 25 06.11.2009 14:01:36

26
Seagrass Meadows
Compared to other coastal plants, the decomposi on rate of seagrass ssues is low, averaging 0.0107 d-1, compared to 0.0526 d-1 for phytoplankton and 0.082 d-1 for mangroves (Enriquez et al., 1993, Duarte & Chiscano, 1999). The di erence among ecosystems in the frac on of net produc on that is decomposed has been suggested to be related to ssue nutrient concentra ons, with the slower growing seagrass species generally having lower nutrient concentra ons (Duarte, 1990) and hence the lowest decomposi on rates. In addi on, roots and rhizomes generally tend to have a lower nutrient concentra on than leaves, leading to the slower decomposi on of below-ground than above-ground biomass.
Based on a compila on of available data, Duarte & Cebrian (1996) es mated that the largest part of the biomass produced is decomposed (50%), with export and herbivory amoun ng to 24. and 19% respec vely, and the remaining 16% is stored (Figure 1). However, it must be noted that these are average values and therefore do not iden fy the rela ve importance of di erent seagrass species, in that some species may route more carbon to storage than others. The data compila on also showed an imbalance in the number of observa ons that cons tute each average value, with observa ons for seagrass above ground biomass and net produc on far outweighing the number of observa ons of below-ground biomass, herbivory, export, decomposi on and storage, with the la er probably being the least reported. For example, in a recent assessment of long-term (i.e. decades) carbon burial in vegetated sediments, the measured rates of carbon burial comprised of only ve es mates and in
a compila on of short-term (i.e. years) accumula on of seagrass ssues, the data set for carbon storage comprised of only about ten es mates. The accuracy of some es mates can also be called into ques on as they have not been measured directly, but have been calculated by measuring the other carbon routes and simply assuming that storage represents the missing term in the carbon budget.
Carbon storage: Es mates of the short-term (years) carbon storage in sediments average 133 gC m-2 yr-1 (range 10-350 gC m-2 yr-1, n=10, Cebrian, 2002). This value compares well with direct es mates of longer term carbon burial, averaging 83 gC m-2 y-1 (range 45-190 gC m-2 yr-1, n=5, Duarte et al., 2005). These values translate to global storage rates of between 27 TgC yr-1 and 40 TgC yr-1 assuming the areal coverage of seagrass as 0.3*1012 m2. The data sets used in calcula ons of longer term carbon burial are obtained from a restricted geographical area (the Mediterranean) and are representa ve of meadows consis ng of only two seagrass species (Cymodocea nodosa and Posidonia oceanica ). It is not yet clear whether other seagrass species (e.g. Thalassodendron ciliatum, Posidonia australis and P. oceanica), which are known to produce organic ma er that generates refractory deposits, also make a signi cant contribu on to long term carbon burial (Mateo et al., 2006). The es mates of short term carbon storage, although more geographically spread, only include four addi onal geographic areas (in America and Europe) and two addi onal types of seagrass ( Zostera sp. and Thalassia testudinium).
Based on the data from Duarte et al (2005), most
Figure 2 Fate of primary produc on, values in brackets represent% of net primary produc on. The data were derived by
averagingindependent es mates from a range of seagrass species (adapted from Cebrian 1999 & Duarte & Cebrian 1996)
Coastal Carbon091102_irl.indd 26 06.11.2009 15:47:43

27
Seagrass Meadows
seagrass burial rates are about half as high as those for mangroves and salt marshes on an areal basis, and account for 12%, 9% and 25% respec vely of the total carbon burial in coastal sediments. However, the rates of long-term carbon accumula on by Posidonia oceanica exceed those of terrestrial ecosystems and show values commensurate with wetlands (Table 2). Reported cases of seagrass loss have increased by an order of magnitude over the last 40 years (Orth et al., 2006) and the areal extent of seagrasses has been es mated to have reduced by 50% over a period of about 15 years (Duarte et al 2005), thus it is possible that the propor on of the global carbon sink that is represented by seagrass meadows has been depleted by a similar amount. Hence, a be er quan ca on of the magnitude of carbon sinks in seagrass meadows and a be er understanding of future trends for seagrass meadows will be necessary if we are to fully realise how the capacity of the coastal zone to act as a carbon sink will change in the future.
3. Threats to the ecosystemHuman interven ons have altered coastal habitats severely, causing extensive losses in seagrass habitats (Orth et al., 2006; Björk et al., 2008). For example, in the northwest Atlan c 65% of eelgrass has been lost south of Cape Cod, an industrialized area, as compared to only 20% lost north of Cape Cod, a less populated and industrialized area, since European se lement (Short & Short, 2003). It has even been proposed that two thirds of the seagrass meadows of the world within inhabited areas have been lost (Lotze et al., 2006). The major causes of decline are anthropogenic disturbances that lead to eutrophica on and silta on; drivers that
may be accelerated by global climate change now and in the near future. Sedimenta on from watershed, terrestrial deforesta on and mangrove clearing leads to transport of sediments through rivers and streams to estuaries and coastal waters, reducing water clarity and nega vely a ec ng seagrass growth and development. Similarly, eutrophica on caused by waste discharges into coastal areas have major impacts on water clarity, thus reducing the light available to seagrass (Terrados et al., 1998). Seagrasses are par cularly suscep ble to altera ons in water clarity as they normally require higher light levels compared to other aqua c vegeta on.
Global change impacts, such as increases in the concentra on of CO
2 in seawater and consequently decreasing pH values (ocean acidi ca on), will probably directly a ect seagrass photosynthesis and growth. However, as of today, too li le data is available to predict the e ects of such changes on the produc vity of seagrass meadows. The main e ect of global change will probably be synergis c, where already stressed seagrass systems will be exposed to addi onal stressors, further reducing produc vity and eventually resul ng in increased losses of seagrass meadows (Björk et al., 2008).
4. Management recommenda ons to enhance the poten al of the ecosystem as a carbon sinkThe carbon sink service that seagrass meadows provide can only be sustained by preserving the health and extent of the world’s seagrass meadows. Evidence shows that it is di cult to reverse seagrass loss at the meadow scale (Ralph et al., 2005; Orth et al., 2006), but conserva on and restora on of less extensively a ected meadows could be possible. Thus, management should be directed towards maintaining general environmental condi ons that favour seagrass growth. However, since di erent seagrass species appear to have di erent capaci es for carbon storage, it is also possible to speci cally target those to maximise their carbon storage func on.
Management aimed at preserving general health of seagrass meadows: Because the observed global decline in seagrass distribu on is mainly caused by human ac vi es such as sediment loading and eutrophica on, management plans aimed at reducing the nutrient loads and preserving water clarity of coastal waters becomes a priority (Björk et al., 2008). Controlling anthropogenic ac vi es is one of the main ways that good seagrass health and hence produc vity
Ecosystem typeLong-term rate of accumula on(gC m-2 a-1)
Tropical forests 2.3-2.5Temperate forests 1.4 – 12.0Boreal forests 0.8 – 2.2Temperate grasslands 2.2Temperate deserts 0.8Tundra 0.2 – 5.7Wetlands 20Posidonia oceanica meadows 9 – 112
Table 2 Long-term carbon accumula on rates in Holocene (<10,000yr old) soils and wetlands (Schlesinger 1990, Armentano & Menges1986) and Posidonia oceanica (6,000 yr old) as one of the few species of seagrass that accumulate refractory organic ma er in below-ground deposits termed ma es (Romero et al., 1994, Mateo et al., 1997, 2006).
Coastal Carbon091102_irl.indd 27 06.11.2009 14:01:37

28
Seagrass Meadows
can be preserved (see Short et al., 2002, Short & Burdick, 2005, Björk et al., 2008). To provide the most favourable condi ons a number of requirements must be met. 1. A high water quality, This mean low turbidity waters, low concentra ons of coloured dissolved organic ma er and low levels of eutrophica on. All of these will ensure that the waters support su cient light penetra on for seagrasses to thrive. 2. Good sediment condi ons. The sediments should experience only low levels of disturbance/mechanical perturba ons, low carbon accumula on rates and low concentra ons of sulphide. 3. Maintenance of gene c variability and connec vity with other biological systems, and 4. Favourable water movement
In recent years it has become evident that these requirements cannot be met without crea ng a public awareness of the purpose of the management plans, and ensuring the par cipa on by stakeholders, both in planning and implementa on of management strategies.
Management aimed at preserving especially high carbon storage capacity: There are certain features of seagrasses that can enhance their poten al to act as important sites for carbon storage. The low nutrient concentra ons and high propor on of structural carbon in seagrass ssues, enhance carbon accumula on in the meadow by slowing down the destruc on of organic carbon, and the large propor on of below ground biomass enhance carbon accumula on in the meadow by burying organic carbon quickly, before it can be exported from the meadow. It follows that the greatest propor on of organic carbon preserved in the sediments will be found in meadows consis ng of slow growing species with a high alloca on of biomass to the growth of below ground organs.
Of all the seagrasses studied, Posidonia oceanica probably represents one of the best species for carbon storage; it is also the best studied species in terms of carbon burial and probably provides the best es mate of the size of the carbon sink in at least one area of our coastal oceans. Posidonia oceanica is widespread and endemic to the Mediterranean and sustains carbon burial rates of 17-191 g Cm-2 yr-1, forming a ma e that can be thousands of years old. The thickness of the ma e in one bay of the NW Mediterranean has been recently es mated using high-resolu on seismo-acous c imaging (Iacono et al., 2008), allowing the carbon accumula on to be calculated at 0.18 Mg m-2. Given that Posidonia oceanica is thought to cover
0.035 million km2 of the Mediterranean, the sediments below Posidonia oceanica meadows could represent a store of ~6 x 10¹⁵ tonnes of carbon, with a carbon accumula on rate of between 0.6-7 MgC yr-1 or 2-24% of global seagrass burial.
Although Posidonia oceanica may appear to make the Mediterranean a hot spot in terms of carbon burial, other seagrass species may, although today undiscovered, have similar poten al for carbon burial. Even species with a lower carbon burial but a more widespread distribu on may actually make a larger overall contribu on to global carbon storage. Thus to make accurate predic ons concerning the fate of seagrass produc on on a global scale, reliable es mates of the distribu on and density of the domina ng seagrass species in all di erent biogeographical regions and the poten al of each species for carbon burial would be needed. These gures for seagrasses are not currently available as shown in a review of the literature on seagrass ecology (Duarte 1999). Of the papers reviewed in this study, 25% related to the ecology of just two of the seagrass species (Thalassia testudinium + Posidonia oceanica) and there was a geographic bias in published results, with 50% of the studies being undertaken in Caribbean and Mediterranean seagrass meadows.
Thus today, although we can only approximate the current importance of seagrass meadows as a carbon sink, the recent focus within the scien c community on global change and the importance of natural carbon sinks has resulted in a large number of research projects aiming at making it possible to incorporate the biogeography of seagrass species and their propensity for carbon storage into an accurate global carbon budget.
ReferencesArmentano TV & Menges ES 1986 Pa erns of change in
the carbon balance of organic soil-wetlands of the temperate zone. Journal of Ecology 74, 755-774.
Björk M., Short F., Mcleod, E. and Beer, S. 2008. Managing seagrasses for resilience to climate change. IUCN, Gland, Switzerland. 56pp.
Cebrián J. (2002) Variability and control of carbon consump on, export, and accumula on in marine communi es. Limnol. Oceanogr. 47(1): 11-22.
Cebrián J and Duarte CM. (1998) Pa erns in leaf herbivory on seagrasses. Aqua c Botany 60: 67-82
Charpy-Roubaud C and Sournia A 1990 The compara ve es ma on of phytoplankton microphytobenthic produc on in the oceans. Marine Microbial Food Webs 4: 31-57.
Coastal Carbon091102_irl.indd 28 06.11.2009 14:01:37
29
Seagrass Meadows
Costanza R, d’Arge R, Groot de R. Farber S, Grasso M, Hannon B, Limburg K, Naeem S, O’Neill RV, Paruelo J, Raskin RG, Su on P, Belt van den M. (1997) The value of the world’s ecosystem services and natural capital. Nature 387: 253-260.
Duarte CM. 1990 Seagrass nutrient content. Marine Ecology Progress Series 67, 201-207.
Duarte CM. 1999 Seagrass ecology at the turn of the millennium: challenges for the new century. Aqua c Botany 65: 7-20.
Duarte CM and Cebrián J.1996 The fate of marine autotrophic produc on. Limnol. Oceanogr. 41(8): 1758-1766.
Duarte CM and Chiscano CL. 1999 Seagrass biomass and produc on: a reassessment. Aqua c Botany 65: 159-174.
Duarte CM, Middelburg JJ, Caraco N. 2005 Major role of marine vegeta on on the oceanic carbon cycle. Biogeosciences 2: 1-8.
Enriquez S, Duarte CM, Sand-Jensen K. 1993 Pa erns in decomposi on rates among photosynthe c organisms: the importance of detritus C:N:P content. Oecologia 94: 457-471
Green EP and Short FT 2003 World Atlas of Seagrasses. California University Press 310pp
Heck Jr. KL, Carruthers TJB, Duarte CM, Hughes AR, Kendrick G, Orth RJ Williams SW. 2008 Trophic Transfers from Seagrass Meadows Subsidize Diverse Marine and Terrestrial Consumers. Ecosystems 11: 1198-1210.
Janzen H.H. 2004 Carbon cycling in earth systems – a soil science perspec ve. Agriculture ecosystems and Environment 104, 399-417.
Lotze, H.K., Lenihan, H.S., Bourque, B.J., Bradbury, R.H., Cooke, R.G., Kay, M.C., Kidwell, S.M. Kirby, M.X., Peterson, C.H. and Jackson, J.B.C. 2006. Deple on, degrada on, and recovery poten al of estuaries and coastal seas. Science 312: 1806-1809.
Mateo MA, Romero J, Pérez, Li ler MM, Li ler DS. 1997 Dynamics of Millenary Organic Deposits Resul ng from the Growth of the Mediterranean Seagrass Posidonia oceanica. Estuarine, Coastal and Shelf Science 44: 103-110.
Mateo MA Cebrian J Dunton K Mutchler T 2006 Carbon ux in seagrass ecosystems. In W.D. Larkum, R.J.
Orth, C.M. Duarte (Eds). Seagrasses: Biology, Ecology and Conserva on. Springer 567-593.
Orth RJ, Carruthers TJB, Dennison WC, Duarte CM, Fourqurean JW, Heck Jr. KL, Hughes AR, Kendrick GA, Kenworthy WJ, Olyarnik S, Short FT, Wayco M, Williams SL. 2006 A Global Crisis for Seagrass Ecosystems. Bioscience 56: (12) 987-996.
Pergent G. Romero J. Pergent-Mar ni C. Mateo M-A. Boudouresque C-F 1994 Primary produc on, stocks and uxes in the Mediterranean seagrass Posidonia oceanica. Marine Ecology Progress Series 106, 139-146.
Ralph PJ Tomasko D Moore K Seddon S Macinnis-Ng CAO 2006 Human impacts on seagrasses: Eutrophica on, sedimenta on and contamina on. In W.D. Larkum, R.J. Orth, C.M. Duarte (Eds). Seagrasses: Biology, Ecology and Conserva on. Springer 567-593.
Romero J. Pergent G. Pergent-Mar ni C. Mateo M-A. Regnier C. 1992 The detri c compartment in a Posidonia oceanica meadow: li er features, decomposi on rates, and mineral stocks. PSZNI Marine Ecology 13(1) 69-83.
Romero J, Pérez M, Mateo MA, Sala A. 1994 The belowground organs of the Mediterranean seagrass Posidonia oceanica as a biogeochemical sink. Aqua c Botany 47: 13-19
Schlesinger WH 1990 Evidence from chronosequence studies for a low carbon storage poten al of soils. Nature 348, 232-234.
Short FT and Short CA 2003. Seagrass distribu on in the western North Atlan c. in: World Atlas of Seagrasses, Green EP, Short TF (eds) World Atlas of Seagrasses. University of California Press, Berkeley.
Short FT and Burdick DM 2005 “Eelgrass Restora on and Site Selec on Model” A CD that u lises readily available local data to determine priori zed loca ons for the restora on of eelgrass beds. When coupled with a GIS program, maps are produced that iden fy sites with the best poten al for eelgrass restora on. For a copy, email: [email protected]
Short, F.T., Davis, R.C., Kopp, B.S., Short, C.A., and Burdick, D.M. 2002 Site selec on model for op mal restora on of eelgrass, Zostera marina L. Marine Ecology Progress Series 227: 263-267.
Short F, Carruthers T, Dennison W, Wayco M. (2007) Global seagrass distribu on and diversity: A bioregional model. Journal of Experimental Marine Biology and Ecology 350: 3-20.
Smith SV. (1981) Marine Macrophytes as a Global Carbon Sink. Science 211: 838-840.
Terrados, J., Duarte, C.M., Fortes, M.D., Borum, J., Agawin, N.S.R., Bach, S., Thampanya, U., Kamp-Nielsen, L., Kenworthy, W.J., Geertz-Hansen, O. Vermaat, J. 1998. Changes in community structure and biomass of seagrass communi es along gradients of silta on in SE Asia. Estuarine, Coastal and Shelf Science 46: 757-768.
Unsworth, R.K.F., De Leó n, P.S., Garrard, S.L., Jompa, J., Smith, D.J. and Bell, J.J. 2008. High connec vity of Indo-Paci c seagrass sh assemblages with mangrove and coral reef habitats. Marine Ecology Progress Series 353: 213-224.
Watson, R.A., Coles, R.G. and Lee Long, W.J. 1993. Simula on es mates of annual yield and landed values for commercial penaeid prawns from tropical seagrass habitat, Northern Queensland, Australia. Australian Journal of Marine and Freshwater Research 44: 211-219.
Coastal Carbon091102_irl.indd 29 06.11.2009 14:01:37
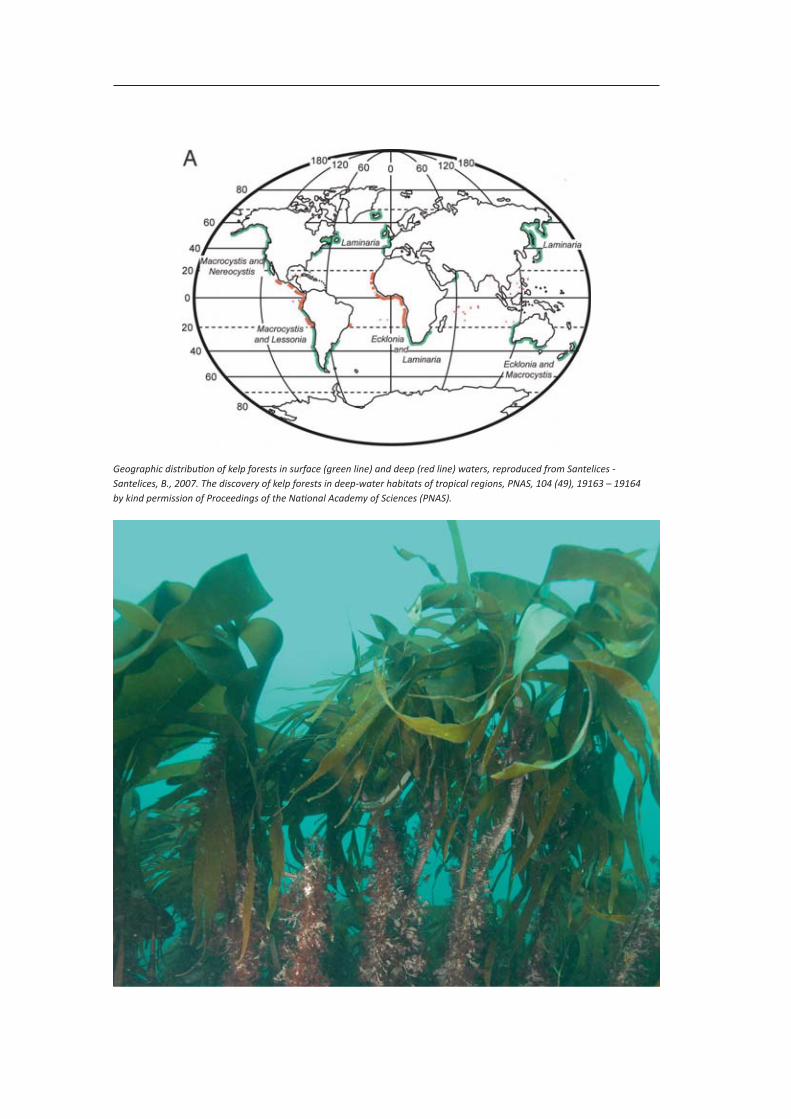
Geographic distribu on of kelp forests in surface (green line) and deep (red line) waters, reproduced from Santelices - Santelices, B., 2007. The discovery of kelp forests in deep-water habitats of tropical regions, PNAS, 104 (49), 19163 – 19164by kind permission of Proceedings of the Na onal Academy of Sciences (PNAS).
Coastal Carbon091102_irl.indd 30 06.11.2009 14:01:37

31
De ni on and global occurrence Kelp forests consist of conspicuous assemblages of large brown algae in the Order Laminariales. They largely occur in shallow sub dal (< 30 m) rocky habitats in most temperate and high la tude coastal areas of the world (Dayton 1985, Schiel and Foster 1986). Some species of kelp may occur at much greater depths (i.e., 60 - 200 m) in areas of high water clarity (Kain 1979), including tropical regions where they are known to form extensive deep-water forests (Graham et al.
Kelp Forests
Daniel C. ReedMarine Science Ins tute
University of CaliforniaSanta Barbara, CA 93106, USA
Mark A. BrzezinskiDepartment of Ecology, Evolu on, and Marine Biology, and Marine Science Ins tute
University of CaliforniaSanta Barbara, CA 93106, USA
Fast facts• Assemblages of large brown algae in the Order Laminariales.• Kelps dominate the autotrophic biomass and produc on of shallow rocky substrates in temperate and
arc c regions of the world but a complete survey of the world’s kelp forest has never been done.• Carbon cycling within kelp forests is characterized by rapid biomass turnover that can be as high as 10
mes per year. There are few data on the frac on of kelp carbon that is incorporated into long-term carbon reservoirs such as marine sediments.
• It is likely that carbon storage by kelp dominated ecosystems will mainly be a func on of the size of the standing biomass of kelp and associated understory algae. This means that the limit of carbon storage in these systems will be a direct func on of the amount and condi on of suitable habitat.
• The global kelp standing crop can be es mated to be from ~7.5 Tg C and (if modelled predic ons of distribu on are accurate) could be as much as 20 Tg C.
• Applying a conserva ve es mate for kelp forest net primary produc on of 1000 g C m-2 yr-1 to the area of shallow coastline with signi cant kelp yields a global kelp produc on of 15 Tg C yr-1. If deep tropical areas of poten al kelp are accounted for, then global kelp produc on approaches 39 Tg C yr-1.
• Land use prac ces that alter the amount and cons tuents of runo and the coastal discharge of municipal, agricultural and industrial wastes nega vely impact kelp forests by increasing turbidity, sedimenta on and nutrient loads. Human harvests of top predators such as lobster, sh, and sea o ers have been implicated as a cause of kelp forest degrada on world wide.
• To protect kelps, it is necessary to implement policies that restrict the chronic discharge of municipal and industrial waste waters into the nearshore, and land use prac ces that elevate the concentra ons of sediments, nutrients and pollutants in runo delivered to the ocean. Fishing damage is best managed by restric ng the harvest of kelp and associated biota, which can be done using tradi onal shery management prac ces in combina on with the establishment of marine protected areas.
2007a). While kelps are found worldwide, their present day distribu on suggests a Paci c origin, with all but one of the 27 genera occurring in the North Paci c, 19 of these exclusively (Estes and Steinberg 1988).
Kelps are taxonomically diverse and kelp species di er greatly in morphology. The giant kelps produce oa ng canopies that extend throughout the water column making them the largest algae in the world. Non- oa ng s pitate forms produce a subsurface canopy
Coastal Carbon091102_irl.indd 31 06.11.2009 14:01:40
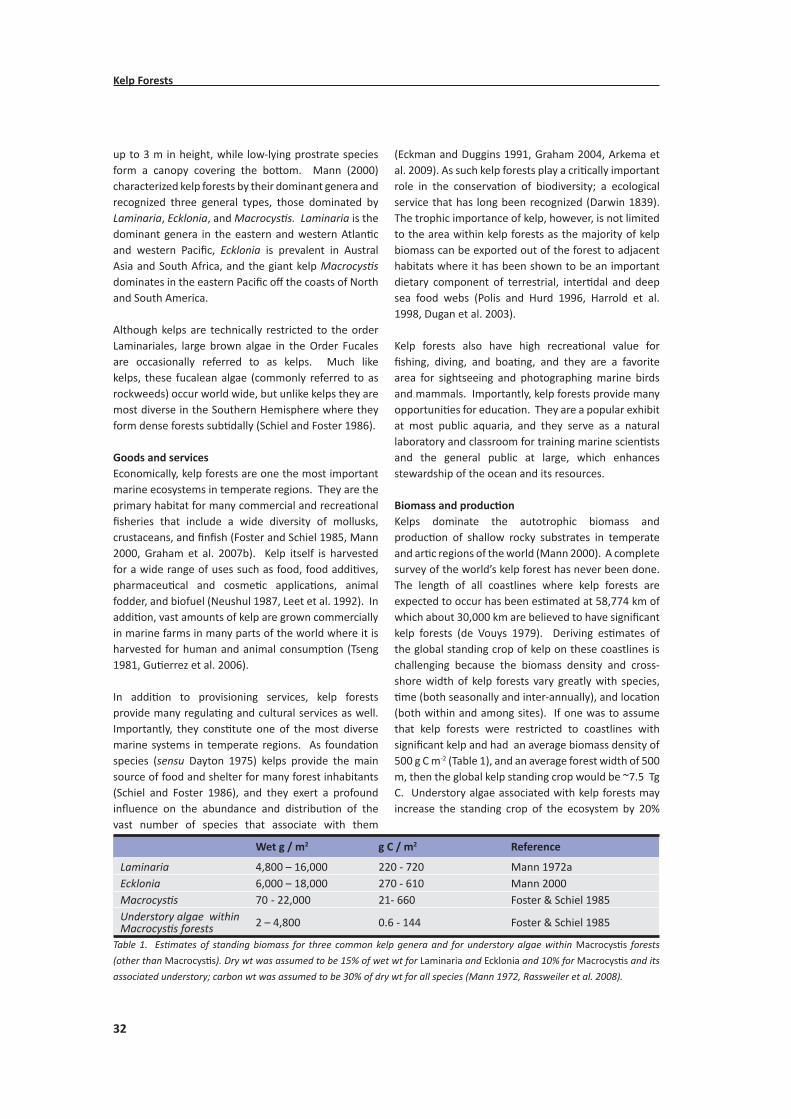
32
Kelp Forests
up to 3 m in height, while low-lying prostrate species form a canopy covering the bo om. Mann (2000) characterized kelp forests by their dominant genera and recognized three general types, those dominated by Laminaria, Ecklonia, and Macrocys s. Laminaria is the dominant genera in the eastern and western Atlan c and western Paci c, Ecklonia is prevalent in Austral Asia and South Africa, and the giant kelp Macrocys s dominates in the eastern Paci c o the coasts of North and South America.
Although kelps are technically restricted to the order Laminariales, large brown algae in the Order Fucales are occasionally referred to as kelps. Much like kelps, these fucalean algae (commonly referred to as rockweeds) occur world wide, but unlike kelps they are most diverse in the Southern Hemisphere where they form dense forests sub dally (Schiel and Foster 1986).
Goods and servicesEconomically, kelp forests are one the most important marine ecosystems in temperate regions. They are the primary habitat for many commercial and recrea onal sheries that include a wide diversity of mollusks,
crustaceans, and n sh (Foster and Schiel 1985, Mann 2000, Graham et al. 2007b). Kelp itself is harvested for a wide range of uses such as food, food addi ves, pharmaceu cal and cosme c applica ons, animal fodder, and biofuel (Neushul 1987, Leet et al. 1992). In addi on, vast amounts of kelp are grown commercially in marine farms in many parts of the world where it is harvested for human and animal consump on (Tseng 1981, Gu errez et al. 2006).
In addi on to provisioning services, kelp forests provide many regula ng and cultural services as well. Importantly, they cons tute one of the most diverse marine systems in temperate regions. As founda on species (sensu Dayton 1975) kelps provide the main source of food and shelter for many forest inhabitants (Schiel and Foster 1986), and they exert a profound in uence on the abundance and distribu on of the vast number of species that associate with them
(Eckman and Duggins 1991, Graham 2004, Arkema et al. 2009). As such kelp forests play a cri cally important role in the conserva on of biodiversity; a ecological service that has long been recognized (Darwin 1839). The trophic importance of kelp, however, is not limited to the area within kelp forests as the majority of kelp biomass can be exported out of the forest to adjacent habitats where it has been shown to be an important dietary component of terrestrial, inter dal and deep sea food webs (Polis and Hurd 1996, Harrold et al. 1998, Dugan et al. 2003).
Kelp forests also have high recrea onal value for shing, diving, and boa ng, and they are a favorite
area for sightseeing and photographing marine birds and mammals. Importantly, kelp forests provide many opportuni es for educa on. They are a popular exhibit at most public aquaria, and they serve as a natural laboratory and classroom for training marine scien sts and the general public at large, which enhances stewardship of the ocean and its resources.
Biomass and produc onKelps dominate the autotrophic biomass and produc on of shallow rocky substrates in temperate and ar c regions of the world (Mann 2000). A complete survey of the world’s kelp forest has never been done. The length of all coastlines where kelp forests are expected to occur has been es mated at 58,774 km of which about 30,000 km are believed to have signi cant kelp forests (de Vouys 1979). Deriving es mates of the global standing crop of kelp on these coastlines is challenging because the biomass density and cross-shore width of kelp forests vary greatly with species, me (both seasonally and inter-annually), and loca on
(both within and among sites). If one was to assume that kelp forests were restricted to coastlines with signi cant kelp and had an average biomass density of 500 g C m-2 (Table 1), and an average forest width of 500 m, then the global kelp standing crop would be ~7.5 Tg C. Understory algae associated with kelp forests may increase the standing crop of the ecosystem by 20%
Wet g / m2 g C / m2 Reference
Laminaria 4,800 – 16,000 220 - 720 Mann 1972aEcklonia 6,000 – 18,000 270 - 610 Mann 2000Macrocys s 70 - 22,000 21- 660 Foster & Schiel 1985Understory algae within Macrocys s forests 2 – 4,800 0.6 - 144 Foster & Schiel 1985
Table 1. Es mates of standing biomass for three common kelp genera and for understory algae within Macrocys s forests
(other than Macrocys s). Dry wt was assumed to be 15% of wet wt for Laminaria and Ecklonia and 10% for Macrocys s and its
associated understory; carbon wt was assumed to be 30% of dry wt for all species (Mann 1972, Rassweiler et al. 2008).
Coastal Carbon091102_irl.indd 32 06.11.2009 14:01:40

33
Kelp Forests
or more (Table 1). This es mate does not account for deep (30 m – 200 m) kelp in unexplored tropical waters, which Graham et al. (2007) es mated at > 23,500 km2 using an oceanographic-ecophysiological model that accurately iden ed known kelp popula ons. If their model predic ons are accurate, then the global standing crop of kelp could be as much as 20 Tg C.
Kelps are among the fastest growing autotrophs in the world with growth rates averaging up to 2 to 4% of the standing biomass per day (Wheeler and Druehl 1986; Reed et al. 2008). The high growth rate of kelps is principally responsible for the high rates of primary produc on recorded for kelp forests, which rank as one of the most produc ve ecosystems on earth (Table 2). The methods used to measure primary produc on in kelps have varied greatly among species and among studies of the same species, which have led to a wide range in es mates of net primary produc on (NPP) that are di cult to compare. Nonetheless, high rates of NPP have been measured for kelp forests regardless of the method used. This is despite the fact that signi cant produc on by kelp lost as dissolved exudates and produc on by autotrophs in the forest other than the dominant species of kelp were not accounted for in the vast majority of studies, even though both can be substan al (Mann 2000, Miller et al. 2009). Applying a conserva ve es mate for kelp forest NPP of 1000 g C m-2 yr-1 (Table 2) to the area of shallow coastline with signi cant kelp yields a global kelp produc on of 15 Tg C yr-1 (~ 30% less than that es mated by de Vouys 1979). If deep tropical areas of poten al kelp are accounted for, then global kelp produc on approaches 39 Tg C yr-1.
Carbon cycling and its importance as a carbon sinkOur knowledge of carbon cycling in kelp forests comes
almost exclusively from shallow temperate reefs. Much less is known about carbon cycling in deep tropical kelp forests due to their rela vely recent discovery (Graham et al. 2007a) and the di culty of conduc ng studies at greater depths. Current es mates of the biomass and produc vity of the deep tropical kelp forests are comparable to their shallow water counterparts. Un l we gain detailed knowledge of the distribu on, food web dynamics and produc vity of deep reefs global es mates of carbon cycling and storage in kelp forests will have high uncertainty. The more extensive knowledge of kelp forests on shallow reefs allows for a more complete analysis of carbon cycling and storage in those systems.
In contrast to terrestrial forests, a rela vely small amount of standing biomass contributes to the high rates of NPP by kelp forests in shallow water (Table 2). Thus carbon cycling within kelp forests is characterized by rapid biomass turnover that can be as high as 10 mes per year (Mann 1972b). Small amounts of li er
mass typically accumulate on the oor of kelp forests compared to terrestrial forests (Table 2) as most kelp detritus is either is quickly consumed, decomposed and recycled, or exported out of the system (Gerard 1976, Spalding et al. 2003).
Excessive grazing by sea urchins can denude en re kelp forests (reviewed in Harrold and Pearse 1987). However, in more persistent stands grazers typically consume only a small frac on of the kelp that is produced (Gerard 1976). Despite the seemingly low propor on of kelp consumed in ac vely growing kelp forests, food web analyses using stable isotopes show that kelp-derived carbon provides a signi cant source of nutri on to a wide diversity of kelp forest
Forest typeStanding crop(g C m-2)
NPP(g C m-2 yr-1)
Li er mass(dry kg m-2)
Reference
*Boreal forest 1000 400 4.0 Whi aker 1975*Temperate deciduous forest 1500 600 2.0 Whi aker 1975*Temperate evergreen forest 1,750 650 3.0 Whi aker 1975*Tropical seasonal forest 1,750 800 0.5 Whi aker 1975*Tropical rain forest 2,250 1100 0.2 Whi aker 1975Laminaria 220 - 720 1750 Mann 1972a, 1972bEcklonia 270-610 1100 - 1600 Mann 2000Macrocys s 120 - 273 670 - 1300 0.015 Gerard 1976
Wheeler & Druehl 1986Reed et al. 2008
Table 2. Comparison of standing crop, produc on and liter mass of terrestrial forests and three general types of kelp forests.
*(based on dry weight and the assump on that dry weight of forest trees is 50% carbon; Hamburg et al. 1997).
Coastal Carbon091102_irl.indd 33 06.11.2009 14:01:40

34
Kelp Forests
consumers (Dunton & Schell 1987, Duggins et al. 1989, Kaehler et al. 2000, Page et al. 2008). The trophic importance of kelp is not limited to the kelp forest as the majority of kelp carbon can be exported out of the system to adjacent habitats where it has been shown to contribute signi cantly to terrestrial, inter dal and deep sea food webs (Polis and Hurd 1996, Harrold et al. 1998, Dugan et al. 2003). Less obvious is the fate of kelp produc on that is excreted as dissolved organic ma er, which has been es mated to be on order of 30% to 40 % of NPP (Mann 2000). The high turnover of kelp biomass within kelp beds means that carbon storage in kelp dominated ecosystems will be mainly a func on of kelp standing crop and the e ciency with which detached par culate and dissolved kelp carbon is sequestered into long-term reservoirs. There are few data on the frac on of kelp carbon that is incorporated into long-term carbon reservoirs such as marine sediments, however decomposi on studies on beaches and in the ocean suggest that most of this material is rapidly consumed or decomposed (Dugan et al. 2003, Spalding et al. 2003). The amount of kelp incorporated into o shore sediments is unknown although the ux of kelp carbon to deep waters can be substan al (Harrold et al. 1998) Despite these uncertain es it is likely that carbon storage by kelp dominated ecosystems will mainly be a func on of the size of the standing biomass of kelp and associated understory algae. This means that the limit of carbon storage in these systems will be a direct func on of the amount and condi on of suitable habitat. Threats to the ecosystemKelp forests are poten ally at risk to a number of human ac vi es that occur in the nearshore coastal zone. Land use prac ces that alter the amount and cons tuents of runo and the coastal discharge of municipal, agricultural and industrial wastes are known to nega vely impact kelp forests by degrading the physical, chemical and biological environment in which they occur (North et. al. 1964, Meistrell and Montagne 1983, Ambrose et al. 1996, Airoldi & Beck 2007, Connell et al. 2009). The most severe e ects appear to result from increased turbidity and sedimenta on, which cause a reduc on in bo om irradiance and loss of suitable rocky substrata needed for kelp a achment (Foster and Schiel 1992). Elevated nutrients associated with agricultural runo and sewage may reduce the compe ve ability of kelp and lead to its demise in some areas (Gorman et al. 2009), but have posi ve e ects
on kelp recruitment and growth in other areas where oceanic condi ons are more oligotrophic (Tegner et al.1995). While kelps appear to be rela vely resistant to the direct e ects of oil pollu on (Foster 1971), many kelp forest consumers are not, and oil spills may have both posi ve or nega ve e ects on kelp depending on the consumers a ected and their posi on in the food web (North et al. 1964, Dean et al. 2000).
Perhaps the most publicized human impacts to kelp forests are those related to shing. Human harvests of top predators such as lobster, sh, and sea o ers have been implicated as the cause of kelp forest degrada on world wide (Jackson et al. 2001, Steneck et al. 2002). Detailed data documen ng the me course and extent of kelp forest loss, however, are lacking for most areas. While there is su cient evidence to implicate shing and hun ng as a cause for kelp forest decline, the magnitude and extent of degrada on caused by these ac vi es has been the subject of considerable debate (reviewed in Schiel and Foster 1992, Graham et al. 2007b). By nature, kelp forests are extremely dynamic systems that vary greatly in space and me in response to naturally occurring changes in oceanographic condi ons. Such dynamics, coupled with insu cient long-term data make it di cult to dis nguish the e ects of shing from natural occurring events in many areas.
Changes in global climate are also likely to impact kelp forests, but the nature of these changes are di cult to predict. Increases in sea surface temperatures will likely be accompanied by increased water column stra ca on resul ng in decreases in the supply of nutrients to reefs, which should have an adverse e ect on kelp growth. In contrast, to the extent that kelps are limited by the availability of carbon, predicted increases in the concentra on of atmospheric CO2 could have a posi ve e ect on kelp photosynthesis and growth. The increase in bicarbonate ion concentra on with enhanced CO2 dissolu on in seawater would bene t all kelp species. Kelp species that produce oa ng surface canopies may further bene t by
directly exploi ng increased atmospheric CO2 at the air-water interface. The accompanying consequences of ocean acidi ca on on kelp forests are more di cult to predict due to the limited informa on on the e ects of reduced pH on kelp physiology.
Climate driven changes in the frequency and intensity of storms are likely to have one of the largest impacts on the produc on and storage of kelp carbon as disturbance from waves is one of the main factors
Coastal Carbon091102_irl.indd 34 06.11.2009 14:01:40

35
Kelp Forests
a ec ng the standing crop of kelps (Dayton 1985, Schiel and Foster 1986). It has been suggested that the deep water forests in tropical regions may serve as a spa al refuge for kelp during extended periods of climate change (Santelices 2007). In any case, climate related changes will undoubtedly a ect the en re forest community of kelp, algal compe tors, invertebrate grazers, and vertebrate predators. The impacts of climate change on kelp will undoubtedly be in uenced by direct and indirect interac ons involving a suite of forest inhabitants.
ManagementThe most prudent approach to managing the world’s kelp forests is to avoid, prevent, or limit habitat degrada on and loss caused by humans. Kelp forests require good water quality and suitable hard substrate for a achment. Consequently, management prac ces aimed at protec on should focus on policies that preserve water quality and rocky habitats in areas where kelp forests are found. Chief among these should be policies that restrict the chronic discharge of municipal and industrial waste waters into the nearshore, and land use prac ces that elevate the concentra ons of sediments, nutrients and pollutants in runo delivered to the ocean. Degrada on of kelp forests caused by the direct and indirect e ects of shing are best managed by restric ng the harvest of kelp and associated biota, which can be done using tradi onal shery management prac ces in combina on with the
establishment of marine protected areas (Allison et al. 1991). One advantage that marine protected areas have over tradi onal shery management is that they are be er able to guard against the indirect e ects of shing as they protect the en re kelp forest ecosystem
rather than selected species.
The natural recovery of kelp o en ensues rapidly once human induced stressors have been removed and the nearshore environment has been returned to its natural state. Without nearby kelp popula ons, however, kelp recovery may be slow and highly variable, depending in part on dispersal to the area, the size of the habitat to be restored, and the presence and ac vity of kelp grazers. A empts to restore degraded kelp forests using a variety of techniques have been met with mixed success and the e ects of human interven on have o en been obscured by inadequate study designs and natural events (Schiel and Foster 1992).
The construc on of an ar cial reef has been used to mi gate for the loss of kelp forest habitat in the case
where the stressors causing degrada on (i.e., the cooling water e uent from a coastal power plant) were allowed to con nue (Reed et al. 2006). Ar cial reefs have also been used to transform so bo om habitats into hard bo om areas in e orts to expand kelp habitat beyond its natural occurrence (Turner et al. 1969, Lewis and McKee 1989, Terawaki et al. 2003). The depth, topography, and bo om coverage of an ar cial reef as well as its proximity to exis ng kelp forests are important in determining the ming and extent of coloniza on by kelp and its ability to persist (Reed et al. 2004, 2006). If designed properly, ar cial reefs could be used to expand kelp habitat and thereby increase the storage of kelp carbon. Although the technology for building ar cial reefs that support kelp is largely developed, the large-scale transforma on of so bo om habitats into hard bo om kelp forests is likely to be expensive and will involve trading resources associated with one habitat type for those associated with another. For these reasons, the pros and cons of using ar cial reefs for habitat transforma on should be carefully weighed and considered.
ReferencesAiroldi, L. and M. W. Beck. 2007. Loss, status and trends
for coastal marine habitats of Europe. Oceanogr. Mar. Biol. Ann. Rev. 45:345–405.
Allison, G. A., J. Lubchenco and M. H. Carr. 1998. Marine reserves are necessary but not su cient for marine conserva on. Ecological Applica ons 8: S79-S92.
Ambrose, R. F., R. J. Schmi ,and C. W. Osenberg1996. Predicted and observed environmental impcts: Can we foretell ecological change? Pages 345-369 In Schmi , R.J. and Osenberg, C. W., Detec ng ecological impacts: Concepts and applica ons in coastal habitats. Academic Press, San Diego.
Arkema, K. A. D. C. Reed, S. C. Schroeter. 2009. Giant kelp determines the structure and temporal variability of rocky reef communi es. Ecology in press.
Connell, S. D., B. D. Russell, D. J. Turner, S. A. Shepherd, T. Kildea, D. Miller, L. Airoldi, and A. Cheshire. Recovering a lost baseline: missing kelp forests from a metropolitan coast. Mar. Ecol. Prog. Ser. 360-63-72.
De Vouys, C. G. N. 1979. Primary produc on in aqua c environments. In Bolin, B., E. T. Degens, S. Kempe, and P. Ketner (editors). SCOPE 13: The global carbon cycle. Wiley. U.K. 491 pp.
Darwin, C. 1839. The Voyage of the Beagle, reprinted (1909) in Harvard Classics (Collier, New York), Vol 29.
Coastal Carbon091102_irl.indd 35 06.11.2009 14:01:40

36
Kelp Forests
Dayton, P. K. 1975. Experimental evalua on of ecological dominance in a rocky inter dal algal community. Ecological Monographs 45:137-159.
Dean, T. A., J. L. Bodkin, S. C. Jewe , D. H. Monson,, D. Jung. 2000. Changes in sea urchins and kelp following a reduc on in sea o er density as a result of the Exxon Valdez oil spill. Mar. Ecol. Prog. Ser. 199:281-291.
Dugan, J. E., D. M. Hubbard, M. D. McCrary and M. O. Pierson. 2003. The response of macrofauna communi es and shorebirds to macrophyte wrack subsidies on exposed sandy beaches of southern California. Est. Coast. Shelf Sci. 58s:25-40.
Duggins, D. O., C. A. Simenstad, and J. A. Estes. 1989. Magni ca on of secondary produc on by kelp detritus in coastal marine ecosystems. Science 245:170-173.
Dunton KH, Schell DM (1987) Dependence of consumers on macroalgal (Laminaria solidungula) carbon in an arc c kelp community: 13C evidence. Mar Biol 93:615-625
Eckman, J. E., and D. O. Duggins. 1991. Life and death beneath macrophyte canopies: e ects of understory kelps on growth rates and survival of marine, benthic suspension feeders. Oecologia 234:473-487.
Estes, J. A. and P. D. Steinberg. 1988. Preda on, herbivory, and kelp evolu on. Paleobiology 14:19-36.
Foster, M. S., M. Neushul, and R. Zinmark.1971. The Santa Barbara oil spill part 2: ini al e ects on inter dal and kelp bed organisms. Environ. Pollut. 2:115-134.
Foster, M. S. and D. R. Schiel 1985. The ecology of giant kelp forests in California: a community pro le. Biological Report 85(7.2). United States Fish and Wildlife Service, Slidell, LA.
Gerard, V.A. 1976. Some aspects of material dynamics and energy ow in a kelp forest in Monterey Bay, California. Disserta on, University of California Santa Cruz.
Gorman, D. B., D. Russell, and S. D. Connell. 2009. Land-to-sea connec vity: linking human-derived terrestrial subsidies to sub dal habitat change on open rocky coasts. Ecol App 19. 1114–1126.
Graham, M. H. J. A. Vasquez, A. H. Buschmann. 2007. Global ecology of the giant kelp Macrocys s from ecotypes to ecosystems. Oceanogr. Mar. Biol. Ann. Rev. 45:39-88.
Graham, M. H. 2004. E ects of local deforesta on on the diversity and structure of southern California giant kelp forest food webs. Ecosystems 7, 341–357.
Graham, M. H., Kinlan, B. P., Druehl, L. D., Garske, L. E., Banks, S. 2007a. Deep-water kelp refugia as poten al hotspots of tropical marine diversity and produc vity. Proc. Natl. Acad. Sci. 104: 16576-16580.
Graham , M. H., J. A. Vasquez, and A. H. Buschmann. 2007b. Global ecology of the giant kelp Macrocys s: from ecotypes to ecosystems. Oceanogr. Mar. Biol. Ann. Rev. 45:39-88.
Gu errez, A., Correa, T., Muñoz, V., San bañez, A., Marcos, R., Caceres, C. & Buschmann, A.H. 2006. Farming of the giant kelp Macrocys s pyrifera in southern Chile for development of novel food products. J. Appl. Phycol. 18: 259–267.
Hamburg, S. P., D. G. Zamolodchikov, G. N. Korovin, V. V. Nefedjev, A. I. Utkin, J. I. Gulbe, and T. A. Gulbe. 1997. Es ma ng the carbon content of Russian forests: Comparisons of phytomass/volume and allometric projec ons. Mi ga on and Adapta on Strategies for Global Change 2:247-265
Harrold, C., and Pearse, J.S. (1987). The ecological role of echinoderms in kelp forests. pp 137-233 In “Echinoderm studies” M. Jangoux and J. M. Lawrence (editors). V.2. A. A. Balkema, Brook eld.
Harrold, C, K. L. Light and S. Lisin. 1998. Organic enrichment of submarine-canyon and con nental-shelf benthic communi es by macroalgal dri imported from nearshore kelp forests. Limnol. Oceanogr. 43:669-678.
Jackson, J.B., Kirby, M.X., Berger, W.H., Bjorndal, K.A., Botsford, L.W., Bourque, B.J., Bradbury, R., Cooke, R., Erlandson, J., Estes, J.A., Hughes, T.P., Kidwell, S., Lange, C.B., Lenihan, H.S., Pandol , J.M., Peterson, C.H., Steneck, R.S., Tegner, M.J. & Warner, R. 2001. Historical over shing and the recent collapse of coastal ecosystems. Science 293: 629–638.
Kaehler S, Pakhomov EA, McQuaid CD (2000) Trophic structure of the marine food web at the Prince Edward Islands (Southern Ocean) determined by
13C and 15N analysis. Mar. Ecol. Prog. Ser. 208:13-20
Kain, J. M. A view of the genus Laminaria. 1979. Oceanogr. Mar. Biol. Ann. Rev. 17:101-161.
Leet, W. S., C. M. Dewees, C. W. Haugen. 1992. California’s living marine resources and their u liza on. California Sea Grant. Publica on UCSGEP-92-12. Davis.
Lewis, R. D. and K.K. McKee. 1989. A guide to the ar cial reefs of southern California. State of California Resources Agency, Department of Fish and Game. Sacramento.
Meistrell, J. C., and D. E. Montague. 1983. Waste
Coastal Carbon091102_irl.indd 36 06.11.2009 14:01:40

37
Kelp Forests
disposal in southern Califonia and its e ects on the rocky sub dal habitat. Pages 84-102. In Bascom, W. (editor). The e ects of easte disposal on kelp communites. South. Calif. Coastal Water Res. Proj. Long Beach.
Mann, K. H. 1972a. Ecological energe cs of the seaweed zone in a marine bay on the Atlan c coast of Canada: I. Zona on and biomass of seaweeds. Mar. Biol. 12:1-10.
Mann, K. H. 1972b. Ecological energe cs of the seaweed zone in a marine bay on the Atlan c coast of Canada: II. Produc vity of the seaweeds. Mar. Biol. 14:199-209.
Mann, K. H. 2000. Ecology of Coastal Waters. Blackwell, Maldin.
Miller, R. J., D. C. Reed, and M. A. Brzezinski. 2009. Community structure and produc vity of sub dal turf and foliose algal assemblages. Mar. Ecol. Prog. Series In press.
Neushul, P. 1987. Energy from marine biomass: The historical record. Pages 1-35 In Bird, K.T. and Benson, P. H. (editors). Seaweed cul va on for renewable resources. Elsevier Science Publishers B. V., Amsterdam.
North, W .J. , M. Neushul, K. A. Clendening. 1964. Successive biological changes observed in a marine cove exposed to a large spillage of mineral oil. Pages 335-354, In Proceedings of the symposium on pollu on of marine organisms. Prod. Petrol., Monaco.
Page, H. M., D. C. Reed, M. A. Brzezinski, J. Melack, J. E. Dugan. 2008. Assessing the importance of land and marine sources of organic ma er to kelp forest food webs. Mar. Ecol. Prog. Series 360:47-62.
Polis, G. A. and S. D. Hurd. 1996. Linking marine and terrestrial food webs: allochthonous input from the ocean supports high secondary produc vity on small islands and coastal land communi es. Am Nat. 147:396-423.
Rassweiler, A., K. K. Arkema, D. C. Reed, M. A. Brzezinski, and R. C. Zimmerman. 2008. Net primary produc on, growth and standing crop of Macrocys s pyrifera in southern California. Ecology 89:2068.
Reed, D.C., S.C. Schroeter, D. Huang. 2006. An experimental inves ga on of the use of ar cial reefs to mi gate the loss of giant kelp forest habitat. A case study of the San Onofre Nuclear Genera ng Sta on’s ar cial reef project. California Sea Grant College Program Publica on No. T-058. San Digeo. 143 pp.
Reed, D. C., A. Rassweiler, K. K. Arkema. 2008. Biomass
rather than growth determines net primary produc on by giant kelp. Ecology 89:2493-2505.
Santelices, B. 2007. The discovery of kelp forests in deep-water habitats of tropical regions. Proceedings of the Na onal Academy of Sciences 104: 19163-19164
Schiel D. R. and M. F. Foster. 1986. The structure of sub dal algal stands in temperate waters. Oceanogr. Mar. Biol. Ann. Rev. 24:265-307.
Schiel, D. R. and M. F. Foster. 1992. Restoring kelp forests. Pages 279-342 In Thayer, G. W. (ed). Restoring the na on’s marine environment. Maryland Sea Grant, College Park.
Spalding H, Foster M. S, Heine J. N. 2003. Composi on, distribu on, and abundance of deep water (>30 m) macroalgae in central California. J. Phycol. 39:273–84
Steneck, R. S., Graham, M. H., Bourque, B. J., Corbe , D., Erlandson, J. M., Estes, J. and Tegner, M. J. 2002. Kelp forest ecosystems: biodiversity, stability, resilience and future. Environmental Conserva on 29:436–459.
Tegner, M. J., P. K. Dayton, P. B. Edwards, K. L. Riser, D. B. Chadwick, T. A. Dean, and L. E. Deysher. 1995. E ects of a large sewage spill on a kelp forest community: catastrophe or disturbance? Mar. Environ. Res. 40, 181–224.
Terawaki, T. K., K. Yoshikawa, G. Yoshida, M. Uchimura, and K. Iseki. 2003. Ecology and restora on techniques for Sargassum beds in the Seto Inland Sea. Japan. Mar. Poll. Bull. 47:198-201.
Turner, C. H., E. E. Ebert, and R. R. Given. 1969. Man-made reef ecology. Fish Bulle n 146. State of California Resources Agency, Department of Fish and Game. Sacramento.
Tseng, C.K., 1981. Commercial cul va on of seaweed. In: Biology of seaweed (eds C.S. Lobban and M.J. Wynne). Pp. 687-725. Oxford, UK, Blackwell Scient. Publ., 508p.
Wheeler, W. N. and L. D. Druehl. 1986. Seasonal growth and produc vity of Macrocys s integrifolia in Bri sh Columbia, Canada. Mar. Biol. 90:181-186.
Whi aker, R. H. 1975. Communi es and ecosystems. 2nd edi on. Macmillan Publ. Co. Inc, New York. 385p
Coastal Carbon091102_irl.indd 37 06.11.2009 14:01:40

Global distribution of Coral Reefs
Coral Reefs
Coastal Carbon091102_irl.indd 38 06.11.2009 14:01:40

39
Smith and Ga uso show from ocean chemistry that coral reefs are not a sink for the greenhouse gas carbon dioxide. The point is we cannot count on reefs to clean the atmosphere of our carbon dioxide emissions. We have to act decisively and do it right now, before it is too late.» – Richard B. Aronson, Florida Ins tute of Technology and President of the Interna onal Society for Reef Studies.
Coral reefs support the highest marine biodiversity in the world, containing an es mated 25% of all marine species (Roberts, 2003). More than 500 million people worldwide depend on them for food, storm protec on, jobs, and recrea on. Unfortunately, many of the world’s coral reefs have been degraded, mainly due to human ac vi es. According to the Status of Coral Reefs of the World: 2008, we have lost 19% of the original area of coral reefs since 1950, 15% of coral reefs are in a cri cal state with loss possible within the next 10 to 20 years, and a further 20% are seriously threatened with loss predicted within 20 to 40 years.
Introduc onCoral reefs are highly visible, “charisma c,” and metabolically ac ve benthic ecosystems that contain the two primary carbon (C) reservoirs found in other marine ecosystems: organic ma er and calcium carbonate. They are recognized to be among the most rapid producers, per unit of area, of both organic carbon (the transforma on of inorganic carbon to organic
carbon by photosynthe c organisms is called “primary produc on”) and skeletal CaCO
3 (calcium carbonate – precipitated through the calci ca on process).
Aqueous inorganic carbon chemistry and calci ca onConsider that carbon dioxide (CO2) at a par al pressure (pCO2) in the atmosphere is in equilibrium with water (that is, pCO2(water) = pCO2(air) pCO2) ; the ra o of the molar concentra on of CO2 dissolved in the water, CO2(water), to pCO2 is given by the CO2 solubility (the Henry’s Law coe cient, K0). The CO2(water) reacts with water by hydra on, to form carbonic acid (H2CO3). That acid dissociates into bicarbonate (HCO3
-), carbonate (CO3
-2) anions.
CO2(water)÷ pCO2 = K0 (1)
The value of K0 is dependent upon salinity, temperature and hydrosta c pressure.
CO2(water) + H2O H2CO3 (2)
H2CO3 HCO3- + H+ (3)
HCO3- CO3
-2 + H+ (4)
CO2 par al pressure equilibra on between the water and overlying atmosphere is rela vely slow, while the hydra on and dissocia on steps are e ec vely
Coral Reefs
Stephen V. SmithCentro de Inves gación Cien ca y de Educación Superior de Ensenada
Departamento de GeologiaEnsenada, Baja California, Mexico
Tel. +52 646 175-0500 x 26340 [email protected]
Jean-Pierre Ga usoINSU-CNRS, Laboratoire d’Océanographie de Villefranche, B.P. 28,
06234 Villefranche-sur-mer Cedex, Franceand
UPMC University of Paris 06, Observatoire Océanologique de Villefranche, 06230 Villefranche-sur-mer, France
Coastal Carbon091102_irl.indd 39 06.11.2009 14:01:51

40
Coral Reefs
instantaneous. The distribu on of the various forms of dissolved inorganic carbon among H2CO3, HCO3
- and CO3
2- is dependent upon hydrogen ion ac vity (de ned by pH, -log[H+], as well as water composi on, temperature, and pressure). At the typical pH of surface seawater (~8.0 to 8.3) these three forms of dissolved inorganic carbon make up about 1% (H2CO3), 90% (HCO3
-), and 9% (CO32-) of the total DIC (Figure 1).
Primary produc on is the reac on by which organisms use solar energy to form organic carbon (chemically represented as CH2O) from CO2 plus H2O. Leaving out essen al nutrients, the chemical reac on describing conversion of CO2 to CH2O can be represented as follows:
CO2 + H2O CH2O + O2 (5)
Submerged aqua c organisms derive the CO2 used in primary produc on from the various forms of dissolved inorganic carbon. CO2 that is removed from the water is replaced from the atmosphere via equa on 1.
Respira on is the process by which organisms (both photosynthe c and non-photosynthe c) oxidize organic ma er and return organic carbon to dissolved inorganic carbon. Aerobic respira on (that is, respira on in the presence of O2) is of direct relevance and is represented by:
CH2O + O2 CO2 + H2O (6)
As dissolved inorganic carbon is taken up by primary produc on or released by respira on, equa ons 2-4 quickly par on dissolved inorganic carbon among the various ionic forms within the water, and equa on 1 slowly returns pCO2 to equilibrium between air and water.
Calci ca on is a somewhat more complicated process. A simpli ed version of the reac on is given by:
Ca2+ + HCO3- CaCO3 + H+ (7)
A complica on not represented by this equa on involves the pH shi that accompanies the consump on
Figure 1. Propor onal concentra ons of aqueous CO2 (H2CO3), HCO3-, and CO3
2- in seawater as a func on of pH. The ver cal
shaded area indicates the pH range of most tropical surface seawater, while the horizontal black arrow indicates the direc on
of pH shi in response to anthropogenic CO2 emissions and acidi ca on. With respect to anthropogenic e ects on , note the
propor onally large decrease in CO3-2, rela ve to HCO3
-, with falling pH in the range 8.3 to 8.0.
Coastal Carbon091102_irl.indd 40 06.11.2009 14:01:51
41
Coral Reefs
of CO32- (see equa ons 3, 4 and 7; also Figure 1). As
a result of this pH shi , equa on 7 is modi ed to the general form:
Ca2+ + 2HCO3- CaCO3 + CO2 + H2O (8)
So a curious characteris c of CaCO3 precipita on from water (whether by inorganic precipita on or calci ca on) is that the inorganic carbon used in the reac on is the HCO3
- in the water, not CO2 in the atmosphere. The calci ca on process thus actually releases CO2 from the water back to the atmosphere, rather than removing it from the atmosphere. It will be pointed out below that Eq. 8 does not quite explain the real world quan ta vely.
First we wish to point out the reason for the counter intui ve result represented by Eq. 8 (Ga uso et al., 1999a). The long-term (geological me scale; millions of years) CO2 cycle involves release of CO2 from the Earth interior into the atmosphere. This delivery is geochemically signi cant, but is a small frac on of the uxes among the Earth Surface System reservoirs. As
the volcanic CO2 emissions are introduced into the atmosphere, they induce weathering of volcanically derived silicate minerals also emana ng from the Earth interior. The igneous rocks are chemically unstable and react (by chemical weathering) with CO2 and water. Igneous rocks are diverse in chemical composi on; but to relate the carbonate and silicate cycles, we use CaSiO3 (wollastonite) as an example of reac ng silicate minerals:
CaSiO3 + 2CO2 + H2O Ca2+ + 2HCO3- + SiO2 (9)
This and similar reac ons account for both the DIC and the dissolved posi ve ions (ca ons) in seawater. The HCO3
- — rich water reacts with Ca2+ according to Eq. 8 to form CaCO3. So the summed e ect of Eqs. 9 and 8 is:
CaSiO3 + CO2 CaCO3 + SiO2 (10)
The chemically igneous silicate minerals are chemically unstable at Earth Surface temperature and pressure. These minerals react with CO2 in the presence of water to form the more stable sedimentary minerals CaCO3 and SiO2. The atmosphere is the source of CO2 that dissolves in the water during weathering. That dissolved CO2 hydrates and dissociates (primarily to HCO3
-, at oceanic pH: Figure 2) and is the source of the C that enters CaCO3; the process of forming that CaCO3 also delivers CO2 from the oceanic DIC back to the
atmosphere. The important points to this analysis, are (a) the demonstra on that CaCO3 precipita on taken alone (Eq. 8) is an atmospheric CO2 source, not a sink, and (b) the geochemical explana on for this result.
As was the case for primary produc on (Eq. 5) and respira on (Eq. 6), the back reac on of Eq. 8 occurs (CaCO3 dissolu on), is a sink for atmospheric CO2, and draws CO2 out of the atmosphere:
CaCO3 + CO2 + H2O Ca2+ + 2HCO3 (11)
However, equa on 8 does not quan ta vely describe what happens when CaCO3 is precipitated from seawater (Smith, 1985; Ware et al, 1991 and Frankignoulle et al, 1994). Consider seawater with pCO2 in equilibrium with the overlying atmosphere (equa on 1). Precipita ng CaCO3 quan ta vely according to equa on 8, that is, one mole of gaseous CO2 release for each mole of CaCO3 precipita on does not apply to seawater due to its bu ering e ect. Put simply, some of the CO2 generated by calci ca on is scavenged by the CO3
2- ions according to:
CO2 + CO32- + H2O -> 2HCO3
- (12)
Removing equimolar amounts of C as CO2 and CaCO3
from seawater open to the atmosphere would cause pCO2(water) to drop below pCO2(air). Yet the physical process that drives the CO2 gas out of seawater is the pCO2 di eren al between the water and air; gas moves from the higher-pressure to the lower-pressure reservoir, so gas evasion occurs only if there is a posi ve gradient from water to air. This constraint places an upper limit on the ra o of CO2 evasion as gas to C precipita on in CaCO3.
At an atmospheric pCO2 of about 350 ppmv, it was found that the molar ra o of CO2 evasion: CaCO3
precipita on was ~0.6, generally known as the “0.6 rule”. Frankignoulle et al. (1994) undertook a more detailed analysis and demonstrated that the ra o rises towards 1.0 in seawater as pCO2 rises.
The surface ocean pCO2 is not constant, largely because of the details of oceanic ver cal circula on; and coral reefs are found in waters of variable pCO2. The calcula on of reef performance is scaled to average condi ons, near equilibrium, between the air and gas phases while recognizing that details of local ux depend upon local water composi on.
Coastal Carbon091102_irl.indd 41 06.11.2009 14:01:53

42
Coral Reefs
Reef Area and Metabolism AreaWe use a nominal area of 600,000 km2, as being a round-number intermediate in es mates used for coral reef area studies (Smith, 1978; Kleypas, 1997; Spalding and Grenfell, 1997; Spalding et al., 2001) and recognize that inclusion of other shallow to intermediate depth tropical to high-la tude benthic communi es that show evidence of primary produc on and calci ca on might double this area, or more (e.g., Andersson et al., 2008).
Organic and inorganic metabolismA database compiled through 2004 is available for us to assess reef metabolism. Organic metabolism for individual sets of reef system measurements spans a range of ~0 to 3,000 mmol C m-2 d-1, for both Gross Primary Produc on (GPP) and Respira on (R) (Figure 2). When the two measurements are plo ed against one another, it can be seen that they are highly correlated with a P:R slope of about 1.04. In general, reefs appear marginally autotrophic.
There has been discussion of the likelihood of “modes” of typical reef performance. For example, Kinsey (1985) summarized various classes of data and found a range from whole systems and reef sediments near 300 mmol m-2 d-1 up to high-ac vity algal-dominated ats in excess of about 900 mmol m-2 d-1. It appears that reefs typically exhibit both GPP and R values near 450 mmol m-2 d-1, with NEP near (but probably slightly above) 0.Considering es mates of reef calci ca on, as derived from total alkalinity measurements (Figure 3), we see a range from slightly nega ve calci ca on es mates (represen ng CaCO3 dissolu on, largely in sediment-
dominated por ons of reefs) to values in excess of 300 mmol m-2 d-1. In comparison with the rela vely smooth change in organic metabolism, there are stronger sugges ons of “modes” of calci ca on, ~25, 100, and 250 mmol m-2 d-1 (Smith and Kinsey, 1976; Kinsey, 1985), generally represen ng largely sedimentary areas, ac ve reef ats and other shallow reef areas, and coral thickets, respec vely.
Smith (1983) argued that modes approxima ng the three seen in the Ga uso database cover 90-95%, 5-10%, and 1-2%, respec vely of reef area. If the propor onal areas of the modes are mul plied by the es mated modal calci ca on rates, they yield a mean reef ecosystem calci ca on rate of about 35 mmol m-2 d-1 (or about 1,200 g CaCO3 m
-2 yr-1).
Coral reefs as a carbon source or sinkThe metabolic data presented above indicate that the preponderance of reef carbon sequestra on is inorganic carbon. E ec vely, organic carbon produc on can be ignored. This is consistent with the observa on that the CaCO3 percentage in reef sediments is close to 100% (so inorganic carbon percentage is close to 12% by mass), while the organic carbon percentage is typically ~0.5%. These propor ons imply that inorganic carbon accounts for about 95% of carbon burial in reef sediments. If we take the reef area to be 0.6 x 10¹² m2 and the CaCO3 burial to be ~1,200 g m-2 yr-1, then the contemporary accumula on of CaCO3 in coral reefs is ~ 700 Tg yr-1. Based on mass contribu on of C to the molecular weight of CaCO3 (12/100), inorganic carbon burial is about 80 Tg yr-1. Recalling that CaCO3 precipita on causes gas evasion and applying the “0.6
Figure 2. Gross Primary Produc on (GPP) and Respira on (R) for coral reef systems. The histogram demonstrates the general
spread of data from individual studies, while the sca er diagram demonstrates the high correla on and near-unity regression
coe cient between GPP and R. The mean ± standard devia on (median) are as follows:
GPP = 580 ± 602 (471); R = 548 ± 524 (433); NEP = 41 ± 307 (2).
Coastal Carbon091102_irl.indd 42 06.11.2009 14:01:53
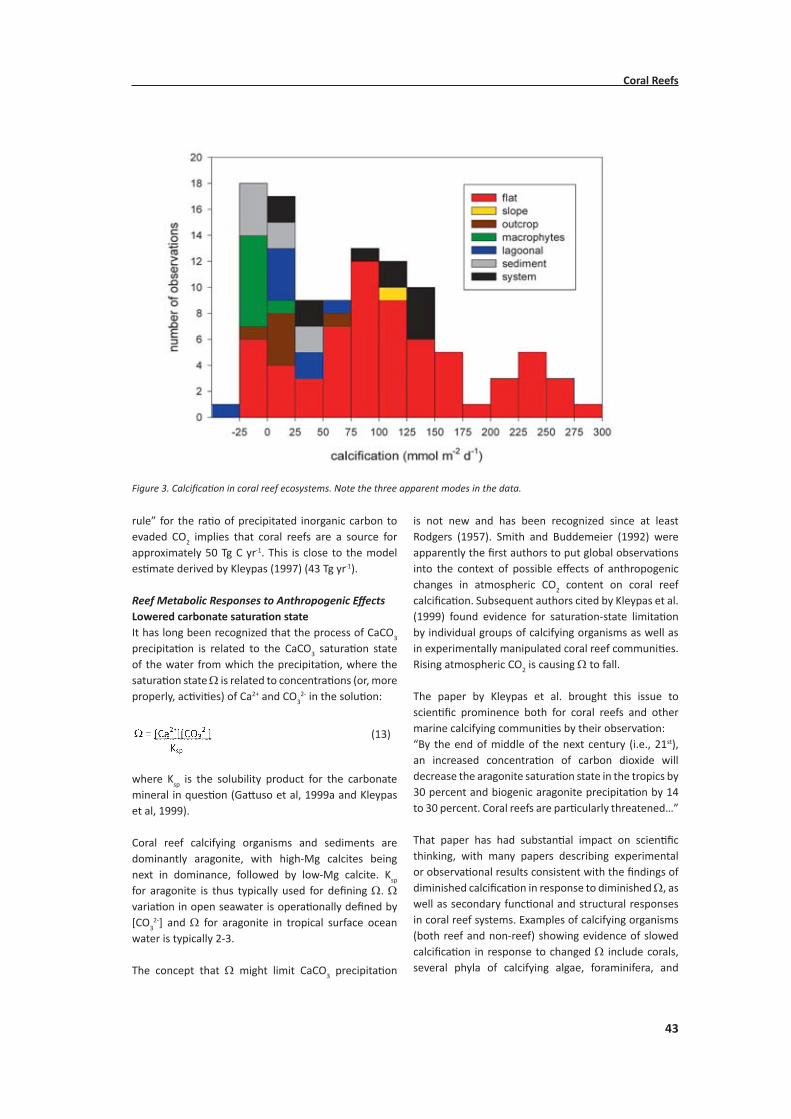
43
Coral Reefs
rule” for the ra o of precipitated inorganic carbon to evaded CO2 implies that coral reefs are a source for approximately 50 Tg C yr-1. This is close to the model es mate derived by Kleypas (1997) (43 Tg yr-1).
Reef Metabolic Responses to Anthropogenic E ectsLowered carbonate satura on stateIt has long been recognized that the process of CaCO3 precipita on is related to the CaCO3 satura on state of the water from which the precipita on, where the satura on state is related to concentra ons (or, more properly, ac vi es) of Ca2+ and CO3
2- in the solu on:
(13)
where Ksp is the solubility product for the carbonate mineral in ques on (Ga uso et al, 1999a and Kleypas et al, 1999).
Coral reef calcifying organisms and sediments are dominantly aragonite, with high-Mg calcites being next in dominance, followed by low-Mg calcite. Ksp for aragonite is thus typically used for de ning . varia on in open seawater is opera onally de ned by [CO3
2-] and for aragonite in tropical surface ocean water is typically 2-3.
The concept that might limit CaCO3 precipita on
is not new and has been recognized since at least Rodgers (1957). Smith and Buddemeier (1992) were apparently the rst authors to put global observa ons into the context of possible e ects of anthropogenic changes in atmospheric CO2 content on coral reef calci ca on. Subsequent authors cited by Kleypas et al. (1999) found evidence for satura on-state limita on by individual groups of calcifying organisms as well as in experimentally manipulated coral reef communi es. Rising atmospheric CO2 is causing to fall.
The paper by Kleypas et al. brought this issue to scien c prominence both for coral reefs and other marine calcifying communi es by their observa on:“By the end of middle of the next century (i.e., 21st), an increased concentra on of carbon dioxide will decrease the aragonite satura on state in the tropics by 30 percent and biogenic aragonite precipita on by 14 to 30 percent. Coral reefs are par cularly threatened…”
That paper has had substan al impact on scien c thinking, with many papers describing experimental or observa onal results consistent with the ndings of diminished calci ca on in response to diminished , as well as secondary func onal and structural responses in coral reef systems. Examples of calcifying organisms (both reef and non-reef) showing evidence of slowed calci ca on in response to changed include corals, several phyla of calcifying algae, foraminifera, and
Figure 3. Calci ca on in coral reef ecosystems. Note the three apparent modes in the data.
Coastal Carbon091102_irl.indd 43 06.11.2009 15:48:01

44
Coral Reefs
arthropods. A par cularly noteworthy paper by D’Eath et al. (2009) presents evidence that coral calci ca on on the Great Barrier Reef may have diminished by about 14% since 1990.
There are some studies that challenge this “simplis c” explana on (e.g., Atkinson et al. 1995; Atkinson and Cuet, 2008) of as the sole control on calci ca on, arguing that addi onal factors are likely to be signi cant as well. A paper by Iglesias-Rodriguez et al. (2008) argued that both calci ca on and primary produc on in a coccolithophorid species (non-reefal) actually increases with elevated pCO2 but this conclusion is hotly debated (Riebesell et al., 2008). Nevertheless, the preponderance of evidence seems to point towards a link between and calci ca on (Ilyina et al., 2009).
Moving beyond calci ca on itself, elevated CaCO3 dissolu on, including reef structures and sediments could be a widespread consequence of elevated atmospheric CO2 and diminished (Manzello et al., 2008). Any process which either lowers calci ca on rate or elevates dissolu on rate of calcareous sediments or limestone cons tutes a sink for anthropogenic CO2 in the atmosphere (equa on 9). The magnitude of this poten al sink is di cult to assess, but could be larger than diminished reef calci ca on.
Eutrophica onNutrient enrichment undoubtedly has a ected many reefs around the world (Szmant, 2002). An important predic on by Kleypas et al. (1999) is a shi of community structure towards more non-calcifying species (e.g., more eshy algae) in response to diminished and calci ca on. In itself, a shi in GPP should have li le impact of reefs (or the sites presently occupied by reefs as we know them) on the global carbon balance. Based on Figures 4 and 5, we assume that NEP would remain approximately constant. That is, any shi in GPP would be approximately balanced by a concomitant shi in R.
Management Implica onsUnmanaged reef metabolism is a CO2 source, because of the e ect of CaCO3 precipita on as discussed above. Organic metabolism appears not to be signi cant. The es mated source strength is presently ~60% of reef calci ca on. This is a rate of about 50 Tg C yr-
1, larger, if extended to include non-reef calcifying benthic ecosystems. There is some evidence that diminished calci ca on will reduce this source term for unmanaged reefs and perhaps reverse it if reefs and other calcareous materials move from a state of
net calci ca on to net dissolu on. The fact of reef calci ca on as a CO2 source is not really a ma er of informed debate, and arguments to the contrary re ect a misunderstanding of the underlying chemistry. Nor is the issue of dissolu on being a CO2 sink.
Intermediate between calci ca on at unchanging rates and dissolu on of calcareous materials as falls, there is legi mate scien c disagreement. The strong prevailing view is that reef calci ca on decreases as atmospheric CO2 rises. It seems likely that, whatever the resolu on of this discussion, reef communi es of the future will look di erent from present coral reefs. There is reason to think that calci ca on will not cease, but details of community structure seem likely to shi . So reef appearance will probably change from what we presently recognize as coral reefs.
These changes could lead to loss of storm protec on or loss of recrea onal value (the two major goods and services singled out for reefs by Costanza et al., 1997) or loss of sheries, these changes are deleterious.
It therefore seems obvious that the role of coral reefs in discussion of management of anthropogenic CO2 emissions is much more one of reefs being likely bene ciaries of CO2 management, rather than being a useful management op on in their own right.
Coastal Carbon091102_irl.indd 44 06.11.2009 14:01:56

45
Coral Reefs
References Andersson, A. J., F. T. Mackenzie, and N. R. Bates. 2008.
Life on the margin: implica ons of ocean acidi ca on on Mg-calcite, high la tude and cold-water marine calci ers. Marine Ecology Progress Series. 373: 265-273.
Atkinson, M. J., and P. Cuet. 2008. Possible e ects of ocean acidi ca on on coral reef biogeochemistry: topics for research. Marine Ecology Progress Series. 373: 249-256.
Atkinson, M. J., B. Carlson, and G. L. Crow. 1995. Coral growth in high-nutrient, low-pH seawater: a case study of corals cultured at the Waikiki Aquarium, Honolulu, Hawaii. Coral Reefs. 14: 215-223.
Costanza, R., et al. 1997. The value of the world’s ecosystem services and natural capital. Nature: 253-260.
D’Eath, G., J. M. Lough, and K. E. Fabricius. 2009. Declining coral calci ca on on the Great Barrier Reef. Science. 323: 116-119.
Frankignoulle , M., C. Canon, and J.-P. Ga uso. 1994. Marine calci ca on as a source of carbon dioxide: posi ve feedback of increasing atmospheric CO2. Limnology and Oceanography. 39: 458-462.
Ga uso, J-P., D. Allemand, and M. Frankignoulle. 1999a. Photosynthesis and calci ca on at cellular, organismal and community levels in coral reefs: a review on interac ons and controls by carbonate chemistry. American Zoologist. 39: 160-183.
Ga uso, J-P., M. Frankignoulle, and S. V. Smith. 1999b. Measurement of community metabolism and signi cance in the coral reef CO
2 source-sink debate. Proceedings of the Na onal Academy of Science. 96: 13017-13022.
Iglesias-Rodriguez, M. D., et al. 2008. Phytoplankton calci ca on in a high-CO2 world. Science. 320: 336-340.
Ilyina, T., R. E. Zeebe, E. Maier-Reimer, and C. Heinze. 2009. Early detec on of ocean acidi ca on e ects on marine calci ca on. Global Biogeochemical Cycles. 23: doi:10.1029/2008GB003278.
Kinsey, D. W. 1985. Metabolism, calci ca on and carbon produc on: system level studies. Proceedings of the 5th Interna onal Coral Reef Congress, Tahi . 4: 505-526.
Kleypas, J. A. 1997. Modeled es mates of global reef habitat and carbonate produc on since the last glacial maximum. Paleoceanography. 12: 533-545.
Kleypas, J. A., R. W. Buddemeier, D. Archer, J-P. Ga uso, C. Langdon, B. N. Opdyke. 1999. Geochemical consequences of increased atmospheric carbon dioxide on coral reefs. Science. 284: 118-120.
Manzello D. P., Kleypas J. A., Budd D. A., Eakin C. M., Glynn P. W. & Langdon C., 2008. Poorly cemented coral reefs of the eastern tropical Paci c: Possible insights into reef development in a high-CO2 world. Proceedings of the Na onal Academy of Science.
105:10450-10455.Marine Ecology Progress Series. 2008. E ects of ocean
acidi ca on on marine ecosystems. 273: 199-309.Riebesell U., Bellerby R. G. J., Engel A., Fabry V. J.,
Hutchins D. A., Reusch T. B. H., Schulz K. G. & Morel F. M. M., 2008. Comment on “Phytoplankton calci ca on in a high-CO2 world”. Science. 322:1466b-1466b.
Rodgers, J. 1957. The distribu on of marine carbonate sediments: a review. pp. 2-14 In R. L. LeBlanc and J. G. Breeding (eds.) Regional Aspects of Carbonate Deposi on: A Symposium. Society of Economic Paleontologists and Mineralogists Special Publica on 5, Tulsa Oklahoma, USA.
Royal Society. 2005. Ocean acidi ca on due to increasing atmospheric carbon dioxide. Clyvedon Press, Cardi , United Kingdom. 60 pp.
Smith, S. V., and D. W. Kinsey 1976. Calcium carbonate produc on, coral reef growth, and sea level change. Science. 194: 937-939.
Smith, S. V. 1978. Coral-reef area and the contribu ons of reefs to processes and resources of the world’s oceans. Nature. 273: 225-226.
Smith, S. V. 1983. Coral reef calci ca on. p. 240-247 In D. J. Barnes (ed.). Perspec ves on Coral Reefs. Australian Ins tute of Marine Science.
Smith, S. V. 1985. Physical, chemical and biological characteris cs of CO
2 gas ux across the air-water interface. Plant, Cell and Environment. 8: 387-398.
Smith, S. V., and F. Pesret. 1974. Processes of carbon dioxide ux in the Fanning Island lagoon. Paci c Science. 28: 225-245.
Smith, S. V., and R. W. Buddemeier. 1992. Global change and coral reef ecosystems. Annual Reviews of Ecology and Systema cs. 23: 89-118.
Spalding and Grenfell 1997. New es mates of global and regional coral reef areas. Coral Reefs. 16: 225-230.
Spalding, M. C. Ravilious, and E. P. Green. 2001. World Atlas of Coral Reefs. University of California Press. 424 pp.
Szmant, A. M. 2002. Nutrient enrichment on coral reefs: Is it a major cause of coral reef decline? Estuaries. 25: 743-766.
Ware, J. R., S. V. Smith, and M. L. Reaka-Kudla. 1992. Coral reefs: sources or sinks of atmospheric CO2? Coral Reefs. 11: 127-130.
Wilkinson, C (ed.) 2008. Status of coral reefs of the world: 2008. Global Coral Reefs Monitoring Network and Reef and Rainforest Research Centre, Townsville, Australia. 296 pp.
Coastal Carbon091102_irl.indd 45 06.11.2009 14:01:56

Coastal Carbon091102_irl.indd 46 06.11.2009 14:01:56
47
Over the last two hundred years, the concentra on of carbon dioxide (CO2) in the Earth’s atmosphere has increased by more than 30% (IPCC 2007). This increase has been driven by the combus on of fossil fuels, deforesta on, destruc on of other biological carbon reserves, cement produc on and other human sources of CO2. The current rate of CO2 increase in the atmosphere is at least an order of magnitude faster than has occurred for millions of years (Doney & Schimel 2007), and the current atmospheric CO2 concentra on is greater than the Earth has experienced in at least 800,000 years (Luthi et al. 2008). These changes have drama c and longterm consequences for the Earth’s climate – both atmospheric and oceanic – and for all life on Earth. Resul ng shi s in the distribu on and popula on of species and impacts on human communi es from the Equator to the poles have already being observed (Parmesan 2006).
The Oceans and CO2 Sequestra onNearly a third of the anthropogenic CO2 added to the atmosphere has been absorbed by the oceans (Sabine et al. 2004). Currently, the ocean and land absorb similar amounts of CO2 from the atmosphere (Bender et al. 2005). However, projec ons suggest that CO2
absorp on by land sinks may decrease during this century (Friedlingstein et al., 2006), while the oceanic absorp on of atmospheric CO2 will con nue to grow (Orr et al. 2001). The oceans are therefore cri cal as the ul mate sink for anthropogenic CO2.
The long term implica ons of climate change for both terrestrial and marine systems have lead to strong interna onal recogni on of the need to stabilize the concentra on of atmospheric CO2 and other greenhouse gases. To achieve this, both drama c decreases in the rate of greenhouse gas emissions
and increases in the sequestra on of atmospheric CO2 must be rapidly implemented. Ongoing development of ar cial and geo-engineering methods of carbon sequestra on include techniques for CO2 injec on into the deep ocean, geological strata, old coal mines and oil wells, and aquifers along with mineral carbona on of CO2. These techniques have poten al for sequestering vast quan es of CO2. However, these techniques are expensive, have leakage risks, signi cant poten al environmental risk and will likely not be available for rou ne use un l 2025 or beyond (Lal 2008). In contrast, preserva on and restora on of naturally occurring biological carbon reservoirs represent CO2 sequestra on op ons that are immediately applicable, cost-e ec ve, have numerous ancillary bene ts, and are publicly acceptable. Biological reservoirs of carbon are, however, nite in capacity, making it likely that a combina on of biological and ar cial mechanisms of carbon sequestra on will be required.
Currently approximately 8.5 x 10¹⁵ g C yr-1 is emi ed by fossil fuel combus on and 1.6 x 10¹⁵ g C yr-1 by changes in biological systems resul ng from the anthropogenic degrada on or destruc on of naturally occurring terrestrial biological carbon reservoirs. To date accoun ng for the CO2 emissions resul ng from land use, land use change and forestry has almost exclusively focused on degrada on of terrestrial carbon sinks par cularly forests, wetlands, and soils. However ocean habitats and especially coastal ocean habitats, have high densi es of sequestered carbon and so their loss can be a signi cant contributor to CO2 emissions.
Coastal Ocean Habitats and CarbonCoastal oceans receive large inputs of organic ma er and nutrients from land through riverine ows, sediment runo and from the ocean from upwelling and current
Carbon Sequestra on by Coastal Marine Habitats: Important Missing Sinks
Emily PidgeonConserva on Interna onal
2011 Crystal Dr, Suite 500Arlington VA 22202 USA
Tel +1 703 341 [email protected]
Coastal Carbon091102_irl.indd 47 06.11.2009 14:02:02

48
Important Missing Sinks
systems. These high levels of nutrient input make the coastal ocean one of the most biologically produc ve areas of the biosphere (Chen and Borges 2009). The high produc vity of the coastal ocean environment supports a diverse spectrum of ecosystems and, like terrestrial ecosystems, sequesters signi cant carbon stocks in plants, animals and in the sediment. Table 1 summarises the carbon sequestra on of key terrestrial and coastal marine ecosystems.
Coastal marine habitats such as mangroves, seagrass meadows, kelp forests and dal salt marshes each account for areas 1% or less of the dominant terrestrial habitats of forests, grasslands and deserts. The carbon stocks in these marine systems, however, is similar to that observed in many of these terrestrial systems. Mangroves are one of the most produc ve ecosystems globally; the standing stock of carbon in above ground mangrove biomass is es mated to be 7990 gC m-2. The belowground biomass of these trees has not been extensively surveyed but may store similar amounts of carbon (Cebrian 2002). The carbon stock in mangroves is therefore likely to be similar in magnitude to the highly produc ve terrestrial forest habitats: Tropical forests 12045 gC m-2; Temperate forests 5673 gC m-2; and Boreal forests 6423 gC m-2. Similarly, the carbon contained in seagrasses and kelp forests (184 gC
m-2and 120-720 gC m-2 respec vely) is similar to many terrestrial ecosystems, including croplands. Degrading or removing these coastal habitats therefore has comparable immediate carbon emissions as degrading or removing similar sized areas of terrestrial habitat.
The drama c di erence between the coastal marine and terrestrial habitats is the capacity of marine habitats for longterm carbon sequestra on in sediments. Carbon burial in coastal ocean sediments by mangroves, seagrasses and other vegeta on has been largely ignored in most accounts of the global carbon cycle – likely a result of the small areal extent of these habitats and a re ec on of the fact that only human-induced sequestra on (ie a oresta on and reforesta on) is accounted for in na onal greenhouse gas inventories. However, vegetated coastal habitats transfer large amounts of carbon to the sediments, contribu ng about half of the total carbon sequestra on in ocean sediments even though they account for less than 2% of the ocean surface. Moreover, these high burial rates can be sustained over millennia (Duarte et al. 2005).
The large carbon sequestra on capacity of coastal habitats arises in part from the extensive belowground biomass of the dominant vegeta on. For instance, the ra o of root to shoot biomass in salt marsh plants
Ecosystem type Standing carbon stock (gC m-2)
Total global area
(*1012 m2)
Global carbon stocks (*1015 gC)
Longterm rate of carbon
accumula on in sediment (gC m-2 y-1)
Plants Soil Plants Soil
Tropical forests 12045 12273 17.6 212 216 2.3-2.5Temperate forests 5673 9615 10.4 59 100 1.4 – 12.0Boreal forests 6423 34380 13.7 88 471 0.8 – 2.2Tropical savannas and grasslands 2933 11733 22.5 66 264
Temperate grasslands and shrublands
720 23600 12.5 9 295 2.2
Deserts and semi-deserts 176 4198 45.5 8 191 0.8
Tundra 632 12737 9.5 6 121 0.2 – 5.7Croplands 188 8000 16 3 128Wetlands 4286 72857 3.5 15 225 20
Tidal Salt Marshes Unknown (0.22 reported) 210
Mangroves 7990 0.152 1.2 139Seagrass meadows 184 7000 0.3 0.06 2.1 83Kelp Forests 120-720 na 0.02- 0.4 0.009-0.02 na na
Table 1 Comparison of carbon stocks and longterm accumula on of carbon in soils in key terrestrial and coastal marine
ecosystems. (Terrestrial ecosystems (Kennedy & Bjork 2009), seagrass meadows (Duarte & Cebrian 1996, Duarte & Chiscano
1999, Duarte et al. 2005, Kennedy & Bjork 2009), Tidal Salt marshes (Chmura et al. 2003), Mangroves (Alongi 2002, Cebrian
2002, Duarte et al. 2005, FAO 2007), Kelp (Reed & Brzezinski 2009))
Coastal Carbon091102_irl.indd 48 06.11.2009 14:02:02

49
Important Missing Sinks
ranges from 1.4 to 50. Thus, much of the primary produc on is belowground, genera ng extensive carbon deposits in the sediment that can be as deep as 8 m deep (Chmura et al. 2003). Similarly, the biomass of living mangrove roots in the sediments can equal that above (Di mar & Lara 2001). However, in all these habitats the percentage of buried carbon strongly depends on environmental condi ons.
The high rate of carbon transfer to sediments by mangroves occurs over the global area covered by mangrove forests. Mangroves therefore generate approximately 15% of the total carbon accumula on in ocean sediments (Jennerjahn & I ekkot 2002). The e ciency of this carbon sequestra on in sediments by mangroves increases with the age of the mangrove forest, from 16% for a 5-year-old forest to 27% for an 85-year-old forest. Further, carbon sequestra on by mangroves is longterm: organic carbon in the upper 1.5 m of the sediment of Brazil’s Furo do Meio mangrove forest has been dated to be between 400 and 770 years old (Di mar & Lara 2001).
The importance of seagrass meadows, mangrove forests and salt marshes for longterm carbon sequestra on through burial in the sediment is par cularly apparent when compared to terrestrial burial rates (Table 1). The rate of carbon storage in the sediment by salt marshes, mangroves and seagrasses is approximately 10 mes the rate observed in temperate forests and 50 mes the rate observed in tropical forests. (For instance, 139 gC m-2 y-1 mangroves compared to 2.5 gC m-2 y-1 for tropical forests.) The simple implica on of this is that the longterm sequestra on of carbon by 1 km2 of mangrove area is equivalent to that occurring in 50km2 of tropical forest. Hence, while rela vely small in area, coastal habitats are extremely valuable for their longterm carbon sequestra on capacity.
These es mates of longterm carbon sequestra on by coastal vegetated habitats are likely underes mates. In some cases, important organic carbon sources such as detritus from the marine plants and terrestrial material are not considered in the calcula on of the accumula on rates. The accumula on rates also do not account for the dal pumping of CO2 from these habitats onto the outershelf and into the open ocean. Coastal marine plants such as mangroves and salt marsh vegeta on absorb CO2 directly from the atmosphere and then release carbon into the coastal waters through losses from roots and the degrada on of leaf li er and other plant debris. Tides then transport this
carbon away from the coast. Accurate global es mates of the dal carbon pump in coastal habitats are not yet achievable, but several studies suggest that this is a signi cant mechanism for removing CO2 from the atmosphere (Jahnke 2008).
Note that other coastal marine habitats such kelp forests and coral reefs have compara vely negligible carbon sediment burial rates. As noted above, however, kelp plants contain carbon stocks comparable with terrestrial habitats and debris from all coastal ecosystems is taken up by the dal pump for long term sequestra on.
Greenhouse Gas Impact of Coastal Habitat Loss The capacity of marine habitats as carbon reservoirs and in the longterm sequestra on of carbon in sediments has been drama cally eroded by the extensive areal losses of these systems. Almost 20% or 36,000 km2 of mangroves have been lost since 1980. From 2000-2005 mangroves were lost at approximately 118 km2 per year (FAO 2007). Seagrasses have been disappearing at a rate of 110 km2 per year since 1980 and this rate is accelera ng. In total, 29% (51,000 km2) of the total known areal extent of seagrasses have disappeared (Wayco et al. 2009). Similar rates of salt marsh loss have been es mated. The most signi cant causes of these coastal habitat losses are conversion of coastal and nearshore areas for aquaculture, agriculture, infrastructure and tourism. The extent of coastal marine habitat loss is a large frac on of the global total areas of these systems. The poten al loss of these carbon reservoirs should be accounted for by coastal protec on and management.
The size of coastal marine habitats, however, are small when compared to terrestrial deforesta on and so the associated global loss of carbon reservoirs is similarly rela vely modest. For instance, the annual deforesta on of the tropical Amazon forest (total area 600,000km2) is es mated to have been 13,000 km2 in 2006. The carbon reservoirs lost through tropical or temperate deforesta on are therefore very signi cantly greater than in coastal marine areas (approximately 150 x 1012 gC for the Amazon annual deforesta on rate, compared to 0.9 x 10¹² gC and 0.02 x 10¹² gC for the global annual loss of mangroves and seagrasses respec vely).
However, despite the rela vely small areas, the capacity of coastal vegetated habitats for longterm carbon sequestra on is comparable to terrestrial forests. This
Coastal Carbon091102_irl.indd 49 06.11.2009 14:02:02

50
Important Missing Sinks
has not been accounted for in assessments of the cost of degrada on and loss of coastal marine habitats. This very signi cant global impact of the coastal habitat loss is demonstrated by calcula ng the areas of terrestrial forest with equivalent sediment carbon sequestra on capacity (see Table 2). For example, the total annual loss of mangroves and seagrasses has the longterm carbon sequestra on capacity of a tropical forest area similar to the annual deforesta on rate in the Amazon. The total carbon sequestra on capacity lost through mangrove and seagrass clearing is equivalent to the sediment sequestra on capacity of a tropical forest area greater than the Amazon forest. Since reducing carbon emissions will be a global concern for centuries, longterm carbon sequestra on capacity must now also be accounted for in the bene ts associated with coastal marine habitat restora on and protec on.
Mul ple Bene ts of Coastal Habitat Protec on and Restora onIn addi on to providing extensive longterm carbon sequestra on bene ts, coastal habitats are the source of numerous valuable ecosystem services. Mangroves are extensively used tradi onally and commercially worldwide, par cularly in developing countries, and have been valued at 200,000-900,000 USD ha-1 (UNEP-WCMC, 2006). Seagrasses provide important ecosystem services including nutrient cycling, enhancement of coral reef sh produc vity, and habitat for sh, mammal, bird and invertebrate species. In addi on, seagrasses support subsistence and commercial sheries worth as much as $3500 ha-1 yr-1 (Wayco
et al. 2009). Tidal salt marshes are important for their nutrient cycling and sediment stabiliza on of near coastal areas.
Corals and kelp habitats are essen al components of the coastal environment, providing their own extensive range of ecosystem services (Moberg & Folke 1999, Steneck et al. 2002). These habitats are also cri cal to the longterm survival of mangroves and seagrasses by
providing habitat and food sources for species common to numerous coastal ecosystems. All coastal habitats are therefore cri cal either directly or indirectly for the high rates of carbon sequestra on in coastal areas.
Increasing emphasis is now also being placed on the role of coastal habitats in climate change adapta on, both for human communi es and marine species. Increased coastal protec on and stability will be needed in response to sea level rise and the changing storm condi ons expected as a result of climate change. Under appropriate condi ons, dal salt marshes, mangroves and coral reefs provide protec on from waves, storm events, can reduce shoreline erosion and provide sediment stabiliza on along many coasts. The food resources provided by coastal marine ecosystems will essen al to maintaining human adap ve capacity to changing resource availability.
Protec ng and restoring coastal marine ecosystems therefore has signi cant mul ple bene ts that are global (longterm carbon sequestra on) to local (community sheries) in scale. Coastal protec on, management and development decisions therefore should account for all of these services provided by coastal habitats speci cally including the longterm carbon sequestra on.
Mangroves Seagrasses
Annual average global loss (km2/year) 118 110Equivalent tropical forest loss (km2/year) 6600 3600Equivalent temperate forest loss (km2/year) 1400 770Total es mated global loss (km2) 36,000 51,000Equivalent tropical forest loss (km2) 2,000,000 1,700,000Equivalent temperate forest loss (km2) 430,000 350,000
Table 2: Annual and total loss of mangrove and Seagrass habitat (FAO 2007, Wayco et al. 2009) and the equivalent areas of
tropical and temperate terrestrial forest needed for longterm carbon sequestra on in sediments (calculated from longterm rate
of carbon accumula on in soils in Table 1).
Coastal Carbon091102_irl.indd 50 06.11.2009 14:02:02
51
Important Missing Sinks
ReferencesAlongi, D.M. (2002) Present state and future of
the world’s mangrove forests, Environmental Conserva on, 29.
Bender, M., D. T. Ho, M. B. Hendricks, R. Mika, M. O. Ba le, P. P. Tans, T. J. Conway, B. Sturtevant, and N. Cassar (2005), Atmospheric O2/N2 changes, 1993–2002: Implica ons for the par oning of fossil fuel CO2 sequestra on, Global Biogeochem. Cycles, 19.
Cebrian, J. (2002) Variability and control of carbon consump on, export, and accumula on in marine communi es, Limnology and Oceanography , 47, 11–22.
Chen, C. T. A., and A. V. Borges (2009) Reconciling opposing views on carbon cycling in the coastal ocean: Con nental shelves as sinks and near-shore ecosystems as sources of atmospheric CO2, Deep Sea Res., Part II, 56, 578–590.
Chmura, G. L., Anisfeld, S. C., Cahoon, D. R., and J. C. Lynch (2003) Global carbon sequestra on in dal, saline wetland soils, Global Biogeochem. Cycles, 17.
Di mar, T., and R.J. Lara (2001) Molecular evidence for lignin degrada on in sulfate reducing mangrove sediments (Amazoˆnia, Brazil), Geochim. Cosmochim. Acta 65, 1403–1414.
Doney S. C. and D. S. Schimel (2007) Carbon and climate system coupling on mescales from the Precambrian to the Anthropocene, Annu. Rev. Environ. Res., 32, 31–66.
Duarte, C.M. and J. Cebrian (1996) The fate of marine autotrophic produc on, Limnology and Oceanography, 41, 1758–1766.
Duarte, C.M. & C.L. Chiscano (1999) Seagrass biomass and produc on: a reassessment, Aqua c Botany, 65(1-4), 159-174.
Duarte, C.M., Middelburg J., and N. Caraco (2005) Major role of marine vegeta on on the oceanic carbon cycle, Biogeosciences, 2, 1– 8.
FAO (Food and Agriculture Organiza on of the United Na ons) (2007) The World’s Mangroves 1980-2005, FAO Forestry Paper 153.
Friedlingstein, P., P. Cox, R. Be s, L. Bopp, W. von Bloh, V. Brovkin, P. Cadule, S. Doney, M. Eby, I. Fung, G. Bala, J. John, C. Jones, F. Joos, T. Kato, M. Kawamiya, W. Knorr, K. Lindsay, H.D. Ma hews, T. Raddatz, P. Rayner, C. Reick, E. Roeckner, K.-G. Schnitzler, R. Schnur, K. Strassmann, A.J. Weaver, C. Yoshikawa, and N. Zeng (2006) Climate–carbon cycle feedback analysis: Results from the C4MIP model intercomparison, J. Climate, 19(14), 3337-3353.
IPPC (Intergovernmental Panel on Climate Change) (2007) Climate Change 2007: The Physical Science Basis, Cambridge University Press, Cambridge, U. K.
Jahnke, R.A. (2008) Maybe it’s not just about air-water gas exchange, Oceanography, 21(4), 42-43.
Jennerjahn, T. C. and V. I ekkot (2002) Relevance of mangroves for the produc on and deposi on of
organic ma er along tropical con nental margins, Naturwissenscha en, 89, 23–30.
Kennedy, H. & M. Bjork (2009) Seagrass Meadows, The management of natural coastal carbon sinks, IUCN.
Kristensen, E., S. Bouillon, T. Di mar, and C. Marchand (2008) Organic carbon dynamics in mangrove ecosystems: A review, Aquat. Bot., 89(2), 201-219.
Lal, R. (2008) Carbon sequestra on, Phil Trans. Roy. Soc. B, 363, 815-830.
Luthi, D., M. Le Floch, B. Bereiter, T. Blunier, J.M. Barnola JM, U. Siegenthaler, D. Raynaud, J. Jouzel, H. Fischer, K. Kawamura, and T.F. Stocker (2008) High-resolu on carbon dioxide concentra on record 650,000-800,000 years before present, Nature, 453(7193), 379-382.
Moberg, F. and C. Folke (1999) Ecological goods and services of coral reef ecosystems, Ecological Economics, 29(2), 215-233.
Orr, J.C., P. Monfray, O. Aumont, A. Yool, I. To erdell, K. Pla ner, F. Joos, E. Maier-Reimer, M.-F. Weirig, R. Schlitzer, K. Caldeira, M. Wicke , R. Matear, M. Follows, Y. Gao, H. Drange, A. Ishida, Y. Yamanaka, S. Doney, K. Lindsay, J.L. Sarmiento, R.D. Slater, R.M. Key, N. Gruber, C. Sabine, and R. Najjar (2001) Simula ons of historical and future anthropogenic CO
2 uptake from 12 global ocean models. In Sixth Interna onal Carbon Dioxide Conference, Sendai, Japan, 1–5 October 2001, 151–1054.
Parmesan, C. (2006) Ecological and evolu onary responses to recent climate change, Annual. Rev, of Ecol., Evolu on, and Systema cs, 37, 637-669.
Reed D.C. and M.A. Brzezinski (2009) Kelp Forests, The management of natural coastal carbon sinks, IUCN.
Sabine, C.L., R.A. Feely, N. Gruber, R.M. Key, K. Lee, J.L. Bullister, R. Wanninkhof, C.S Wong, D.W.R. Wallace, B. Tilbrook, F.J. Millero, T.-H. Peng, A. Kozyr, T. Ono, and A.F. Rios (2004) The oceanic sink for anthropogenic CO2, Science, 305(5682), 367–371.
Steneck, R.S., M.H. Graham, B.J. Bourque, D. Corbe , J.M. Erlandson, J.A. Estes, and M.J. Tegner (2002) Kelp forest ecosystems: biodiversity, stability, resilience and future, Environmental Conserva on, 29, 436-459.
UNEP-WCMC (2006) Global distribu on of mangroves. Wayco , M., C.M. Duarte, T. J. B. Carruthers, R. J.
Orth, W. C. Dennison, S. Olyarnik, A. Calladine, J.W. Fourqurean, K.L. Heck, Jr., A. R.Hughes, G.A. Kendrick, W. J. Kenworthy, F. T. Short, and S. L. Williams (2009) Accelera ng loss of seagrasses across the globe threatens coastal ecosystems. Proceedings of the Na onal Academy of Sciences of the United States of America, 106(30), 12377-12381.
Coastal Carbon091102_irl.indd 51 06.11.2009 14:02:02

52
This report provides a strong new evidence base on the role of selected coastal marine habitats as carbon sinks. There is now an urgent need to take the next step - to turn such knowledge into ac on – by ensuring that such coastal marine sinks are included in Na onal Inventory Submissions.
Those countries who have signed the United Na ons Framework Conven on on Climate Change (UNFCCC) have to make annual Na onal Inventory Submissions (NIS) which records their Green House Gas (GHG) emissions from energy use, industrial processes, agriculture, land use and waste as well as any sequestra on from land use and forestry. These na onal inventories have to be submi ed annually to the UNFCCC and be based on guidance from the Intergovernmental Panel on Climate Change (IPCC). They are used to assess compliance with interna onal trea es to reduce emissions (ie Kyoto, EU) and for any na onal commitments (ie Climate Change Act for UK). Land Use, Land Use Change & Forestry (LULUCF) is the sec on in the na onal inventories that accounts for emissions and sequestra on from the management of terrestrial carbon sinks. The types of ac vi es covered by LULUCF include a oresta on, reforesta on & deforesta on, changes to soil carbon stocks from land use and land use change, peatland extrac on and drainage, liming of soils, etc.
For the LULUCF sec on of NIS, only GHG emissions and sequestra on that occur as a direct result of human ac vity can be counted. Any natural sequestra on (or emissions) from unmanaged/pris ne habitats cannot count towards a countries’ GHG commitments. Carbon credits cannot be earned for sequestra on from
unmanaged habitats. GHG emissions and sequestra on that occur as a result of the management of coastal and marine habitats are currently not accounted for by LULUCF and for that reason are not included in interna onal climate change mechanisms (ie UNFCCC, Kyoto, CDM, etc) and are not included, for example, in the UK’s carbon budgets.
To get coastal/marine habitats included in LULUCF would require the IPCC to update their guidance and possibly even need the agreement of the UNFCCC. The IPCC would need to be convinced that there is enough of a robust evidence base to demonstrate that the degrada on of coastal and marine habitats due to direct human ac vity results in GHG emissions. They would also need to be con dent that restora on (or crea on) of coastal habitats will reduce those emissions and deliver sequestra on.
An essen al step to including coastal marine sinks in NISs will be to build on the evidence base provided in this report. In par cular we need to know that coastal marine habitats are not just important as global carbon sinks but what happens (from a GHG perspec ve) when any of these habitats are damaged, developed or lost? The logical conclusion is that anthropogenic ac vi es cause the carbon to be lost back to the atmosphere, but do they lose their stored carbon and if so where to? Does it result in other GHG emissions and if so what type and on what scale?
Processes are slightly ahead when considering some of the terrestrial sinks. For example, with peatlands it is known that they are an important carbon store and that they sequester carbon when in a pris ne state. There
Next steps for the Management of Coastal Carbon Sinks
David ThompsonSenior Specialist, Climate Change,
Natural EnglandNorthminster House
PeterboroughPE1 1UA
Coastal Carbon091102_irl.indd 52 06.11.2009 14:02:02

53
is fairly good evidence that drainage, cul va on and over-grazing/burning results in carbon losses and that restora on stops those losses (although may increase methane) and, possibly, re-starts sequestra on. Unfortunately the UK LULUCF inventory does not fully record these carbon losses and so does not recognise the carbon savings delivered by restora on. There is therefore now common cause across exis ng terrestrial carbon sinks and coastal marine carbon sinks to both improve the accuracy of the inventory process, so that the full carbon emissions from degraded habitats are recorded in countries’ NISs, and to improve the evidence base to quan fy the carbon savings from restora on.
This report already enables us to be er recognise and acknowledge the role of coastal marine carbon sinks as a cri cal missing part of climate change mi ga on ac vi es. If an ul mate aim, however, is to explore the scope for engaging with the carbon market, then interna onal ac ons to include such habitats in na onal inventories, improving their protec on and management, and improving the evidence base on quan fying the savings from restora on is where e orts should now be focussed.
Coastal Carbon091102_irl.indd 53 06.11.2009 14:02:12

INTERNATIONAL UNION FOR CONSERVATION OF NATURE
WORLD HEADQUARTERSRue Mauverney 28 1196 Gland, Switzerland [email protected] Tel +41 22 999 0217Fax +41 22 999 0025www.iucn.org/marine
Coastal Carbon091102_irl.indd 54 06.11.2009 14:02:19