THE CONCEPT AND THE SPACE DESIGN OF BAJAU LAUT TRADITIONAL ...
The Malaysian Economy in Figures 2016
Economic Planning Unit, Prime Minister's Department

The Malaysian Economy in Figures 2016
Prepared by Economic Planning Unit, Prime Minister's Department
Phone : 03-8000 8000 Fax : 03-8888 3798 www.epu.gov.my
• Malaysia covers an area of 330,323 square kilometers and lies entirely in the equatorial zone, with the average daily temperature throughout Malaysia varies between 21C to 32C. It is made of 13 states in Peninsular Malaysia (Johor, Kedah, Kelantan, Melaka, Negeri Sembilan, Pahang, Perak, Perlis, Pulau Pinang, Selangor, Terengganu as well as the Federal Territories of Kuala Lumpur and Putrajaya) and the states of Sabah and Sarawak on the island of Borneo as well as the Federal Territory of Labuan off Sabah.
• Malaysia is a multi-ethnic country with the principal ethnic groups of Malay, Chinese and Indian. Other significant groups are the indigenous people of Sabah and Sarawak, including Kadazan Dusun, Bajau and Murut in Sabah as well as Iban, Bidayuh and Melanau in Sarawak.
• Malaysia practises a system of Parliamentary democracy with constitutional monarchy. It has three branches of government - the Executive, the Legislature and the Judiciary.
• The Malaysian Parliament is made up of His Majesty Yang di-Pertuan Agong, the Senate (Upper House) with 70 members and the House of Representatives (Lower House) with 222 members. Out of the 70 senators in the Senate, 44 are appointed by the His Majesty Yang di-Pertuan Agong while 26 are elected by the State legislatures. The general election for the 222 members of the lower house must be held every five years. The last general election was held in 2013.
Background on Malaysia
i
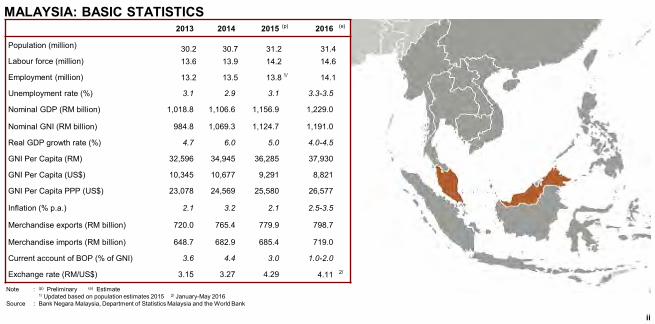
MALAYSIA: BASIC STATISTICS 2013 2014 2015 (p) 2016 (e)
Population (million) 30.2 30.7 31.2 31.4 Labour force (million) 13.6 13.9 14.2 14.6
Employment (million) 13.2 13.5 13.8 1/ 14.1
Unemployment rate (%) 3.1 2.9 3.1 3.3-3.5
Nominal GDP (RM billion) 1,018.8 1,106.6 1,156.9 1,229.0
Nominal GNI (RM billion) 984.8 1,069.3 1,124.7 1,191.0
Real GDP growth rate (%) 4.7 6.0 5.0 4.0-4.5
GNI Per Capita (RM) 32,596 34,945 36,285 37,930
GNI Per Capita (US$) 10,345 10,677 9,291 8,821
GNI Per Capita PPP (US$) 23,078 24,569 25,580 26,577
Inflation (% p.a.) 2.1 3.2 2.1 2.5-3.5
Merchandise exports (RM billion) 720.0 765.4 779.9 798.7
Merchandise imports (RM billion) 648.7 682.9 685.4 719.0
Current account of BOP (% of GNI) 3.6 4.4 3.0 1.0-2.0
Exchange rate (RM/US$) 3.15 3.27 4.29 4.11 2/
Note : (p) Preliminary (e) Estimate 1/ Updated based on population estimates 2015 2/ January-May 2016
Source : Bank Negara Malaysia, Department of Statistics Malaysia and the World Bank
ii
iii
MALAYSIAN ECONOMY IN FIGURES As at May 2016
Table of Contents Page
1 KEY ECONOMIC INDICATORS 1.1 Gross Domestic Product 1 1.2 Gross National Income 1 1.3 Balance of Payments 1 1.4 Federal Government Finance 1 1.5 Price Indices 2 1.6 Unemployment 2 1.7 Exchange Rates 2 1.8 Money and Banking 2
2 AREA, POPULATION AND LABOUR FORCE 2.1 Area 4 2.2 Population 4 2.3 Population Age Structure 4 2.4 Population by Ethnic Group 5 2.5 Labour Force 6 2.6 Employment 6
3 GROSS DOMESTIC PRODUCT 3.1 Supply 7 3.2 Demand 7 3.3 Savings and Investment Gap 8 3.4 Production of Major Commodities 8 3.5 Industrial Production Index (IPI) 10 3.6 Distributive Trade 11
4 PUBLIC SECTOR ACCOUNTS 4.1 Federal Government Finance 12 4.1.1 Revenue 12 4.1.2 Operating Expenditure 12 4.1.3 Development Expenditure 12 4.1.4 Overall Surplus / Deficit 12
Page 4.1.5 Sources of Finance (Net) 12 4.1.6 Debt 12 4.2 Consolidated Public Sector Finance 12 4.2.1 General Government 12 4.2.2 NFPEs Surplus / Deficit 12 4.2.3 Public Sector Current Surplus / Deficit 12 4.2.4 Development Expenditure 12 4.2.5 Overall Surplus / Deficit 12 4.2.6 External Debt 12
5 BALANCE OF PAYMENTS 5.1 Goods (Net) 15 5.2 Services (Net) 15 5.3 Primary Income (Net) 15 5.4 Secondary Income 15 5.5 Current Account Balance (Net) 15 5.6 Capital and Financial Account Balance (Net) 15 5.7 Overall Balance 15
6 BURSA MALAYSIA 6.1 Composite Index 17 6.2 Market Valuation 17 6.3 Selected World Stock Market Indices 17 6.4 New Listing 17 6.5 Listed Companies 17 6.6 Turnover 18
7 APPROVED INVESTMENT PROJECTS 7.1 Approved Investment Projects 19 7.2 Foreign Investment in Approved Projects 19 7.3 Proposed Capital Investments in Approved Projects 20
Page 8 EXTERNAL SECTOR 8.1 Gross Exports 21 8.2 Gross Imports 21 8.3 Destination of Exports 22 8.4 Sources of Imports 22 8.5 Trade Prices and Terms of Trade 22 8.6 Trade Balance by Main Trading Partner 25 8.7 Tourists Arrivals by Region 27
9 PRIVATISATION 9.1 Privatisation Achievement 28
10 ENERGY AND INFRASTRUCTURE 10.1 Final Energy Consumption 29 10.2 Electricity - Demand and Supply 29 10.3 Roads by Surface Type 31 10.4 Railway Statistics 31 10.5 Air Traffic Statistics 31 10.6 Port Statistics 31
11 QUALITY OF LIFE 11.1 Malaysian Well-Being Index (MWI) 32 11.2 Selected Social Indicators 33 11.3 Poverty 35 11.4 Female-Related Information 35
12 INTERNATIONAL COMPARISON 12.1 Real Gross Domestic Product 36 12.2 Consumer Price Index 37
iv
Page 12.3 Structure of Output 38 12.4 Structure of Demand 39 12.5 Current Account of Balance of Payments 40 12.6 Savings and Investment 41 12.7 Government, Debt and Resource Flows 42 12.8 Population, Urbanisation and Population Density 43 12.9 Structure of Employment 44 12.10 Quality of Life 45 12.11 GNI Per Capita (US$) 46 12.12 Information Age 47 12.13 Science and Technology 48 12.14 World Competitiveness Ranking 49 12.15 Productivity per Worker 50 12.16 Productivity per Worker (PPP) 51 12.17 Productivity by Sector (PPP) 52
13 MALAYSIA'S COMPETITIVENESS POSITION 53
14 INVESTORS' GUIDE 14.1 Income Tax Rate 54 14.2 Promotion of Investment Act 54 14.3 Income Tax Act 54 14.4 Others 54
15 FOREIGN EXCHANGE ADMINISTRATION POLICIES 15.1 Foreign Exchange Administration Rules Applicable to
Residents 55 15.2 Foreign Exchange Administration Rules Applicable to
Non-Residents 57 15.3 Special Status Companies 59
Table of Contents

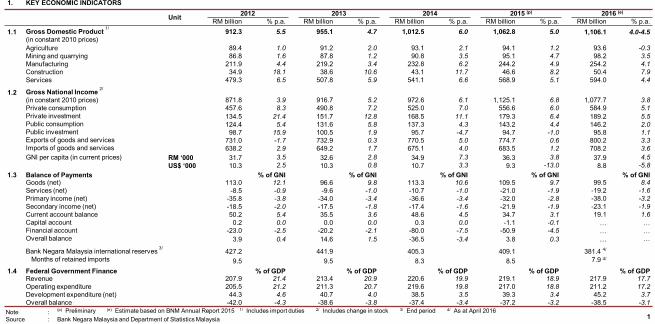
1. KEY ECONOMIC INDICATORS
Unit 2012 2013 2014 2015 (p) 2016 (e)
RM billion % p.a. RM billion % p.a. RM billion % p.a. RM billion % p.a. RM billion % p.a. 1.1 Gross Domestic Product 1/
(in constant 2010 prices) 912.3 5.5 955.1 4.7 1,012.5 6.0 1,062.8 5.0 1,106.1 4.0-4.5
Agriculture 89.4 1.0 91.2 2.0 93.1 2.1 94.1 1.2 93.6 -0.3 Mining and quarrying 86.8 1.6 87.8 1.2 90.8 3.5 95.1 4.7 98.2 3.5 Manufacturing 211.9 4.4 219.2 3.4 232.8 6.2 244.2 4.9 254.2 4.1 Construction 34.9 18.1 38.6 10.6 43.1 11.7 46.6 8.2 50.4 7.9 Services 479.3 6.5 507.8 5.9 541.1 6.6 568.9 5.1 594.0 4.4
1.2 Gross National Income 2/
(in constant 2010 prices) 871.8 3.9 916.7 5.2 972.6 6.1 1,125.1 6.8 1,077.7 3.8 Private consumption 457.6 8.3 490.8 7.2 525.0 7.0 556.6 6.0 584.9 5.1 Private investment 134.5 21.4 151.7 12.8 168.5 11.1 179.3 6.4 189.2 5.5 Public consumption 124.4 5.4 131.6 5.8 137.3 4.3 143.2 4.4 146.2 2.0 Public investment 98.7 15.9 100.5 1.9 95.7 -4.7 94.7 -1.0 95.8 1.1 Exports of goods and services 731.0 -1.7 732.9 0.3 770.5 5.0 774.7 0.6 800.2 3.3 Imports of goods and services 638.2 2.9 649.2 1.7 675.1 4.0 683.5 1.2 708.2 3.6 GNI per capita (in current prices) RM ‘000 31.7 3.5 32.6 2.8 34.9 7.3 36.3 3.8 37.9 4.5
US$ ‘000 10.3 2.5 10.3 0.8 10.7 3.3 9.3 -13.0 8.8 -5.8 1.3 Balance of Payments % of GNI % of GNI % of GNI % of GNI % of GNI
Goods (net) 113.0 12.1 96.6 9.8 113.3 10.6 109.5 9.7 99.5 8.4 Services (net) -8.5 -0.9 -9.6 -1.0 -10.7 -1.0 -21.0 -1.9 -19.2 -1.6 Primary income (net) -35.8 -3.8 -34.0 -3.4 -36.6 -3.4 -32.0 -2.8 -38.0 -3.2 Secondary income (net) -18.5 -2.0 -17.5 -1.8 -17.4 -1.6 -21.9 -1.9 -23.1 -1.9 Current account balance 50.2 5.4 35.5 3.6 48.6 4.5 34.7 3.1 19.1 1.6 Capital account 0.2 0.0 0.0 0.0 0.3 0.0 -1.1 -0.1 … … Financial account -23.0 -2.5 -20.2 -2.1 -80.0 -7.5 -50.9 -4.5 … … Overall balance 3.9 0.4 14.6 1.5 -36.5 -3.4 3.8 0.3 … …
Bank Negara Malaysia international reserves 3/ 427.2 441.9 405.3 409.1 381.4 4/
Months of retained imports 9.5 9.5 8.3 8.5 7.9 4/
1.4 Federal Government Finance % of GDP % of GDP % of GDP % of GDP % of GDP Revenue 207.9 21.4 213.4 20.9 220.6 19.9 219.1 18.9 217.9 17.7 Operating expenditure 205.5 21.2 211.3 20.7 219.6 19.8 217.0 18.8 211.2 17.2 Development expenditure (net) 44.3 4.6 40.7 4.0 38.5 3.5 39.3 3.4 45.2 3.7 Overall balance -42.0 -4.3 -38.6 -3.8 -37.4 -3.4 -37.2 -3.2 -38.5 -3.1
Note : (p) Preliminary (e) Estimate based on BNM Annual Report 2015 1/ Includes import duties 2/ Includes change in stock 3/ End period 4/ As at April 2016 Source : Bank Negara Malaysia and Department of Statistics Malaysia 1
Unit 2012 2013 2014 2015 2016
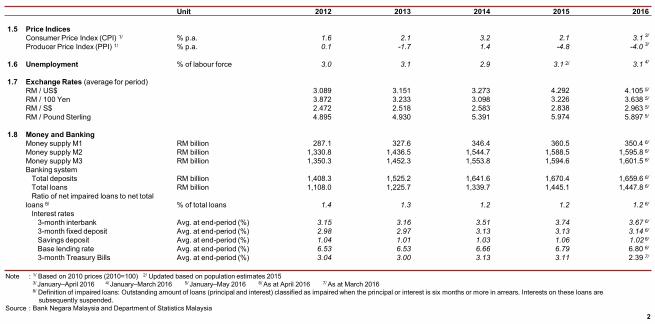
1.5 Price Indices Consumer Price Index (CPI) 1/ % p.a. 1.6 2.1 3.2 2.1 3.1 3/
Producer Price Index (PPI) 1/ % p.a. 0.1 -1.7 1.4 -4.8 -4.0 3/
1.6 Unemployment % of labour force 3.0 3.1 2.9 3.1 2/ 3.1 4/
1.7 Exchange Rates (average for period) RM / US$ 3.089 3.151 3.273 4.292 4.105 5/ RM / 100 Yen 3.872 3.233 3.098 3.226 3.638 5/ RM / S$ 2.472 2.518 2.583 2.838 2.963 5/ RM / Pound Sterling 4.895 4.930 5.391 5.974 5.897 5/
1.8 Money and Banking Money supply M1 RM billion 287.1 327.6 346.4 360.5 350.4 6/ Money supply M2 RM billion 1,330.8 1,436.5 1,544.7 1,588.5 1,595.8 6/ Money supply M3 RM billion 1,350.3 1,452.3 1,553.8 1,594.6 1,601.5 6/ Banking system Total deposits RM billion 1,408.3 1,525.2 1,641.6 1,670.4 1,659.6 6/ Total loans RM billion 1,108.0 1,225.7 1,339.7 1,445.1 1,447.8 6/ Ratio of net impaired loans to net total loans 8/ % of total loans 1.4 1.3 1.2 1.2 1.2 6/ Interest rates 3-month interbank Avg. at end-period (%) 3.15 3.16 3.51 3.74 3.67 6/ 3-month fixed deposit Avg. at end-period (%) 2.98 2.97 3.13 3.13 3.14 6/ Savings deposit Avg. at end-period (%) 1.04 1.01 1.03 1.06 1.02 6/ Base lending rate Avg. at end-period (%) 6.53 6.53 6.66 6.79 6.80 6/ 3-month Treasury Bills Avg. at end-period (%) 3.04 3.00 3.13 3.11 2.39 7/
Note : 1/ Based on 2010 prices (2010=100) 2/ Updated based on population estimates 2015 3/ January–April 2016 4/ January–March 2016 5/ January–May 2016 6/ As at April 2016 7/ As at March 2016 8/ Definition of impaired loans: Outstanding amount of loans (principal and interest) classified as impaired when the principal or interest is six months or more in arrears. Interests on these loans are
subsequently suspended. Source : Bank Negara Malaysia and Department of Statistics Malaysia
2
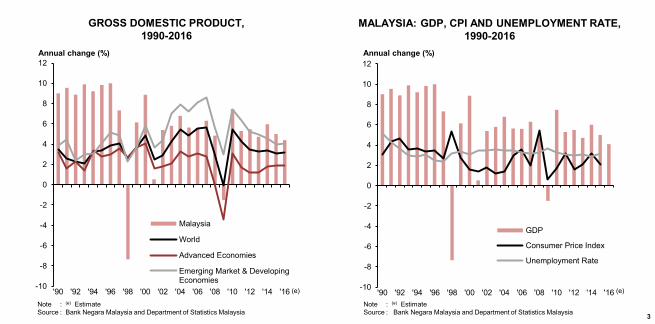
GROSS DOMESTIC PRODUCT, 1990-2016
Annual change (%)
MALAYSIA: GDP, CPI AND UNEMPLOYMENT RATE, 1990-2016
Annual change (%)
-10
-8
-6
-4
-2
0
2
4
6
8
10
12
'90 '92 '94 '96 '98 '00 '02 '04 '06 '08 '10 '12 '14 '16
GDP
Consumer Price Index
Unemployment Rate
3
-10
-8
-6
-4
-2
0
2
4
6
8
10
12
'90 '92 '94 '96 '98 '00 '02 '04 '06 '08 '10 '12 '14 '16
Malaysia
World
Advanced Economies
Emerging Market & DevelopingEconomies
(e) (e)
Note : (e) Estimate Source : Bank Negara Malaysia and Department of Statistics Malaysia
Note : (e) Estimate Source : Bank Negara Malaysia and Department of Statistics Malaysia
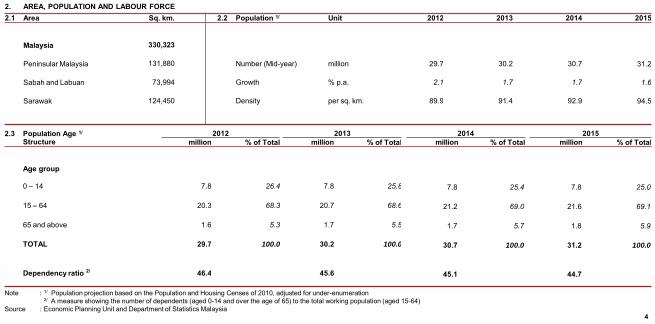
2. AREA, POPULATION AND LABOUR FORCE 2.1 Area Sq. km. 2.2 Population 1/ Unit 2012 2013 2014 2015
Malaysia 330,323
Peninsular Malaysia 131,880 Number (Mid-year) million 29.7 30.2 30.7 31.2
Sabah and Labuan 73,994 Growth % p.a. 2.1 1.7 1.7 1.6
Sarawak 124,450 Density per sq. km. 89.9 91.4 92.9 94.5
2.3 Population Age 1/ 2012 2013 2014 2015 Structure million % of Total million % of Total million % of Total million % of Total
Age group
0 – 14 7.8 26.4 7.8 25.8 7.8 25.4 7.8 25.0
15 – 64 20.3 68.3 20.7 68.6 21.2 69.0 21.6 69.1
65 and above 1.6 5.3 1.7 5.5 1.7 5.7 1.8 5.9
TOTAL 29.7 100.0 30.2 100.0 30.7 100.0 31.2 100.0
Dependency ratio 2/ 46.4 45.6 45.1 44.7
4
Note : 1/ Population projection based on the Population and Housing Censes of 2010, adjusted for under-enumeration 2/ A measure showing the number of dependents (aged 0-14 and over the age of 65) to the total working population (aged 15-64)
Source : Economic Planning Unit and Department of Statistics Malaysia
Unit 2012 2013 2014 2015
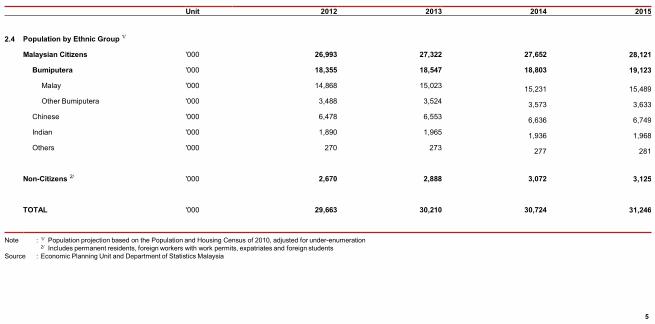
2.4 Population by Ethnic Group 1/
Malaysian Citizens '000 26,993 27,322 27,652 28,121
Bumiputera '000 18,355 18,547 18,803 19,123
Malay '000 14,868 15,023 15,231 15,489 Other Bumiputera '000 3,488 3,524 3,573 3,633
Chinese '000 6,478 6,553 6,636 6,749 Indian '000 1,890 1,965 1,936 1,968 Others '000 270 273 277 281
Non-Citizens 2/ '000 2,670 2,888 3,072 3,125
TOTAL '000 29,663 30,210 30,724 31,246
5
Note : 1/ Population projection based on the Population and Housing Census of 2010, adjusted for under-enumeration 2/ Includes permanent residents, foreign workers with work permits, expatriates and foreign students
Source : Economic Planning Unit and Department of Statistics Malaysia
Unit 2012 2013 2014 2015
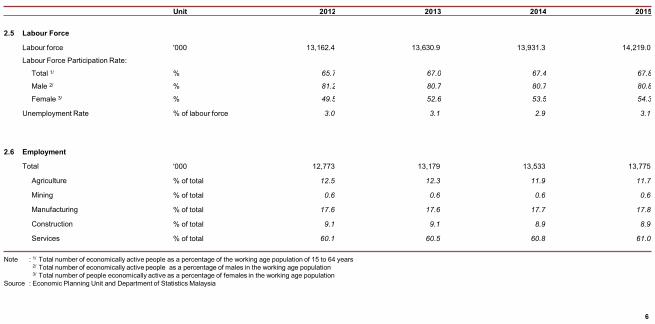
2.5 Labour Force
Labour force '000 13,162.4 13,630.9 13,931.3 14,219.0
Labour Force Participation Rate:
Total 1/ % 65.7 67.0 67.4 67.8
Male 2/ % 81.2 80.7 80.7 80.8
Female 3/ % 49.5 52.6 53.5 54.3
Unemployment Rate % of labour force 3.0 3.1 2.9 3.1
2.6 Employment
Total '000 12,773 13,179 13,533 13,775
Agriculture % of total 12.5 12.3 11.9 11.7
Mining % of total 0.6 0.6 0.6 0.6
Manufacturing % of total 17.6 17.6 17.7 17.8
Construction % of total 9.1 9.1 8.9 8.9
Services % of total 60.1 60.5 60.8 61.0
Note : 1/ Total number of economically active people as a percentage of the working age population of 15 to 64 years 2/ Total number of economically active people as a percentage of males in the working age population 3/ Total number of people economically active as a percentage of females in the working age population
Source : Economic Planning Unit and Department of Statistics Malaysia
6
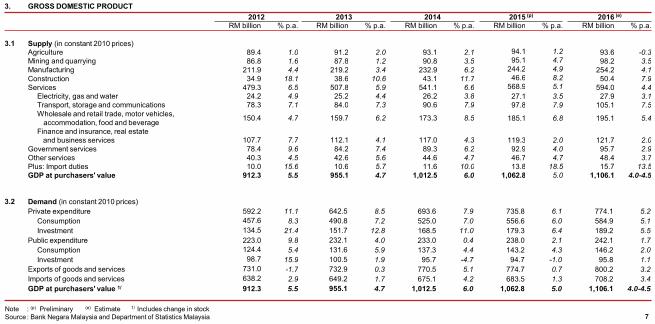
3. GROSS DOMESTIC PRODUCT 2012 2013 2014 2015 (p) 2016 (e)
RM billion % p.a. RM billion % p.a. RM billion % p.a. RM billion % p.a. RM billion % p.a.
3.1 Supply (in constant 2010 prices) Agriculture 89.4 1.0 91.2 2.0 93.1 2.1 94.1 1.2 93.6 -0.3 Mining and quarrying 86.8 1.6 87.8 1.2 90.8 3.5 95.1 4.7 98.2 3.5 Manufacturing 211.9 4.4 219.2 3.4 232.9 6.2 244.2 4.9 254.2 4.1 Construction 34.9 18.1 38.6 10.6 43.1 11.7 46.6 8.2 50.4 7.9 Services 479.3 6.5 507.8 5.9 541.1 6.6 568.9 5.1 594.0 4.4
Electricity, gas and water 24.2 4.9 25.2 4.4 26.2 3.8 27.1 3.5 27.9 3.1 Transport, storage and communications 78.3 7.1 84.0 7.3 90.6 7.9 97.8 7.9 105.1 7.5 Wholesale and retail trade, motor vehicles,
accommodation, food and beverage 150.4 4.7 159.7 6.2 173.3 8.5 185.1 6.8 195.1 5.4
Finance and insurance, real estate and business services 107.7 7.7 112.1 4.1 117.0 4.3 119.3 2.0 121.7 2.0
Government services 78.4 9.6 84.2 7.4 89.3 6.2 92.9 4.0 95.7 2.9 Other services 40.3 4.5 42.6 5.6 44.6 4.7 46.7 4.7 48.4 3.7 Plus: Import duties 10.0 15.6 10.6 5.7 11.6 10.0 13.8 18.5 15.7 13.5 GDP at purchasers' value 912.3 5.5 955.1 4.7 1,012.5 6.0 1,062.8 5.0 1,106.1 4.0-4.5
3.2 Demand (in constant 2010 prices) Private expenditure 592.2 11.1 642.5 8.5 693.6 7.9 735.8 6.1 774.1 5.2
Consumption 457.6 8.3 490.8 7.2 525.0 7.0 556.6 6.0 584.9 5.1 Investment 134.5 21.4 151.7 12.8 168.5 11.0 179.3 6.4 189.2 5.5
Public expenditure 223.0 9.8 232.1 4.0 233.0 0.4 238.0 2.1 242.1 1.7 Consumption 124.4 5.4 131.6 5.9 137.3 4.4 143.2 4.3 146.2 2.0 Investment 98.7 15.9 100.5 1.9 95.7 -4.7 94.7 -1.0 95.8 1.1
Exports of goods and services 731.0 -1.7 732.9 0.3 770.5 5.1 774.7 0.7 800.2 3.2 Imports of goods and services 638.2 2.9 649.2 1.7 675.1 4.2 683.5 1.3 708.2 3.4 GDP at purchasers' value 1/ 912.3 5.5 955.1 4.7 1,012.5 6.0 1,062.8 5.0 1,106.1 4.0-4.5
Note : (p) Preliminary (e) Estimate 1/ Includes change in stock Source : Bank Negara Malaysia and Department of Statistics Malaysia 7
Unit 2012 2013 2014 2015 (p)
RM billion % p.a. RM billion % p.a. RM billion % p.a. RM billion % p.a.
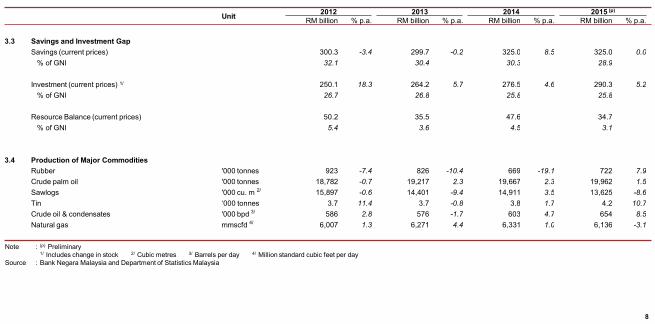
3.3 Savings and Investment Gap Savings (current prices) 300.3 -3.4 299.7 -0.2 325.0 8.5 325.0 0.0 % of GNI 32.1 30.4 30.3 28.9
Investment (current prices) 1/ 250.1 18.3 264.2 5.7 276.5 4.6 290.3 5.2 % of GNI 26.7 26.8 25.8 25.8
Resource Balance (current prices) 50.2 35.5 47.6 34.7 % of GNI 5.4 3.6 4.5 3.1
3.4 Production of Major Commodities Rubber '000 tonnes 923 -7.4 826 -10.4 669 -19.1 722 7.9 Crude palm oil '000 tonnes 18,782 -0.7 19,217 2.3 19,667 2.3 19,962 1.5 Sawlogs '000 cu. m 2/ 15,897 -0.6 14,401 -9.4 14,911 3.5 13,625 -8.6 Tin ‘000 tonnes 3.7 11.4 3.7 -0.8 3.8 1.7 4.2 10.7 Crude oil & condensates '000 bpd 3/ 586 2.8 576 -1.7 603 4.7 654 8.5 Natural gas mmscfd 4/ 6,007 1.3 6,271 4.4 6,331 1.0 6,136 -3.1
Note : (p) Preliminary 1/ Includes change in stock 2/ Cubic metres 3/ Barrels per day 4/ Million standard cubic feet per day
Source : Bank Negara Malaysia and Department of Statistics Malaysia
8
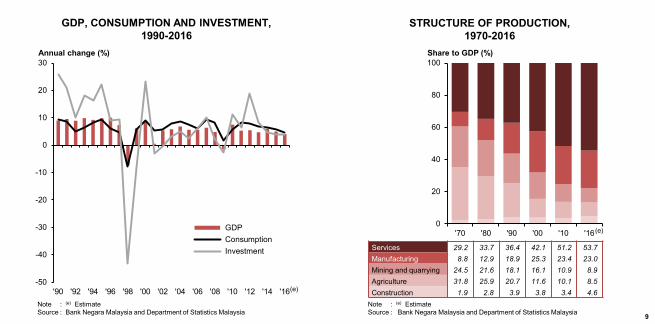
1970 1980 1990 2000 2010 2016 Services 29.2 33.7 36.4 42.1 51.2 53.7 Manufacturing 8.8 12.9 18.9 25.3 23.4 23.0 Mining and quarrying 24.5 21.6 18.1 16.1 10.9 8.9 Agriculture 31.8 25.9 20.7 11.6 10.1 8.5 Construction 1.9 2.8 3.9 3.8 3.4 4.6
9
-50
-40
-30
-20
-10
0
10
20
30
'90 '92 '94 '96 '98 '00 '02 '04 '06 '08 '10 '12 '14 '16
GDP Consumption Investment
0
20
40
60
80
100
'70 '80 '90 '00 '10 '16
GDP, CONSUMPTION AND INVESTMENT, 1990-2016
STRUCTURE OF PRODUCTION, 1970-2016
(e)
Share to GDP (%) Annual change (%)
Note : (e) Estimate Source : Bank Negara Malaysia and Department of Statistics Malaysia
Note : (e) Estimate Source : Bank Negara Malaysia and Department of Statistics Malaysia
(e)
0
1
2
3
4
5
6
7
8
9
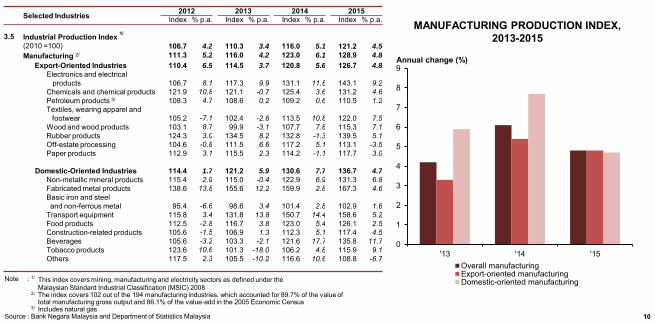
'13 '14 '15Overall manufacturingExport-oriented manufacturingDomestic-oriented manufacturing
Selected Industries 2012 2013 2014 2015 Index % p.a. Index % p.a. Index % p.a. Index % p.a.
3.5 Industrial Production Index 1/ (2010 =100) 106.7 4.2 110.3 3.4 116.0 5.1 121.2 4.5
Manufacturing 2/ 111.3 5.2 116.0 4.2 123.0 6.1 128.9 4.8
Export-Oriented Industries 110.4 6.5 114.5 3.7 120.8 5.6 126.7 4.8
Electronics and electrical products 106.7 8.1 117.3 9.9 131.1 11.8 143.1 9.2 Chemicals and chemical products 121.9 10.8 121.1 -0.7 125.4 3.6 131.2 4.6 Petroleum products 3/ 108.3 4.7 108.6 0.2 109.2 0.6 110.5 1.2 Textiles, wearing apparel and footwear 105.2 -7.1 102.4 -2.6 113.5 10.8 122.0 7.5 Wood and wood products 103.1 8.7 99.9 -3.1 107.7 7.8 115.3 7.1 Rubber products 124.3 3.0 134.5 8.2 132.8 -1.3 139.5 5.1 Off-estate processing 104.6 -0.8 111.5 6.6 117.2 5.1 113.1 -3.5 Paper products 112.9 3.1 115.5 2.3 114.2 -1.1 117.7 3.0
Domestic-Oriented Industries 114.4 1.7 121.2 5.9 130.6 7.7 136.7 4.7
Non-metallic mineral products 115.4 2.9 115.0 -0.4 122.9 6.9 131.3 6.8 Fabricated metal products 138.6 13.8 155.6 12.2 159.9 2.8 167.3 4.6 Basic iron and steel and non-ferrous metal 95.4 -6.6 98.6 3.4 101.4 2.8 102.9 1.6 Transport equipment 115.8 3.4 131.8 13.8 150.7 14.4 158.6 5.2 Food products 112.5 -2.8 116.7 3.8 123.0 5.4 126.1 2.5 Construction-related products 105.6 -1.5 106.9 1.3 112.3 5.1 117.4 4.5 Beverages 105.6 -3.2 103.3 -2.1 121.6 17.7 135.8 11.7 Tobacco products 123.6 10.6 101.3 -18.0 106.2 4.8 115.9 9.1 Others 117.5 2.3 105.5 -10.2 116.6 10.6 108.8 -6.7
Note : 1/ This index covers mining, manufacturing and electricity sectors as defined under the Malaysian Standard Industrial Classification (MSIC) 2008
2/
The index covers 102 out of the 194 manufacturing industries, which accounted for 89.7% of the value of total manufacturing gross output and 86.1% of the value-add in the 2005 Economic Census
3/ Includes natural gas Source : Bank Negara Malaysia and Department of Statistics Malaysia 10
Annual change (%)
MANUFACTURING PRODUCTION INDEX, 2013-2015
2012 2013 2014 2015
Level % p.a. Level % p.a. Level % p.a. Level % p.a.
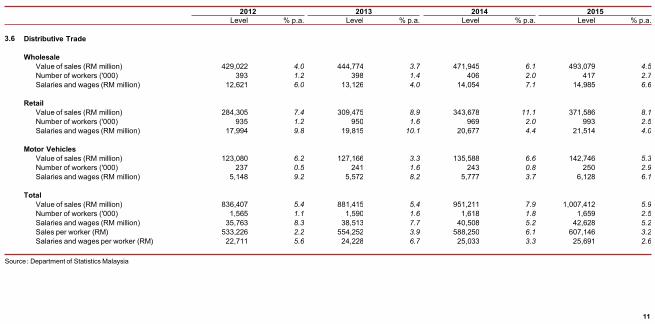
3.6 Distributive Trade
Wholesale Value of sales (RM million) 429,022 4.0 444,774 3.7 471,945 6.1 493,079 4.5 Number of workers ('000) 393 1.2 398 1.4 406 2.0 417 2.7 Salaries and wages (RM million) 12,621 6.0 13,126 4.0 14,054 7.1 14,985 6.6
Retail Value of sales (RM million) 284,305 7.4 309,475 8.9 343,678 11.1 371,586 8.1 Number of workers ('000) 935 1.2 950 1.6 969 2.0 993 2.5 Salaries and wages (RM million) 17,994 9.8 19,815 10.1 20,677 4.4 21,514 4.0
Motor Vehicles Value of sales (RM million) 123,080 6.2 127,166 3.3 135,588 6.6 142,746 5.3 Number of workers ('000) 237 0.5 241 1.6 243 0.8 250 2.9 Salaries and wages (RM million) 5,148 9.2 5,572 8.2 5,777 3.7 6,128 6.1
Total Value of sales (RM million) 836,407 5.4 881,415 5.4 951,211 7.9 1,007,412 5.9 Number of workers ('000) 1,565 1.1 1,590 1.6 1,618 1.8 1,659 2.5 Salaries and wages (RM million) 35,763 8.3 38,513 7.7 40,508 5.2 42,628 5.2 Sales per worker (RM) 533,226 2.2 554,252 3.9 588,250 6.1 607,146 3.2 Salaries and wages per worker (RM) 22,711 5.6 24,228 6.7 25,033 3.3 25,691 2.6
Source : Department of Statistics Malaysia
11
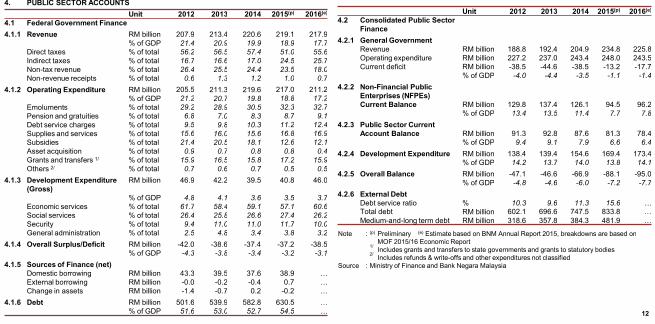
4. PUBLIC SECTOR ACCOUNTS Unit 2012 2013 2014 2015(p) 2016(e)
4.1 Federal Government Finance 4.1.1 Revenue RM billion 207.9 213.4 220.6 219.1 217.9
% of GDP 21.4 20.9 19.9 18.9 17.7 Direct taxes % of total 56.2 56.5 57.4 51.0 55.6 Indirect taxes % of total 16.7 16.6 17.0 24.5 25.7 Non-tax revenue % of total 26.4 25.5 24.4 23.5 18.0 Non-revenue receipts % of total 0.6 1.3 1.2 1.0 0.7
4.1.2 Operating Expenditure RM billion 205.5 211.3 219.6 217.0 211.2 % of GDP 21.2 20.7 19.8 18.8 17.2
Emoluments % of total 29.2 28.9 30.5 32.3 32.7 Pension and gratuities % of total 6.8 7.0 8.3 8.7 9.1 Debt service charges % of total 9.5 9.8 10.3 11.2 12.4 Supplies and services % of total 15.6 16.0 15.6 16.8 16.9 Subsidies % of total 21.4 20.5 18.1 12.6 12.1 Asset acquisition % of total 0.9 0.7 0.8 0.8 0.4 Grants and transfers 1/ % of total 15.9 16.5 15.8 17.2 15.9 Others 2/ % of total 0.7 0.6 0.7 0.5 0.5
4.1.3 Development Expenditure RM billion 46.9 42.2 39.5 40.8 46.0 (Gross)
% of GDP 4.8 4.1 3.6 3.5 3.7 Economic services % of total 61.7 58.4 59.1 57.1 60.6 Social services % of total 26.4 25.8 26.6 27.4 26.2 Security % of total 9.4 11.0 11.0 11.7 10.0 General administration % of total 2.5 4.8 3.4 3.8 3.2
4.1.4 Overall Surplus/Deficit RM billion -42.0 -38.6 -37.4 -37.2 -38.5 % of GDP -4.3 -3.8 -3.4 -3.2 -3.1
4.1.5 Sources of Finance (net) Domestic borrowing RM billion 43.3 39.5 37.6 38.9 … External borrowing RM billion -0.0 -0.2 -0.4 0.7 … Change in assets RM billion -1.4 -0.7 0.2 -0.2 …
4.1.6 Debt RM billion 501.6 539.9 582.8 630.5 … % of GDP 51.6 53.0 52.7 54.5 … 12
Note : (p) Preliminary (e) Estimate based on BNM Annual Report 2015, breakdowns are based on MOF 2015/16 Economic Report
1/ Includes grants and transfers to state governments and grants to statutory bodies 2/ Includes refunds & write-offs and other expenditures not classified
Source : Ministry of Finance and Bank Negara Malaysia
Unit 2012 2013 2014 2015(p) 2016(e) 4.2 Consolidated Public Sector
Finance 4.2.1 General Government
Revenue RM billion 188.8 192.4 204.9 234.8 225.8 Operating expenditure RM billion 227.2 237.0 243.4 248.0 243.5 Current deficit RM billion -38.5 -44.6 -38.5 -13.2 -17.7
% of GDP -4.0 -4.4 -3.5 -1.1 -1.4 4.2.2 Non-Financial Public
Enterprises (NFPEs) Current Balance RM billion 129.8 137.4 126.1 94.5 96.2
% of GDP 13.4 13.5 11.4 7.7 7.8 4.2.3 Public Sector Current
Account Balance RM billion 91.3 92.8 87.6 81.3 78.4 % of GDP 9.4 9.1 7.9 6.6 6.4
4.2.4 Development Expenditure RM billion 138.4 139.4 154.6 169.4 173.4 % of GDP 14.2 13.7 14.0 13.8 14.1
4.2.5 Overall Balance RM billion -47.1 -46.6 -66.9 -88.1 -95.0 % of GDP -4.8 -4.6 -6.0 -7.2 -7.7
4.2.6 External Debt Debt service ratio % 10.3 9.6 11.3 15.6 … Total debt RM billion 602.1 696.6 747.5 833.8 … Medium-and-long term debt RM billion 318.6 357.8 384.3 481.9 …
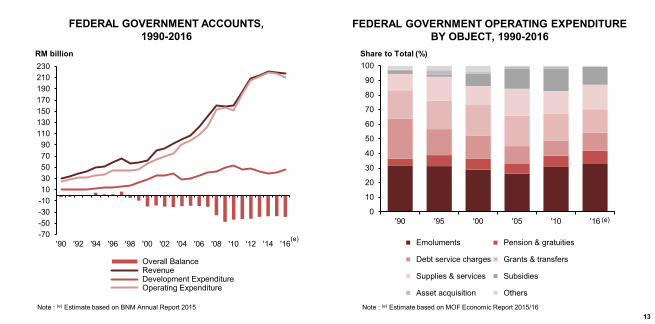
Share to Total (%)
FEDERAL GOVERNMENT ACCOUNTS, 1990-2016
FEDERAL GOVERNMENT OPERATING EXPENDITURE BY OBJECT, 1990-2016
13
RM billion
-70-50-30-101030507090
110130150170190210230
'90 '92 '94 '96 '98 '00 '02 '04 '06 '08 '10 '12 '14 '16
Overall Balance Revenue Development Expenditure Operating Expenditure
(e)
Note : (e) Estimate based on BNM Annual Report 2015
(e) 0
10
20
30
40
50
60
70
80
90
100
'90 '95 '00 '05 '10 '16
Emoluments Pension & gratuities
Debt service charges Grants & transfers
Supplies & services Subsidies
Asset acquisition Others
Note : (e) Estimate based on MOF Economic Report 2015/16
0
10
20
30
40
50
'90 '95 '00 '05 '10 '15 '16
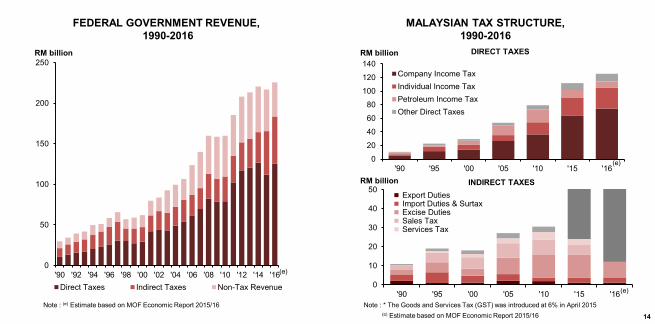
Export Duties Import Duties & Surtax Excise Duties Sales Tax Services Tax
14
DIRECT TAXES
MALAYSIAN TAX STRUCTURE, 1990-2016
RM billion RM billion
FEDERAL GOVERNMENT REVENUE, 1990-2016
(e)
RM billion INDIRECT TAXES
(e)
(e)
0
20
40
60
80
100
120
140
'90 '95 '00 '05 '10 '15 '16
Company Income TaxIndividual Income TaxPetroleum Income TaxOther Direct Taxes
0
50
100
150
200
250
'90 '92 '94 '96 '98 '00 '02 '04 '06 '08 '10 '12 '14 '16Direct Taxes Indirect Taxes Non-Tax Revenue
Note : (e) Estimate based on MOF Economic Report 2015/16 Note : * The Goods and Services Tax (GST) was introduced at 6% in April 2015 (e) Estimate based on MOF Economic Report 2015/16
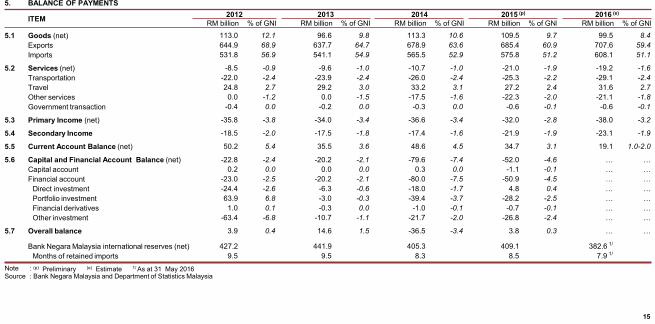
5. BALANCE OF PAYMENTS
ITEM 2012 2013 2014 2015 (p) 2016 (e)
RM billion % of GNI RM billion % of GNI RM billion % of GNI RM billion % of GNI RM billion % of GNI
5.1 Goods (net) 113.0 12.1 96.6 9.8 113.3 10.6 109.5 9.7 99.5 8.4 Exports 644.9 68.9 637.7 64.7 678.9 63.6 685.4 60.9 707.6 59.4 Imports 531.8 56.9 541.1 54.9 565.5 52.9 575.8 51.2 608.1 51.1
5.2 Services (net) -8.5 -0.9 -9.6 -1.0 -10.7 -1.0 -21.0 -1.9 -19.2 -1.6 Transportation -22.0 -2.4 -23.9 -2.4 -26.0 -2.4 -25.3 -2.2 -29.1 -2.4 Travel 24.8 2.7 29.2 3.0 33.2 3.1 27.2 2.4 31.6 2.7 Other services 0.0 -1.2 0.0 -1.5 -17.5 -1.6 -22.3 -2.0 -21.1 -1.8 Government transaction -0.4 0.0 -0.2 0.0 -0.3 0.0 -0.6 -0.1 -0.6 -0.1
5.3 Primary Income (net) -35.8 -3.8 -34.0 -3.4 -36.6 -3.4 -32.0 -2.8 -38.0 -3.2
5.4 Secondary Income -18.5 -2.0 -17.5 -1.8 -17.4 -1.6 -21.9 -1.9 -23.1 -1.9
5.5 Current Account Balance (net) 50.2 5.4 35.5 3.6 48.6 4.5 34.7 3.1 19.1 1.0-2.0
5.6 Capital and Financial Account Balance (net) -22.8 -2.4 -20.2 -2.1 -79.6 -7.4 -52.0 -4.6 … … Capital account 0.2 0.0 0.0 0.0 0.3 0.0 -1.1 -0.1 … … Financial account -23.0 -2.5 -20.2 -2.1 -80.0 -7.5 -50.9 -4.5 … …
Direct investment -24.4 -2.6 -6.3 -0.6 -18.0 -1.7 4.8 0.4 … … Portfolio investment 63.9 6.8 -3.0 -0.3 -39.4 -3.7 -28.2 -2.5 … … Financial derivatives 1.0 0.1 -0.3 0.0 -1.0 -0.1 -0.7 -0.1 … … Other investment -63.4 -6.8 -10.7 -1.1 -21.7 -2.0 -26.8 -2.4 … …
5.7 Overall balance 3.9 0.4 14.6 1.5 -36.5 -3.4 3.8 0.3 … …
Bank Negara Malaysia international reserves (net) 427.2 441.9 405.3 409.1 382.6 1/
Months of retained imports 9.5 9.5 8.3 8.5 7.9 1/ Note : (p) Preliminary (e) Estimate 1/ As at 31 May 2016 Source : Bank Negara Malaysia and Department of Statistics Malaysia
15
-50
-40
-30
-20
-10
0
10
20
30
40
'05 '06 '07 '08 '09 '10 '11 '12 '13 '14 '15 '16
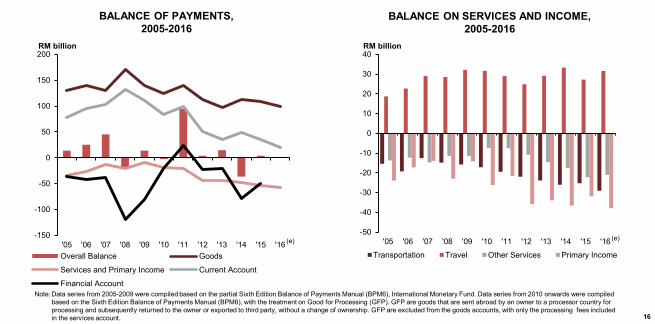
Transportation Travel Other Services Primary Income
BALANCE OF PAYMENTS, 2005-2016
BALANCE ON SERVICES AND INCOME, 2005-2016
RM billion RM billion
16
Note: Data series from 2005-2009 were compiled based on the partial Sixth Edition Balance of Payments Manual (BPM6), International Monetary Fund. Data series from 2010 onwards were compiled based on the Sixth Edition Balance of Payments Manual (BPM6), with the treatment on Good for Processing (GFP). GFP are goods that are sent abroad by an owner to a processor country for processing and subsequently returned to the owner or exported to third party, without a change of ownership. GFP are excluded from the goods accounts, with only the processing fees included in the services account.
(e) (e) -150
-100
-50
0
50
100
150
200
'05 '06 '07 '08 '09 '10 '11 '12 '13 '14 '15 '16Overall Balance Goods
Services and Primary Income Current Account
Financial Account

6. BURSA MALAYSIA 2012 2013 2014 2015 2016 1/
6.1 Composite Index 1,689.0 1,867.0 1,761.3 1,692.5 1,626.0
6.2 Market Valuation (RM billion) 1,465.7 1,702.1 1,651.2 1,694.7 1,641.0
6.3 Selected World Stock Market Indices Dow Jones, New York 13,104.1 16,576.7 17,823.1 17,425.0 17,787.2 Nikkei, Tokyo 10,395.2 16,291.3 17,450.8 19,033.7 17,235.0 Hang Seng, Hong Kong 22,656.9 23,306.4 23,605.0 21,914.4 20,815.1
6.4 New Listings (number of companies) 2/ Main Market (Main Board) 3/ 14 18 11 7 3 ACE Market (Mesdaq Market) 4/ 3 1 3 4 2 Total 17 19 14 11 5
6.5 Listed Companies (number of companies) Main Market (Main Board) 3/ 809 802 799 794 794 ACE Market (Mesdaq Market) 4/ 112 109 107 109 111 Total 921 911 906 903 905
17
Note : 1/ As at end of May 2016 2/ FTSE Bursa Malaysia KLCI starting from 6 July 2009 3/ Main Board was renamed as Main Market (effective 3 August 2009) to include Second Board 4/ Mesdaq was renamed as Ace Market effective 3 August 2009
Source : Bursa Malaysia
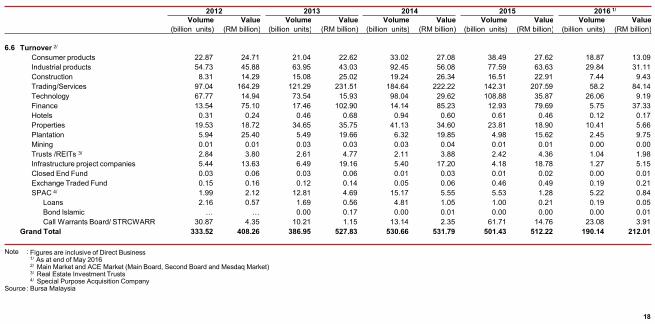
2012 2013 2014 2015 2016 1/
Volume Value Volume Value Volume Value Volume Value Volume Value (billion units) (RM billion) (billion units) (RM billion) (billion units) (RM billion) (billion units) (RM billion) (billion units) (RM billion)
6.6 Turnover 2/ Consumer products 22.87 24.71 21.04 22.62 33.02 27.08 38.49 27.62 18.87 13.09 Industrial products 54.73 45.88 63.95 43.03 92.45 56.08 77.59 63.63 29.84 31.11 Construction 8.31 14.29 15.08 25.02 19.24 26.34 16.51 22.91 7.44 9.43 Trading/Services 97.04 164.29 121.29 231.51 184.64 222.22 142.31 207.59 58.2 84.14 Technology 67.77 14.94 73.54 15.93 98.04 29.62 108.88 35.87 26.06 9.19 Finance 13.54 75.10 17.46 102.90 14.14 85.23 12.93 79.69 5.75 37.33 Hotels 0.31 0.24 0.46 0.68 0.94 0.60 0.61 0.46 0.12 0.17 Properties 19.53 18.72 34.65 35.75 41.13 34.60 23.81 18.90 10.41 5.66 Plantation 5.94 25.40 5.49 19.66 6.32 19.85 4.98 15.62 2.45 9.75 Mining 0.01 0.01 0.03 0.03 0.03 0.04 0.01 0.01 0.00 0.00 Trusts /REITs 3/ 2.84 3.80 2.61 4.77 2.11 3.88 2.42 4.36 1.04 1.98 Infrastructure project companies 5.44 13.63 6.49 19.16 5.40 17.20 4.18 18.78 1.27 5.15 Closed End Fund 0.03 0.06 0.03 0.06 0.01 0.03 0.01 0.02 0.00 0.01 Exchange Traded Fund 0.15 0.16 0.12 0.14 0.05 0.06 0.46 0.49 0.19 0.21 SPAC 4/ 1.99 2.12 12.81 4.69 15.17 5.55 5.53 1.28 5.22 0.84
Loans 2.16 0.57 1.69 0.56 4.81 1.05 1.00 0.21 0.19 0.05 Bond Islamic … … 0.00 0.17 0.00 0.01 0.00 0.00 0.00 0.01 Call Warrants Board/ STRCWARR 30.87 4.35 10.21 1.15 13.14 2.35 61.71 14.76 23.08 3.91
Grand Total 333.52 408.26 386.95 527.83 530.66 531.79 501.43 512.22 190.14 212.01
Note : Figures are inclusive of Direct Business 1/ As at end of May 2016 2/ Main Market and ACE Market (Main Board, Second Board and Mesdaq Market) 3/ Real Estate Investment Trusts 4/ Special Purpose Acquisition Company
Source : Bursa Malaysia
18

7. APPROVED INVESTMENT PROJECTS Unit 2012 2013 2014 2015
7.1 Approved Investment Projects Number of projects approved 804 787 811 680 Potential employment '000s 77 93 78 66 Total proposed capital investment RM million 41,126 52,101 71,853 74,693
Domestic % of total 49 41 45 71 Foreign % of total 51 59 55 29
7.2 Foreign Investment in Approved Projects (by Selected Country) Total RM million 20,919 30,536 39,593 21,942
Australia % of total 0.7 0.5 0.5 1.2 France % of total 6.9 0.0 0.3 0.1 Germany % of total 3.3 5.6 11.2 5.3 Japan % of total 13.4 11.8 27.5 18.3 Singapore % of total 10.6 14.8 19.8 6.4 Taiwan % of total 0.8 0.4 1.7 5.8 United Kingdom % of total 2.9 1.6 1.0 0.7 United States of America % of total 1.4 20.7 3.4 18.9 Others % of total 60.0 44.5 34.7 43.4
Source : Malaysian Investment Development Authority
19
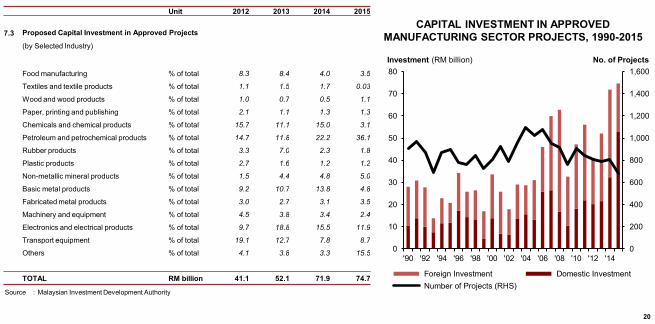
Unit 2012 2013 2014 2015
7.3 Proposed Capital Investment in Approved Projects
(by Selected Industry)
Food manufacturing % of total 8.3 8.4 4.0 3.5
Textiles and textile products % of total 1.1 1.5 1.7 0.03
Wood and wood products % of total 1.0 0.7 0.5 1.1
Paper, printing and publishing % of total 2.1 1.1 1.3 1.3
Chemicals and chemical products % of total 15.7 11.1 15.0 3.1
Petroleum and petrochemical products % of total 14.7 11.8 22.2 36.1
Rubber products % of total 3.3 7.0 2.3 1.8
Plastic products % of total 2.7 1.6 1.2 1.2
Non-metallic mineral products % of total 1.5 4.4 4.8 5.0
Basic metal products % of total 9.2 10.7 13.8 4.8
Fabricated metal products % of total 3.0 2.7 3.1 3.5
Machinery and equipment % of total 4.5 3.8 3.4 2.4
Electronics and electrical products % of total 9.7 18.8 15.5 11.9
Transport equipment % of total 19.1 12.7 7.8 8.7
Others % of total 4.1 3.8 3.3 15.5
TOTAL RM billion 41.1 52.1 71.9 74.7
0
200
400
600
800
1,000
1,200
1,400
1,600
0
10
20
30
40
50
60
70
80
'90 '92 '94 '96 '98 '00 '02 '04 '06 '08 '10 '12 '14
Foreign Investment Domestic Investment Number of Projects (RHS)
No. of Projects
Source : Malaysian Investment Development Authority
20
CAPITAL INVESTMENT IN APPROVED MANUFACTURING SECTOR PROJECTS, 1990-2015
Investment (RM billion)
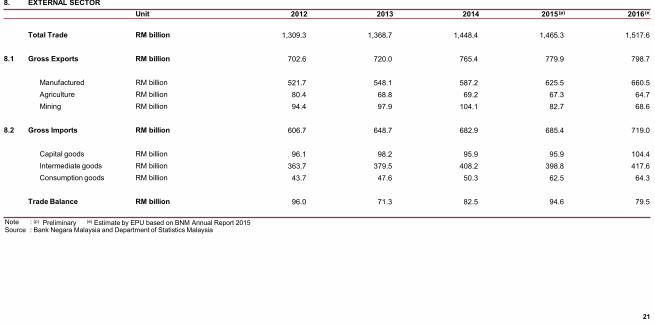
8. EXTERNAL SECTOR Unit 2012 2013 2014 2015 (p) 2016 (e)
Total Trade RM billion 1,309.3 1,368.7 1,448.4 1,465.3 1,517.6
8.1 Gross Exports RM billion 702.6 720.0 765.4 779.9 798.7
Manufactured RM billion 521.7 548.1 587.2 625.5 660.5 Agriculture RM billion 80.4 68.8 69.2 67.3 64.7 Mining RM billion 94.4 97.9 104.1 82.7 68.6
8.2 Gross Imports RM billion 606.7 648.7 682.9 685.4 719.0
Capital goods RM billion 96.1 98.2 95.9 95.9 104.4 Intermediate goods RM billion 363.7 379.5 408.2 398.8 417.6 Consumption goods RM billion 43.7 47.6 50.3 62.5 64.3
Trade Balance RM billion 96.0 71.3 82.5 94.6 79.5
Note : (p) Preliminary (e) Estimate by EPU based on BNM Annual Report 2015 Source : Bank Negara Malaysia and Department of Statistics Malaysia
21
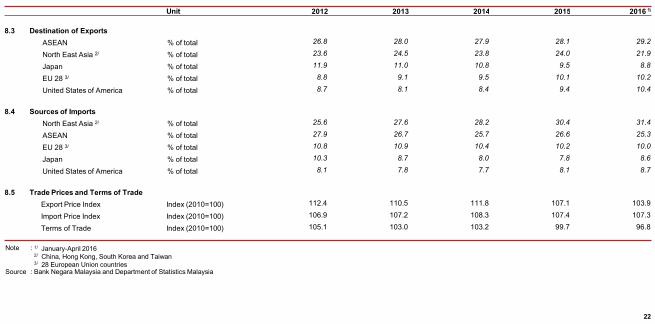
Unit 2012 2013 2014 2015 2016 1/
8.3 Destination of Exports ASEAN % of total 26.8 28.0 27.9 28.1 29.2
North East Asia 2/ % of total 23.6 24.5 23.8 24.0 21.9
Japan % of total 11.9 11.0 10.8 9.5 8.8
EU 28 3/ % of total 8.8 9.1 9.5 10.1 10.2
United States of America % of total 8.7 8.1 8.4 9.4 10.4
8.4 Sources of Imports North East Asia 2/ % of total 25.6 27.6 28.2 30.4 31.4
ASEAN % of total 27.9 26.7 25.7 26.6 25.3
EU 28 3/ % of total 10.8 10.9 10.4 10.2 10.0
Japan % of total 10.3 8.7 8.0 7.8 8.6
United States of America % of total 8.1 7.8 7.7 8.1 8.7
8.5 Trade Prices and Terms of Trade Export Price Index Index (2010=100) 112.4 110.5 111.8 107.1 103.9
Import Price Index Index (2010=100) 106.9 107.2 108.3 107.4 107.3
Terms of Trade Index (2010=100) 105.1 103.0 103.2 99.7 96.8
Note : 1/ January-April 2016 2/ China, Hong Kong, South Korea and Taiwan 3/ 28 European Union countries
Source : Bank Negara Malaysia and Department of Statistics Malaysia
22
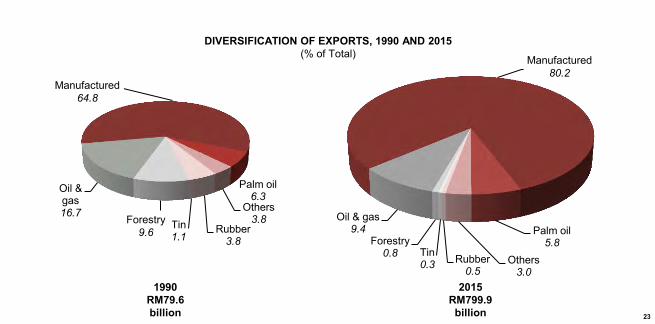
Manufactured
80.2
Palm oil 5.8
Others 3.0
Rubber 0.5
Tin 0.3
Forestry 0.8
Oil & gas 9.4
2015 RM799.9 billion 23
DIVERSIFICATION OF EXPORTS, 1990 AND 2015 (% of Total) Manufactured
80.2 Manufactured 58.7
Palm oil 6.3
Others 3.8
Rubber 3.8
Tin 1.1
Forestry
9.6
Oil & gas 16.7
Manufactured 64.8
1990 RM79.6 billion
Forestry 9.6
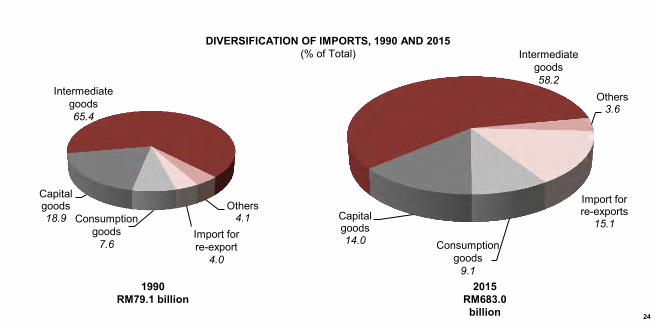
Intermediate goods
58.2 Others
3.6
Import for re-exports
15.1
Consumption goods
9.1
Capital goods 14.0
2015 RM683.0 billion 24
DIVERSIFICATION OF IMPORTS, 1990 AND 2015 (% of Total) Intermediate
goods 58.2
Consumption goods
9.1
Intermediate
goods 65.4
Others 4.1
Import for re-export
4.0
Consumption goods
7.6
Capital goods 18.9
1990 RM79.1 billion
Intermediate goods 65.4
Consumption goods
7.6 Import for re-export
4.0
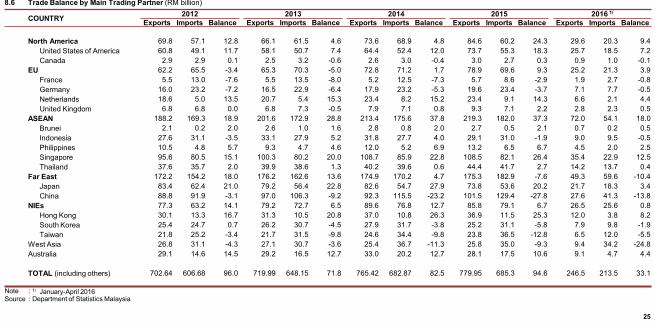
8.6 Trade Balance by Main Trading Partner (RM billion)
COUNTRY 2012 2013 2014 2015 2016 1/
Exports Imports Balance Exports Imports Balance Exports Imports Balance Exports Imports Balance Exports Imports Balance
North America 69.8 57.1 12.8 66.1 61.5 4.6 73.6 68.9 4.8 84.6 60.2 24.3 29.6 20.3 9.4 United States of America 60.8 49.1 11.7 58.1 50.7 7.4 64.4 52.4 12.0 73.7 55.3 18.3 25.7 18.5 7.2 Canada 2.9 2.9 0.1 2.5 3.2 -0.6 2.6 3.0 -0.4 3.0 2.7 0.3 0.9 1.0 -0.1
EU 62.2 65.5 -3.4 65.3 70.3 -5.0 72.8 71.2 1.7 78.9 69.6 9.3 25.2 21.3 3.9 France 5.5 13.0 -7.6 5.5 13.5 -8.0 5.2 12.5 -7.3 5.7 8.6 -2.9 1.9 2.7 -0.8 Germany 16.0 23.2 -7.2 16.5 22.9 -6.4 17.9 23.2 -5.3 19.6 23.4 -3.7 7.1 7.7 -0.5 Netherlands 18.6 5.0 13.5 20.7 5.4 15.3 23.4 8.2 15.2 23.4 9.1 14.3 6.6 2.1 4.4 United Kingdom 6.8 6.8 0.0 6.8 7.3 -0.5 7.9 7.1 0.8 9.3 7.1 2.2 2.8 2.3 0.5
ASEAN 188.2 169.3 18.9 201.6 172.9 28.8 213.4 175.6 37.8 219.3 182.0 37.3 72.0 54.1 18.0 Brunei 2.1 0.2 2.0 2.6 1.0 1.6 2.8 0.8 2.0 2.7 0.5 2.1 0.7 0.2 0.5 Indonesia 27.6 31.1 -3.5 33.1 27.9 5.2 31.8 27.7 4.0 29.1 31.0 -1.9 9.0 9.5 -0.5 Philippines 10.5 4.8 5.7 9.3 4.7 4.6 12.0 5.2 6.9 13.2 6.5 6.7 4.5 2.0 2.5 Singapore 95.6 80.5 15.1 100.3 80.2 20.0 108.7 85.9 22.8 108.5 82.1 26.4 35.4 22.9 12.5 Thailand 37.6 35.7 2.0 39.9 38.6 1.3 40.2 39.6 0.6 44.4 41.7 2.7 14.2 13.7 0.4
Far East 172.2 154.2 18.0 176.2 162.6 13.6 174.9 170.2 4.7 175.3 182.9 -7.6 49.3 59.6 -10.4 Japan 83.4 62.4 21.0 79.2 56.4 22.8 82.6 54.7 27.9 73.8 53.6 20.2 21.7 18.3 3.4 China 88.8 91.9 -3.1 97.0 106.3 -9.2 92.3 115.5 -23.2 101.5 129.4 -27.8 27.6 41.3 -13.8
NIEs 77.3 63.2 14.1 79.2 72.7 6.5 89.6 76.8 12.7 85.8 79.1 6.7 26.5 25.6 0.8 Hong Kong 30.1 13.3 16.7 31.3 10.5 20.8 37.0 10.8 26.3 36.9 11.5 25.3 12.0 3.8 8.2 South Korea 25.4 24.7 0.7 26.2 30.7 -4.5 27.9 31.7 -3.8 25.2 31.1 -5.8 7.9 9.8 -1.9 Taiwan 21.8 25.2 -3.4 21.7 31.5 -9.8 24.6 34.4 -9.8 23.8 36.5 -12.8 6.5 12.0 -5.5
West Asia 26.8 31.1 -4.3 27.1 30.7 -3.6 25.4 36.7 -11.3 25.8 35.0 -9.3 9.4 34.2 -24.8 Australia 29.1 14.6 14.5 29.2 16.5 12.7 33.0 20.2 12.7 28.1 17.5 10.6 9.1 4.7 4.4
TOTAL (including others) 702.64 606.68 96.0 719.99 648.15 71.8 765.42 682.87 82.5 779.95 685.3 94.6 246.5 213.5 33.1
Note : 1/ January-April 2016 Source : Department of Statistics Malaysia
25
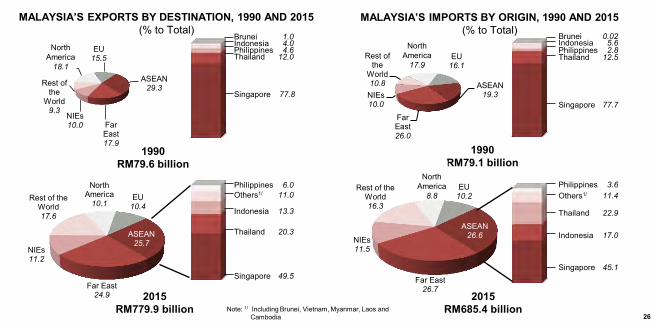
EU 10.2
ASEAN 26.6
Far East 26.7
NIEs 11.5
Rest of the World 16.3
MALAYSIA’S EXPORTS BY DESTINATION, 1990 AND 2015 (% to Total)
MALAYSIA’S IMPORTS BY ORIGIN, 1990 AND 2015 (% to Total)
EU 10.4
ASEAN 25.7
Far East 24.9
NIEs 11.2
Rest of the World 17.6
North America
10.1 Others1/ 11.0
Indonesia 13.3
Philippines 6.0
Thailand 20.3
Singapore 49.5
Note: 1/ Including Brunei, Vietnam, Myanmar, Laos and Cambodia
Thailand 22.9
Indonesia 17.0
Others1/ 11.4
Singapore 45.1
2015 RM685.4 billion
Philippines 3.6
26
2015 RM779.9 billion
EU 15.5
ASEAN 29.3
Far East 17.9
NIEs 10.0
Rest of the
World 9.3
North Americ
a 18.1
1990 RM79.6 billion
Brunei 1.0 Indonesia 4.0 Philippines 4.6 Thailand 12.0
Singapore 77.8
EU 16.1
ASEAN 19.3
Far East 26.0
NIEs 10.0
Rest of the
World 10.8
North Americ
a 17.9
Brunei 0.02 Indonesia 5.6 Philippines 2.8 Thailand 12.5
Singapore 77.7
1990 RM79.1 billion
North America
17.9
North America
18.1
North America
8.8
0
5
10
15
20
25
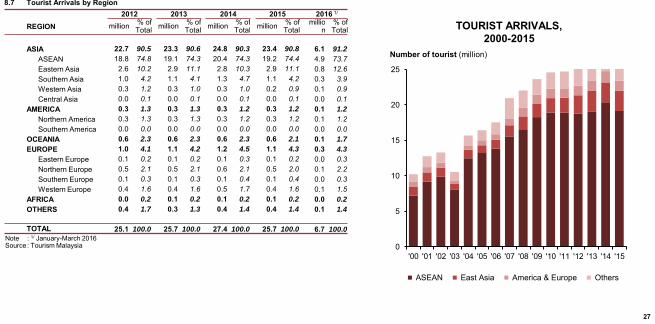
'00 '01 '02 '03 '04 '05 '06 '07 '08 '09 '10 '11 '12 '13 '14 '15
ASEAN East Asia America & Europe Others
8.7 Tourist Arrivals by Region 2012 2013 2014 2015 2016 1/
REGION million % of Total million % of
Total million % of Total million % of
Total millio
n % of Total
ASIA 22.7 90.5 23.3 90.6 24.8 90.3 23.4 90.8 6.1 91.2
ASEAN 18.8 74.8 19.1 74.3 20.4 74.3 19.2 74.4 4.9 73.7 Eastern Asia 2.6 10.2 2.9 11.1 2.8 10.3 2.9 11.1 0.8 12.6 Southern Asia 1.0 4.2 1.1 4.1 1.3 4.7 1.1 4.2 0.3 3.9 Western Asia 0.3 1.2 0.3 1.0 0.3 1.0 0.2 0.9 0.1 0.9 Central Asia 0.0 0.1 0.0 0.1 0.0 0.1 0.0 0.1 0.0 0.1
AMERICA 0.3 1.3 0.3 1.3 0.3 1.2 0.3 1.2 0.1 1.2
Northern America 0.3 1.3 0.3 1.3 0.3 1.2 0.3 1.2 0.1 1.2 Southern America 0.0 0.0 0.0 0.0 0.0 0.0 0.0 0.0 0.0 0.0
OCEANIA 0.6 2.3 0.6 2.3 0.6 2.3 0.6 2.1 0.1 1.7
EUROPE 1.0 4.1 1.1 4.2 1.2 4.5 1.1 4.3 0.3 4.3
Eastern Europe 0.1 0.2 0.1 0.2 0.1 0.3 0.1 0.2 0.0 0.3 Northern Europe 0.5 2.1 0.5 2.1 0.6 2.1 0.5 2.0 0.1 2.2 Southern Europe 0.1 0.3 0.1 0.3 0.1 0.4 0.1 0.4 0.0 0.3 Western Europe 0.4 1.6 0.4 1.6 0.5 1.7 0.4 1.6 0.1 1.5
AFRICA 0.0 0.2 0.1 0.2 0.1 0.2 0.1 0.2 0.0 0.2
OTHERS 0.4 1.7 0.3 1.3 0.4 1.4 0.4 1.4 0.1 1.4
TOTAL 25.1 100.0 25.7 100.0 27.4 100.0 25.7 100.0 6.7 100.0
Note : 1/ January-March 2016 Source : Tourism Malaysia
27
TOURIST ARRIVALS, 2000-2015
Number of tourist (million)
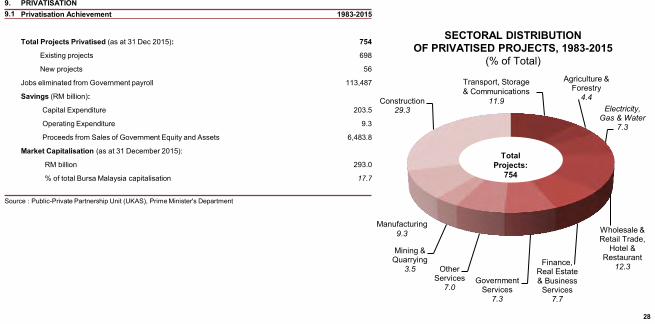
9. PRIVATISATION 9.1 Privatisation Achievement 1983-2015
Total Projects Privatised (as at 31 Dec 2015): 754
Existing projects 698
New projects 56
Jobs eliminated from Government payroll 113,487
Savings (RM billion):
Capital Expenditure 203.5
Operating Expenditure 9.3
Proceeds from Sales of Government Equity and Assets 6,483.8
Market Capitalisation (as at 31 December 2015):
RM billion 293.0
% of total Bursa Malaysia capitalisation 17.7
Source : Public-Private Partnership Unit (UKAS), Prime Minister's Department
Transport, Storage &
Comunications
11.9
Agriculture & Forestry
4.4 Electricity,
Gas & Water 7.3
Wholesale & Retail Trade,
Hotel & Restaurant
12.3 Finance, Real Estate & Business
Services 7.7
Government Services
7.3
Other Services
7.0
Mining & Quarrying
3.5
Manufacturing
9.3
Construction 29.3
Total Projects:
754
28
SECTORAL DISTRIBUTION OF PRIVATISED PROJECTS, 1983-2015
(% of Total)
Transport, Storage & Communications
11.9
Manufacturing 9.3
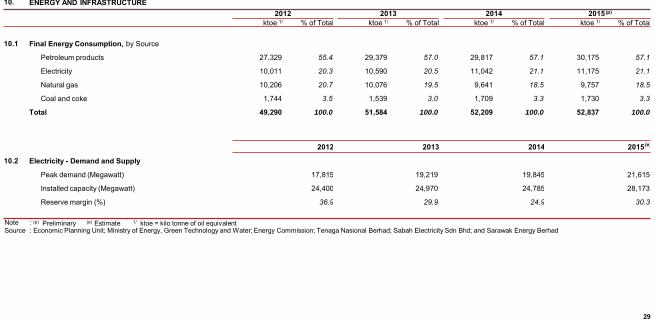
10. ENERGY AND INFRASTRUCTURE 2012 2013 2014 2015 (p)
ktoe 1/ % of Total ktoe 1/ % of Total ktoe 1/ % of Total ktoe 1/ % of Total
10.1 Final Energy Consumption, by Source
Petroleum products 27,329 55.4 29,379 57.0 29,817 57.1 30,175 57.1
Electricity 10,011 20.3 10,590 20.5 11,042 21.1 11,175 21.1
Natural gas 10,206 20.7 10,076 19.5 9,641 18.5 9,757 18.5
Coal and coke 1,744 3.5 1,539 3.0 1,709 3.3 1,730 3.3
Total 49,290 100.0 51,584 100.0 52,209 100.0 52,837 100.0
2012 2013 2014 2015 (e)
10.2 Electricity - Demand and Supply
Peak demand (Megawatt) 17,815 19,219 19,845 21,615
Installed capacity (Megawatt) 24,400 24,970 24,785 28,173
Reserve margin (%) 36.9 29.9 24.9 30.3
29
Note : (p) Preliminary (e) Estimate 1/ ktoe = kilo tonne of oil equivalent Source : Economic Planning Unit; Ministry of Energy, Green Technology and Water; Energy Commission; Tenaga Nasional Berhad; Sabah Electricity Sdn Bhd; and Sarawak Energy Berhad
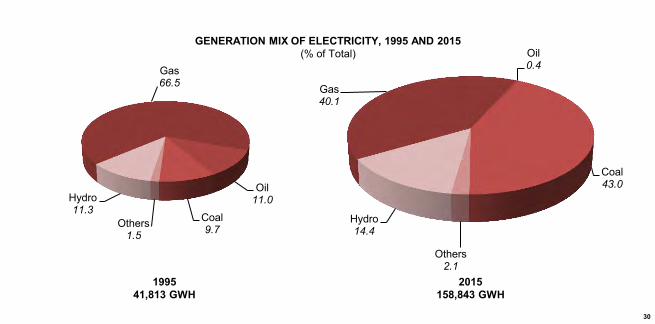
Gas 40.1
Oil 0.4
Coal 43.0
Others 2.1
Hydro 14.4
Gas 66.5
Oil 11.0
Coal 9.7 Others
1.5
Hydro 11.3
1995 41,813 GWH
2015 158,843 GWH
30
GENERATION MIX OF ELECTRICITY, 1995 AND 2015 (% of Total)
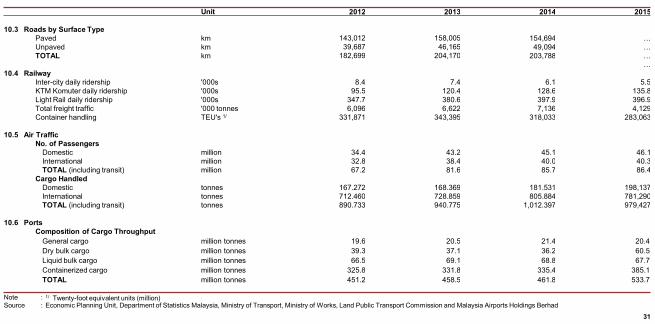
Unit 2012 2013 2014 2015
10.3 Roads by Surface Type Paved km 143,012 158,005 154,694 … Unpaved km 39,687 46,165 49,094 … TOTAL km 182,699 204,170 203,788 …
… 10.4 Railway
Inter-city daily ridership '000s 8.4 7.4 6.1 5.5 KTM Komuter daily ridership '000s 95.5 120.4 128.6 135.8 Light Rail daily ridership '000s 347.7 380.6 397.9 396.9 Total freight traffic '000 tonnes 6,096 6,622 7,136 4,129 Container handling TEU's 1/ 331,871 343,395 318,033 283,063
10.5 Air Traffic No. of Passengers
Domestic million 34.4 43.2 45.1 46.1 International million 32.8 38.4 40.0 40.3 TOTAL (including transit) million 67.2 81.6 85.7 86.4
Cargo Handled Domestic tonnes 167.272 168.369 181.531 198,137 International tonnes 712.460 728.859 805.884 781,290 TOTAL (including transit) tonnes 890.733 940.775 1,012.397 979,427
10.6 Ports Composition of Cargo Throughput
General cargo million tonnes 19.6 20.5 21.4 20.4 Dry bulk cargo million tonnes 39.3 37.1 36.2 60.5 Liquid bulk cargo million tonnes 66.5 69.1 68.8 67.7 Containerized cargo million tonnes 325.8 331.8 335.4 385.1 TOTAL million tonnes 451.2 458.5 461.8 533.7
31
Note : 1/ Twenty-foot equivalent units (million) Source : Economic Planning Unit, Department of Statistics Malaysia, Ministry of Transport, Ministry of Works, Land Public Transport Commission and Malaysia Airports Holdings Berhad
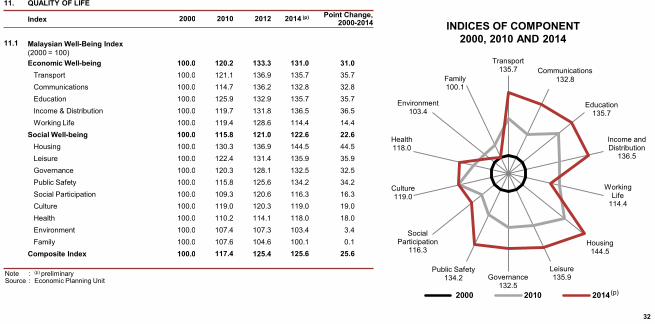
11. QUALITY OF LIFE
Index 2000 2010 2012 2014 (p) Point Change, 2000-2014
11.1 Malaysian Well-Being Index (2000 = 100) Economic Well-being 100.0 120.2 133.3 131.0 31.0 Transport 100.0 121.1 136.9 135.7 35.7 Communications 100.0 114.7 136.2 132.8 32.8 Education 100.0 125.9 132.9 135.7 35.7 Income & Distribution 100.0 119.7 131.8 136.5 36.5 Working Life 100.0 119.4 128.6 114.4 14.4 Social Well-being 100.0 115.8 121.0 122.6 22.6 Housing 100.0 130.3 136.9 144.5 44.5 Leisure 100.0 122.4 131.4 135.9 35.9 Governance 100.0 120.3 128.1 132.5 32.5 Public Safety 100.0 115.8 125.6 134.2 34.2 Social Participation 100.0 109.3 120.6 116.3 16.3 Culture 100.0 119.0 120.3 119.0 19.0 Health 100.0 110.2 114.1 118.0 18.0 Environment 100.0 107.4 107.3 103.4 3.4 Family 100.0 107.6 104.6 100.1 0.1 Composite Index 100.0 117.4 125.4 125.6 25.6
Note : (p) preliminary Source : Economic Planning Unit
32
Transport 135.7 Communication
s 132.8
Education 135.7
Income and Distribution
136.5
Working Life
114.4
Housing 144.5
Leisure 135.9 Governance
132.5
Public Safety 134.2
Social Participation
116.3
Culture 119.0
Health 118.0
Environment 103.4
Family 100.1
2000 2010 2014
Communications 132.8
INDICES OF COMPONENT 2000, 2010 AND 2014
(p)

11.2 Selected Social Indicators Unit 2012 2013 2014 2015
Working Life Trade disputes number 294 326 385 403 Working days lost number of days 0 0 0 0 Strike number 0 0 0 0 Number of workers involved in strike number 0 0 0 0 Industrial and commuting accidents number '000 61.6 63.6 63.3 62.9 (p)
Utilities/Facilities Private motorcars and motorcycles per 1,000 population 1,237.8 1,111.6 1,205.7 1,137.3 Telephone fixed lines per 1,000 population 134 125 118 113 Cellular phones per 1,000 population 1,425 1,438 1,483 1,438 Broadband subscribers 1/ per 1,000 household 660 671 702 718 Total road mileage km 182,699 204,170 203,788 … Total railway tracks km 2,681 2,681 2,685 2,771 (p)
Average daily newspaper circulation per 1,000 population 116.2 110.5 104.6 …
Health Population-doctor ratio persons 758 633 661 … Crude birth rate per 1,000 population 17.8 16.3 (p) 16.9 (e) … Crude death rate per 1,000 population 4.7 4.7 4.8 (p) 4.8 (e)
Infant mortality rate per 1,000 live births 6.2 6.3 6.2 (p) 6.2 (e)
Maternal mortality ratio per 100,000 live births 23.2 21.4 22.7 (p) … Life expectancy at birth years 74.4 74.6 (p) 74.7 (e) 74.8
Male years 72.2 72.4 (p) 72.5 (e) 72.5 Female years 76.9 77.1 (p) 77.2 (e) 77.4
Beds in hospitals 2/ number 38,978 39,728 40,260 …
Note : (p) Preliminary (e) Estimate 1/ Non-private household and public WiFi subscriptions are not taken into account 2/ Includes government hospitals and special medical institutions
Source : Economic Planning Unit, Department of Statistics Malaysia, Ministry of Works, Ministry of Health, Ministry of Transport, Industrial Relations Department, Malaysian Communications and Multimedia Commission, National Registration Department, Social Security Organisation and the World Bank World Development Indicator
33
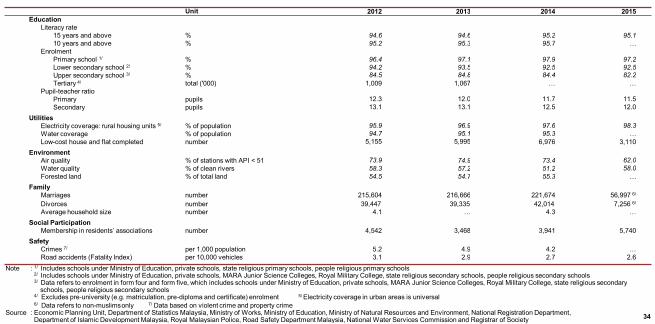
Unit 2012 2013 2014 2015
Education Literacy rate
15 years and above % 94.6 94.6 95.2 95.1 10 years and above % 95.2 95.3 95.7 …
Enrolment Primary school 1/ % 96.4 97.1 97.9 97.2 Lower secondary school 2/ % 94.2 93.5 92.5 92.5 Upper secondary school 3/ % 84.5 84.8 84.4 82.2 Tertiary 4/ total ('000) 1,009 1,067 … …
Pupil-teacher ratio Primary pupils 12.3 12.0 11.7 11.5 Secondary pupils 13.1 13.1 12.5 12.0
Utilities Electricity coverage: rural housing units 5/ % of population 95.9 96.9 97.6 98.3 Water coverage % of population 94.7 95.1 95.3 … Low-cost house and flat completed number 5,155 5,995 6,976 3,110
Environment Air quality % of stations with API < 51 73.9 74.9 73.4 62.0 Water quality % of clean rivers 58.3 57.2 51.2 58.0 Forested land % of total land 54.5 54.7 55.3 …
Family Marriages number 215,604 216,666 221,674 56,997 6/
Divorces number 39,447 39,335 42,014 7,256 6/ Average household size number 4.1 … 4.3 …
Social Participation Membership in residents’ associations number 4,542 3,468 3,941 5,740
Safety Crimes 7/ per 1,000 population 5.2 4.9 4.2 … Road accidents (Fatality Index) per 10,000 vehicles 3.1 2.9 2.7 2.6
Note : 1/ Includes schools under Ministry of Education, private schools, state religious primary schools, people religious primary schools 2/ Includes schools under Ministry of Education, private schools, MARA Junior Science Colleges, Royal Military College, state religious secondary schools, people religious secondary schools 3/ Data refers to enrolment in form four and form five, which includes schools under Ministry of Education, private schools, MARA Junior Science Colleges, Royal Military College, state religious secondary
schools, people religious secondary schools 4/ Excludes pre-university (e.g. matriculation, pre-diploma and certificate) enrolment 5/ Electricity coverage in urban areas is universal 6/ Data refers to non-muslims only 7/ Data based on violent crime and property crime
Source : Economic Planning Unit, Department of Statistics Malaysia, Ministry of Works, Ministry of Education, Ministry of Natural Resources and Environment, National Registration Department, Department of Islamic Development Malaysia, Royal Malaysian Police, Road Safety Department Malaysia, National Water Services Commission and Registrar of Society 34

11.3 Poverty 1/
Unit 2007 2009 2012 2014
Incidence of poverty Overall % of households 3.6 3.8 1.7 0.6 Rural % of households 7.1 8.4 3.4 1.6 Urban % of households 2.0 1.7 1.0 0.3
Incidence of hardcore poverty Overall % of households 0.7 0.7 0.2 0.1 Rural % of households 1.4 1.8 0.6 0.2 Urban % of households 0.3 0.2 0.1 0.0
11.4 Female-Related Information
Unit 2012 2013 2014 2015
Female population % of population 48.6 48.6 48.7 48.4 Female labour force % of labour force 36.4 37.8 38.4 38.3 4/ Total female employed % 36.4 37.6 38.3 38.2 4/ Female unemployment rate % 3.2 3.6 3.3 3.4 4/ Female labour force participation rate % 49.5 52.4 53.6 54.1 4/ Female primary school enrolment % 48.6 48.5 48.6 48.6 Female secondary school enrolment 2/ % 49.8 49.8 49.9 50.0 Female university enrolment % 61.0 61.0 61.4 62.0 Female members in Parliament 3/ % of total members 13.6 13.9 13.6 13.2
Note : 1/ Based on the Household Income Survey, which is conducted twice every 5 years 2/ Excludes Form Six enrolment in secondary schools 3/ Includes the Senate 4/ Updated based on population estimates 2015
Source : Economic Planning Unit; Department of Statistics Malaysia; Ministry of Women, Family and Community Development; Ministry of Education; and Ministry of Higher Education
35
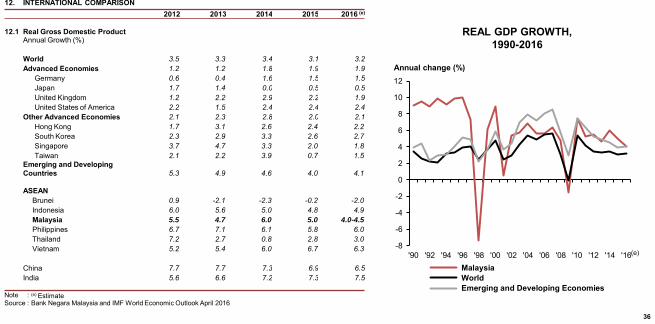
12. INTERNATIONAL COMPARISON 2012 2013 2014 2015 2016 (e)
12.1 Real Gross Domestic Product Annual Growth (%)
World 3.5 3.3 3.4 3.1 3.2 Advanced Economies 1.2 1.2 1.8 1.9 1.9
Germany 0.6 0.4 1.6 1.5 1.5 Japan 1.7 1.4 0.0 0.5 0.5 United Kingdom 1.2 2.2 2.9 2.2 1.9 United States of America 2.2 1.5 2.4 2.4 2.4
Other Advanced Economies 2.1 2.3 2.8 2.0 2.1 Hong Kong 1.7 3.1 2.6 2.4 2.2 South Korea 2.3 2.9 3.3 2.6 2.7 Singapore 3.7 4.7 3.3 2.0 1.8 Taiwan 2.1 2.2 3.9 0.7 1.5
Emerging and Developing Countries 5.3 4.9 4.6 4.0 4.1
ASEAN Brunei 0.9 -2.1 -2.3 -0.2 -2.0 Indonesia 6.0 5.6 5.0 4.8 4.9 Malaysia 5.5 4.7 6.0 5.0 4.0-4.5
Philippines 6.7 7.1 6.1 5.8 6.0 Thailand 7.2 2.7 0.8 2.8 3.0 Vietnam 5.2 5.4 6.0 6.7 6.3
China 7.7 7.7 7.3 6.9 6.5 India 5.6 6.6 7.2 7.3 7.5
Note : (e) Estimate Source : Bank Negara Malaysia and IMF World Economic Outlook April 2016
REAL GDP GROWTH, 1990-2016
Annual change (%)
36
(e) -8
-6
-4
-2
0
2
4
6
8
10
12
'90 '92 '94 '96 '98 '00 '02 '04 '06 '08 '10 '12 '14 '16 Malaysia World Emerging and Developing Economies
Annual change (%)
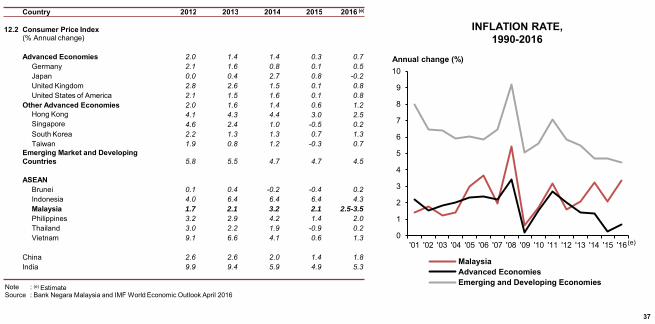
Country 2012 2013 2014 2015 2016 (e)
12.2 Consumer Price Index (% Annual change)
Advanced Economies 2.0 1.4 1.4 0.3 0.7 Germany 2.1 1.6 0.8 0.1 0.5 Japan 0.0 0.4 2.7 0.8 -0.2 United Kingdom 2.8 2.6 1.5 0.1 0.8 United States of America 2.1 1.5 1.6 0.1 0.8
Other Advanced Economies 2.0 1.6 1.4 0.6 1.2 Hong Kong 4.1 4.3 4.4 3.0 2.5 Singapore 4.6 2.4 1.0 -0.5 0.2 South Korea 2.2 1.3 1.3 0.7 1.3 Taiwan 1.9 0.8 1.2 -0.3 0.7
Emerging Market and Developing Countries 5.8 5.5 4.7 4.7 4.5
ASEAN Brunei 0.1 0.4 -0.2 -0.4 0.2 Indonesia 4.0 6.4 6.4 6.4 4.3 Malaysia 1.7 2.1 3.2 2.1 2.5-3.5
Philippines 3.2 2.9 4.2 1.4 2.0 Thailand 3.0 2.2 1.9 -0.9 0.2 Vietnam 9.1 6.6 4.1 0.6 1.3
China 2.6 2.6 2.0 1.4 1.8 India 9.9 9.4 5.9 4.9 5.3
37
0
1
2
3
4
5
6
7
8
9
10
'01 '02 '03 '04 '05 '06 '07 '08 '09 '10 '11 '12 '13 '14 '15 '16
MalaysiaAdvanced EconomiesEmerging and Developing EconomiesNote : (e) Estimate
Source : Bank Negara Malaysia and IMF World Economic Outlook April 2016
INFLATION RATE, 1990-2016
(e)
Country Year GDP Value-Added of GDP (%) (US$ billion) Agriculture Industry 1/ Services
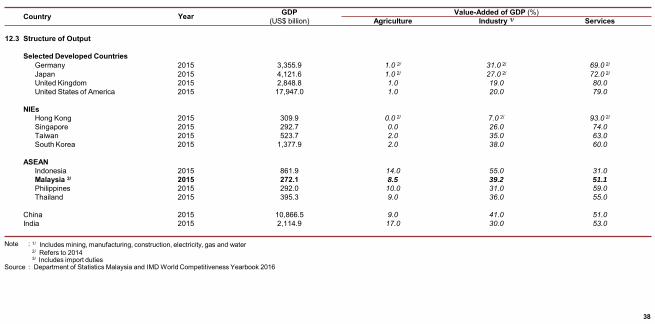
12.3 Structure of Output
Selected Developed Countries Germany 2015 3,355.9 1.0 2/ 31.0 2/ 69.0 2/ Japan 2015 4,121.6 1.0 2/ 27.0 2/ 72.0 2/ United Kingdom 2015 2,848.8 1.0 19.0 80.0 United States of America 2015 17,947.0 1.0 20.0 79.0
NIEs
Hong Kong 2015 309.9 0.0 2/ 7.0 2/ 93.0 2/ Singapore 2015 292.7 0.0 26.0 74.0 Taiwan 2015 523.7 2.0 35.0 63.0 South Korea 2015 1,377.9 2.0 38.0 60.0
ASEAN
Indonesia 2015 861.9 14.0 55.0 31.0 Malaysia 3/ 2015 272.1 8.5 39.2 51.1
Philippines 2015 292.0 10.0 31.0 59.0 Thailand 2015 395.3 9.0 36.0 55.0
China 2015 10,866.5 9.0 41.0 51.0 India 2015 2,114.9 17.0 30.0 53.0
Note : 1/ Includes mining, manufacturing, construction, electricity, gas and water 2/ Refers to 2014 3/ Includes import duties
Source : Department of Statistics Malaysia and IMD World Competitiveness Yearbook 2016
38

Country Year Share of GDP (%)
Household Consumption Expenditure
Government Consumption Expenditure
Gross Fixed Capital Formation
Exports of Goods
12.4 Structure of Demand
Selected Developed Countries Germany 2015 54.0 19.4 20.0 39.6 Japan 2015 58.6 20.4 21.7 15.2 United Kingdom 2015 64.9 19.4 17.3 16.2 United States of America 2015 68.4 14.3 19.6 8.39
NIEs Hong Kong 2015 66.2 9.6 22.6 164.8 Singapore 2015 36.7 10.4 25.5 119.7 Taiwan 2015 52.2 13.9 20.8 54.5 South Korea 2015 49.5 15.2 29.1 38.2
ASEAN Indonesia 2015 55.9 9.8 33.2 17.4 Malaysia 2015 54.1 13.1 26.2 70.9
Philippines 2015 73.7 11.0 21.7 20.1 Thailand 2015 51.5 17.2 24.9 54.2
China 2015 38.2 1/ 13.9 1/ 44.3 1/ 20.9 India 2015 59.8 10.7 29.5 12.6
39
Note : 1/ Refers to 2014
Source : Department of Statistics Malaysia and IMD World Competitiveness Yearbook 2016
2012 2013 2014 2015 2016 (e) 2012 2013 2014 2015 2016 (e)
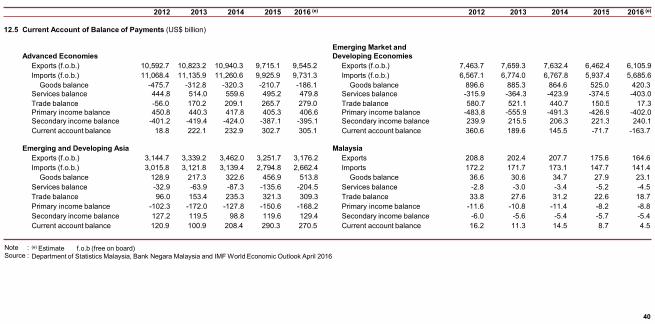
12.5 Current Account of Balance of Payments (US$ billion)
Advanced Economies Emerging Market and Developing Economies
Exports (f.o.b.) 10,592.7 10,823.2 10,940.3 9,715.1 9,545.2 Exports (f.o.b.) 7,463.7 7,659.3 7,632.4 6,462.4 6,105.9 Imports (f.o.b.) 11,068.4 11,135.9 11,260.6 9,925.9 9,731.3 Imports (f.o.b.) 6,567.1 6,774.0 6,767.8 5,937.4 5,685.6 Goods balance -475.7 -312.8 -320.3 -210.7 -186.1 Goods balance 896.6 885.3 864.6 525.0 420.3 Services balance 444.8 514.0 559.6 495.2 479.8 Services balance -315.9 -364.3 -423.9 -374.5 -403.0 Trade balance -56.0 170.2 209.1 265.7 279.0 Trade balance 580.7 521.1 440.7 150.5 17.3 Primary income balance 450.8 440.3 417.8 405.3 406.6 Primary income balance -483.8 -555.9 -491.3 -426.9 -402.0 Secondary income balance -401.2 -419.4 -424.0 -387.1 -395.1 Secondary income balance 239.9 215.5 206.3 221.3 240.1 Current account balance 18.8 222.1 232.9 302.7 305.1 Current account balance 360.6 189.6 145.5 -71.7 -163.7
Emerging and Developing Asia Malaysia Exports (f.o.b.) 3,144.7 3,339.2 3,462.0 3,251.7 3,176.2 Exports 208.8 202.4 207.7 175.6 164.6 Imports (f.o.b.) 3,015.8 3,121.8 3,139.4 2,794.8 2,662.4 Imports 172.2 171.7 173.1 147.7 141.4 Goods balance 128.9 217.3 322.6 456.9 513.8 Goods balance 36.6 30.6 34.7 27.9 23.1 Services balance -32.9 -63.9 -87.3 -135.6 -204.5 Services balance -2.8 -3.0 -3.4 -5.2 -4.5 Trade balance 96.0 153.4 235.3 321.3 309.3 Trade balance 33.8 27.6 31.2 22.6 18.7 Primary income balance -102.3 -172.0 -127.8 -150.6 -168.2 Primary income balance -11.6 -10.8 -11.4 -8.2 -8.8 Secondary income balance 127.2 119.5 98.8 119.6 129.4 Secondary income balance -6.0 -5.6 -5.4 -5.7 -5.4 Current account balance 120.9 100.9 208.4 290.3 270.5 Current account balance 16.2 11.3 14.5 8.7 4.5
40
Note : (e) Estimate f.o.b (free on board) Source : Department of Statistics Malaysia, Bank Negara Malaysia and IMF World Economic Outlook April 2016
2012 2013 2014 2015 2016 (e)
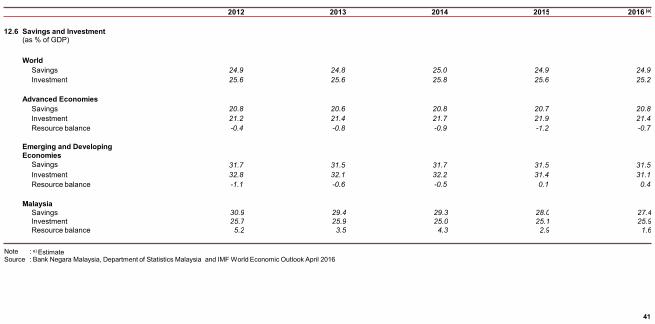
12.6 Savings and Investment
(as % of GDP)
World Savings 24.9 24.8 25.0 24.9 24.9 Investment 25.6 25.6 25.8 25.6 25.2
Advanced Economies Savings 20.8 20.6 20.8 20.7 20.8 Investment 21.2 21.4 21.7 21.9 21.4 Resource balance -0.4 -0.8 -0.9 -1.2 -0.7
Emerging and Developing Economies
Savings 31.7 31.5 31.7 31.5 31.5 Investment 32.8 32.1 32.2 31.4 31.1 Resource balance -1.1 -0.6 -0.5 0.1 0.4
Malaysia Savings 30.9 29.4 29.3 28.0 27.4 Investment 25.7 25.9 25.0 25.1 25.9 Resource balance 5.2 3.5 4.3 2.9 1.6
Note : e) Estimate Source : Bank Negara Malaysia, Department of Statistics Malaysia and IMF World Economic Outlook April 2016
41
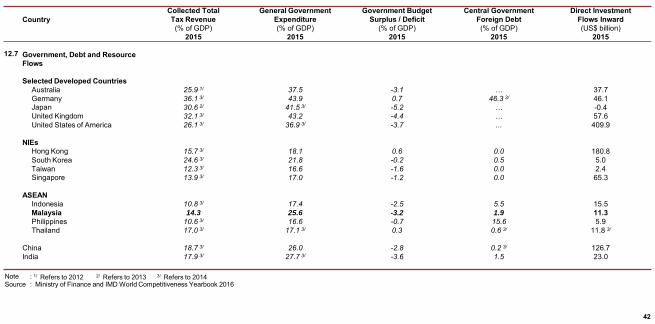
Country Collected Total Tax Revenue (% of GDP)
General Government Expenditure (% of GDP)
Government Budget Surplus / Deficit
(% of GDP)
Central Government Foreign Debt (% of GDP)
Direct Investment Flows Inward (US$ billion)
2015 2015 2015 2015 2015
12.7 Government, Debt and Resource Flows
Selected Developed Countries
Australia 25.9 1/ 37.5 -3.1 … 37.7 Germany 36.1 3/ 43.9 0.7 46.3 3/ 46.1 Japan 30.6 2/ 41.5 3/ -5.2 … -0.4 United Kingdom 32.1 3/ 43.2 -4.4 … 57.6 United States of America 26.1 3/ 36.9 3/ -3.7 ... 409.9
NIEs Hong Kong 15.7 3/ 18.1 0.6 0.0 180.8 South Korea 24.6 3/ 21.8 -0.2 0.5 5.0 Taiwan 12.3 3/ 16.6 -1.6 0.0 2.4 Singapore 13.9 3/ 17.0 -1.2 0.0 65.3
ASEAN Indonesia 10.8 3/ 17.4 -2.5 5.5 15.5 Malaysia 14.3 25.6 -3.2 1.9 11.3 Philippines 10.6 3/ 16.6 -0.7 15.6 5.9 Thailand 17.0 3/ 17.1 3/ 0.3 0.6 3/ 11.8 3/
China 18.7 3/ 26.0 -2.8 0.2 3/ 126.7 India 17.9 3/ 27.7 3/ -3.6 1.5 23.0
Note : 1/ Refers to 2012 2/ Refers to 2013 3/ Refers to 2014 Source : Ministry of Finance and IMD World Competitiveness Yearbook 2016
42
Country Surface Area ('000 km²)
Population (million)
Population Density (per km²)
Urban Population (% of Total Population)
Population Under 15 years (% of Total Population)
2015 2015 2013 2015 2015
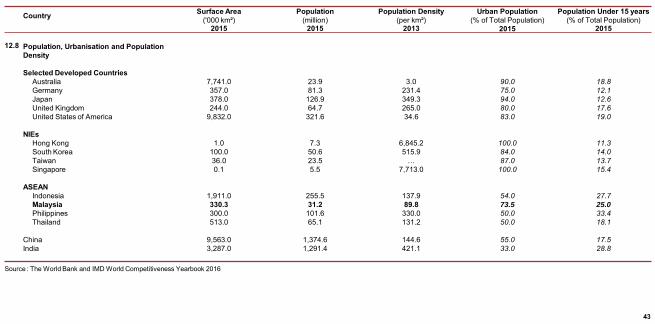
12.8 Population, Urbanisation and Population Density
Selected Developed Countries Australia 7,741.0 23.9 3.0 90.0 18.8 Germany 357.0 81.3 231.4 75.0 12.1 Japan 378.0 126.9 349.3 94.0 12.6 United Kingdom 244.0 64.7 265.0 80.0 17.6 United States of America 9,832.0 321.6 34.6 83.0 19.0
NIEs Hong Kong 1.0 7.3 6,845.2 100.0 11.3 South Korea 100.0 50.6 515.9 84.0 14.0 Taiwan 36.0 23.5 … 87.0 13.7 Singapore 0.1 5.5 7,713.0 100.0 15.4
ASEAN Indonesia 1,911.0 255.5 137.9 54.0 27.7 Malaysia 330.3 31.2 89.8 73.5 25.0
Philippines 300.0 101.6 330.0 50.0 33.4 Thailand 513.0 65.1 131.2 50.0 18.1
China 9,563.0 1,374.6 144.6 55.0 17.5 India 3,287.0 1,291.4 421.1 33.0 28.8
Source : The World Bank and IMD World Competitiveness Yearbook 2016
43

Country Total Employment
(million) Employment by Sector (% of Total Employment)
Agriculture Industry 1/ Services 2015 2015 2015 2015
12.9 Structure of Employment
Selected Developed Countries Australia 11.9 2.7 19.0 78.4 Germany 43.0 1.4 27.7 70.9 Japan 63.8 3.6 24.6 71.8 United Kingdom 31.1 1.1 18.6 80.3 United States of America 148.8 1.6 17.6 80.8
NIEs Hong Kong 3.8 0.1 11.5 88.3 South Korea 25.9 5.2 24.7 70.1 Taiwan 11.2 5.0 36.0 59.0 Singapore 3.7 0.0 28.5 71.5
ASEAN Indonesia 114.8 32.9 21.8 45.3 Malaysia 13.8 11.7 28.2 60.1
Philippines 38.7 29.1 16.2 54.7 Thailand 38.0 32.3 23.7 44.0
China 774.5 29.5 2/ 29.9 2/ 40.6 2/ India 508.5 2/ 48.9 2/ 24.3 2/ 26.8 2/
Note : 1/ Includes mining, manufacturing, construction, electricity, gas and water 2/ Refers to 2014
Source : Department of Statistics Malaysia and IMD World Competitiveness Yearbook 2016
44
Country
Life Expectancy at Birth (Years)
Infant Mortality (Per 1,000 live births)
Crude Birth Rate
(Per 1,000 population)
Dependency Ratio (Population Age <15
and > 65 years)
Adult Literacy Rate (% Age 15 years and
above)
Pupil-Teacher Ratio in Education
(Primary Education) 2014 2015 2014 2015 2015 2013
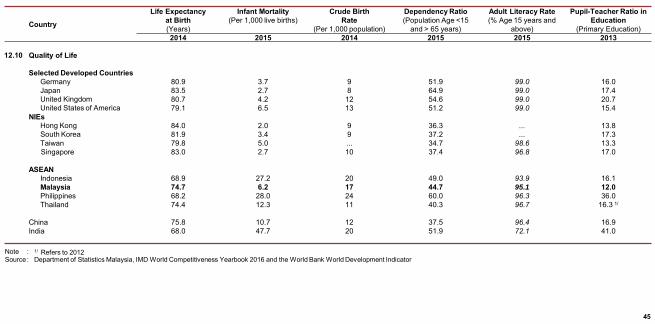
12.10 Quality of Life
Selected Developed Countries Germany 80.9 3.7 9 51.9 99.0 16.0 Japan 83.5 2.7 8 64.9 99.0 17.4 United Kingdom 80.7 4.2 12 54.6 99.0 20.7 United States of America 79.1 6.5 13 51.2 99.0 15.4
NIEs Hong Kong 84.0 2.0 9 36.3 ... 13.8 South Korea 81.9 3.4 9 37.2 ... 17.3 Taiwan 79.8 5.0 ... 34.7 98.6 13.3 Singapore 83.0 2.7 10 37.4 96.8 17.0
ASEAN Indonesia 68.9 27.2 20 49.0 93.9 16.1 Malaysia 74.7 6.2 17 44.7 95.1 12.0 Philippines 68.2 28.0 24 60.0 96.3 36.0 Thailand 74.4 12.3 11 40.3 96.7 16.3 1/
China 75.8 10.7 12 37.5 96.4 16.9 India 68.0 47.7 20 51.9 72.1 41.0
Note : 1/ Refers to 2012 Source : Department of Statistics Malaysia, IMD World Competitiveness Yearbook 2016 and the World Bank World Development Indicator
45
2011 2012 2013 2014
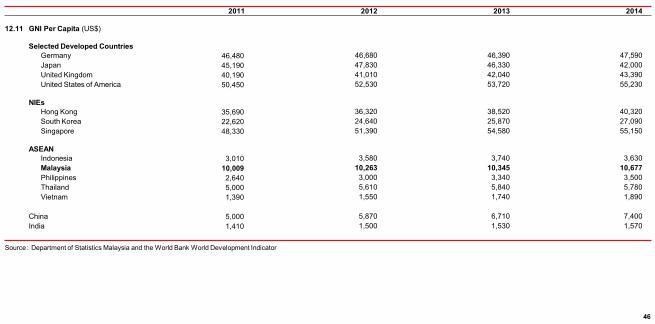
12.11 GNI Per Capita (US$)
Selected Developed Countries Germany 46,480 46,680 46,390 47,590 Japan 45,190 47,830 46,330 42,000 United Kingdom 40,190 41,010 42,040 43,390 United States of America 50,450 52,530 53,720 55,230
NIEs Hong Kong 35,690 36,320 38,520 40,320 South Korea 22,620 24,640 25,870 27,090 Singapore 48,330 51,390 54,580 55,150
ASEAN Indonesia 3,010 3,580 3,740 3,630 Malaysia 10,009 10,263 10,345 10,677 Philippines 2,640 3,000 3,340 3,500 Thailand 5,000 5,610 5,840 5,780 Vietnam 1,390 1,550 1,740 1,890
China 5,000 5,870 6,710 7,400 India 1,410 1,500 1,530 1,570
Source : Department of Statistics Malaysia and the World Bank World Development Indicator
46
Country
Internet Users (No. of
internet users per 1,000 people)
Computers Per Capita
(No. of computers per 1,000 people)
Mobile Broadband Subscribers
(3G & 4G market, % of mobile market)
Information Technology
Skills 1/
(Score)
Broadband Subscribers
(Per 1,000 inhabitants)
Cyber Security1/
(Score)
Investment in Telecommuni-
cations (Capital
Expenditure Aggregate Annual
Spending)
Internet Bandwidth
Speed (Average speed)
Mobile Telephone Costs
(Monthly Blended Average Revenue
per user)
Fixed Broadband
Tariffs (Residential),
(Per month (US$))
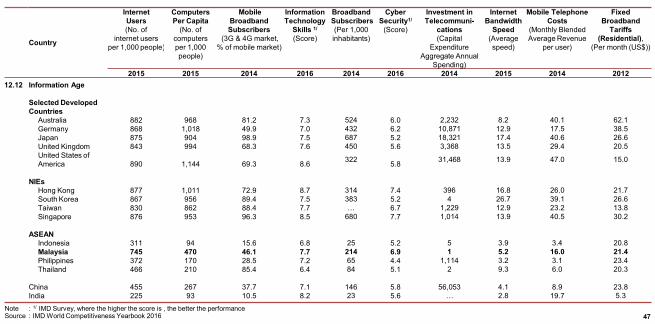
2015 2015 2014 2016 2014 2016 2014 2015 2014 2012 12.12 Information Age
Selected Developed Countries
Australia 882 968 81.2 7.3 524 6.0 2,232 8.2 40.1 62.1 Germany 868 1,018 49.9 7.0 432 6.2 10,871 12.9 17.5 38.5 Japan 875 904 98.9 7.5 687 5.2 18,321 17.4 40.6 26.6 United Kingdom 843 994 68.3 7.6 450 5.6 3,368 13.5 29.4 20.5 United States of America 890 1,144 69.3 8.6 322 5.8 31,468 13.9 47.0 15.0
NIEs
Hong Kong 877 1,011 72.9 8.7 314 7.4 396 16.8 26.0 21.7 South Korea 867 956 89.4 7.5 383 5.2 4 26.7 39.1 26.6 Taiwan 830 862 88.4 7.7 … 6.7 1,229 12.9 23.2 13.8 Singapore 876 953 96.3 8.5 680 7.7 1,014 13.9 40.5 30.2
ASEAN
Indonesia 311 94 15.6 6.8 25 5.2 5 3.9 3.4 20.8 Malaysia 745 470 46.1 7.7 214 6.9 1 5.2 16.0 21.4 Philippines 372 170 28.5 7.2 65 4.4 1,114 3.2 3.1 23.4 Thailand 466 210 85.4 6.4 84 5.1 2 9.3 6.0 20.3
China 455 267 37.7 7.1 146 5.8 56,053 4.1 8.9 23.8 India 225 93 10.5 8.2 23 5.6 … 2.8 19.7 5.3
Note : 1/ IMD Survey, where the higher the score is , the better the performance Source : IMD World Competitiveness Yearbook 2016 47
Country
Development and Application of Technology
(Score)
Funding for Technological Development
(Score)
Total Expenditure on R&D
(% of GDP)
Business Expenditure on R&D
(% of GDP)
High-Technology Exports
(US$ million)
High-Technology Exports
(% of Manufactured Exports)
Intellectual Property Rights Enforced
(Score)
2016 1/ 2016 1/ 2014 2014 2014 2014 20161/
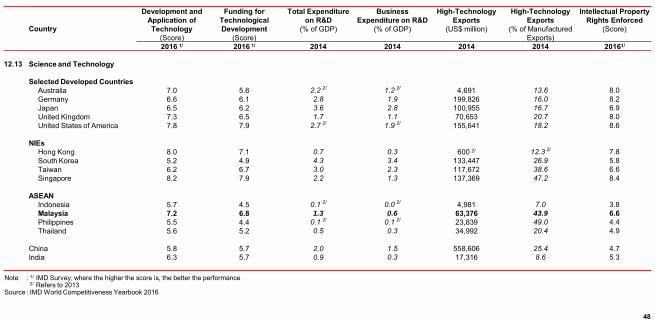
12.13 Science and Technology
Selected Developed Countries Australia 7.0 5.6 2.2 2/ 1.2 2/ 4,691 13.6 8.0 Germany 6.6 6.1 2.8 1.9 199,826 16.0 8.2 Japan 6.5 6.2 3.6 2.8 100,955 16.7 6.9 United Kingdom 7.3 6.5 1.7 1.1 70,653 20.7 8.0 United States of America 7.8 7.9 2.7 2/ 1.9 2/ 155,641 18.2 8.6
NIEs Hong Kong 8.0 7.1 0.7 0.3 600 2/ 12.3 2/ 7.8 South Korea 5.2 4.9 4.3 3.4 133,447 26.9 5.8 Taiwan 6.2 6.7 3.0 2.3 117,672 38.6 6.6 Singapore 8.2 7.9 2.2 1.3 137,369 47.2 8.4
ASEAN Indonesia 5.7 4.5 0.1 2/ 0.0 2/ 4,981 7.0 3.8 Malaysia 7.2 6.8 1.3 0.6 63,376 43.9 6.6 Philippines 5.5 4.4 0.1 2/ 0.1 2/ 23,839 49.0 4.4 Thailand 5.6 5.2 0.5 0.3 34,992 20.4 4.9
China 5.8 5.7 2.0 1.5 558,606 25.4 4.7 India 6.3 5.7 0.9 0.3 17,316 8.6 5.3
Note : 1/ IMD Survey, where the higher the score is, the better the performance 2/ Refers to 2013
Source : IMD World Competitiveness Yearbook 2016
48
Country/Rank Economic
Performance Government
Efficiency Business Efficiency
Basic Infrastructure OVERALL
20151/ 20162/ 20151/ 20162/ 20151/ 20162/ 20151/ 20162/ 20151/ 20162/
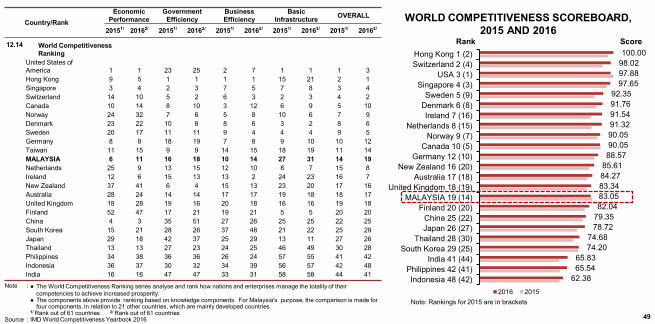
12.14 World Competitiveness Ranking
United States of America 1 1 23 25 2 7 1 1 1 3 Hong Kong 9 5 1 1 1 1 15 21 2 1 Singapore 3 4 2 3 7 5 7 8 3 4 Switzerland 14 10 5 2 6 3 2 3 4 2 Canada 10 14 8 10 3 12 6 9 5 10 Norway 24 32 7 6 5 8 10 6 7 9 Denmark 23 22 10 8 8 6 3 2 8 6 Sweden 20 17 11 11 9 4 4 4 9 5 Germany 8 8 18 19 7 8 9 10 10 12 Taiwan 11 15 9 9 14 15 18 19 11 14 MALAYSIA 6 11 16 18 10 14 27 31 14 19 Netherlands 25 9 13 15 12 10 8 7 15 8 Ireland 12 6 15 13 13 2 24 23 16 7 New Zealand 37 41 6 4 15 13 23 20 17 16 Australia 28 24 14 14 17 17 19 18 18 17 United Kingdom 18 28 19 16 20 18 16 16 19 18 Finland 52 47 17 21 19 21 5 5 20 20 China 4 3 35 51 27 26 25 25 22 25 South Korea 15 21 28 26 37 48 21 22 25 29 Japan 29 18 42 37 25 29 13 11 27 26 Thailand 13 13 27 23 24 25 46 49 30 28 Philippines 34 38 36 36 26 24 57 55 41 42 Indonesia 36 37 30 32 34 39 56 57 42 48 India 16 16 47 47 33 31 58 58 44 41
Note : ● The World Competitiveness Ranking series analyse and rank how nations and enterprises manage the totality of their competencies to achieve increased prosperity.
● The components above provide ranking based on knowledge components. For Malaysia's purpose, the comparison is made for four components, in relation to 21 other countries, which are mainly developed countries.
1/ Rank out of 61 countries 2/ Rank out of 61 countries
Source : IMD World Competitiveness Yearbook 2016
62.38 65.54 65.83
74.20 74.68
78.72 79.35 82.04 83.05 83.34 84.27 85.61 88.57 90.05 90.05 91.32 91.54 91.76 92.35
97.65 97.88 98.02 100.00
Indonesia 48 (42)Philippines 42 (41)
India 41 (44)South Korea 29 (25)
Thailand 28 (30)Japan 26 (27)China 25 (22)
Finland 20 (20)MALAYSIA 19 (14)
United Kingdom 18 (19)Australia 17 (18)
New Zealand 16 (20)Germany 12 (10)
Canada 10 (5)Norway 9 (7)
Netherlands 8 (15)Ireland 7 (16)
Denmark 6 (8)Sweden 5 (9)
Singapore 4 (3)USA 3 (1)
Switzerland 2 (4)Hong Kong 1 (2)
2016 2015
WORLD COMPETITIVENESS SCOREBOARD, 2015 AND 2016
Note: Rankings for 2015 are in brackets
49
Rank Score
2011 2012 2013 2014 2015
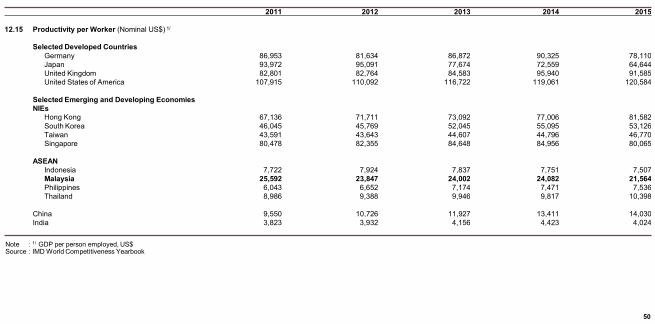
12.15 Productivity per Worker (Nominal US$) 1/
Selected Developed Countries Germany 86,953 81,634 86,872 90,325 78,110 Japan 93,972 95,091 77,674 72,559 64,644 United Kingdom 82,801 82,764 84,583 95,940 91,585 United States of America 107,915 110,092 116,722 119,061 120,584
Selected Emerging and Developing Economies NIEs
Hong Kong 67,136 71,711 73,092 77,006 81,582 South Korea 46,045 45,769 52,045 55,095 53,126 Taiwan 43,591 43,643 44,607 44,796 46,770 Singapore 80,478 82,355 84,648 84,956 80,065
ASEAN Indonesia 7,722 7,924 7,837 7,751 7,507 Malaysia 25,592 23,847 24,002 24,082 21,564 Philippines 6,043 6,652 7,174 7,471 7,536 Thailand 8,986 9,388 9,946 9,817 10,398
China 9,550 10,726 11,927 13,411 14,030 India 3,823 3,932 4,156 4,423 4,024
Note : 1/ GDP per person employed, US$ Source : IMD World Competitiveness Yearbook
50
2011 2012 2013 2014 2015 2/
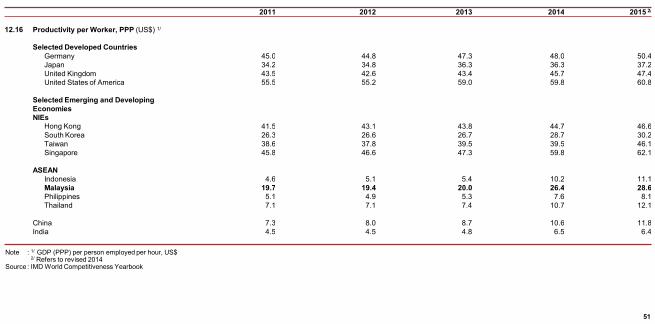
12.16 Productivity per Worker, PPP (US$) 1/
Selected Developed Countries Germany 45.0 44.8 47.3 48.0 50.4 Japan 34.2 34.8 36.3 36.3 37.2 United Kingdom 43.5 42.6 43.4 45.7 47.4 United States of America 55.5 55.2 59.0 59.8 60.8
Selected Emerging and Developing Economies NIEs
Hong Kong 41.5 43.1 43.8 44.7 46.6 South Korea 26.3 26.6 26.7 28.7 30.2 Taiwan 38.6 37.8 39.5 39.5 46.1 Singapore 45.8 46.6 47.3 59.8 62.1
ASEAN Indonesia 4.6 5.1 5.4 10.2 11.1 Malaysia 19.7 19.4 20.0 26.4 28.6 Philippines 5.1 4.9 5.3 7.6 8.1 Thailand 7.1 7.1 7.4 10.7 12.1
China 7.3 8.0 8.7 10.6 11.8 India 4.5 4.5 4.8 6.5 6.4
Note : 1/ GDP (PPP) per person employed per hour, US$ 2/ Refers to revised 2014
Source : IMD World Competitiveness Yearbook
51
2013 2014 2015 Industry 2/ Services Agriculture Industry 2/ Services Agriculture Industry 2/ Services Agriculture
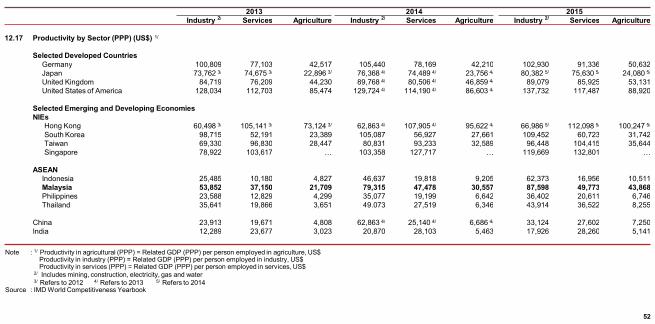
12.17 Productivity by Sector (PPP) (US$) 1/
Selected Developed Countries Germany 100,809 77,103 42,517 105,440 78,169 42,210 102,930 91,336 50,632 Japan 73,762 3/ 74,675 3/ 22,896 3/ 76,368 4/ 74,489 4/ 23,756 4/ 80,382 5/ 75,630 5/ 24,080 5/ United Kingdom 84,719 76,209 44,230 89,768 4/ 80,506 4/ 46,859 4/ 89,079 85,925 53,131 United States of America 128,034 112,703 85,474 129,724 4/ 114,190 4/ 86,603 4/ 137,732 117,487 88,920
Selected Emerging and Developing Economies NIEs
Hong Kong 60,498 3/ 105,141 3/ 73,124 3/ 62,863 4/ 107,905 4/ 95,622 4/ 66,986 5/ 112,098 5/ 100,247 5/ South Korea 98,715 52,191 23,389 105,087 56,927 27,661 109,452 60,723 31,742 Taiwan 69,330 96,830 28,447 80,831 93,233 32,589 96,448 104,415 35,644 Singapore 78,922 103,617 … 103,358 127,717 … 119,669 132,801 …
ASEAN Indonesia 25,485 10,180 4,827 46,637 19,818 9,205 62,373 16,956 10,511 Malaysia 53,852 37,150 21,709 79,315 47,478 30,557 87,598 49,773 43,868 Philippines 23,588 12,829 4,299 35,077 19,199 6,642 36,402 20,611 6,746 Thailand 35,641 19,866 3,651 49.073 27,519 6,346 43,914 36,522 8,255
China 23,913 19,671 4,808 62,863 4/ 25,140 4/ 6,686 4/ 33,124 27,602 7,250 India 12,289 23,677 3,023 20,870 28,103 5,463 17,926 28,260 5,141
Note : 1/ Productivity in agricultural (PPP) = Related GDP (PPP) per person employed in agriculture, US$ Productivity in industry (PPP) = Related GDP (PPP) per person employed in industry, US$ Productivity in services (PPP) = Related GDP (PPP) per person employed in services, US$ 2/ Includes mining, construction, electricity, gas and water 3/ Refers to 2012 4/ Refers to 2013 5/ Refers to 2014
Source : IMD World Competitiveness Yearbook
52
IMD WorldCompetitive-
ness Yearbook2016
World BankDoing Business
2016
WEF GlobalCompetitive-ness Report2015-2016
WEF GlobalInformationTechnologyReport 2016
TI CorruptionPerceptionsIndex 2015
AT KearneyGlobal RetailDevelopmentIndex 2016
AT KearneyGlobal ServicesLocation 2016
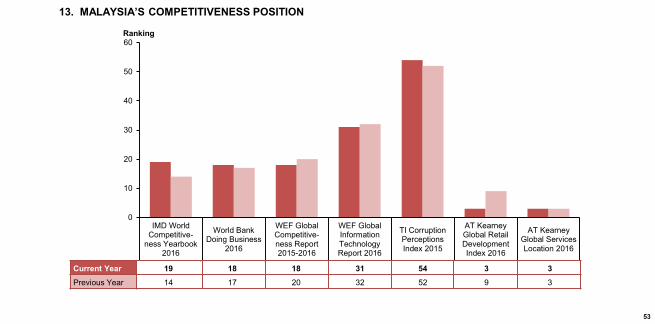
Current Year 19 18 18 31 54 3 3 Previous Year 14 17 20 32 52 9 3
0
10
20
30
40
50
60
13. MALAYSIA’S COMPETITIVENESS POSITION
53
Ranking
Current Year 19 18 18 31 54 3 3
Previous Year 14 17 20 32 52 9 3
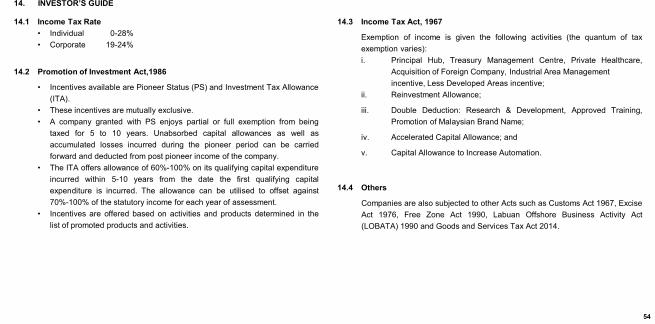
14. INVESTOR’S GUIDE
14.1 Income Tax Rate • Individual 0-28% • Corporate 19-24%
14.2 Promotion of Investment Act,1986
• Incentives available are Pioneer Status (PS) and Investment Tax Allowance (ITA).
• These incentives are mutually exclusive. • A company granted with PS enjoys partial or full exemption from being
taxed for 5 to 10 years. Unabsorbed capital allowances as well as accumulated losses incurred during the pioneer period can be carried forward and deducted from post pioneer income of the company.
• The ITA offers allowance of 60%-100% on its qualifying capital expenditure incurred within 5-10 years from the date the first qualifying capital expenditure is incurred. The allowance can be utilised to offset against 70%-100% of the statutory income for each year of assessment.
• Incentives are offered based on activities and products determined in the list of promoted products and activities.
14.3 Income Tax Act, 1967
Exemption of income is given the following activities (the quantum of tax exemption varies): i. Principal Hub, Treasury Management Centre, Private Healthcare,
Acquisition of Foreign Company, Industrial Area Management incentive, Less Developed Areas incentive;
ii. Reinvestment Allowance;
iii. Double Deduction: Research & Development, Approved Training, Promotion of Malaysian Brand Name;
iv. Accelerated Capital Allowance; and
v. Capital Allowance to Increase Automation.
14.4 Others
Companies are also subjected to other Acts such as Customs Act 1967, Excise Act 1976, Free Zone Act 1990, Labuan Offshore Business Activity Act (LOBATA) 1990 and Goods and Services Tax Act 2014.
54
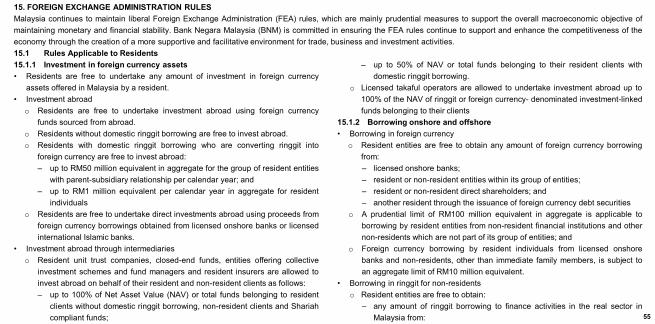
15. FOREIGN EXCHANGE ADMINISTRATION RULES Malaysia continues to maintain liberal Foreign Exchange Administration (FEA) rules, which are mainly prudential measures to support the overall macroeconomic objective of maintaining monetary and financial stability. Bank Negara Malaysia (BNM) is committed in ensuring the FEA rules continue to support and enhance the competitiveness of the economy through the creation of a more supportive and facilitative environment for trade, business and investment activities. 15.1 Rules Applicable to Residents 15.1.1 Investment in foreign currency assets • Residents are free to undertake any amount of investment in foreign currency
assets offered in Malaysia by a resident. • Investment abroad
o Residents are free to undertake investment abroad using foreign currency funds sourced from abroad.
o Residents without domestic ringgit borrowing are free to invest abroad. o Residents with domestic ringgit borrowing who are converting ringgit into
foreign currency are free to invest abroad: ‒ up to RM50 million equivalent in aggregate for the group of resident entities
with parent-subsidiary relationship per calendar year; and ‒ up to RM1 million equivalent per calendar year in aggregate for resident
individuals o Residents are free to undertake direct investments abroad using proceeds from
foreign currency borrowings obtained from licensed onshore banks or licensed international Islamic banks.
• Investment abroad through intermediaries o Resident unit trust companies, closed-end funds, entities offering collective
investment schemes and fund managers and resident insurers are allowed to invest abroad on behalf of their resident and non-resident clients as follows: ‒ up to 100% of Net Asset Value (NAV) or total funds belonging to resident
clients without domestic ringgit borrowing, non-resident clients and Shariah compliant funds;
‒ up to 50% of NAV or total funds belonging to their resident clients with
domestic ringgit borrowing. o Licensed takaful operators are allowed to undertake investment abroad up to
100% of the NAV of ringgit or foreign currency- denominated investment-linked funds belonging to their clients
15.1.2 Borrowing onshore and offshore • Borrowing in foreign currency
o Resident entities are free to obtain any amount of foreign currency borrowing from: ‒ licensed onshore banks; ‒ resident or non-resident entities within its group of entities; ‒ resident or non-resident direct shareholders; and ‒ another resident through the issuance of foreign currency debt securities
o A prudential limit of RM100 million equivalent in aggregate is applicable to borrowing by resident entities from non-resident financial institutions and other non-residents which are not part of its group of entities; and
o Foreign currency borrowing by resident individuals from licensed onshore banks and non-residents, other than immediate family members, is subject to an aggregate limit of RM10 million equivalent.
• Borrowing in ringgit for non-residents o Resident entities are free to obtain:
‒ any amount of ringgit borrowing to finance activities in the real sector in Malaysia from: 55
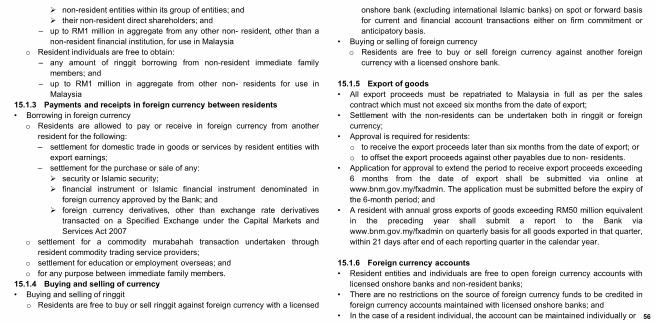
non-resident entities within its group of entities; and their non-resident direct shareholders; and
‒ up to RM1 million in aggregate from any other non- resident, other than a non-resident financial institution, for use in Malaysia
o Resident individuals are free to obtain: ‒ any amount of ringgit borrowing from non-resident immediate family
members; and ‒ up to RM1 million in aggregate from other non- residents for use in
Malaysia 15.1.3 Payments and receipts in foreign currency between residents • Borrowing in foreign currency
o Residents are allowed to pay or receive in foreign currency from another resident for the following: ‒ settlement for domestic trade in goods or services by resident entities with
export earnings; ‒ settlement for the purchase or sale of any:
security or Islamic security; financial instrument or Islamic financial instrument denominated in
foreign currency approved by the Bank; and foreign currency derivatives, other than exchange rate derivatives
transacted on a Specified Exchange under the Capital Markets and Services Act 2007
o settlement for a commodity murabahah transaction undertaken through resident commodity trading service providers;
o settlement for education or employment overseas; and o for any purpose between immediate family members.
15.1.4 Buying and selling of currency • Buying and selling of ringgit
o Residents are free to buy or sell ringgit against foreign currency with a licensed
onshore bank (excluding international Islamic banks) on spot or forward basis for current and financial account transactions either on firm commitment or anticipatory basis.
• Buying or selling of foreign currency o Residents are free to buy or sell foreign currency against another foreign
currency with a licensed onshore bank.
15.1.5 Export of goods • All export proceeds must be repatriated to Malaysia in full as per the sales
contract which must not exceed six months from the date of export; • Settlement with the non-residents can be undertaken both in ringgit or foreign
currency; • Approval is required for residents:
o to receive the export proceeds later than six months from the date of export; or o to offset the export proceeds against other payables due to non- residents.
• Application for approval to extend the period to receive export proceeds exceeding 6 months from the date of export shall be submitted via online at www.bnm.gov.my/fxadmin. The application must be submitted before the expiry of the 6-month period; and
• A resident with annual gross exports of goods exceeding RM50 million equivalent in the preceding year shall submit a report to the Bank via www.bnm.gov.my/fxadmin on quarterly basis for all goods exported in that quarter, within 21 days after end of each reporting quarter in the calendar year.
15.1.6 Foreign currency accounts • Resident entities and individuals are free to open foreign currency accounts with
licensed onshore banks and non-resident banks; • There are no restrictions on the source of foreign currency funds to be credited in
foreign currency accounts maintained with licensed onshore banks; and • In the case of a resident individual, the account can be maintained individually or 56
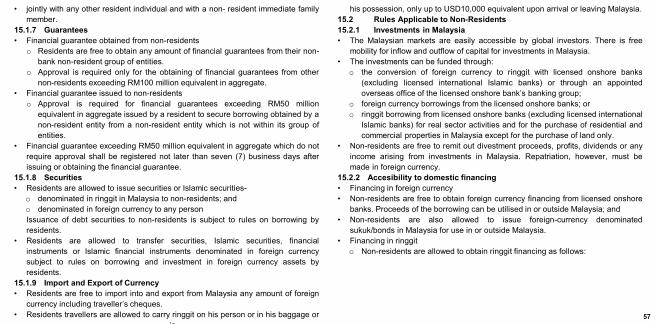
• jointly with any other resident individual and with a non- resident immediate family member.
15.1.7 Guarantees • Financial guarantee obtained from non-residents
o Residents are free to obtain any amount of financial guarantees from their non-bank non-resident group of entities.
o Approval is required only for the obtaining of financial guarantees from other non-residents exceeding RM100 million equivalent in aggregate.
• Financial guarantee issued to non-residents o Approval is required for financial guarantees exceeding RM50 million
equivalent in aggregate issued by a resident to secure borrowing obtained by a non-resident entity from a non-resident entity which is not within its group of entities.
• Financial guarantee exceeding RM50 million equivalent in aggregate which do not require approval shall be registered not later than seven (7) business days after issuing or obtaining the financial guarantee.
15.1.8 Securities • Residents are allowed to issue securities or Islamic securities-
o denominated in ringgit in Malaysia to non-residents; and o denominated in foreign currency to any person Issuance of debt securities to non-residents is subject to rules on borrowing by residents.
• Residents are allowed to transfer securities, Islamic securities, financial instruments or Islamic financial instruments denominated in foreign currency subject to rules on borrowing and investment in foreign currency assets by residents.
15.1.9 Import and Export of Currency • Residents are free to import into and export from Malaysia any amount of foreign
currency including traveller’s cheques. • Residents travellers are allowed to carry ringgit on his person or in his baggage or
in
his possession, only up to USD10,000 equivalent upon arrival or leaving Malaysia. 15.2 Rules Applicable to Non-Residents 15.2.1 Investments in Malaysia • The Malaysian markets are easily accessible by global investors. There is free
mobility for inflow and outflow of capital for investments in Malaysia. • The investments can be funded through:
o the conversion of foreign currency to ringgit with licensed onshore banks (excluding licensed international Islamic banks) or through an appointed overseas office of the licensed onshore bank’s banking group;
o foreign currency borrowings from the licensed onshore banks; or o ringgit borrowing from licensed onshore banks (excluding licensed international
Islamic banks) for real sector activities and for the purchase of residential and commercial properties in Malaysia except for the purchase of land only.
• Non-residents are free to remit out divestment proceeds, profits, dividends or any income arising from investments in Malaysia. Repatriation, however, must be made in foreign currency.
15.2.2 Accesibility to domestic financing • Financing in foreign currency • Non-residents are free to obtain foreign currency financing from licensed onshore
banks. Proceeds of the borrowing can be utilised in or outside Malaysia; and • Non-residents are also allowed to issue foreign-currency denominated
sukuk/bonds in Malaysia for use in or outside Malaysia. • Financing in ringgit
o Non-residents are allowed to obtain ringgit financing as follows:
57
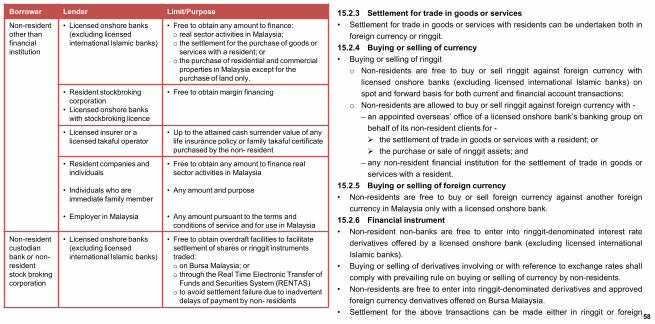
15.2.3 Settlement for trade in goods or services • Settlement for trade in goods or services with residents can be undertaken both in
foreign currency or ringgit. 15.2.4 Buying or selling of currency • Buying or selling of ringgit
o Non-residents are free to buy or sell ringgit against foreign currency with licensed onshore banks (excluding licensed international Islamic banks) on spot and forward basis for both current and financial account transactions;
o Non-residents are allowed to buy or sell ringgit against foreign currency with - ‒ an appointed overseas’ office of a licensed onshore bank’s banking group on
behalf of its non-resident clients for - the settlement of trade in goods or services with a resident; or the purchase or sale of ringgit assets; and
‒ any non-resident financial institution for the settlement of trade in goods or services with a resident.
15.2.5 Buying or selling of foreign currency • Non-residents are free to buy or sell foreign currency against another foreign
currency in Malaysia only with a licensed onshore bank. 15.2.6 Financial instrument • Non-resident non-banks are free to enter into ringgit-denominated interest rate
derivatives offered by a licensed onshore bank (excluding licensed international Islamic banks).
• Buying or selling of derivatives involving or with reference to exchange rates shall comply with prevailing rule on buying or selling of currency by non-residents.
• Non-residents are free to enter into ringgit-denominated derivatives and approved foreign currency derivatives offered on Bursa Malaysia.
• Settlement for the above transactions can be made either in ringgit or foreign
Borrower Lender Limit/Purpose
Non-resident other than financial institution
• Licensed onshore banks (excluding licensed international Islamic banks)
• Free to obtain any amount to finance: o real sector activities in Malaysia; o the settlement for the purchase of goods or
services with a resident; or o the purchase of residential and commercial
properties in Malaysia except for the purchase of land only.
• Resident stockbroking corporation
• Licensed onshore banks with stockbroking licence
• Free to obtain margin financing
• Licensed insurer or a licensed takaful operator
• Up to the attained cash surrender value of any life insurance policy or family takaful certificate purchased by the non- resident
• Resident companies and individuals
• Individuals who are immediate family member
• Employer in Malaysia
• Free to obtain any amount to finance real sector activities in Malaysia
• Any amount and purpose
• Any amount pursuant to the terms and conditions of service and for use in Malaysia
Non-resident custodian bank or non-resident stock broking corporation
• Licensed onshore banks (excluding licensed international Islamic banks)
• Free to obtain overdraft facilities to facilitate settlement of shares or ringgit instruments traded: o on Bursa Malaysia; or o through the Real Time Electronic Transfer of
Funds and Securities System (RENTAS) o to avoid settlement failure due to inadvertent
delays of payment by non- residents
58
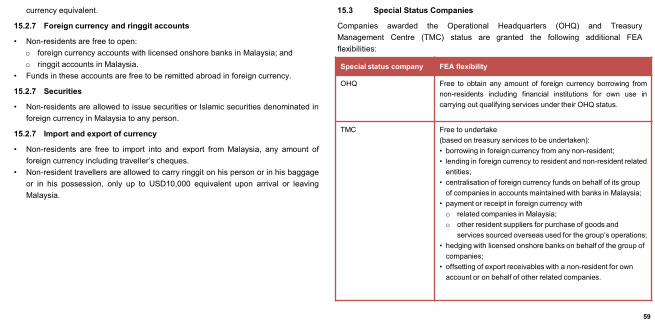
currency equivalent.
15.2.7 Foreign currency and ringgit accounts
• Non-residents are free to open: o foreign currency accounts with licensed onshore banks in Malaysia; and o ringgit accounts in Malaysia.
• Funds in these accounts are free to be remitted abroad in foreign currency.
15.2.7 Securities
• Non-residents are allowed to issue securities or Islamic securities denominated in foreign currency in Malaysia to any person.
15.2.7 Import and export of currency
• Non-residents are free to import into and export from Malaysia, any amount of foreign currency including traveller’s cheques.
• Non-resident travellers are allowed to carry ringgit on his person or in his baggage or in his possession, only up to USD10,000 equivalent upon arrival or leaving Malaysia.
15.3 Special Status Companies
Companies awarded the Operational Headquarters (OHQ) and Treasury Management Centre (TMC) status are granted the following additional FEA flexibilities:
Special status company FEA flexibility
OHQ Free to obtain any amount of foreign currency borrowing from non-residents including financial institutions for own use in carrying out qualifying services under their OHQ status.
TMC Free to undertake (based on treasury services to be undertaken): • borrowing in foreign currency from any non-resident; • lending in foreign currency to resident and non-resident related
entities; • centralisation of foreign currency funds on behalf of its group
of companies in accounts maintained with banks in Malaysia; • payment or receipt in foreign currency with o related companies in Malaysia; o other resident suppliers for purchase of goods and
services sourced overseas used for the group’s operations; • hedging with licensed onshore banks on behalf of the group of
companies; • offsetting of export receivables with a non-resident for own
account or on behalf of other related companies.
59
60
2016 2017
JANUARY FEBRUARY MARCH JANUARY FEBRUARY MARCH S M T W T F S S M T W T F S S M T W T F S S M T W T F S S M T W T F S S M T W T F S
1 2 1 2 3 4 5 6 1 2 3 4 5 1 2 3 4 5 6 7 1 2 3 4 1 2 3 4 3 4 5 6 7 8 9 7 8 9 10 11 12 13 6 7 8 9 10 11 12 8 9 10 11 12 13 14 5 6 7 8 9 10 11 5 6 7 8 9 10 11
10 11 12 13 14 15 16 14 15 16 17 18 19 20 13 14 15 16 17 18 19 15 16 17 18 19 20 21 12 13 14 15 16 17 18 12 13 14 15 16 17 18 17 18 19 20 21 22 23 21 22 23 24 25 26 27 20 21 22 23 24 25 26 22 23 24 25 26 27 28 19 20 21 22 23 24 25 19 20 21 22 23 24 25 24 25 26 27 28 29 30 28 29 27 28 29 30 31 29 30 31 26 27 28 26 27 28 29 30 31 31
APRIL MAY JUNE APRIL MAY JUNE S M T W T F S S M T W T F S S M T W T F S S M T W T F S S M T W T F S S M T W T F S
1 2 1 2 3 4 5 6 7 1 2 3 4 1 1 2 3 4 5 6 1 2 3 3 4 5 6 7 8 9 8 9 10 11 12 13 14 5 6 7 8 9 10 11 2 3 4 5 6 7 8 7 8 9 10 11 12 13 4 5 6 7 8 9 10
10 11 12 13 14 15 16 15 16 17 18 19 20 21 12 13 14 15 16 17 18 9 10 11 12 13 14 15 14 15 16 17 18 19 20 11 12 13 14 15 16 17 17 18 19 20 21 22 23 22 23 24 25 26 27 28 19 20 21 22 23 24 25 16 17 18 19 20 21 22 21 22 23 24 25 26 27 18 19 20 21 22 23 24 24 25 26 27 28 29 30 29 30 31 26 27 28 29 30 23 24 25 26 27 28 29 28 29 30 31 25 26 27 28 29 30
30
JULY AUGUST SEPTEMBER JULY AUGUST SEPTEMBER S M T W T F S S M T W T F S S M T W T F S S M T W T F S S M T W T F S S M T W T F S
1 2 1 2 3 4 5 6 7 1 2 3 1 1 2 3 4 5 1 2 3 4 5 6 7 8 9 8 9 10 11 12 13 14 4 5 6 7 8 9 10 2 3 4 5 6 7 8 6 7 8 9 10 11 12 3 4 5 6 7 8 9
10 11 12 13 14 15 16 15 16 17 18 19 20 21 11 12 13 14 15 16 17 9 10 11 12 13 14 15 13 14 15 16 17 18 19 10 11 12 13 14 15 16 17 18 19 20 21 22 23 22 23 24 25 26 27 28 18 19 20 21 22 23 24 16 17 18 19 20 21 22 20 21 22 23 24 25 26 17 18 19 20 21 22 23 24 25 26 27 28 29 30 29 30 31 25 26 27 28 29 30 23 24 25 26 27 28 29 27 28 29 30 31 24 25 26 27 28 29 30
30 31
OCTOBER NOVEMBER DECEMBER OCTOBER NOVEMBER DECEMBER S M T W T F S S M T W T F S S M T W T F S S M T W T F S S M T W T F S S M T W T F S
1 1 2 3 4 5 1 2 3 1 2 3 4 5 6 7 1 2 3 4 1 2 2 3 4 5 6 7 8 6 7 8 9 10 11 12 4 5 6 7 8 9 10 8 9 10 11 12 13 14 5 6 7 8 9 10 11 3 4 5 6 7 8 9 9 10 11 12 13 14 15 13 14 15 16 17 18 19 11 12 13 14 15 16 17 15 16 17 18 19 20 21 12 13 14 15 16 17 18 10 11 12 13 14 15 16
16 17 18 19 20 21 22 20 21 22 23 24 25 26 18 19 20 21 22 23 24 22 23 24 25 26 27 28 19 20 21 22 23 24 25 17 18 19 20 21 22 23 23 24 25 26 27 28 29 27 28 29 30 25 26 27 28 29 30 31 29 30 31 26 27 28 29 30 24 25 26 27 28 29 30 30 31 31
National Public Holidays 2016 1 January - New Year 21 May - Wesak Day 16 September - Malaysia Day School Holidays in 2016 24 January - Thaipusam 4 June - Agong's Birthday 2 October - Awal Muharram 1 February - Federal Territory Day 22 June - Nuzul Al-Quran 29 October - Deepavali 8-9 February - Chinese New Year 6-7 July - Hari Raya Puasa 12 December - Prophet Muhammad’s Birthday 1 May - Labour Day 31 August - National Day 25 December - Christmas 5 May - Israk & Mikraj 12-13 Sept - Hari Raya Haji