The Lsm1-7/Pat1 complex binds to stress-activated mRNAs ...bers of the Lsm1-7/Pat1 RBP complex to...
30
RESEARCH ARTICLE The Lsm1-7/Pat1 complex binds to stress- activated mRNAs and modulates the response to hyperosmotic shock Elena Garre 1¤ , Vicent Pelechano 2 , Manuel Sa ´ nchez del Pino 3,4 , Paula Alepuz 3,4 , Per Sunnerhagen 1 * 1 Department of Chemistry and Molecular Biology, University of Gothenburg, Go ¨ teborg, Sweden, 2 SciLifeLab, Department of Microbiology, Tumor, and Cell Biology, Karolinska Institute, Stockholm, Sweden, 3 Departamento de Bioquı ´mica y Biologı ´a Molecular, Universitat de València, Burjassot, Valencia, Spain, 4 ERI Biotecmed, Universitat de València, Burjassot, Valencia, Spain ¤ Current address: Department of Biomedicine, University of Gothenburg, Go ¨ teborg, Sweden * [email protected] Abstract RNA-binding proteins (RBPs) establish the cellular fate of a transcript, but an understanding of these processes has been limited by a lack of identified specific interactions between RNA and protein molecules. Using MS2 RNA tagging, we have purified proteins associated with individual mRNA species induced by osmotic stress, STL1 and GPD1. We found mem- bers of the Lsm1-7/Pat1 RBP complex to preferentially bind these mRNAs, relative to the non-stress induced mRNAs, HYP2 and ASH1. To assess the functional importance, we mutated components of the Lsm1-7/Pat1 RBP complex and analyzed the impact on expres- sion of osmostress gene products. We observed a defect in global translation inhibition under osmotic stress in pat1 and lsm1 mutants, which correlated with an abnormally high association of both non-stress and stress-induced mRNAs to translationally active poly- somes. Additionally, for stress-induced proteins normally triggered only by moderate or high osmostress, in the mutants the protein levels rose high already at weak hyperosmosis. Anal- ysis of ribosome passage on mRNAs through co-translational decay from the 5’ end (5P- Seq) showed increased ribosome accumulation in lsm1 and pat1 mutants upstream of the start codon. This effect was particularly strong for mRNAs induced under osmostress. Thus, our results indicate that, in addition to its role in degradation, the Lsm1-7/Pat1 complex acts as a selective translational repressor, having stronger effect over the translation initiation of heavily expressed mRNAs. Binding of the Lsm1-7/Pat1p complex to osmostress-induced mRNAs mitigates their translation, suppressing it in conditions of weak or no stress, and avoiding a hyperresponse when triggered. Author summary When confronted with external physical or chemical stress, cells respond by increasing the mRNA output of a small number of genes required for stress survival, while shutting PLOS Genetics | https://doi.org/10.1371/journal.pgen.1007563 July 30, 2018 1 / 30 a1111111111 a1111111111 a1111111111 a1111111111 a1111111111 OPEN ACCESS Citation: Garre E, Pelechano V, Sa ´nchez del Pino M, Alepuz P, Sunnerhagen P (2018) The Lsm1-7/ Pat1 complex binds to stress-activated mRNAs and modulates the response to hyperosmotic shock. PLoS Genet 14(7): e1007563. https://doi. org/10.1371/journal.pgen.1007563 Editor: Anita K. Hopper, Ohio State University, UNITED STATES Received: February 15, 2018 Accepted: July 15, 2018 Published: July 30, 2018 Copyright: © 2018 Garre et al. This is an open access article distributed under the terms of the Creative Commons Attribution License, which permits unrestricted use, distribution, and reproduction in any medium, provided the original author and source are credited. Data Availability Statement: Raw and processed sequencing data are deposited at GEO with accession number GSE107250. Funding: This work was supported by grants from the Swedish Research Council (www.vr.se), grant no. 2010 4645 (PS) and 2016-01842 (VP), the Swedish Cancer Fund (www.cancerfonden.se/), grant no. 2013-512 and 2016-378 (PS), Knut and Alice Wallenberg Foundation (www.wallenberg. com/kaw), grant no. 2016.0123 (VP), Carl Tryggers Foundation (www.carltryggersstiftelse.se/
Transcript of The Lsm1-7/Pat1 complex binds to stress-activated mRNAs ...bers of the Lsm1-7/Pat1 RBP complex to...
RESEARCH ARTICLE
The Lsm1-7/Pat1 complex binds to stress-
activated mRNAs and modulates the
response to hyperosmotic shock
Elena Garre1¤, Vicent Pelechano2, Manuel Sanchez del Pino3,4, Paula Alepuz3,4,
Per Sunnerhagen1*
1 Department of Chemistry and Molecular Biology, University of Gothenburg, Goteborg, Sweden,
2 SciLifeLab, Department of Microbiology, Tumor, and Cell Biology, Karolinska Institute, Stockholm, Sweden,
3 Departamento de Bioquımica y Biologıa Molecular, Universitat de València, Burjassot, Valencia, Spain,
4 ERI Biotecmed, Universitat de València, Burjassot, Valencia, Spain
¤ Current address: Department of Biomedicine, University of Gothenburg, Goteborg, Sweden
Abstract
RNA-binding proteins (RBPs) establish the cellular fate of a transcript, but an understanding
of these processes has been limited by a lack of identified specific interactions between
RNA and protein molecules. Using MS2 RNA tagging, we have purified proteins associated
with individual mRNA species induced by osmotic stress, STL1 and GPD1. We found mem-
bers of the Lsm1-7/Pat1 RBP complex to preferentially bind these mRNAs, relative to the
non-stress induced mRNAs, HYP2 and ASH1. To assess the functional importance, we
mutated components of the Lsm1-7/Pat1 RBP complex and analyzed the impact on expres-
sion of osmostress gene products. We observed a defect in global translation inhibition
under osmotic stress in pat1 and lsm1 mutants, which correlated with an abnormally high
association of both non-stress and stress-induced mRNAs to translationally active poly-
somes. Additionally, for stress-induced proteins normally triggered only by moderate or high
osmostress, in the mutants the protein levels rose high already at weak hyperosmosis. Anal-
ysis of ribosome passage on mRNAs through co-translational decay from the 5’ end (5P-
Seq) showed increased ribosome accumulation in lsm1 and pat1 mutants upstream of the
start codon. This effect was particularly strong for mRNAs induced under osmostress. Thus,
our results indicate that, in addition to its role in degradation, the Lsm1-7/Pat1 complex acts
as a selective translational repressor, having stronger effect over the translation initiation of
heavily expressed mRNAs. Binding of the Lsm1-7/Pat1p complex to osmostress-induced
mRNAs mitigates their translation, suppressing it in conditions of weak or no stress, and
avoiding a hyperresponse when triggered.
Author summary
When confronted with external physical or chemical stress, cells respond by increasing
the mRNA output of a small number of genes required for stress survival, while shutting
PLOS Genetics | https://doi.org/10.1371/journal.pgen.1007563 July 30, 2018 1 / 30
a1111111111
a1111111111
a1111111111
a1111111111
a1111111111
OPENACCESS
Citation: Garre E, Pelechano V, Sanchez del Pino
M, Alepuz P, Sunnerhagen P (2018) The Lsm1-7/
Pat1 complex binds to stress-activated mRNAs
and modulates the response to hyperosmotic
shock. PLoS Genet 14(7): e1007563. https://doi.
org/10.1371/journal.pgen.1007563
Editor: Anita K. Hopper, Ohio State University,
UNITED STATES
Received: February 15, 2018
Accepted: July 15, 2018
Published: July 30, 2018
Copyright: © 2018 Garre et al. This is an open
access article distributed under the terms of the
Creative Commons Attribution License, which
permits unrestricted use, distribution, and
reproduction in any medium, provided the original
author and source are credited.
Data Availability Statement: Raw and processed
sequencing data are deposited at GEO with
accession number GSE107250.
Funding: This work was supported by grants from
the Swedish Research Council (www.vr.se), grant
no. 2010 4645 (PS) and 2016-01842 (VP), the
Swedish Cancer Fund (www.cancerfonden.se/),
grant no. 2013-512 and 2016-378 (PS), Knut and
Alice Wallenberg Foundation (www.wallenberg.
com/kaw), grant no. 2016.0123 (VP), Carl
Tryggers Foundation (www.carltryggersstiftelse.se/

down the majority of other genes. Moreover, each mRNA is regulated under stress to
either enhance or diminish its translation into proteins. The overall purpose is for the cell
to optimize gene expression for survival and recovery during rapidly changing conditions.
Much of this regulation is mediated by RNA-binding proteins. We have isolated proteins
binding to specific mRNAs induced by stress, to investigate how they affect the stress
response. We found members of one protein complex to be bound to stress-induced
mRNAs. When mutants lacking these proteins were exposed to stress, ribosomes were
more engaged with translating mRNAs than in the wild-type. In the mutants, it was also
possible to trigger expression of stress proteins with only minimal stress levels. Tracing
the passage of ribosomes over mRNAs, we saw that ribosomes accumulated around the
start codon in the mutants. These findings indicate that the protein complex is required to
moderate the stress response and prevent it from overreacting, which would be harmful
for the cell.
Introduction
The regulation of the gene expression is essential to all cells; therefore, the proper protein accu-
mulation is controlled at multiple steps, including transcription and translation, as well as
mRNA and protein transport and stability. During stable conditions, post-transcriptional con-
trol may explain some 20% of steady-state mRNA levels, however during rapidly changing
conditions, post-transcriptional regulation is crucial for the initial responses [1]. As most
investigations have focused on the general mechanisms acting on mRNA fate [2–4], little is
known about the specific mechanisms for differential control of subgroups of genes. Stress rep-
resents an ideal scenario for studies of post-transcriptional regulation. Stress conditions force
the cell to redirect its gene expression program. Until a cell has adapted to a sudden environ-
mental change, it faces an acute energy shortage. Immediate survival prior to signaling-
induced changes in gene expression depends on rapid post-translational events [5]. For
medium-term adaptation and resumption of growth, the overall translation rate has to
respond rapidly to changes in the environment, as protein synthesis represents a large fraction
of the cell’s total energy expenditure. For rapid adaptations to preserve energy, post-transcrip-
tional regulation acting on pre-existing mRNAs plays a major role by virtue of being faster
than changes on the level of transcription initiation, and by intervening before the costly step
of protein synthesis [6]. RBPs are fundamental for regulating transcript stability, localization,
and translational efficiency, and thus sorting which mRNAs are to be expressed into proteins
under specific conditions, ultimately contributing to stress survival and recovery. Thus, the
mammalian RBP RBM3 protects neurons from cold shock [7], and glycine-rich RBPs in plants
perform similar functions under cold and drought stress [8]. Under hypoxia in mammalian
cells, an alternative translation initiation complex is formed at hypoxia-responsive mRNAs to
enhance their translation, comprising eIF4E2 and RBM4 [9]. In yeast, the RBP Slf1 promotes
translation of a few mRNAs during peroxide stress through interaction with the ribosome; slf1mutants are also hypersensitive to oxidative stress [10].
A hallmark of the acute stress response is a rapid and distinct global suppression of transla-
tion resulting from downregulation of ribosomal biogenesis factors and ribosomal proteins on
multiple levels including initiation of transcription, transcript decay, and translational effi-
ciency [11–14]. Pre-mRNAs encoding ribosomal proteins are subjected to the nonsense-medi-
ated degradation pathway during osmotic stress [15]. In addition, transcript-specific
regulation redirects the expression program to produce stress-protective proteins and reduce
RBPs and stress-induced transcripts
PLOS Genetics | https://doi.org/10.1371/journal.pgen.1007563 July 30, 2018 2 / 30
) grant no. KF13:8 and CTS 14:466 (PS), Ragnar
Soderberg Foundation (ragnarsoderbergsstiftelse.
se/) (VP), the regional Valencian government
(www.gva.es/), grant no. PROMETEO II 2015/006
(PA), the Spanish ministry of economy and
competitiveness (http://www.mineco.gob.es/),
grant no. BFU2013-48643-C3-3-P and BFU2016-
77728-C3-3-P (PA), Instituto de Salud Carlos III
(www.isciii.es/) and the European Regional
Development Fund (http://ec.europa.eu/regional_
policy/en/funding/erdf/), grant PT13/0001/0035
(MS). The funders had no role in study design, data
collection and analysis, decision to publish, or
preparation of the manuscript.
Competing interests: The authors have declared
that no competing interests exist.

expression of proteins required for growth and proliferation. Stress induces a shift from cap-
dependent to internal ribosome entry site dependent translation [16]. Oxidative stress causes
increased translation of upstream ORFs (uORFs) and frameshifting events in mRNAs, poten-
tially changing the proteome profile [17]. Specific RBPs are involved in promoting translation
and inhibiting decay of mRNAs promoting stress survival [10,18–20]. Under severe stress,
cytoplasmic stress granules (SGs) form, containing mRNAs to be silenced, ribosomal compo-
nents and other RBPs. The majority of mRNAs are sorted to the stress-induced SGs and con-
stitutive processing bodies (PBs), whereas the minority required for stress survival is kept out
of these granules, to instead be selectively translated [21].
Combined, these observations raise the question how the fates of stress-activated mRNAs
are determined under stress conditions. To reveal the mechanisms for this requires identifica-
tion of the specific interactions taking place between individual RBPs and mRNA species.
Such studies lag behind those of transcription factors and specific promoters, partly since
RBP/RNA interactions are weaker than for DNA-binding proteins/DNA. Several global stud-
ies have identified RBPs associated with the total mRNA population in yeast and other organ-
isms [2,3,22–27]. However, only very few studies have succeeded in isolating the proteins
associated with a single mRNA species in vivo, e.g. [28–30].
In this study, we aim to answer this by isolating individual osmostress-activated mRNA spe-
cies, quantitating the proteins associated in vivo with each of them, and analyzing how deletion
of these proteins impact on the expression of stress-activated genes. By comparison with the
proteome associated with individual, not stress-related, mRNA species, we identify specific
proteins preferentially binding to osmostress-activated mRNAs, STL1 and GPD1; notably
members of the cytoplasmic Lsm1–7/Pat1 complex. The specific association between these
proteins and STL1 and GPD1 mRNA was independently confirmed by quantitating stress and
non-stress mRNAs bound to tagged proteins. We evaluated the impact of the Lsm1–7/Pat1
complex on the stress response by analyzing expression of osmostress-activated genes in lsm1and pat1 mutants. We found those mRNAs to be more associated with polysomes than in the
wild-type (wt). Moreover, the mutants fail to regulate the amount of the corresponding stress
proteins under hyperosmotic shock. At low stress levels, the accumulation of those proteins is
not triggered in the wt, but this occurs in the mutants. Finally, by mapping ribosome transit at
single nucleotide resolution using 5P-Seq of mRNAs, we demonstrate increased ribosome
accumulation in pat1 and lsm1 mutants in the near vicinity upstream of the start codon. This
was particularly pronounced for specific subsets of mRNAs with functional enrichment in
translation and mating components, and for mRNAs more highly transcribed and associated
with ribosomes under osmostress. Together, these observations indicate that Pat1 and Lsm1
are important for dampening ribosome transit in the 5’-UTR, and thus translation initiation of
osmostress mRNAs, in particular under low stress conditions. We conclude that our biochem-
ical co-purification approach has successfully identified RBPs with a particular role in regulat-
ing post-transcriptional expression of stress-activated mRNAs.
Results
Isolation of RBPs associated with osmostress-induced mRNAs
Our goal was to identify RBPs involved in differential regulation of specific mRNAs under
hyperosmotic stress. To isolate mRNA-specific ribonucleoprotein (RNP) complexes, we devel-
oped a method similar to those previously described [28,31] based on affinity purification of
MS2 aptamer 3’-tagged mRNAs and subsequent protein composition analysis by LC-MS/MS,
targeting directly the proteins interacting with individual osmo-mRNA species (Fig 1A, see
Material and Methods). The MS2 loops were integrated into the genomic copies of GPD1 and
RBPs and stress-induced transcripts
PLOS Genetics | https://doi.org/10.1371/journal.pgen.1007563 July 30, 2018 3 / 30

STL1 genes (S1A Fig). STL1 and GPD1 are well-characterized for their high level of induction
under moderate hyperosmotic stress in yeast (“osmo-mRNAs”) [32–34], under which condi-
tion they are also stabilized and actively translated [13,14,35]. They encode glycerol-
Fig 1. In vivo capture of RNPs associated with GPD1 and STL1 mRNAs under osmotic stress. A) Schematic outline of the
immunoprecipitation–mass spectrometry procedure. After growing the cells to exponential phase, the expression of MS2-CP-GFP
fusion protein was induced by methionine depletion and osmotic stress was applied by addition of KCl to 0.6 M. Proteins were then
directly cross-linked to mRNAs in vivo by formaldehyde addition, after which RNPs-mRNA-MS2L interacting with the
MS2-CP-GFP fusion protein were purified using GFP-Trap beads. After elution from the beads and cross-linking reversal, the
sample was divided and RNA and proteins extracted separately. The proteins were separated by SDS-PAGE and composition was
analyzed by LC-MS/MS. B, C) Example of RNP capture experiment using an STL1-MS2L mRNA containing strain. B) Protein
separation by SDS-PAGE before digestion and mass spectrometry. C) STL1-MS2LmRNA detection by RT-PCR in input, unbound
(UB) and pull-down (PD) samples. A pair of primers complementary to STL1 and flanking the MS2 loops insertion region was used
in upper panel. The MS2L integration was detected by a 1.0 kb amplification product. As a control of the integrity of the mRNA, a
pair of primers within the ORF was used in the bottom panel.
https://doi.org/10.1371/journal.pgen.1007563.g001
RBPs and stress-induced transcripts
PLOS Genetics | https://doi.org/10.1371/journal.pgen.1007563 July 30, 2018 4 / 30

3-dehydrogenase and a membrane-bound H+/glycerol symporter, respectively. Both are
involved in intracellular accumulation of glycerol, the principal compatible osmolyte in yeast
and essential for its survival under osmotic stress. As contrasting examples of osmostress non-
responsive mRNAs, the ASH1 and HYP2 mRNAs were also tagged with MS2 loops. Under
osmotic stress, ASH1 and HYP2 are not transcriptionally induced; these transcripts are instead
destabilized and translationally inactivated [13,14,35]. The induction patterns and polysome
profiles upon osmostress of these aptamer-tagged mRNAs were similar to their untagged full-
length counterparts (S1 Fig).
As an additional test to verify the functionality of the tagged mRNAs, we analyzed the intra-
cellular localization of those mRNAs by visualization of the MS2CP-GFP fusion protein bound
to them (S2A Fig). In each case, a punctate pattern of the GFP fluorescence appeared when
mRNA-MS2L and the fusion protein were expressed. It was previously shown that certain
mRNAs are found in granules where they are actively translated [36]. To test the nature of the
GFP-positive granules, cells were treated with cycloheximide (CHX) before incubation in
media with or without 0.6 M KCl (S2A and S2B Fig). Such treatment prevents the formation
of PBs and SGs, most likely by trapping mRNA on polysomes [36,37]. An increase in the num-
ber of mRNA-MS2L granules was observed after CHX treatment, significantly pronounced for
STL1-MSL2, GPD1-MSL2 and HYP2-MSL2 mRNA granules when it was followed by osmotic
stress. The observed increase in mRNA granules in CHX-treated cells indicates an accumula-
tion of ribosome-associated mRNAs in granules. As expected if these granules represent
actively translating mRNAs, analysis of co-localization of those mRNA-MS2L granules with
the PB marker Dcp2-RFP (S2C Fig) showed a lower percentage of PB signal overlapping with
the stress-induced mRNAs STL1-MS2L (11%) and GPD1-MS2L (20%) than with the repressed
mRNA HYP2-MS2L (44%). To rule out any effect of tagged mRNAs on PB formation, we
quantitated the number of PBs during osmostress in cells expressing MS2L-tagged mRNAs
and MS2CP-GFP. None of the tagged mRNAs caused a PB increase over cells not expressing
tagged mRNAs (S2D Fig). Altogether, these observations corroborate that most STL1 and
GPD1 mRNA granules were distinct from PBs, in agreement with previous work showing that
active translation can be found associated to granules.
Before proceeding with LC-MS/MS analysis, the RNP isolation was optimized using ASH1mRNA and its well-established interaction with She2p [28,38,39] (S3 Fig). Then, from three
independent experiments with the four MS2L-tagged mRNA and the non-tagged reference
strain under osmotic stress (0.6 M KCl, 30 min), RNPs were isolated, and the protein composi-
tions were subsequently analyzed. A corresponding analysis of unstressed cells was not feasible
as the levels of STL1 and GPD1 mRNAs under such conditions are orders of magnitude lower.
The presence of the MS2-CP-GFP protein and the specific mRNA-MS2L transcript was veri-
fied in the input and pull-down samples (Fig 1B and 1C). Also, the enrichment in
mRNA-MS2L after pull-down relative to the input sample was monitored by RT-qPCR, show-
ing that only the respective mRNA used to isolate the RNPs was enriched (Table 1). These
Table 1. Detection of the mRNAs in the isolated RNP fractions by qPCR.
mRNAs
Strain ASH1 GPD1 STL1ASH1-MS2L 3.79 0.04 0.04
STL1-MS2L 0.08 0.07 13.98
GPD1-MS2L 1.16 82.83 1.15
[(PDmRNA-MS2L/ImRNA-MS2L)/(PDnoMS2L/InoMS2)]
https://doi.org/10.1371/journal.pgen.1007563.t001
RBPs and stress-induced transcripts
PLOS Genetics | https://doi.org/10.1371/journal.pgen.1007563 July 30, 2018 5 / 30

observations together indicated that the captured samples were indeed enriched in the
mRNA-MS2L and its interacting proteins.
We identified 202, 76, 93, and 24 proteins reproducibly enriched (> 2-fold higher than the
untagged strain) binding the GPD1, STL1, ASH1, and HYP2 mRNAs, respectively. To identify
those proteins enriched preferentially with the osmo-mRNAs GPD1 and STL1, we selected the
proteins significantly detected in both the GPD1-MS2L and STL1-MS2L strains, and> 3-fold
more abundant in these strains than in the untagged strain and the ASH1-MS2L and
HYP2-MS2L strains. According to these criteria, 21 proteins were listed as enriched in both the
STL1 and GPD1 mRNA preparations (Table 2). As was the purpose of the experiment, we
identified several proteins previously shown to bind RNA, including 8 proteins interacting
with mRNA and one binding tRNA. In addition, we found several proteins not previously
identified as RBPs, but potentially part of the osmotic stress response, e.g. the enzyme Glo2
and the transcription factor Usv1 (see Discussion) and proteins involved in cell morphogenesis
and plasma membrane processes (Htb1, Sac7 and Dig1).
Table 2. Proteins with enriched binding to the STL1 and GPD1 mRNAs identified by MS.
Enrichment peptides Enrichment TopAny
Category Gene Function GPD1/ASH1
STL1/ASH1
GPD1/HYP2
STL1/HYP2
GPD1/ASH1
STL1/ASH1
GPD1/HYP2
STL1/HYP2
mRNA
binding
LSM1 Decay 1,50�§ 2,11�§ 1,38� 1,99�§ 2,80 3,59 1,33 2,11
LSM2 Splicing and decay 1,86�§ 1,70�§ 1,15� 0,99� 2,17 2,48 1,66 1,97
LSM4 Splicing and decay 1,39� 1,47� 1,93�§ 2,00�§ 2,69�§ 3,17�§ 2,47�§ 2,95�§
LSM5 Splicing and decay 0,71 0,57 0,98 0,84 3,48�§ 4,25�§ 2,18�§ 2,94�§
LSM6 Splicing and decay - - 2,15 2,77 13,45�§ 14,07�§ 2,02�§ 2,64�§
PAT1 Decay 1,99�§ 2,08�§ 1,84�§ 1,92�§ 2,37�§ 2,83�§ 2,38�§ 2,83�§
EDC3 Decay 2,27 2,50�§ 1,93 2,17 4,46�§ 4,52�§ 1,77�§ 1,83�§
PAP1 mRNA polyadenylation and
transport
1,05 0,93 0,75 0,62 2,69�§ 1,76�§ 1,31� 0,38�
rRNA
binding
EMG1 Ribosomal small subunit biogenesis 0,92 0,89 0,42 0,39 3,47�§ 3,83�§ -0,64� -0,28�
Other
functions
PHO8 Nicotinamide nucleotide metabolic
process
1,69�§ 1,55�§ 8,07�§ 7,93�§ 9,70�§ 11,74�§ 7,69�§ 9,73�§
GLO2 Methylglyoxal catabolic process 12,03�§ 11,49�§ 4,62�§ 4,08�§ 17,13�§ 15,39�§ 5,99�§ 4,24�§
HBT1 Cell morphogenesis 0,33 0,12 0,08 -0,13 2,54�§ 4,58�§ 2,62�§ 4,66�§
SAC7 Controls organization of the actin
cytoskeleton
7,75�§ 8,17�§ 7,43�§ 7,85�§ - - - -
DIG1 Negative regulation of invasive
growth
3,74�§ 1,42� 3,05�§ 0,74� 5,53�§ 3,24�§ 10,24�§ 7,95�§
YGR026W Uncharacterized -0,33 0,37 -1,02 -0,32 4,55�§ 4,24�§ -0,24� -0,55�
SRP40 Preribosome assembly or transport 0,05 0,33 0,32 0,59 2,35�§ 2,47�§ 0,59� 0,71�
YAP1802 Endocytosis 6,86 7,37 6,54 7,05 9,59�§ 11,06�§ 7,58�§ 9,05�§
USV1 Putative transcription factor 0,67 -0,13 0,98 0,18 2,36�§ 3,48�§ -1,65� -0,53�
YBR225W Uncharacterized 0,32 0,17 0,16 0,00 2,98�§ 2,11�§ 2,29�§ 1,42�
YPL260W Uncharacterized 2,52�§ 1,46� 1,89�§ 0,83�§ 3,08�§ 2,45�§ 1,80�§ 1,18�
SRC1 Linked to TREX 3,25�§ 1,77�§ 2,97�§ 1,49� 2,66 0,67 2,77 0,79
�statistically significant§ log2 ratio >1.5 (3-fold change)
https://doi.org/10.1371/journal.pgen.1007563.t002
RBPs and stress-induced transcripts
PLOS Genetics | https://doi.org/10.1371/journal.pgen.1007563 July 30, 2018 6 / 30

Members of the Lsm1-7/Pat1 complex are recruited to GPD1 and STL1mRNA under stress
Notably, six out of the nine RBPs identified as specifically enriched in STL1 and GPD1 RNPs
under osmotic stress are components of the Lsm1-7/Pat1 complex. Two Pat1-Lsm complexes
have been recently reported, Lsm1-7/Pat1 in the cytoplasm and Lsm2-8/Pat1 in the nucleus
[40]. We detected the cytoplasm-specific component Lsm1, whereas the nucleus-specific Lsm8
is absent from our data (Table 2; S1 Table), indicating that the cytoplasmic Lsm1-7/Pat1 asso-
ciates with STL1 and GPD1 mRNAs.
It has been extensively described that the Lsm1-7/Pat1 complex plays a critical role in
mRNA decay via the 5’-3’ pathway, interacting with the oligoA tail at the 3’-end of transcripts,
and through a protein bridge also with the 5’-cap [41,42]. Through this association to mRNAs
targeted for decay, the complex promotes decapping via unknown mechanisms [43,44]. The
same complex has also been implicated in translational control [45–48]. Unexpectedly, our
data showed enriched association of components of this complex to GPD1 and STL1 mRNAs
under osmotic stress, when these transcripts are induced, stabilized, and actively translated. To
independently corroborate this enrichment, we performed a RNP pull-down assay under the
same experimental conditions, but using GFP-tagged versions of some of the Lsm/Pat1 com-
plex components [49] and analyzing the specific mRNA content by qPCR (Table 3). Under
osmotic stress conditions, both GPD1 and STL1 mRNAs showed enriched (> 2-fold) binding
compared with ASH1 to the four Lsm proteins tested (Lsm1p, Lsm3p, Lsm4p and Lsm7p), and
Pat1p. Using the same criteria, Pat1p was also preferentially captured by GPD1 and STL1mRNAs when compared with HYP2 mRNA.
Lsm1-7/Pat1 mutants have defects in global translation repression and
ribosome distribution
We hypothesized that this association of the Lsm1-7/Pat1 complex to induced mRNAs could
be related with two scenarios: one where highly induced and translated mRNAs recruit this
complex to dampen the high induction signal and compensate for the transcriptional induc-
tion; or a second where this complex has an enhancing role in translation, as recently described
Table 3. mRNA pull-down using GFP-tagged proteins after 30 min under osmotic stress (0.6 M KCl). The mRNA
enrichment to one another was calculated as the ratio (PD/I)mRNA1/(PD/I)mRNA2, where PD is the relative amount
of the specified mRNA detected in the pull-down using an specific GFP-tagged protein and I (input) is the relative
amount of that mRNA in the cell extract prior to the pull-down. The levels of specific mRNAs were quantified by
qPCR and the unspecific RNA pulled down from an untagged strain (BY4741) was used to normalize. His2p and
Clb2p were included as controls of proteins that do not bind those mRNAs.
Ratio (PD/I)mRNA1/(PD/I)mRNA2
GFP tagged protein GPD1/ASH1 GPD1/HYP2 STL1/ASH1 STL1/HYP2Pat1p 5.88� 3.30� 7.07� 3.97�
Lsm1p 5.40� 0.60� 7.86� 0.90�
Lsm3p 4.61 1.46 6.30 2.00
Lsm4p 4.87� 0.44� 5.12� 0.46�
Lsm7p 2.79 1.25 3.44 1.54
His2p NM�� NM�� NM�� NM��
Clb2p NM�� NM�� NM�� NM��
NM, non-measurable (mRNA2 was not detected in pull-down)
�Geometric mean of 3 independent experiments
��2 independent experiments
https://doi.org/10.1371/journal.pgen.1007563.t003
RBPs and stress-induced transcripts
PLOS Genetics | https://doi.org/10.1371/journal.pgen.1007563 July 30, 2018 7 / 30

for the decapping component Dhh1 [50]. To test those hypotheses, we first examined the phe-
notypes of pat1 and lsm1 mutants, with respect to steady-state mRNA levels, mRNA stability
and global translational repression under osmotic stress. For all these experiments, native full-
length mRNAs without the MS2L tag were studied.
A time-course experiment was done in exponential growth cultures to measure the levels of
GPD1 and STL1 mRNAs under osmotic stress in pat1 and lsm1 single mutants (Fig 2). Two to
three times higher levels of GPD1 and STL1 mRNAs were observed in the pat1 and lsm1mutants during stress than in wt (Fig 2A), although the accumulation kinetics of both mRNAs
were similar between wt and mutants, reaching maximum levels 15 – 30 min of stress expo-
sure. To evaluate if the observed mRNA accumulation in the pat1 and lsm1 mutants was con-
sequence of their role in decapping, mRNA decay rates were analyzed after 30 min of osmotic
stress and transcriptional shut-off by addition of 1,10-phenantroline (Fig 2B). No differences
in decay rates for STL1 and GPD1 mRNAs between wt and pat1 mutants were observed
however.
Next, we aimed to evaluate the impact of Pat1 and Lsm1 depletion on the regulation of
translation under osmotic stress. For this, we first analyzed global translation profiles by sepa-
rating polyribosomes (polysomes) by high-speed sedimentation centrifugation after 30 min of
treatment with 0.6 M KCl (Fig 3, S4 and S5 Figs). Consistent with earlier results [20], after 30
min the cells had already recovered from the transient inhibition of the global translation (Fig
3A left panels). In pat1 and lsm1 mutants, the polysome proportion (P/FM ratio) was slightly
higher than in wt cells. We verified that a proper global translation inhibition did occur in the
wt strain at short times (6 and 15 min) when osmotic stress was added (S5A Fig); and also, as
previously described for starved cells [47], that in the pat1 mutant the ability to undergo trans-
lational repression under osmotic stress was impaired (S5A Fig).
Fig 2. Deletion of Lsm1-7/Pat1 components affects mRNA levels of the osmo-mRNAs, GPD1 and STL1, without
major effects on stability. A) Steady-state levels of STL1 and GPD1 mRNAs in lsm1 and pat1 mutants under osmotic
stress (0.6 M KCl). mRNA levels were normalized against the housekeeping gene ACT1 and expressed relative to the
highest value in wt strain. Average and standard error (SE) from three biological replicates are shown. B)
Quantification of the mRNA decay rate after blocking transcription by 1,10-phenanthroline in wt and pat1 strains
under osmotic stress (30 min, 0.6 M KCl) and normalized against ACT1 mRNA. Half-life ± SE from three independent
experiments is indicated.
https://doi.org/10.1371/journal.pgen.1007563.g002
RBPs and stress-induced transcripts
PLOS Genetics | https://doi.org/10.1371/journal.pgen.1007563 July 30, 2018 8 / 30
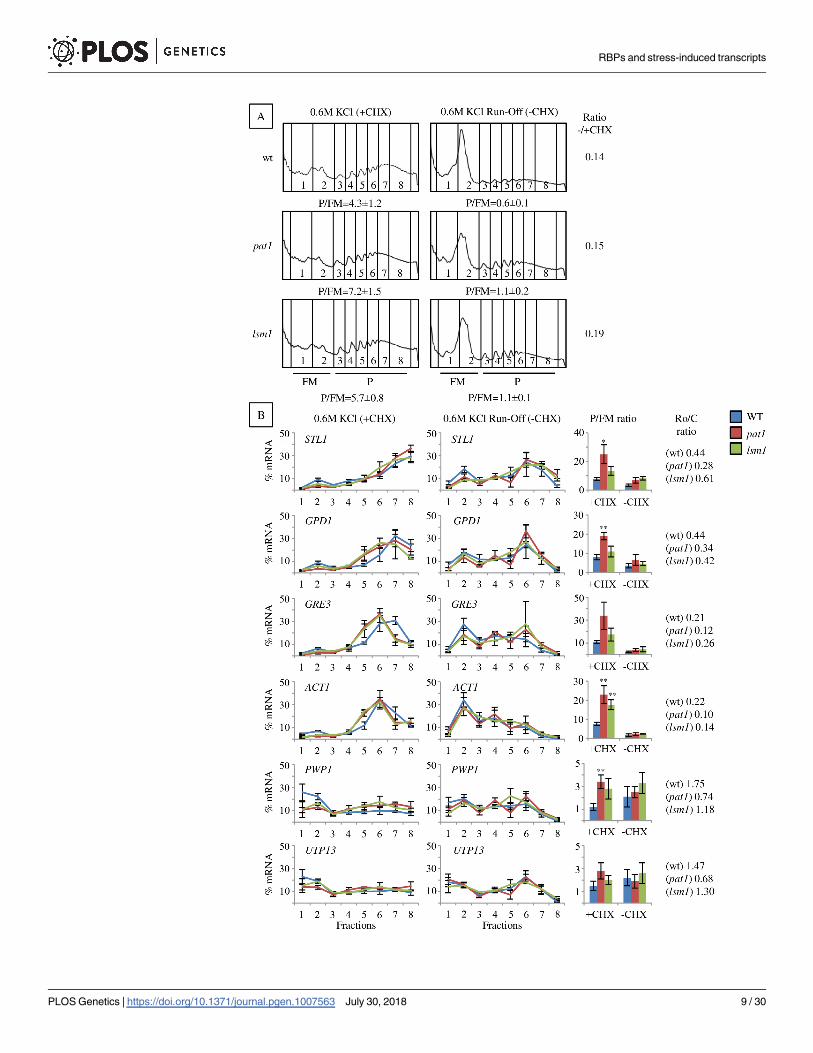
RBPs and stress-induced transcripts
PLOS Genetics | https://doi.org/10.1371/journal.pgen.1007563 July 30, 2018 9 / 30

To further analyze the impact of pat1 and lsm1 mutations in translation during stress, we
investigated the association of specific transcripts with ribosomes (Fig 3B, left panels). In mRNAs
associated with heavy polyribosomes in wt after 30 min of osmotic stress such as STL1, GPD1,
GRE3 and ACT1, we observed there was a reduction in the proportion of these mRNAs associated
to non-polysomal fractions (1–2) in the pat1 and lsm1 mutants, turning out in a high P/FM ratio
(Fig 3B, bar graphs). Similarly, the translationally repressed mRNAs PWP1 and UTP13, abundant
in non-polysomal fractions in wt, and the moderately repressed HYP2, were also more associated
to polysomal fractions (3–8) in both mutants (Fig 3B left panels, bar graphs, S4 Fig). To better
understand how these mutations affect the flux of those mRNAs on or off polyribosomes under
osmotic stress, we analyzed their distribution at several short times after osmotic shock (S5B Fig).
The stress-responsive GPD1 and STL1 mRNAs in pat1 mutants accumulated in non-polysomal
fractions (1–2) at a short time (6 min) after KCl addition similar to wt, and shifted to polyribo-
some fractions when the osmotic stress progressed. However, after 30 min was observed a
markedly higher P/FM ratio in the pat1 mutant (S5B Fig, bar graphs). By contrast, the stress-
repressed PWP1 and UTP13mRNAs were in high density fractions without stress and shifted to
non-polysomal fractions under osmotic stress in wt, while remaining associated to polysomes in
pat1 mutants at 15 and 30 min. The ACT1 mRNA, neither strongly upregulated nor repressed by
osmostress, also showed higher accumulation to heavy fractions in the pat1 mutant, and the
HYP2 mRNA, moderately repressed by osmostress, followed a similar pattern. For the non-
induced mRNAs (PWP1, UTP13,ACT1, HYP2), the P/FM ratio was only moderately increased at
30 min. These results show that deletion of the PAT1 gene resulted in increased progression of
mRNAs to heavy fractions under osmotic stress for stress-induced transcripts, and in prolonged
association to polysomes for stress-repressed transcripts.
Two potential explanations fit with our observations of higher mRNA polysomal association
in lsm1 and pat1 mutants: 1) ribosomes stall during translation elongation and this could be due
to impaired ribosome disassembly and recycling from the mRNAs; 2) an increased frequency of
active ribosomes accessing the mRNAs. To discriminate between these options, we analyzed the
ribosome run-off from polyribosomes in the absence of CHX in cells treated with 0.6 M KCl for
30 min (Fig 3A and 3B, right panels). To evaluate the effectiveness of run-off, we calculated the
ratio P/FM [run-off] to P/FM [control] for each strain (Fig 3A). The proportion of run-off poly-
somes in pat1 and lsm1 mutants was not significantly different from the wt, indicating that most
ribosomes are not irreversibly stalled. Consistent with this global analysis, the run-off of specific
mRNAs from the polysomes into the non-translating fractions also showed only slight differences
between pat1 and lsm1 mutants and the wt (Fig 3B, right panels and bar graphs). These observa-
tions are therefore most consistent with the second model, where the Lsm1-7/Pat1 complex may
limit ribosome access to the mRNAs under osmotic stress.
The pat1 mutant fails to dampen the translation induction in stress-
responsive mRNAs
The above results documented that the components of the Lsm1-7/Pat1 complex, Lsm1 and
Pat1, regulate ribosome dynamics in vivo. To determine the output of this effect on protein
Fig 3. mRNAs show abnormally high polysome association in pat1 and lsm1 mutants under osmotic stress but the
ribosomes can run off from them. A) Polysome profiles and B) specific mRNA association to them after 30 min of
osmotic stress (0.6 M KCl) in the presence or absence (run-off) of CHX. P/FM, the ratio between polysomal RNA and sub-
polysomal RNA (free plus monosomal RNA) is depicted below each profile in A) or in bar graphs in B). Average and
standard error (SE) from three biological replicates are shown. In B, the RNA was prepared from individual fractions
across polysome gradients as described in Material and Methods, and analyzed by qRT-PCR. The ratio P/FM run-off:P/
FM control for each strain is indicated (Ratio -/+CHX). Statistical analyses were performed using Student’s t-test of
comparisons between wt and mutants (�p<0.1, ��p<0.05).
https://doi.org/10.1371/journal.pgen.1007563.g003
RBPs and stress-induced transcripts
PLOS Genetics | https://doi.org/10.1371/journal.pgen.1007563 July 30, 2018 10 / 30

levels and see if it was specific for subgroups of mRNAs under osmotic stress, we analyzed the
accumulation of specific GFP-tagged proteins in a pat1 mutant background. We selected a rep-
resentative set of proteins, either strongly stress-induced or not induced, and for which the lev-
els could be reliably monitored by GFP fluorescence. We measured the accumulation of the
GFP-tagged proteins in the presence of KCl through a panel of different concentrations from
low to medium severe stress (0.3, 0.6, and 1 M) (Fig 4).
Three different expression patterns were observed in the pat1 mutant under osmotic stress.
The first pattern, represented by Gpd1 and Gpp2, showed a striking increment in protein lev-
els in this mutant under low to medium osmostress (0.3 M KCl). By contrast, no or low accu-
mulation of those proteins was triggered in wt under the same conditions. Moreover, in higher
salt concentrations (0.6 and 1 M KCl), when accumulation of those proteins was triggered in
the wt, pat1 mutants displayed 2–3 fold higher GFP signal. The second pattern was shown by
Gre3, where a similar or even smaller GFP signal increment was detected in pat1 mutants than
in wt in presence of KCl. To estimate the contribution of the mRNA amount to the protein
synthesis, we calculated the ratio between the areas under the curve of mRNA (S6 Fig) and
protein (Fig 4) after shock with 0.6 M KCl (for protein, the area was calculated till the levels
reached a plateau). The pat1 mutant showed an increased production of 1.7 and 5.0 times
more Gpd1p and Gpp2p per mRNA amount than wt, respectively (S2 Table). This indicates
that the increment over wt levels of these proteins was too high to be explained by the increases
of the corresponding mRNAs in the pat1 mutant. The third pattern was seen for proteins not
induced by the assayed osmostress conditions; Eno1p, Qcr6p and Hac1p. Here, the protein
levels declined further in pat1 mutants than in wt, and their changes under osmostress were
uncorrelated with the changes in mRNA levels (Fig 4 and S6 Fig). Altogether, these data indi-
cate that a deregulation of translation can be a significant cause of abnormal protein levels in
pat1 mutants.
These results are compatible with Pat1 being a translational repressor for highly induced
osmo-mRNAs; however, it does not act homogeneously on all transcripts. Specifically, under
osmotic stress, it dampens the protein levels from GPD1 and GPP2, and prevents excessive
accumulation of their encoded proteins. Still, other prerequisites for this effect probably exist
as shown by the GRE3 mRNA, which is also strongly induced at the transcript and protein lev-
els, but where PAT1 deletion has only a minor effect.
Co-translational mRNA decay analysis indicates a ribosome
overaccumulation upstream of the start codon in pat1 and lsm1 mutants
In order to further understand how the Lsm1-7/Pat1 complex affects the ribosome dynamics,
we performed a genome-wide analysis of the ribosome protected regions in pat1 and lsm1mutants using the recently developed 5P-Seq technique [51,52]. This approach offers an invivo snapshot of ribosome footprints by sequencing 5’-phosphorylated mRNA co-translational
degradation intermediates, and does not require the use of translation inhibitors or in vitromRNA digestion. We performed three independent 5P-Seq experiments with each strain (wt,
pat1 and lsm1 mutants) with or without osmotic stress (30 min, 0.6 M KCl).
Alignment with respect to the start codon of the 5P-Seq reads, at the metagene level,
showed a clearly increased ribosome accumulation around the translational start, almost iden-
tical for both pat1 and lsm1 mutants (Fig 5A, left panels). This ribosome accumulation was
detected on both sides of the start codon (position -14 where ribosomes are paused at the P
site during initiation [51,52]). A regular three-nucleotide pattern appeared at the start codon
(Fig 5A), indicating the onset of active translation. This shift in periodicity was also clear from
the analysis of the counts of protected molecules in the three frames (S7A Fig). As previously
RBPs and stress-induced transcripts
PLOS Genetics | https://doi.org/10.1371/journal.pgen.1007563 July 30, 2018 11 / 30

described, when the same analysis was repeated around the stop codon, the three-nucleotide
pattern resulting from co-translational 5’ - 3’ mRNA degradation was observed, with a marked
Fig 4. Deletion of PAT1 dysregulates synthesis of highly induced proteins under osmotic stress. The accumulation of specific GFP-tagged proteins
was monitored in pat1 (red line) mutants and wt (blue line) in control conditions (without stress) and under osmotic stress by addition of KCl (mild,
0.3 M; medium, 0.6 M; high, 1 M). Protein accumulation was expressed as the increment of fluorescence units relative to 5 min after addition of KCl.
Green fluorescence emission (520 nm) and OD600 was measured from the same well every 4 min for a period of 140 min in an Omega Polarstar
fluorescence plate reader. To normalize the data, the OD600 was used to remove the effect of growth differences between strains, and pat1 and wt with
no GFP-tagged protein growing in parallel were used to subtract the background fluorescence. Average and SE from at least three biological replicates
are shown.
https://doi.org/10.1371/journal.pgen.1007563.g004
RBPs and stress-induced transcripts
PLOS Genetics | https://doi.org/10.1371/journal.pgen.1007563 July 30, 2018 12 / 30

Fig 5. pat1 or lsm1 deletion yields overaccumulation of ribosomes in the 5’-UTR region of the mRNAs in both control and osmotic stress conditions.
5P-Seq was performed in pat1 and lsm1 mutants and wt strains before (control) and 30 min after addition of 0.6 M KCl (osmotic stress). A) Metagene analysis
displaying the abundance of 5’P intermediates in reads per million (rpm) in relation to the ORF start (left panels) and stop codons (right panels), with (bottom
panels) and without stress (upper panels). The graphics include the representation of the start region division in three windows of 45 nt each, upstream of the
start codon (uS), downstream of the start codon including the ribosome paused at the start (dS) and, downstream of dS region (ddS); and the stop region in two
windows, upstream of the stop codon including the ribosome paused at the stop (uE), and downstream of the stop (dE). B) Scatter plot representation and of log2
RBPs and stress-induced transcripts
PLOS Genetics | https://doi.org/10.1371/journal.pgen.1007563 July 30, 2018 13 / 30

peak 17 nucleotides upstream of the stop. Here, however, no difference in ribosome protection
was detected between wt and the pat1 and lsm1 mutants (Fig 5A, right panels). This difference
being highest before the start codon, and absent in the 3’ region of the genes, indicates that
cells depleted for Pat1 or Lsm1 present a general increased ribosome protection in the 5’
regions of the mRNAs, including the 5’-UTR. These differences cannot be explained by a
hypothetical limited decapping in the mutants, as 5P-Seq measures only RNA molecules with
a 5’ phosphate (i.e. after decapping). Therefore, independently of any potential capping differ-
ences, ribosomes accumulate in the 5’ regions of decapped mRNAs undergoing 5’-3’ decay.
To objectively measure the extent of this ribosome accumulation in the 5’ region, we calcu-
lated a loading ratio to compare different regions of the genes. We arbitrarily defined three 45
nucleotides (nt) regions around the start codon: upstream of the start codon (uS, between
bases -60 and -15), downstream of the start codon (dS, -14 to 31 nt, including the ribosome
paused at the start) and downstream of dS region (ddS, 32 to 77 nt within the ORF) (Fig 5A).
To distinguish ribosome accumulation specifically in the 5’ region from overall differences in
ribosome protection, we also defined two regions near the end region (-62 to -17 nt upstream
and -18 to 45 nt downstream of the stop codon, uE and dE respectively). Two loading ratios
were calculated covering the 5’ region (uSvsdS and uSvsddS) and one covering the 3’ end
(uEvsdE) for each strain and each condition. A positive ratio for a gene thus indicates that
there are more ribosome footprints towards the 5’ side of the analyzed region (i.e. ribosomes
accumulate upstream). Consistent with the metagene analysis, the pat1 and lsm1 mutants pres-
ent an increase in 5’-UTR ribosome protection also when analyzed at the single gene level (Fig
5B and 5C and S7B Fig). Comparing the 5’ regions, the distribution of the 5’ loading ratios
indicating a global accumulation of ribosome footprints in the 5’-UTR in both the pat1 and
lsm1 mutants increased notably relative to wt, showing more genes above the diagonal (Fig 5B
left and mid panels); also observed by the shift towards positive values when plotting the
cumulative distribution of gene-specific loading ratios (Fig 5C left and mid panels). The
mutants showed more ribosome accumulation in uS than in dS, and these differences were
more pronounced for the uS versus the ddS region (a region within the ORF). Similar differ-
ences, but at a lower degree, were also observed during osmotic stress (Fig 5A–5C, bottom
panels). By contrast, no significant changes in 3’ loading ratios were observed confirming that
the ribosome accumulation is specific of the 5’regions of the mRNAs (Fig 5B and 5C, right
panels).
To determine if the 5’-UTR accumulation of ribosomes in pat1 and lsm1 mutants was gen-
eral for the mRNA population, or if instead specific gene sets showed a different behavior, we
performed a Gene Ontology (GO) analysis (http://babelomics.bioinfo.cipf.es/). To do so, we
ranked the mRNAs according to a score based on their fold change of 5’-UTR ribosome accu-
mulation in mutants relative to wt (calculated as log2 [uSvsdSmutants/uSvsdSwt]). This showed
that different subsets of genes are clearly enriched among the mRNAs at both ends of the score
distribution, both prior to and after stress (S5 Table). Prior to stress, the mRNAs with the high-
est score were enriched for genes involved in translation, nucleobase and amine metabolism,
and transcription elongation. During stress, the highest scores were found with mRNAs
related to signal transduction and response to stimulus and pheromone. The differences
between the over-represented genes with and without stress were consistent with the two
ratios between window areas around the start codon (uSvsdS) or the stop codon (uEvsdE) without (upper panels) and with osmotic stress (bottom panels). Only
genes with at least 20 5P-Seq reads in the defined regions were considered for the analyses. Scatter plots display values for pat1 mutant (Y axis) vs wt strains (X
axis). Corresponding lsm1 mutant plots are shown in S7B and S7C Fig) Cumulative representation of log2 ratios for all the transcripts sequenced (ALL) and for
“osmotic-stress induced” gene subset defined in S6 Table (OSR). Increments of the cumulative distribution medians between wt and pat1 and lsm1 mutants,
before and after 30 min of osmotic stress (0.6 M KCl), are displayed under each graph.
https://doi.org/10.1371/journal.pgen.1007563.g005
RBPs and stress-induced transcripts
PLOS Genetics | https://doi.org/10.1371/journal.pgen.1007563 July 30, 2018 14 / 30

distinct biological environments: the enriched GO terms in actively growing cells were related
to gene expression and protein synthesis, while under stress, to signal transduction and stimu-
lus response.
As we found the Pat1 and Lsm1 proteins to be preferentially associated with the osmo-
mRNAs, GPD1 and STL1, we were interested to see if osmotic stress-induced genes had a
higher 5’-UTR ribosome protection in lsm1 and pat1 mutants. We defined an “osmotic-stress
induced” gene subset (Osmotic Stress Response; OSR) containing 544 transcripts, for which
accumulation is induced under osmotic stress, using a compendium of several published
mRNA expression datasets (details in S6 Table). The cumulative distribution of 5’-UTR ribo-
some protection for the OSR group, like the global graphs (Fig 5C), showed a higher overaccu-
mulation of ribosomes around the 5’UTR in lsm1 and pat1 mutants compared to wt. This
difference decreased after 30 min of osmotic stress. To evaluate if there were differences
between the OSR group and the total population of mRNAs, we calculated the increment of
cumulative distribution median between wt and mutants (Fig 5C). Interestingly, the OSR
group showed higher increments that were statistically significant along the 5’UTR (uSvsdS)
than the main group of analyzed transcripts under unstressed conditions, however not under
stressed conditions (S4 Table). These observations indicate that the effect of Pat1 and Lsm1 on
ribosome distribution along the 5’-UTR is more pronounced for transcripts encoding osmotic
stress-induced proteins.
Together, the 5P-Seq results indicate that ribosomes may load more frequently onto the 5’-
UTR of mRNAs in lsm1 and pat1 mutants, resulting in overprotection of this region; this effect
is strongest in unstressed cells. In view of the enhanced production of Gpd1 and Gpp2 protein
in the mutants under weak stress (Fig 4), this is indicative of increased recruitment of 40S sub-
units and translation initiation. Lsm1 and Pat1 may thus limit ribosome access and translation
of mRNAs, in particular for stress-responsive mRNAs before stress is imposed.
Discussion
Osmo-RNP complexes are enriched in proteins involved in the osmotic
stress response
The set of RBPs associated with the total transcriptome has been assessed several times using
different methodologies and from different organisms and cells [3,24–27,53]. Importantly,
those studies identified the major mRNA-binding proteins forming the core of most mRNPs,
and shed light on global post-transcriptional regulation and the importance of RBP/mRNA
interactions for that. There are only few reported attempts to isolate the protein set associated
with a single mRNA species in vivo [28–30,54]. Therefore, the regulation of individual mRNAs
and subsets of transcripts by RBPs is poorly understood. Here, we isolated specific RNP com-
plexes binding to individual osmo-mRNAs in Saccharomyces cerevisiae to understand the com-
position of these complexes and how they can regulate the fate of the associated mRNA. We
modified the MS2 aptamer-tagged mRNAs method [28,31] and used it to identify 21 proteins
with preferential binding to the GPD1 and STL1 osmo-mRNAs under osmotic stress (Table 2).
The use of MS2 aptamer-tagged mRNA methods has been questioned, reasoning that the
MS2-CP-GFP protein binding to the MS2-tagged mRNA might block the 5’-3’ degradation
and thereby stabilize 3’mRNA fragments and bias the results [55,56]. On the other hand,
numerous publications where the MS2-MCP system was used have shown that the transcripts
detected by MS2-MCP are intact, and their copy number and localization similar to untagged
endogenous mRNAs (reviewed in [57]). In this study, we verified that the mRNAs tagged with
MS2 sequences displayed a behavior upon stress similar to the corresponding native mRNAs,
both with respect to transcriptional induction and polysome profiles (S1 Fig). Moreover, they
RBPs and stress-induced transcripts
PLOS Genetics | https://doi.org/10.1371/journal.pgen.1007563 July 30, 2018 15 / 30

did not preferentially co-localize with PBs (S2 Fig), and the punctate pattern of STL1-MS2LmRNA was similar to the native mRNA using FISH [58]. Importantly, in our study all the
ensuing functional assays, showing altered behavior of stress-activated mRNAs in lsm1 and
pat1 mutants were performed with native, untagged, full-length mRNAs.
In the last decade, several studies have reported novel RBPs. Most of them are well-charac-
terized enzymes, now proposed to have a “moonlighting” role as post-transcriptional regula-
tors [4,24,59,60]. In our study we identified 12 proteins not previously described as RBPs, out
of 21 preferentially binding STL1 and GPD1 mRNAs. Several hypotheses about why these pro-
teins bind RNA and/or form part of RNPs are on the table. There are examples of enzymes
that post-transcriptionally regulate specific target mRNAs, such as cytosolic aconitase/IRP1
and GAPDH [59,61]. It has also been proposed that the RNAs could regulate those proteins,
by competing with substrates for enzyme binding sites, or as assembly scaffolds for alignment
of enzymes in a biochemical pathway [24]. Moreover, they can be part of the spatiotemporal
regulation of signaling molecules, as described for the sequestration of TORC1 in SGs during
heat stress [62]. Even though the role of those newly identified RBPs remains unknown, most
of them are clearly related to the osmotic stress response. An interesting example is the methyl-
glyoxal-catabolism enzyme Glo2, shown here to bind GPD1 and STL1 mRNAs. Cross-regula-
tion between the glycerol synthesis and methylglyoxal catabolism at multiple levels has already
been demonstrated [63–65]. Our present findings suggest new levels of this regulation.
Another candidate to be involved in posttranscriptional regulation would be the sodium
stress-response transcription factor Usv1 [66]. Our results suggest that many proteins associate
with mRNAs and possibly influence their fates, providing dense connections between different
layers of cellular regulation.
The Lsm1-7/Pat1 complex binds to stress-activated mRNAs and
coordinates their translation under osmotic stress
An unexpected finding was the enrichment of several components of Lsm1-7/Pat1 complex
binding GPD1 and STL1 mRNAs under osmotic stress conditions when these transcripts are
stabilized and actively translated [14,20]. The Lsm1-7/Pat1 complex is considered a conserved
player in 5’ to 3’ mRNA decay, linking deadenylation to decapping [41–43,67,68]. In yeast, this
complex preferentially binds U-rich tracts near the 3’ end of oligoadenylated rather than polya-
denylated mRNA [3,69,70]. Lsm1-7 is composed of seven Sm-like proteins forming a ring, and
it is the C-terminal extension of Lsm1 that approaches the RNA-binding pockets of Lsm1-7
enhancing the RNA binding properties of the core [70,71]. Pat1 is a multifunctional protein
interacting with several proteins involved in decapping, mRNA decay and translational repres-
sion, and the participation of the Lsm1-7/Pat1 complex in those processes has been reported
in several studies [41,45,47,72].
Here we corroborate that Lsm1 and Pat1, and probably the entire Lsm1-7/Pat1 complex,
are general translational repressors. Importantly, we show for the first time that this function
is stronger for specific mRNA groups. This is particularly obvious in weak to intermediate
osmotic stress (Fig 4), suggesting that the major role of Lsm1-7/Pat1 complex in translation
regulation is to permit balanced responses to environmental changes. First, we show that a
major role of Pat1 and Lsm1 binding GPD1 and STL1 mRNAs under osmotic stress is to
inhibit their translation. We cannot dismiss additional effects on mRNA decay and transcrip-
tion; but they may make minor contributions to the phenotype of lsm1 and pat1 mutants
under the conditions investigated here. This is supported by several observations: (a) pat1mutants overaccumulate Gpd1 protein in response to osmotic stress (Fig 4); (b) we did not
find other proteins related with mRNA decay interacting with the Lsm1-7/Pat1 complex
RBPs and stress-induced transcripts
PLOS Genetics | https://doi.org/10.1371/journal.pgen.1007563 July 30, 2018 16 / 30

significantly enriched together with STL1 and GPD1 mRNAs (S1 Table), such as Dcp1 and
Dcp2 decapping proteins, the CCR4-NOT deadenylation complex components, the Dhh1
DEAD-box helicase, or the Xrn1 5’-3’ exonuclease [41,42,72], nor the RNA pol II components
Rpb4 and Rpb7 [66]; (c) STL1 and GPD1 mRNA half-life did not change in pat1 mutants
under osmotic stress (Fig 2B); (d) a higher proportion of GPD1 and STL1 mRNAs is associated
to polysomes in pat1 and lsm1 mutants under osmotic stress (Fig 3 and S5 Fig), and (e) 5P-seq
analyses show increased presence of ribosomes on mRNAs around the translational start in
lsm1 and pat1 mutants (Fig 5).
Second, we show that the inhibition of translation mediated by Pat1 and Lsm1 is not homo-
geneous and affects more strongly specific mRNA subsets depending on cell condition. This is
supported by the following key findings: (a) the 5’-UTR ribosome overprotection showed by
pat1 and lsm1 mutants affects specific mRNA sets (S5 Table), moreover the affected mRNA
sets change between control and stress conditions; (b) under stress, pat1 and lsm1 mutants also
showed higher levels of some of the osmo-induced proteins than wt, and also they are already
induced at low hyperosmosis, when moderate or high osmostress are normally required for
strong induction in a wild-type strain (Fig 4). This last finding is consistent with the high
increment of 5’UTR ribosome overprotection in the pat1 and lsm1 mutants showed by the
OSR set (Fig 5C and S7B Fig) in non-stress conditions, which diminished with the stress; sug-
gesting that the most important effect of Lsm1 and Pat1 is to attenuate translation of these
mRNAs under conditions of no or weak stress. It is noteworthy that other mRNAs such as
QCR6 and HAC1 increase to higher levels during osmostress in pat1 mutants than in wt (S6
Fig), but the corresponding proteins still do not accumulate more in the mutant (Fig 4).
A scenario such as osmotic stress shows the relevance of coordination of the different layers
of gene regulation, to be able to respond in the right way to the changing environment and
produce the adequate levels of proteins needed for the adaptation fast but also on the proper
time. The cellular response to hyperosmotic shock has been shown to be graded with respect
to the severity of osmostress; the higher the osmolarity, the higher the amplitude and the lon-
ger the duration of the increased expression of stress proteins. Counterintuitively, mild
osmoshock produces a quicker expression response than severe osmoshock [34,73]. Imbal-
anced stress responses have several negative consequences for the cell viability and fitness. For
example, the overexpression of GPD1 with consequent high accumulation of glycerol does not
increase cell osmotolerance, but rather impairs growth in some cases [74,75].
Here we show that Pat1 and Lsm1 proteins have a notable effect, preventing overaccumula-
tion of the Gpd1 and Gpp2 proteins. These two enzymes form the short branch of glycolysis
involved in glycerol synthesis and are under expression control by the HOG pathway under
weak to moderate hyperosmosis. Moreover, the 5P-Seq data reveal that numerous mRNAs
encoding components of the pheromone response pathway accumulate ribosomes in their 5’-
UTR in pat1 and lsm1 mutant under osmotic stress. Among those identified mRNAs, we
found the kinase Fus3. The HOG and mating pathways share several components, yet exhibit
remarkable signal fidelity; hyperosmotic stress does not promote mating, and mating phero-
mones do not activate Hog1 [76]. To coordinate the two signals, the osmotic stress pathway
limits pheromone signaling in different ways: delaying the expression of pheromone-induced
genes, and promoting phosphorylation of Rck2 and Ste50 [77], to postpone its responsiveness.
This suggests that the control of the translation of mRNAs related with pheromone response
through Pat1 and Lsm1 might be another way of limiting cross-talk with this pathway. Alto-
gether, our study shows that the Lsm1-7/Pat1 complex thus has a role in the translational
induction regulation of stress proteins, and suggests that it regulates the accumulation of spe-
cific groups of proteins to coordinate and moderate the osmotic stress response.
RBPs and stress-induced transcripts
PLOS Genetics | https://doi.org/10.1371/journal.pgen.1007563 July 30, 2018 17 / 30

The translation repression mediated by Pat1 is dependent of Lsm1 and
probably of the entire Lsm1-7/Pat1 complex
In this study, we corroborate a role for Pat1 and Lsm1 as translation repressors. As previously
shown under other stress conditions such as glucose deprivation and amino acid starvation
[47,78], pat1 mutants also fail to inhibit global translation under moderate osmotic stress (S5
Fig). Moreover pat1 and lsm1 mutants both show a high proportion of polysomes (P/FM)
when the global translation is recovered after 30 min of osmotic stress (Fig 3A). Additionally,
we observe an abnormally high association of specific mRNAs to polysomes in pat1 and lsm1mutants under osmotic stress (Fig 3B). Importantly, those ribosomes are able to run off
mRNAs in assays done without CHX, indicating that they are not stalled and probably are in
active translation (Fig 3A and 3B, second column). In addition, the pat1 and lsm1 mutants
exhibit almost identical behaviors in our experiments where ribosome association is tested
such as polysome profiles and 5P-Seq (Figs 3 and 5). Based on all these results, we propose that
the translation repression mediated by Pat1 is dependent of the entire Lsm1-7/Pat1 complex,
in contrast to a model where Lsm1-7 is recruited to the mRNA after Pat1 inhibits translation
initiation [72]. This is supported by the fact that the Pat1 mid-domain and C-terminal domain
are essential for translation repression [72] and it is through the C-terminal domain that Pat1
interacts with Lsm2-3 [44,71]. In addition, the integrity of the Lsm1-7/Pat1 complex is
required for the recognition of oligoadenylated tails and total RNA binding activity, and it is in
the context of a complex that Pat1 directly interacts with RNA [79]. An alternative but not
mutually exclusive view is that the phenotypes in lsm1Δmutants are due to depletion of Pat1
from the cytoplasm, as Pat1 is known to localize in the nucleus in such mutants [80].
Our 5P-Seq analysis of the 5’-phosphorylated mRNA co-translational degradation interme-
diates, where only the properly decapped mRNAs are analyzed, shows ribosome overprotec-
tion in the 5’-UTRs in pat1 and lsm1 mutants (Fig 5). That only this subset of mRNAs is
analyzed is an inherent limitation of this technique [52]. As that protection is upstream of the
translation start, this cannot reflect ongoing translation, but could mean that these mRNAs are
more charged with preinitiation complexes in the absence of Lsm1 or Pat1. Sequencing of 5’
degradation intermediates has been shown to be capable of identifying binding of protein
complexes to the 5’-UTR of mRNAs [81,82]. Considering previous observations reporting
about Pat1, such as its association with ribosomes through its N-terminal domain, its sedimen-
tation rate consistent with interactions with the 48S complexes, and its reduction of translation
initiation by limiting the formation of a 48S preinitiation complex [72,83] rather than through
a global decapping defect, the high rate of translation of pat1 and lsm1 mutants in our work
may be interpreted as a consequence of maintaining a high level of 40S ribosomal subunit
recruitment to mRNAs. However, increased binding of other proteins or complexes than 48S
complexes cannot be excluded. It should be noted that in mutants defective in the Lsm1-7/
Pat1 complex, poly(A) tails are shorter [42]. This could mean decreased Pab1 binding in the
3’-UTR, which could indirectly affect recruitment of other proteins to the 5’-end of an actively
translating mRNA. Numerous factors determine the dynamics in translation between different
mRNAs, but initiation is rate limiting for most of them [84–86]. Initiation rates are dependent
on the accessibility of ribosomes to the start codon and their loading onto mRNA [87], and
this is in competition with the mRNA degradation machinery to be loaded.
We thus propose that the Lsm1-7/Pat1 complex associates with stress response mRNAs,
modulating their translation through limiting ribosomal access, which adds another level to
the adaptability of gene regulation during rapidly changing conditions, to promote cell survival
and fitness.
RBPs and stress-induced transcripts
PLOS Genetics | https://doi.org/10.1371/journal.pgen.1007563 July 30, 2018 18 / 30
Materials and methods
Growth conditions
Unless indicated, cells were grown at 30˚C till mid-log phase (OD600 0.4–0.5) in synthetic
medium supplemented with appropriate amino acids and 2% glucose as the carbon source. To
induce osmotic stress, KCl was added to the culture as specified in the Figure legends.
Construction of yeast strains by molecular genetics
The genotypes of all yeast strains used in this study are listed in S7 Table. The pat1-hphNTdeletion strains were generated as described [88].
The specific MS2 loop-tagged mRNAs were generated as described previously [31]. For
each gene to be tagged, a cassette loxP::Sphis5+::loxP::MS2L was obtained by PCR using
pLOSHIS5MS2L as a template (kind gift from Jeffrey E. Gerst, Weizmann Institute of Science,
Rehovot, Israel) [31] and the oligonucleotides listed in S8 Table. PCR products were trans-
formed into yeast and positive transformants were selected growing on SC plates lacking histi-
dine. To confirm integration, genomic DNA extracted from single colonies were analyzed by
both PCR and sequencing (using oligos complementary to the coding region before the MS2
loops and 3’-UTR after the MS2 loops, see S8 Table). To remove the Sphis5+ marker, positive
colonies were transformed with pSH47 (URA3marker), and Cre recombinase expression was
induced by growing transformed cells in YP rich medium containing 2% galactose for 2 h.
Yeast clones carrying loxP::MS2L integration were selected by the loss of ability to grow on SC
plates lacking histidine, and verified by PCR. Finally, the loss of pSH47 was promoted by grow-
ing the final positive transformants in YPD medium for 3 days and selecting for the ability to
grow in SC plates containing 100 mg/l 5-fluorouracil.
Fluorescence microscopy
To visualize the intracellular localization of the mRNA-MS2L, expression of GFP fusion pro-
tein was induced by methionine depletion (1 h) under non-stressed or osmotic stress condi-
tions (30 min, 0.6 M KCl). Where indicated, CHX was added to 100 μg/ml final concentration,
20 min prior to sampling in non-stressed conditions or prior to addition of KCl. After the
incubation time, cells were fixed with 4% formaldehyde and stored at 4˚C until analysis. The
images were captured in a Zeiss Axio Observer fluorescence microscope and processed with
ImageJ software (NIH). Cells with granules were counted using at least 200 cells for each
mRNA. The number of granules per cell was counted using at least 60 cells for each mRNA in
duplicate. Additionally, for the co-localization of the mRNA-MS2L with the PBs, cells were
transformed with Dcp2-RFP plasmid [37].
In vivo capture of RNPs associated with specific mRNA species
For the in vivo capture of specific RNPs [39], strains expressing a specific mRNA-MS2L (the
background strain not expressing an mRNA-MS2L was included as a negative control) were
transformed with the plasmid pMS2CP-GFP [31], which expresses the MS2 coat protein
(MS2-CP) fused with GFP under the MET25 promoter (provided by Jeffrey E Gerst). Yeast
cells were grown in 600 ml of SC liquid medium lacking histidine with constant shaking at
30˚C until OD600 1.0 was reached. Cells were collected by centrifugation, washed once with SC
medium lacking methionine and, transferred to SC medium lacking methionine during 1 h at
30˚C. To induce osmotic stress, KCl was added to 0.6 M KCl after 30 min of transferring the
cells and incubated for another 30 min.
RBPs and stress-induced transcripts
PLOS Genetics | https://doi.org/10.1371/journal.pgen.1007563 July 30, 2018 19 / 30

Cells were collected by centrifugation and washed once with PBS buffer lacking Ca2+ and
Mg2+. Crosslinking was done by resuspending cells in PBS buffer containing 0.05% formalde-
hyde and incubating at room temperature for 15 min with slow agitation. The cross-linking
reaction was terminated by adding glycine solution (pH 8.0) to 0.125 M and incubating for 5
min with slow shaking. Fixed cells were pelleted, washed with ice-cold PBS, quick-frozen in
dry ice PBS and kept at -80˚C until used. Cell pellets were resuspended in 1 ml per 100 OD600
units of ice cold lysis buffer [20 mM Tris-HCl pH 7.5, 150 mM NaCl, 1.8 mM MgCl2, 1 mM
DTT, 80 U/ml RNasin (Promega), 1 × protease inhibitor (Complete, Mini, EDTA-free,
Roche), 0.2% Triton X-100] and aliquoted in 0.5 ml/tube. An equal volume of 0.5 ml of glass
beads was added to each tube and cell were disrupted in a FastPrep device (Bio101), at inten-
sity setting 0.5 for 3 rounds of 30 s at 4˚C. Glass beads and cell debris were sedimented at RCF
1700 for 1 min at 4˚C, and the supernatants were transferred to a new microcentrifuge tube.
To clear the supernatant, a second centrifugation at RCF 15300 for 15 min at 4˚C was done.
Afterwards, the aliquots from the same sample were collected together and the protein concen-
tration was determined using the Bicinchoninic Acid (BCA) assay (Pierce). An aliquot was
kept as reference input sample.
For RNP capture, 30 mg of total protein was incubated with 100 μl of GFP-Trap beads
(ChromoTek), washed and prepared for RNA manipulation following the manufacturer’s
specifications, and 100 μg/ml of yeast tRNA (Sigma, R8508), for 3 h at 4˚C with gentle agita-
tion. After the RNP capture incubation, samples were washed 5 times with 1 × lysis buffer, and
finally RNP complexes were eluted from the beads by adding 120 μl of 1 × cross-link reversal
buffer (50 mM Tris-HCl pH 7.0, 5 mM EDTA, 10 mM DTT, 1% SDS) and incubating for 1 h
at 70˚C with agitation. 20 μl of eluted sample was kept for RNA determination and the remain-
ing volume was used for western blot or LC-MS/MS analysis. Three independent replicate
experiments were performed, for each tagged and untagged strain.
In vivo capture of RNPs associated with specific GFP tagged proteins
Pull-downs of RNPs using specific GFP tagged proteins [89] were done following a similar
protocol described above but with the following modifications. For the RNP capture, 300 μg of
total protein were incubated with 20 μl 50% GFP-Trap beads slurry. Elution from the beads
was done in 100 μl of 1 × cross-link reversal buffer. 80 μl of eluted samples was used for RNA
determination by qPCR. Three independent experiments were done for each strain.
Proteomics and data analysis
Protein samples were dried in a vacuum centrifuge after determination of protein concentra-
tion by the Qubit protein assay (ThermoFisher Scientific). After resuspension in SDS/PAGE
sample buffer, 9 μg of protein from each sample were fractionated in a 12% polyacrylamide/
SDS gel, and the gel was stained with colloidal Coomassie Blue. Afterwards, the bait protein
band was excised separately and the remainder of each gel lane divided into three pieces. Pro-
tein digestion was performed as described elsewhere [90], and the resulting peptide mixture
was dried in a vacuum centrifuge and resuspended in 0.1% trifluoroacetic acid (TFA), 2% ace-
tonitrile (ACN); 20 μl for the bait protein band and 9 μl for the other gel pieces.
Mass spectrometry (LC-MS/MS) analysis was performed by loading 5 μl of tryptic peptides
from each digestion mixture onto a trap column (NanoLC Column, 3 μm C18-CL, 75 μm × 15
cm; Eksigen), desalted with 0.1% TFA for 10 min at a flow rate of 2 μl/min, and transferred
onto an analytical column (LC Column, 3 μm C18-CL, 75 μm × 12 cm, Nikkyo) equilibrated
in 0.1% formic acid (FA) in 5% ACN. Elution was carried out with a linear gradient of 5% to
40% ACN (0.1% FA in ACN) at a flow rate of 300 nl/min. The gradient length was 45 min for
RBPs and stress-induced transcripts
PLOS Genetics | https://doi.org/10.1371/journal.pgen.1007563 July 30, 2018 20 / 30

the peptides generated from the bait protein band and 120 min for the peptides derived from
the other gel pieces. Mass spectrometry analysis was performed with a nanoESI qQTOF (5600
TripleTOF, AB Sciex) mass spectrometer. The instrument was operated in data-dependent
acquisition mode, in which a 250 ms TOF MS scan from 350–1250 m/z, was followed by 50 ms
product ion scans from 100–1500 m/z on the 50 most intense 2–5 charged ions.
MS/MS data were processed with ProteinPilot v4.5 (AB Sciex). Peak lists were generated
from the instrument wiff files using ProteinPilot default parameters. The peak lists derived
from the three gel pieces of each sample were combined to perform a single search whereas the
peak list obtained from the bait protein band was used on a separate search. Protein identifica-
tion was performed with the Paragon algorithm within ProteinPilot software using the Uni-
Prot database. The following parameters were used: trypsin specificity, cys-alkylation, no
taxonomy restriction, and the search effort set to thorough.
Protein identification and quantification
The number of peptides assigned to each protein with 95% confidence or higher as well as the
chromatographic intensity of each peptide are part of the ProteinPilot output. Both parameters
were used to estimate protein abundance. The first quantitative method was based on the top
three most intense peptides [91]. For the second quantitative method, the number of peptides
assigned to each protein normalized by its molecular weight was used, which provides similar
results to the emPAI calculation [92]. Two search results for each sample were obtained, one
for the bait protein band and another for the remainder of the SDS/PAGE gel lane. Thus, four
sets of quantitative values for each sample were generated, log transformed and normalized by
the median of each set. The two quantitative sets based on peptide count were combined, but
those based on peak intensity were treated individually. Three biological replicates were ana-
lyzed for each condition, and only proteins with quantitative values in at least two replicates
were considered. Statistical significance of the difference relative to the untagged strain was
calculated with a Student’s t-test analysis. Since proteins considered candidates to be differen-
tially abundant were to be validated by a different set of experiments, no FDR correction was
used. Differentially abundant proteins were selected as follows: only the proteins with mini-
mum 2 values in at least one mRNA-MS2L strain and significant p-value (< 0.05) were
included in the following sorting. For the subsequent filtering, the average of the normalized
values from the 3 biological replicates, ratios of mRNA-MS2L/untagged strain and the ratio
mRNA-MS2L (strain A)/mRNA-MS2L (strain B) were calculated.
Analysis of steady-state mRNA levels and mRNA stability
Total RNA extraction from cells was carried out using phenol-chloroform extraction and etha-
nol precipitation as previously described [15]. Samples from pull-downs were treated for 30
min at 37˚C with 0.2 μg/μl Proteinase K. RNA was extracted once with phenol:chloroform:iso-
amyl alcohol (25:24:1) and once with chloroform:isoamyl alcohol (24:1), and precipitated with
0.3 M sodium acetate, 2 volumes of 96% ethanol and 0.08 μg/μl glycogen. To extract the RNA
from the polysomal fractions, 16 mM EDTA and 0.4% SDS were added, one extraction with
phenol:chloroform:isoamyl alcohol (25:24:1) was performed, and RNA was precipitated twice,
once with cold 96% ethanol and next with 2.5 M LiCl.
Afterwards, RNA was treated with DNase I (Thermo Fisher) according to the manufactur-
er’s protocol. cDNA was synthesized in 20 μl reactions containing the DNase I treated RNA,
5 μM of oligo(dT) (Thermo Fisher), 200 units/μl of M-MLV RT (Thermo Fisher), 1 × First
Strand Buffer, 10 mM DTT, and 0.8 mM dNTPs. qPCR was performed in a reaction final vol-
ume of 10 μl using Eva Green (Solis) for fluorescent labeling, 2 μl cDNA, and 0.2 μM of the
RBPs and stress-induced transcripts
PLOS Genetics | https://doi.org/10.1371/journal.pgen.1007563 July 30, 2018 21 / 30
corresponding oligonucleotides (S8 Table). Real-time PCR reactions were performed under
the following conditions: 95˚C for 15 min to activate the polymerase, followed by 40 cycles of
10 s at 95˚C, 20 s at 60˚C, and 10 s at 72˚C. At the end of the amplification cycles, a melting
curve analysis was conducted to verify the specificity of the reaction. For each analyzed primer
pair, a negative control was included and a standard curve was made with serial dilutions of
cDNA samples pool (1/2, 1/5, 1/10, 1/25, 1/50, 1/100 and 1/500).
For measurement of mRNA stability, transcription was stopped by addition of 1,10-phe-
nantroline to 100 μg/ml, and samples were taken at different time points thereafter (0, 5, 10,
15, 25, 35 and 45 min) [35]. RNA was extracted and analyzed as described above.
Polysome analysis
Polyribosome analysis was performed as previously described [20]. Cells grown to mid-log
phase were treated with 0.1 mg/ml CHX and collected by centrifugation. Cells pellets were
lysate in lysis buffer (20 mM Tris-HCl, pH 8.0, 140 mM KCl, 5 mM MgCl2, 0.5 mM DTT, 1%
Triton X-100, 0.1 mg/ml CHX, and 0.5 mg/ml heparin) by bead bashing. Finally, glycerol was
added to the supernatant to a final concentration of 5%, and extracts were stored at -80˚C.
Samples of 10–12 A260 units were loaded onto 10 – 50% sucrose gradients and were separated
by ultracentrifugation for 2 h and 40 min at 35,000 rpm in a Beckman SW41Ti rotor at 4˚C.
Gradients were then fractionated and recorded using Density Gradient Fractionation System
and Isco UA-6 ultraviolet detector (Teledyne Isco, Lincoln, NE, USA). For runoff experiments,
cells and samples were handled as described above but CHX was omitted in both the lysis
buffer and the gradient solutions.
Detection of specific proteins by Western blot analysis and fluorescence
emission
Western blot was performed using standard protocols. Antibodies used were mouse anti-GFP
(1:1000, Roche), rat α-She2 (1:50, kind gift from Ralf Jansen, University of Tubingen, Ger-
many), α-mouse (1:5000, Sigma) and α-rat (1:500, Amersham) secondary antibodies conju-
gated to horseradish peroxidase.
Accumulation of GFP-tagged proteins was detected by recording green fluorescence emis-
sion (520 nm) in an Omega Polarstar fluorescence plate reader (LabVision). Plates were incu-
bated at 30˚C and measurements were taken automatically every 4 min for a period of 140
min. To normalize the data, OD600 measured from the same well at the same time than green
fluorescence and, was used to remove the effect of growth differences between strains.
Analysis of co-translational mRNA decay by global 5’P sequencing
Libraries for 5’-phosphate sequencing (5P-Seq) were prepared as specified [52] using 6 μg of
DNA-free total RNA. To select 5’-P mRNA degradation intermediates, samples were directly
subjected to selective ligation of a synthetic DNA/RNA oligo containing unique molecular
identifiers (UMIs); samples were incubated overnight at 16˚C with 20 units of T4 RNA ligase 1
(New England Biolabs) in the presence of 10 mM DNA/RNA rP5_RND oligo [52]. RNA integ-
rity was checked by electrophoresis in 1 × TAE agarose gel and ribosomal RNA was depleted
using Ribo-Zero Magnetic Gold Kit (Epicentre). PolyA-enriched RNA was fragmented at
80˚C for 5 min in the presence of RNA fragmentation buffer (40 mM Tris-acetate, pH 8.1, 100
mM KOAc, 30 mM MgOAc), and reverse transcribed with Superscript II (Life Technologies)
primed with random hexamers. The retrotranscription reaction was incubated for 10 min at
25˚C, 50 min at 42˚C and heat inactivated for 15 min at 72˚C. Second strand cDNA synthesis
was performed by a single PCR cycle (1 min at 98˚C; 2 min at 50˚C and 15 min at 72˚C) using
RBPs and stress-induced transcripts
PLOS Genetics | https://doi.org/10.1371/journal.pgen.1007563 July 30, 2018 22 / 30

Phusion High-Fidelity PCR Master Mix with HF Buffer (New England Biolabs) and priming
with BioNotI-P5-PET [52]. From this point onwards, libraries were generated as described
previously [93]. Briefly, double-stranded cDNA was first purified using HighPrep beads (Mag-
bio) and then bound to Dynabeads M-280 Streptavidin beads (Life Technologies) according to
the manufacturer’s instructions. Bound DNA molecules were successively washed and sub-
jected to repair of ends, dA addition and adaptor ligation using Nebnext DNA Library Prep
Master Mix (NEB). 0.5 μl of common adapter (2.5 μM) was ligated to each sample. The com-
mon adapter was prepared by annealing P7MPX_linker_for and P7MPX_linker_rev [52].
Beads were washed and subjected to PCR amplification [30 s 98˚C; 19 cycles of (20 s 98˚C, 30 s
65˚C, 30 s 72˚C); 5 min 72˚C] using Phusion High-Fidelity PCR Master Mix with HF Buffer
(NEB) and 0.1 μM final concentration of PCR-PE 1.0 and the appropriate PE2_MTX [52].
Libraries were quantified by Qubit using the dsDNA HS assay kit and the size was checked
using a RNA Bioanalyzer. A 5P-Seq pool was made mixing 8 ng of each amplified 5P-Seq
library, and was size selected using 0.6 × - 0.9 × (v/v) HighPrep beads (Magbio) to 300 – 500
bp. The 5P-Seq pool was sequenced using an Illumina NextSeq 500 High Output Kit v2.
Sequence analysis
We trimmed the first 8 nt off each read (containing the unique molecular identifier, UMI) and
aligned the rest to the S. cerevisiae genome (R64-1-1). For mapping, we used Hisat2 with
default parameters (except maximum intron size set to 2 kb). Reads with identical 5’mapping
site and UMI were considered PCR duplicates, and collapsed. To compute gene-specific paus-
ing we generated count tables for each gene for the 45 nt regions upstream. Only genes with at
least 20 5P-Seq read in the defined regions were considered for the analysis. Raw and pro-
cessed sequencing data are deposited at GEO with accession number GSE107250.
Supporting information
S1 Fig. Verification of genomic MS2L tagging and checking the expression of
mRNA-MS2L. A) Checking the genomic tagging by PCR using primers flanking MS2 loops
integration site. The presence of integrated MS2 loops was indicated by PCR amplification of a
1 kb fragment. B) Checking the expression of mRNA-MS2L by qPCR, in control conditions
(without stress) and after 30 min of 0.6 M KCl. C) Time course expression of STL1-MS2L and
GPD1-MS2L mRNA levels under osmotic stress expressed in log2 E-ΔΔCt. In B) and C) the level
of ACT1 housekeeping mRNA was used as a reference. D) Percentage native (wt strain) and
MS2L tagged STL1 and GPD1 mRNAs associated to polysomes after 30 min of osmotic stress
(FM, free and monosome fractions; P, polysome fraction). Average and standard error (SE)
from three biological replicates are shown.
(PDF)
S2 Fig. Intracellular localization of the MS2L-mRNAs. The localization was monitored by
visualization of green fluorescence emitted by MS2-CP-GFP fusion protein bound to
them. A) Fluorescence microscopy images to show localization of MS2L-mRNA after induc-
tion of the MS2-CP-GFP protein expression by methionine depletion under normal (SC met-,
1 h) and osmotic stress conditions (with and without addition of CHX). B) Quantification of
the percentage of cells with granules and number of granules per cell. Where indicated, CHX
was added 20 min prior to sampling (control conditions) or prior to stress (0.6 M KCl). C)
Fluorescence microscopy merge images of cells expressing MS2L-mRNAs (green) and the PB
marker Dcp2p (Dcp2p-RFP plasmid, red), under osmotic stress conditions (0.6 M KCl, 30
min). The percentage of granules with colocalization of green and red fluorescence is indicated
RBPs and stress-induced transcripts
PLOS Genetics | https://doi.org/10.1371/journal.pgen.1007563 July 30, 2018 23 / 30

beside the images. At least 100 cells were analyzed for each strain. D) Percentage of cells con-
taining Dcp2-RFP foci in cells expressing MS2L-mRNAs, under osmotic stress conditions.
Samples were taken at different time points (0, 15, and 30 min) after addition of 0.6 M KCl,
and at least 100 cells were analyzed in each. The experiment was done in duplicate or triplicate,
with the exception of the ASH1-MS2L strain. Average and standard error (SE) from the repli-
cates are shown. Statistical analyses were performed using Student’s t-test of comparisons
between strain without MS2L and MS2L-mRNAs strains, and no significant difference was
found between samples (all p-values > 0.1).
(PDF)
S3 Fig. Testing the RNP capture using ASH1-MS2L strain. A) Fusion protein (GFP) and
She2 protein binding specifically to ASH1 mRNA were detected by western blot. B) PCR detec-
tion using ASH1 ORF primers of ASH1-MS2L mRNA and native ASH1 mRNA in the tagged
and untagged (BY) strains, respectively, both expressing the MS2CP-GFP fusion protein.
Detection was made in extracts before the pull-down (Input, I) and in the pull-down samples
(PD).
(PDF)
S4 Fig. HYP2 mRNA association to polysomes at 30 min of osmotic stress (0.6 M KCl) for
wt (blue line), pat1 (red line) and lsm1 (green line) strains. Ratios between polysomal and
sub-polysomal fraction (P/FM) is represented in the right column chart. Average and standard
error (SE) from three biological replicates are shown.
(PDF)
S5 Fig. A) Polysome profiles of a time course experiment under osmotic stress (0.6 M
KCl) in pat1 mutant and wt strains. Ratio P/FM between polysomal (P, fractions 3–8) and
sub-polysomal fraction (FM, fractions 1–2) is indicated below each profile. B) Detection of
specific mRNA association to the fractions along the gradient by qPCR. Ratios between polyso-
mal and sub-polysomal fraction (P/FM) at each time for wt (blue bars) and pat1 (red bars)
strains are represented in the right column charts. For STL1 and GPD1 mRNAs, time 0 was
not analyzable because of their low levels under non-stress conditions.
(PDF)
S6 Fig. mRNA levels from GFP-tagged strains for the same genes for which the levels of
tagged proteins were assayed under osmotic stress (0.6 M KCl; Fig 4), expressed as incre-
ment relative to time 0, using ACT1 as reference mRNA.
(PDF)
S7 Fig. A) Histograms showing the total number of 5P-seq reads in each reading frame in
the 5’UTR (in blue, window of 80 nt before the start codon) and in coding regions (in pink,
window of 80 nt from the start codon), under control conditions (without stress) and after
30 min of osmotic stress. Number of readings are included for each bar. B) Scatter plots dis-
playing 5P-seq values for lsm1 mutant (Y-axis) and wt (X-axis) strains. The scatter plots repre-
sent the log2 ratios between window areas around the start codon (uSvsdS) or the stop codon
(uEvsdE) without (upper panels) and with osmotic stress (bottom panels).
(PDF)
S1 Table. Interaction of other proteins related to mRNA decay with STL1 and GPD1mRNAs, data from MS experiments.
(DOCX)
RBPs and stress-induced transcripts
PLOS Genetics | https://doi.org/10.1371/journal.pgen.1007563 July 30, 2018 24 / 30

S2 Table. Translation efficiency for single genes in wt strain and pat1 mutant, calculated as
the ratio between the areas under the curve of mRNA and protein after osmotic stress (0.6
M KCl). The area was calculated till 60 min under osmotic stress and till the levels reached a
plateau, for mRNA and for protein respectively (Fig 4 and S6 Fig).
(DOC)
S3 Table. Relative 5P-seq protection in the 5’UTR region in pat1 mutants for the mRNAs
for which protein synthesis is analyzed in Fig 4.
(DOC)
S4 Table. Mann-Whitney test of increased difference of mRNA 5P-seq coverage in mutants
vs. wt in OSR vs. main group shown in Fig 5C.
(DOC)
S5 Table. GO term analysis (http://babelomics.bioinfo.cipf.es/) for ranked mRNAs based
on their fold change of 5’-UTR ribosome accumulation in lsm1 and pat1 mutants relative
to wt (calculated as log2 [uSvsdSmutants/uSvsdSwt]) in control conditions and under osmotic
stress (0.6 M KCl, 30 min).
(XLSX)
S6 Table. Osmotic stress induced genes. Lists were generated using a compendium of several
previously published mRNA data [14,34,94,95].
(XLSX)
S7 Table. Yeast strains used in this study.
(DOC)
S8 Table. Oligonucleotides used in this study (plasmid sequence underlined).
(DOC)
S1 Dataset. Data for Figs 2–4.
(XLSX)
S2 Dataset. Data for Fig 5A.
(XLSX)
S3 Dataset. Data for Fig 5B and 5C and for S7B Fig.
(XLSX)
S4 Dataset. Data for all other supplementary figs.
(XLSX)
Acknowledgments
We thank. J. E. Gerst for the pLOSHIS5MS2L and pCP-GFP plasmids, R. Jansen for the anti-
She2 antibody, and R. Parker for the Dcp2-RFP plasmid. We thank Cristian Garcia Ruiz and
Katrin Kreisel for helping with strain construction and stability experiments, and O. Antunez
from the Proteomics Service SCSIE (Universitat de València) for the LC-MS/MS analysis.
Author Contributions
Conceptualization: Elena Garre, Paula Alepuz, Per Sunnerhagen.
Formal analysis: Elena Garre, Per Sunnerhagen.
RBPs and stress-induced transcripts
PLOS Genetics | https://doi.org/10.1371/journal.pgen.1007563 July 30, 2018 25 / 30

Funding acquisition: Vicent Pelechano, Manuel Sanchez del Pino, Paula Alepuz, Per
Sunnerhagen.
Investigation: Elena Garre.
Methodology: Elena Garre, Vicent Pelechano, Manuel Sanchez del Pino.
Project administration: Per Sunnerhagen.
Resources: Manuel Sanchez del Pino, Per Sunnerhagen.
Software: Vicent Pelechano.
Supervision: Per Sunnerhagen.
Visualization: Elena Garre, Vicent Pelechano.
Writing – original draft: Elena Garre, Per Sunnerhagen.
Writing – review & editing: Elena Garre, Vicent Pelechano, Paula Alepuz, Per Sunnerhagen.
References1. Li JJ, Biggin MD (2015) Gene expression. Statistics requantitates the central dogma. Science 347:
1066–1067. https://doi.org/10.1126/science.aaa8332 PMID: 25745146
2. Hogan DJ, Riordan DP, Gerber AP, Herschlag D, Brown PO (2008) Diverse RNA-binding proteins inter-
act with functionally related sets of RNAs, suggesting an extensive regulatory system. PLoS Biol 6:
e255. https://doi.org/10.1371/journal.pbio.0060255 PMID: 18959479
3. Mitchell SF, Jain S, She M, Parker R (2013) Global analysis of yeast mRNPs. Nat Struct Mol Biol 20:
127–133. https://doi.org/10.1038/nsmb.2468 PMID: 23222640
4. Tsvetanova NG, Klass DM, Salzman J, Brown PO (2010) Proteome-wide search reveals unexpected
RNA-binding proteins in Saccharomyces cerevisiae. PLoS One 5: e12671. https://doi.org/10.1371/
journal.pone.0012671 PMID: 20844764
5. Jin N, Jin Y, Weisman LS (2017) Early protection to stress mediated by CDK-dependent PI3,5P2 signal-
ing from the vacuole/lysosome. J Cell Biol 216: 2075–2090. https://doi.org/10.1083/jcb.201611144
PMID: 28637746
6. McCarthy JE (1998) Posttranscriptional control of gene expression in yeast. Microbiol Mol Biol Rev 62:
1492–1553. PMID: 9841679
7. Peretti D, Bastide A, Radford H, Verity N, Molloy C, et al. (2015) RBM3 mediates structural plasticity
and protective effects of cooling in neurodegeneration. Nature 518: 236–239. https://doi.org/10.1038/
nature14142 PMID: 25607368
8. Ambrosone A, Costa A, Leone A, Grillo S (2012) Beyond transcription: RNA-binding proteins as emerg-
ing regulators of plant response to environmental constraints. Plant Sci 182: 12–18. https://doi.org/10.
1016/j.plantsci.2011.02.004 PMID: 22118611
9. Uniacke J, Holterman CE, Lachance G, Franovic A, Jacob MD, et al. (2012) An oxygen-regulated switch
in the protein synthesis machinery. Nature 486: 126–129. https://doi.org/10.1038/nature11055 PMID:
22678294
10. Kershaw CJ, Costello JL, Castelli LM, Talavera D, Rowe W, et al. (2015) The yeast La related protein
Slf1p is a key activator of translation during the oxidative stress response. PLoS Genet 11: e1004903.
https://doi.org/10.1371/journal.pgen.1004903 PMID: 25569619
11. Sheikh MS, Fornace AJ Jr. (1999) Regulation of translation initiation following stress. Oncogene 18:
6121–6128. https://doi.org/10.1038/sj.onc.1203131 PMID: 10557103
12. Lackner DH, Schmidt MW, Wu S, Wolf DA, Bahler J (2012) Regulation of transcriptome, translation,
and proteome in response to environmental stress in fission yeast. Genome Biol 13: R25. https://doi.
org/10.1186/gb-2012-13-4-r25 PMID: 22512868
13. Warringer J, Hult M, Regot S, Posas F, Sunnerhagen P (2010) The HOG pathway dictates the short-
term translational response after hyperosmotic shock. Mol Biol Cell 21: 3080–3092. https://doi.org/10.
1091/mbc.E10-01-0006 PMID: 20587780
14. Romero-Santacreu L, Moreno J, Perez-Ortın JE, Alepuz P (2009) Specific and global regulation of
mRNA stability during osmotic stress in Saccharomyces cerevisiae. RNA 15: 1110–1120. https://doi.
org/10.1261/rna.1435709 PMID: 19369426
RBPs and stress-induced transcripts
PLOS Genetics | https://doi.org/10.1371/journal.pgen.1007563 July 30, 2018 26 / 30
15. Garre E, Romero-Santacreu L, Barneo-Muñoz M, Miguel A, Perez-Ortın JE, et al. (2013) Nonsense-
mediated mRNA decay controls the changes in yeast ribosomal protein pre-mRNAs levels upon
osmotic stress. PLoS One 8: e61240. https://doi.org/10.1371/journal.pone.0061240 PMID: 23620734
16. Philippe C, Dubrac A, Quelen C, Desquesnes A, Van Den Berghe L, et al. (2016) PERK mediates the
IRES-dependent translational activation of mRNAs encoding angiogenic growth factors after ischemic
stress. Sci Signal 9: ra44. https://doi.org/10.1126/scisignal.aaf2753 PMID: 27141928
17. Gerashchenko MV, Lobanov AV, Gladyshev VN (2012) Genome-wide ribosome profiling reveals com-
plex translational regulation in response to oxidative stress. Proc Natl Acad Sci USA 109: 17394–
17399. https://doi.org/10.1073/pnas.1120799109 PMID: 23045643
18. Wurth L, Gebauer F (2015) RNA-binding proteins, multifaceted translational regulators in cancer. Bio-
chim Biophys Acta 1849: 881–886. https://doi.org/10.1016/j.bbagrm.2014.10.001 PMID: 25316157
19. Aulas A, Caron G, Gkogkas CG, Mohamed NV, Destroismaisons L, et al. (2015) G3BP1 promotes
stress-induced RNA granule interactions to preserve polyadenylated mRNA. J Cell Biol 209: 73–84.
https://doi.org/10.1083/jcb.201408092 PMID: 25847539
20. Garre E, Romero-Santacreu L, De Clercq N, Blasco N, Sunnerhagen P, et al. (2012) The yeast mRNA
cap-binding protein Cbc1/Sto1 is necessary for rapid reprogramming of translation after hyperosmotic
shock. Mol Biol Cell 23: 137–150. https://doi.org/10.1091/mbc.E11-05-0419 PMID: 22072789
21. Protter DS, Parker R (2016) Principles and properties of stress granules. Trends Cell Biol 26: 668–679.
https://doi.org/10.1016/j.tcb.2016.05.004 PMID: 27289443
22. Hafner M, Landthaler M, Burger L, Khorshid M, Hausser J, et al. (2010) Transcriptome-wide identifica-
tion of RNA-binding protein and microRNA target sites by PAR-CLIP. Cell 141: 129–141. https://doi.
org/10.1016/j.cell.2010.03.009 PMID: 20371350
23. Klass DM, Scheibe M, Butter F, Hogan GJ, Mann M, et al. (2013) Quantitative proteomic analysis
reveals concurrent RNA-protein interactions and identifies new RNA-binding proteins in Saccharomy-
ces cerevisiae. Genome Res 23: 1028–1038. https://doi.org/10.1101/gr.153031.112 PMID: 23636942
24. Beckmann BM, Horos R, Fischer B, Castello A, Eichelbaum K, et al. (2015) The RNA-binding prote-
omes from yeast to man harbour conserved enigmRBPs. Nat Commun 6: 10127. https://doi.org/10.
1038/ncomms10127 PMID: 26632259
25. Reichel M, Liao Y, Rettel M, Ragan C, Evers M, et al. (2016) In planta determination of the mRNA-bind-
ing proteome of Arabidopsis etiolated seedlings. Plant Cell 28: 2435–2452. https://doi.org/10.1105/tpc.
16.00562 PMID: 27729395
26. Sysoev VO, Fischer B, Frese CK, Gupta I, Krijgsveld J, et al. (2016) Global changes of the RNA-bound
proteome during the maternal-to-zygotic transition in Drosophila. Nat Commun 7: 12128. https://doi.
org/10.1038/ncomms12128 PMID: 27378189
27. Liepelt A, Naarmann-de Vries IS, Simons N, Eichelbaum K, Fohr S, et al. (2016) Identification of RNA-
binding proteins in macrophages by interactome capture. Mol Cell Proteomics 15: 2699–2714. https://
doi.org/10.1074/mcp.M115.056564 PMID: 27281784
28. Slobodin B, Gerst JE (2010) A novel mRNA affinity purification technique for the identification of inter-
acting proteins and transcripts in ribonucleoprotein complexes. RNA 16: 2277–2290. https://doi.org/10.
1261/rna.2091710 PMID: 20876833
29. Rogell B, Fischer B, Rettel M, Krijgsveld J, Castello A, et al. (2017) Specific RNP capture with antisense
LNA/DNA mixmers. RNA 23: 1290–1302. https://doi.org/10.1261/rna.060798.117 PMID: 28476952
30. Panchapakesan SS, Ferguson ML, Hayden EJ, Chen X, Hoskins AA, et al. (2017) Ribonucleoprotein
purification and characterization using RNA Mango. RNA 23: 1592–1599 https://doi.org/10.1261/rna.
062166.117 PMID: 28747322
31. Haim L, Zipor G, Aronov S, Gerst JE (2007) A genomic integration method to visualize localization of
endogenous mRNAs in living yeast. Nat Methods 4: 409–412. https://doi.org/10.1038/nmeth1040
PMID: 17417645
32. de Nadal E, Casadome L, Posas F (2003) Targeting the MEF2-like transcription factor Smp1 by the
stress-activated Hog1 mitogen-activated protein kinase. Mol Cell Biol 23: 229–237. https://doi.org/10.
1128/MCB.23.1.229-237.2003 PMID: 12482976
33. Rep M, Reiser V, Gartner U, Thevelein JM, Hohmann S, et al. (1999) Osmotic stress-induced gene
expression in Saccharomyces cerevisiae requires Msn1p and the novel nuclear factor Hot1p. Mol Cell
Biol 19: 5474–5485. PMID: 10409737
34. Posas F, Chambers JR, Heyman JA, Hoeffler JP, de Nadal E, et al. (2000) The transcriptional response
of yeast to saline stress. J Biol Chem 275: 17249–17255. https://doi.org/10.1074/jbc.M910016199
PMID: 10748181
RBPs and stress-induced transcripts
PLOS Genetics | https://doi.org/10.1371/journal.pgen.1007563 July 30, 2018 27 / 30

35. Molin C, Jauhiainen A, Warringer J, Nerman O, Sunnerhagen P (2009) mRNA stability changes pre-
cede changes in steady-state mRNA amounts during hyperosmotic stress. RNA 15: 600–614. https://
doi.org/10.1261/rna.1403509 PMID: 19223440
36. Lui J, Castelli LM, Pizzinga M, Simpson CE, Hoyle NP, et al. (2014) Granules harboring translationally
active mRNAs provide a platform for P-body formation following stress. Cell Rep 9: 944–954. https://
doi.org/10.1016/j.celrep.2014.09.040 PMID: 25437551
37. Sheth U, Parker R (2003) Decapping and decay of messenger RNA occur in cytoplasmic processing
bodies. Science 300: 805–808. https://doi.org/10.1126/science.1082320 PMID: 12730603
38. Olivier C, Poirier G, Gendron P, Boisgontier A, Major F, et al. (2005) Identification of a conserved RNA
motif essential for She2p recognition and mRNA localization to the yeast bud. Mol Cell Biol 25: 4752–
4766. https://doi.org/10.1128/MCB.25.11.4752-4766.2005 PMID: 15899876
39. Slobodin B, Gerst JE (2011) RaPID: an aptamer-based mRNA affinity purification technique for the
identification of RNA and protein factors present in ribonucleoprotein complexes. Methods Mol Biol
714: 387–406. https://doi.org/10.1007/978-1-61779-005-8_24 PMID: 21431754
40. Vindry C, Marnef A, Broomhead H, Twyffels L, Ozgur S, et al. (2017) Dual RNA processing roles of
Pat1b via cytoplasmic Lsm1-7 and nuclear Lsm2-8 complexes. Cell Rep 20: 1187–1200. https://doi.
org/10.1016/j.celrep.2017.06.091 PMID: 28768202
41. Tharun S, Parker R (2001) Targeting an mRNA for decapping: displacement of translation factors and
association of the Lsm1p-7p complex on deadenylated yeast mRNAs. Mol Cell 8: 1075–1083. PMID:
11741542
42. Tharun S, He W, Mayes AE, Lennertz P, Beggs JD, et al. (2000) Yeast Sm-like proteins function in
mRNA decapping and decay. Nature 404: 515–518. https://doi.org/10.1038/35006676 PMID:
10761922
43. Chowdhury A, Tharun S (2009) Activation of decapping involves binding of the mRNA and facilitation of
the post-binding steps by the Lsm1-7-Pat1 complex. RNA 15: 1837–1848. https://doi.org/10.1261/rna.
1650109 PMID: 19643916
44. Wu D, Muhlrad D, Bowler MW, Jiang S, Liu Z, et al. (2014) Lsm2 and Lsm3 bridge the interaction of the
Lsm1-7 complex with Pat1 for decapping activation. Cell Res 24: 233–246. https://doi.org/10.1038/cr.
2013.152 PMID: 24247251
45. Pilkington GR, Parker R (2008) Pat1 contains distinct functional domains that promote P-body assem-
bly and activation of decapping. Mol Cell Biol 28: 1298–1312. https://doi.org/10.1128/MCB.00936-07
PMID: 18086885
46. Nissan T, Parker R (2008) Analyzing P-bodies in Saccharomyces cerevisiae. Methods Enzymol 448:
507–520. https://doi.org/10.1016/S0076-6879(08)02625-6 PMID: 19111192
47. Coller J, Parker R (2005) General translational repression by activators of mRNA decapping. Cell 122:
875–886. https://doi.org/10.1016/j.cell.2005.07.012 PMID: 16179257
48. Sweet T, Kovalak C, Coller J (2012) The DEAD-box protein Dhh1 promotes decapping by slowing ribo-
some movement. PLoS Biol 10: e1001342. https://doi.org/10.1371/journal.pbio.1001342 PMID:
22719226
49. Ghaemmaghami S, Huh WK, Bower K, Howson RW, Belle A, et al. (2003) Global analysis of protein
expression in yeast. Nature 425: 737–741. https://doi.org/10.1038/nature02046 PMID: 14562106
50. Jungfleisch J, Nedialkova DD, Dotu I, Sloan KE, Martinez-Bosch N, et al. (2017) A novel translational
control mechanism involving RNA structures within coding sequences. Genome Res 27: 95–106.
https://doi.org/10.1101/gr.209015.116 PMID: 27821408
51. Pelechano V, Wei W, Steinmetz LM (2015) Widespread co-translational RNA decay reveals ribosome
dynamics. Cell 161: 1400–1412. https://doi.org/10.1016/j.cell.2015.05.008 PMID: 26046441
52. Pelechano V, Wei W, Steinmetz LM (2016) Genome-wide quantification of 5’-phosphorylated mRNA
degradation intermediates for analysis of ribosome dynamics. Nat Protoc 11: 359–376. https://doi.org/
10.1038/nprot.2016.026 PMID: 26820793
53. Castello A, Fischer B, Eichelbaum K, Horos R, Beckmann BM, et al. (2012) Insights into RNA biology
from an atlas of mammalian mRNA-binding proteins. Cell 149: 1393–1406. https://doi.org/10.1016/j.
cell.2012.04.031 PMID: 22658674
54. Leppek K, Stoecklin G (2014) An optimized streptavidin-binding RNA aptamer for purification of ribonu-
cleoprotein complexes identifies novel ARE-binding proteins. Nucleic Acids Res 42: e13. https://doi.
org/10.1093/nar/gkt956 PMID: 24157833
55. Garcia JF, Parker R (2015) MS2 coat proteins bound to yeast mRNAs block 5’ to 3’ degradation and
trap mRNA decay products: implications for the localization of mRNAs by MS2-MCP system. RNA 21:
1393–1395. https://doi.org/10.1261/rna.051797.115 PMID: 26092944
RBPs and stress-induced transcripts
PLOS Genetics | https://doi.org/10.1371/journal.pgen.1007563 July 30, 2018 28 / 30

56. Tutucci E, Vera M, Biswas J, Garcia J, Parker R, et al. (2018) An improved MS2 system for accurate
reporting of the mRNA life cycle. Nat Methods 15: 81–89. https://doi.org/10.1038/nmeth.4502 PMID:
29131164
57. Haimovich G, Zabezhinsky D, Haas B, Slobodin B, Purushothaman P, et al. (2016) Use of the MS2
aptamer and coat protein for RNA localization in yeast: A response to "MS2 coat proteins bound to
yeast mRNAs block 5’ to 3’ degradation and trap mRNA decay products: implications for the localization
of mRNAs by MS2-MCP system". RNA 22: 660–666. https://doi.org/10.1261/rna.055095.115 PMID:
26968626
58. Youk H, Raj A, van Oudenaarden A (2010) Imaging single mRNA molecules in yeast. Methods Enzymol
470: 429–446. https://doi.org/10.1016/S0076-6879(10)70017-3 PMID: 20946820
59. Hentze MW, Preiss T (2010) The REM phase of gene regulation. Trends Biochem Sci 35: 423–426.
https://doi.org/10.1016/j.tibs.2010.05.009 PMID: 20554447
60. Scherrer T, Mittal N, Janga SC, Gerber AP (2010) A screen for RNA-binding proteins in yeast indicates
dual functions for many enzymes. PLoS One 5: e15499. https://doi.org/10.1371/journal.pone.0015499
PMID: 21124907
61. Wallander ML, Leibold EA, Eisenstein RS (2006) Molecular control of vertebrate iron homeostasis by
iron regulatory proteins. Biochim Biophys Acta 1763: 668–689. https://doi.org/10.1016/j.bbamcr.2006.
05.004 PMID: 16872694
62. Takahara T, Maeda T (2012) Transient sequestration of TORC1 into stress granules during heat stress.
Mol Cell 47: 242–252. https://doi.org/10.1016/j.molcel.2012.05.019 PMID: 22727621
63. Inoue Y, Tsujimoto Y, Kimura A (1998) Expression of the glyoxalase I gene of Saccharomyces cerevi-
siae is regulated by high osmolarity glycerol mitogen-activated protein kinase pathway in osmotic stress
response. J Biol Chem 273: 2977–2983. PMID: 9446611
64. Aguilera J, Rodrıguez-Vargas S, Prieto JA (2005) The HOG MAP kinase pathway is required for the
induction of methylglyoxal-responsive genes and determines methylglyoxal resistance in Saccharomy-
ces cerevisiae. Mol Microbiol 56: 228–239. https://doi.org/10.1111/j.1365-2958.2005.04533.x PMID:
15773992
65. Aguilera J, Prieto JA (2004) Yeast cells display a regulatory mechanism in response to methylglyoxal.
FEMS Yeast Res 4: 633–641. https://doi.org/10.1016/j.femsyr.2003.12.007 PMID: 15040952
66. Harel-Sharvit L, Eldad N, Haimovich G, Barkai O, Duek L, et al. (2010) RNA polymerase II subunits link
transcription and mRNA decay to translation. Cell 143: 552–563. https://doi.org/10.1016/j.cell.2010.10.
033 PMID: 21074047
67. Chowdhury A, Tharun S (2008) lsm1 mutations impairing the ability of the Lsm1p-7p-Pat1p complex to
preferentially bind to oligoadenylated RNA affect mRNA decay in vivo. RNA 14: 2149–2158. https://doi.
org/10.1261/rna.1094208 PMID: 18719247
68. Bouveret E, Rigaut G, Shevchenko A, Wilm M, Seraphin B (2000) A Sm-like protein complex that partic-
ipates in mRNA degradation. EMBO J 19: 1661–1671. https://doi.org/10.1093/emboj/19.7.1661 PMID:
10747033
69. He W, Parker R (2001) The yeast cytoplasmic LsmI/Pat1p complex protects mRNA 3’ termini from par-
tial degradation. Genetics 158: 1445–1455. PMID: 11514438
70. Chowdhury A, Mukhopadhyay J, Tharun S (2007) The decapping activator Lsm1p-7p-Pat1p complex
has the intrinsic ability to distinguish between oligoadenylated and polyadenylated RNAs. RNA 13:
998–1016. https://doi.org/10.1261/rna.502507 PMID: 17513695
71. Sharif H, Conti E (2013) Architecture of the Lsm1-7-Pat1 complex: a conserved assembly in eukaryotic
mRNA turnover. Cell Rep 5: 283–291. https://doi.org/10.1016/j.celrep.2013.10.004 PMID: 24139796
72. Nissan T, Rajyaguru P, She M, Song H, Parker R (2010) Decapping activators in Saccharomyces cere-
visiae act by multiple mechanisms. Mol Cell 39: 773–783. https://doi.org/10.1016/j.molcel.2010.08.025
PMID: 20832728
73. Van Wuytswinkel O, Reiser V, Siderius M, Kelders MC, Ammerer G, et al. (2000) Response of Saccha-
romyces cerevisiae to severe osmotic stress: evidence for a novel activation mechanism of the HOG
MAP kinase pathway. Mol Microbiol 37: 382–397. PMID: 10931333
74. Cambon B, Monteil V, Remize F, Camarasa C, Dequin S (2006) Effects of GPD1 overexpression in
Saccharomyces cerevisiae commercial wine yeast strains lacking ALD6 genes. Appl Environ Microbiol
72: 4688–4694. https://doi.org/10.1128/AEM.02975-05 PMID: 16820460
75. Oliveira BM, Barrio E, Querol A, Perez-Torrado R (2014) Enhanced enzymatic activity of glycerol-3-
phosphate dehydrogenase from the cryophilic Saccharomyces kudriavzevii. PLoS One 9: e87290.
https://doi.org/10.1371/journal.pone.0087290 PMID: 24498063
76. Hohmann S (2002) Osmotic stress signaling and osmoadaptation in yeasts. Microbiol Mol Biol Rev 66:
300–372. https://doi.org/10.1128/MMBR.66.2.300-372.2002 PMID: 12040128
RBPs and stress-induced transcripts
PLOS Genetics | https://doi.org/10.1371/journal.pgen.1007563 July 30, 2018 29 / 30

77. Nagiec MJ, Dohlman HG (2012) Checkpoints in a yeast differentiation pathway coordinate signaling
during hyperosmotic stress. PLoS Genet 8: e1002437. https://doi.org/10.1371/journal.pgen.1002437
PMID: 22242015
78. Holmes LE, Campbell SG, De Long SK, Sachs AB, Ashe MP (2004) Loss of translational control in
yeast compromised for the major mRNA decay pathway. Mol Cell Biol 24: 2998–3010. https://doi.org/
10.1128/MCB.24.7.2998-3010.2004 PMID: 15024087
79. Chowdhury A, Kalurupalle S, Tharun S (2014) Pat1 contributes to the RNA binding activity of the Lsm1-
7-Pat1 complex. RNA 20: 1465–1475. https://doi.org/10.1261/rna.045252.114 PMID: 25035297
80. Teixeira D, Parker R (2007) Analysis of P-body assembly in Saccharomyces cerevisiae. Mol Biol Cell
18: 2274–2287. https://doi.org/10.1091/mbc.E07-03-0199 PMID: 17429074
81. Hou CY, Lee WC, Chou HC, Chen AP, Chou SJ, et al. (2016) Global analysis of truncated RNA ends
reveals new insights into ribosome stalling in plants. Plant Cell 28: 2398–2416. https://doi.org/10.1105/
tpc.16.00295 PMID: 27742800
82. Hou CY, Wu MT, Lu SH, Hsing YI, Chen HM (2014) Beyond cleaved small RNA targets: unraveling the
complexity of plant RNA degradome data. BMC Genomics 15: 15. https://doi.org/10.1186/1471-2164-
15-15 PMID: 24405808
83. Bonnerot C, Boeck R, Lapeyre B (2000) The two proteins Pat1p (Mrt1p) and Spb8p interact in vivo, are
required for mRNA decay, and are functionally linked to Pab1p. Mol Cell Biol 20: 5939–5946. PMID:
10913177
84. Chu D, von der Haar T (2012) The architecture of eukaryotic translation. Nucleic Acids Res 40: 10098–
10106. https://doi.org/10.1093/nar/gks825 PMID: 22965119
85. Weinberg DE, Shah P, Eichhorn SW, Hussmann JA, Plotkin JB, et al. (2016) Improved ribosome-foot-
print and mRNA measurements provide insights into dynamics and regulation of yeast translation. Cell
Rep 14: 1787–1799. https://doi.org/10.1016/j.celrep.2016.01.043 PMID: 26876183
86. Shah P, Ding Y, Niemczyk M, Kudla G, Plotkin JB (2013) Rate-limiting steps in yeast protein translation.
Cell 153: 1589–1601. https://doi.org/10.1016/j.cell.2013.05.049 PMID: 23791185
87. Chu D, Kazana E, Bellanger N, Singh T, Tuite MF, et al. (2014) Translation elongation can control trans-
lation initiation on eukaryotic mRNAs. EMBO J 33: 21–34. https://doi.org/10.1002/embj.201385651
PMID: 24357599
88. Janke C, Magiera MM, Rathfelder N, Taxis C, Reber S, et al. (2004) A versatile toolbox for PCR-based
tagging of yeast genes: new fluorescent proteins, more markers and promoter substitution cassettes.
Yeast 21: 947–962. https://doi.org/10.1002/yea.1142 PMID: 15334558
89. Huh WK, Falvo JV, Gerke LC, Carroll AS, Howson RW, et al. (2003) Global analysis of protein localiza-
tion in budding yeast. Nature 425: 686–691. https://doi.org/10.1038/nature02026 PMID: 14562095
90. Shevchenko A, Jensen ON, Podtelejnikov AV, Sagliocco F, Wilm M, et al. (1996) Linking genome and
proteome by mass spectrometry: large-scale identification of yeast proteins from two dimensional gels.
Proc Natl Acad Sci U S A 93: 14440–14445. PMID: 8962070
91. Silva JC, Gorenstein MV, Li GZ, Vissers JP, Geromanos SJ (2006) Absolute quantification of proteins
by LCMSE: a virtue of parallel MS acquisition. Mol Cell Proteomics 5: 144–156. https://doi.org/10.1074/
mcp.M500230-MCP200 PMID: 16219938
92. Ishihama Y, Oda Y, Tabata T, Sato T, Nagasu T, et al. (2005) Exponentially modified protein abundance
index (emPAI) for estimation of absolute protein amount in proteomics by the number of sequenced
peptides per protein. Mol Cell Proteomics 4: 1265–1272. https://doi.org/10.1074/mcp.M500061-
MCP200 PMID: 15958392
93. Wilkening S, Pelechano V, Jarvelin AI, Tekkedil MM, Anders S, et al. (2013) An efficient method for
genome-wide polyadenylation site mapping and RNA quantification. Nucleic Acids Res 41: e65. https://
doi.org/10.1093/nar/gks1249 PMID: 23295673
94. Rep M, Krantz M, Thevelein JM, Hohmann S (2000) The transcriptional response of Saccharomyces
cerevisiae to osmotic shock. Hot1p and Msn2p/Msn4p are required for the induction of subsets of high
osmolarity glycerol pathway-dependent genes. J Biol Chem 275: 8290–8300. PMID: 10722658
95. Li T, De Clerck N, Medina D, Garre E, Sunnerhagen P, et al. (2016) The mRNA cap-binding protein
Cbc1 is required for high and timely expression of genes by promoting the accumulation of gene-spe-
cific activators at promoters BBA Gene Regul Mech 1859: 405–419. https://doi.org/10.1016/j.bbagrm.
2016.01.002 PMID: 26775127
RBPs and stress-induced transcripts
PLOS Genetics | https://doi.org/10.1371/journal.pgen.1007563 July 30, 2018 30 / 30