The Lower Bound to the Evolution of Mutation Rateslynchlab/PDF/Lynch194.pdf · The Lower Bound to...
12
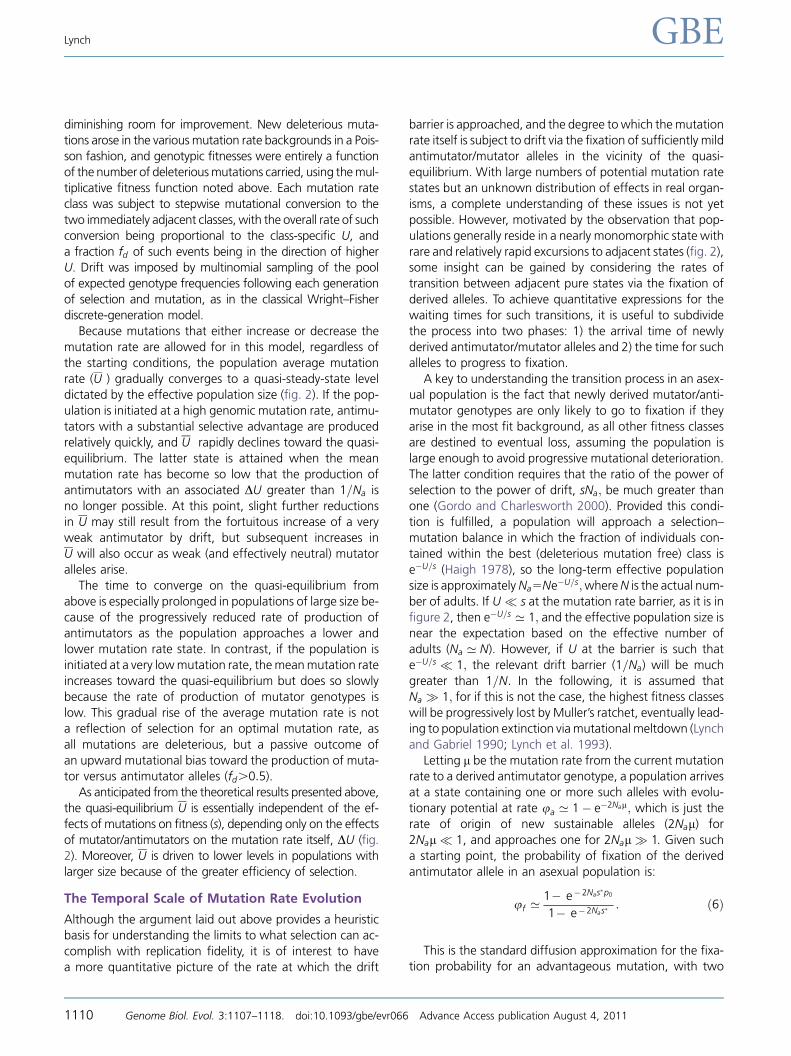
The Lower Bound to the Evolution of Mutation Rates Michael Lynch* Department of Biology, Indiana University *Corresponding author: E-mail: [email protected]. Accepted: 27 June 2011 Abstract Despite substantial attention from theoreticians, the evolutionary mechanisms that drive intra- and interspecific variation in the mutation rate remain unclear. It has often been argued that mutation rates associated with the major replicative polymerases have been driven down to their physiological limits, defined as the point at which further enhancement in replication fidelity incurs a cost in terms of reproductive output, but no evidence in support of this argument has emerged for cellular organisms. Here, it is suggested that the lower barrier to mutation rate evolution may ultimately be defined not by molecular limitations but by the power of random genetic drift. As the mutation rate is reduced to a very low level, a point will eventually be reached at which the small advantage of any further reduction is overwhelmed by the power of drift. This hypothesis is consistent with a number of observations, including the inverse relationship between the per-site mutation rate and genome size in microbes, the negative scaling between the per-site mutation rate and effective population size in eukaryotes, and the elevated error rates associated with less frequently deployed polymerases and repair pathways. Key words: antimutator, genome evolution, molecular evolution, mutation rate, mutator, random genetic drift. Introduction Although evolutionary biologists have explained many attrib- utes of biodiversity in terms of extrinsic adaptive challenges, much less is known about the intrinsic mechanisms that define the tempo and mode of evolutionary change itself. The origins of the substantial divergence in error rates associated with dif- ferent polymerases, nucleotide pool sanitizers, and repair en- zymes within and among species remain especially unclear. Developing such an understanding is critical to establishing a general theory for the constraints on evolutionary processes in divergent phylogenetic lineages. Without genetic variation, there can be no evolution, so a nonzero mutation rate is essential for adaptive progress in the face of a changing environment. However, because the vast majority of mutations with effects on fitness are dele- terious, special conditions are required for positive selection to promote increases in the mutation rate. Although both theoretical work and empirical work demonstrate that strong mutator alleles can sometimes rise to high frequen- cies by hitchhiking with linked beneficial mutations in asex- ual populations (Sniegowski et al. 1997; Taddei et al. 1997; Oliver et al. 2000; Tenaillon et al. 2001; Hall and Henderson- Begg 2006), such a mechanism has limited explanatory power for mutation rates in sexual species. This is because almost all mutations in recombining genomes will be either unlinked or loosely linked to the locus responsible for their production and hence remain in statistical association with a mutator allele for only two to a few These general consid- erations have led to a common view, dating to Sturtevant (1937), that natural selection will typically drive mutation rates to the minimum possible level (Kimura 1967; Dawson 1999; Baer et al. 2007). This lower limit has usually been thought to be rendered nonzero by fitness costs associated with excessive investment in replication fidelity, for example, a reduction in reproductive rates resulting from slow ge- nome replication. Because a structural trade-off exists be- tween the rate of polymerization and the investment in proofreading (Bessman et al. 1974; Loh et al. 2007, 2010; Tian et al. 2008), such costs must exist at some level. However, there is no direct evidence that time constraints on genome replication are substantial enough to influence the mutation rate, except perhaps in viruses (Furio ´ et al. 2005, 2007). In prokaryotes, for example, genome replication con- stitutes just a small fraction of the overall energy budget ª The Author(s) 2011. Published by Oxford University Press on behalf of the Society for Molecular Biology and Evolution. This is an Open Access article distributed under the terms of the Creative Commons Attribution Non-Commercial License (http://creativecommons.org/licenses/by-nc/ 3.0), which permits unrestricted non-commercial use, distribution, and reproduction in any medium, provided the original work is properly cited. Genome Biol. Evol. 3:1107–1118. doi:10.1093/gbe/evr066 Advance Access publication August 4, 2011 1107 GBE
Transcript of The Lower Bound to the Evolution of Mutation Rateslynchlab/PDF/Lynch194.pdf · The Lower Bound to...
The Lower Bound to the Evolution of Mutation Rates
Michael Lynch*
Department of Biology, Indiana University
*Corresponding author: E-mail: [email protected].
Accepted: 27 June 2011
Abstract
Despite substantial attention from theoreticians, the evolutionary mechanisms that drive intra- and interspecific variation
in the mutation rate remain unclear. It has often been argued that mutation rates associated with the major replicative
polymerases have been driven down to their physiological limits, defined as the point at which further enhancement in
replication fidelity incurs a cost in terms of reproductive output, but no evidence in support of this argument has emergedfor cellular organisms. Here, it is suggested that the lower barrier to mutation rate evolution may ultimately be defined not
by molecular limitations but by the power of random genetic drift. As the mutation rate is reduced to a very low level,
a point will eventually be reached at which the small advantage of any further reduction is overwhelmed by the power of
drift. This hypothesis is consistent with a number of observations, including the inverse relationship between the per-site
mutation rate and genome size in microbes, the negative scaling between the per-site mutation rate and effective
population size in eukaryotes, and the elevated error rates associated with less frequently deployed polymerases and repair
pathways.
Key words: antimutator, genome evolution, molecular evolution, mutation rate, mutator, random genetic drift.
Introduction
Although evolutionary biologists have explained many attrib-utes of biodiversity in terms of extrinsic adaptive challenges,
much less is known about the intrinsicmechanisms that define
the tempo andmode of evolutionary change itself. The origins
of the substantial divergence in error rates associated with dif-
ferent polymerases, nucleotide pool sanitizers, and repair en-
zymes within and among species remain especially unclear.
Developing such an understanding is critical to establishing
a general theory for the constraints on evolutionary processes
in divergent phylogenetic lineages.Without genetic variation, there can be no evolution, so
a nonzero mutation rate is essential for adaptive progress in
the face of a changing environment. However, because the
vast majority of mutations with effects on fitness are dele-
terious, special conditions are required for positive selection
to promote increases in the mutation rate. Although both
theoretical work and empirical work demonstrate that
strong mutator alleles can sometimes rise to high frequen-
cies by hitchhiking with linked beneficial mutations in asex-
ual populations (Sniegowski et al. 1997; Taddei et al. 1997;
Oliver et al. 2000; Tenaillon et al. 2001; Hall and Henderson-
Begg 2006), such a mechanism has limited explanatory
power for mutation rates in sexual species. This is because
almost all mutations in recombining genomes will be either
unlinked or loosely linked to the locus responsible for their
production and hence remain in statistical association with
a mutator allele for only two to a few These general consid-
erations have led to a common view, dating to Sturtevant
(1937), that natural selection will typically drive mutation
rates to the minimum possible level (Kimura 1967; Dawson
1999; Baer et al. 2007). This lower limit has usually been
thought to be rendered nonzero by fitness costs associated
with excessive investment in replication fidelity, for example,
a reduction in reproductive rates resulting from slow ge-
nome replication. Because a structural trade-off exists be-
tween the rate of polymerization and the investment in
proofreading (Bessman et al. 1974; Loh et al. 2007,
2010; Tian et al. 2008), such costs must exist at some level.
However, there is no direct evidence that time constraints on
genome replication are substantial enough to influence the
mutation rate, except perhaps in viruses (Furio et al. 2005,
2007). In prokaryotes, for example, genome replication con-
stitutes just a small fraction of the overall energy budget
ª The Author(s) 2011. Published by Oxford University Press on behalf of the Society for Molecular Biology and Evolution.
This is an Open Access article distributed under the terms of the Creative Commons Attribution Non-Commercial License (http://creativecommons.org/licenses/by-nc/
3.0), which permits unrestricted non-commercial use, distribution, and reproduction in any medium, provided the original work is properly cited.
Genome Biol. Evol. 3:1107–1118. doi:10.1093/gbe/evr066 Advance Access publication August 4, 2011 1107
GBE

(Ingraham et al. 1983), rates of DNA replication are morethan 10-fold faster than those for messenger RNA elonga-
tion (Cox 2004), cells often experience nested genome rep-
lication events before dividing (Casjens et al. 1998), and
there is no discernible association between growth rate
and genome size (Vieira-Silva et al. 2010). Yet, the fact that
prokaryotes with reduced mutation rates can be obtained
experimentally (Trobner and Piechocki 1984; Fijalkowska
et al. 1993; Schaaper 1998; Galan et al. 2007; Loh et al.2007) suggests that the accuracy of the replication machin-
ery is less than what is achievable at the molecular level, al-
though arguments have been made that pleiotropic
constraints often result in declines in some types of fidelity
in response to increases in others (Drake 1993; Bebenek
et al. 2005).
An additional but unexplored barrier to mutation rate
reduction is the reduced efficiency of selection for weaklyadvantageous antimutator alleles. As the mutation rate is
driven to lower and lower levels by selection, a point must
eventually be reached where the advantage of any further
increase in replication fidelity is smaller than the power of
random genetic drift (Lynch 2008, 2010). The goal here is
to evaluate the extent to which such an intrinsic barrier can
provide an adequate explanation for the patterns of muta-
tion rates known to have evolved in natural populations. Toanalyze this problem, the situation involving a single mu-
tation rate modifier in an effectively infinite asexual pop-
ulation (where drift plays a negligible role relative to
selection) will first be explored, with attention then being
expanded to the effects of multiple mutator states, finite
population size, and recombination. Throughout, it is as-
sumed that the only selective pressure on the mutation rate
is the statistical association of excess deleterious mutationswith mutator alleles. The expectations of the resultant the-
ory are then shown to be consistent with empirical obser-
vations on the replication machinery and associated error
rates in various lineages.
Results
An Effectively Infinite Asexual Population
Consider a modifier allele m that magnifies the genome-
wide mutation rate to deleterious alleles by an amountDU. Individuals are assumed to be diploid, but provided
the selective disadvantage of mutator heterozygotes is
much greater than the rate of origin of mutator alleles, mu-
tator homozygotes are expected to be extremely rare, and
the population can be effectively treated as containing two
classes of individuals, MM and Mm. Genotype MM is con-
verted toMm at rate 2l, where l is the mutation rate perMgene copy, whereas reversion of the latter to MM occurs atrate m: The dynamics of the frequency ofMm individuals can
be written as
p#Mm 5 ½pMmð1 � s;dÞð1 � mÞ þ 2lpMM�=W ; ð1Þ
where s;d is the selective disadvantage of Mm individuals
and �W the mean population fitness relative to an MM fit-
ness of 1.0. The equilibrium frequency of the mutator ge-
notype is then p;Mm ’ 2l=ðs;d þ mþ 2lÞ: This expression
and all the remaining results of this section also apply toa haploid asexual population if l is substituted for 2l:
The central remaining issue is the magnitude of the se-
lective disadvantage s;d resulting from the accumulation
of excess deleterious mutations on Mm relative to MMbackgrounds. Because new Mm individuals are derived re-
currently from relatively mutation-free MM genotypes,
whereas their descendants stochastically accumulate new
deleterious mutations, the pool of Mm individuals willbe heterogeneous with respect to fitness. Letting U be
the genome-wide deleterious mutation rate in the MMbackground, deleterious mutations arise at rate U þ DUwithin Mm individuals, and we assume that each mutation
arises at a unique site (ensuring that all mutations remain
heterozygous in a diploid species). With all mutations as-
sumed to have a fixed deleterious effect s, the fitness func-
tion is defined to beWðnÞ5ð1� sÞn, where n is the numberof deleterious mutations in an individual.
To obtain a time-averaged measure of the selective dis-
advantage of mutator individuals, an estimate of the aver-
age excess number of deleterious mutations residing on
Mm backgrounds is required. With new mutations arising
randomly, under the multiplicative fitness model, the num-
ber of excess mutations arising follows a Poisson distribution
with the mean cumulative number being fractionally re-duced by ð1� sÞ by selection and increased by DU by mu-
tation each generation (Haigh 1978). Assuming these
features are closely approximated from the time of appear-
ance of a newMm genotype, the average buildup of excess
mutations is then described by
�nðtÞ5 ðDU=sÞ½1 � ð1 � sÞt�: ð2Þ
Relative to the situation inMM individuals, which at equi-librium carry an average U=s deleterious mutations, the
mean selective disadvantage of a mutator genotype t gen-erations after introduction is
sdðtÞ51 � ð1 � sÞ�nðtÞ; ð3Þ
so that the average selective disadvantage over the ex-pected life span of an Mm sublineage is:
s;d ’PN
k5 1 sdðkÞ:Qk
i51½1 � sdðiÞ�PNk5 1
Qki5 1½1 � sdðiÞ�
: ð4Þ
This expression follows from the fact that an expected
fraction ½1� sdðiÞ� of the descendants of a newly arisen
Lynch GBE
1108 Genome Biol. Evol. 3:1107–1118. doi:10.1093/gbe/evr066 Advance Access publication August 4, 2011

cohort of Mm individuals survives the ith generation, with
the cumulative product giving the survivorship of the cohort
through time. Further simplification is achieved by approx-
imating powers of ð1� sÞ as exponentials,
s;d ’ 1 � e�DU
PNk5 1 e
�ðDU=sÞ½ksþð1� sÞkþ1�PNk5 1 e
�ðDU=sÞ½ksþð1� sÞk �
!: ð5Þ
Although this expression ignores the variation in nwithin mutator and nonmutator genotypes, it yields a very
close approximation to the average selection coefficient
determined from the mean genotypic fitnesses of a fully
characterized infinite population iterated to equilibrium
(fig. 1). For DU � s; which is likely to be the usual case
given that �s ’ 0:001 to 0.01 (Lynch and Walsh 1998),
a newly arisen sublineage of mutators generally achieves its
excess equilibriummutation load, DU=s, before being purgedfrom the population, and s;d ’ 1� ð1� sÞDU=s’ DU; that is,the selective disadvantage of the mutator is independent of
the effects of the mutations it produces. However, highly
aggressive mutator alleles are relatively rapidly eliminated
(as a consequence of their substantial indirect mutation load;
Johnson 1999a), resulting in s;d,1� ð1� sÞDU=s:At mutation–selection equilibrium, the increase in the
mean genome-wide deleterious mutation rate resultingfrom the recurrent production of the mutator allele is
DU5DUp;Mm: Assuming a low level of mutator allele rever-
sion, (m � l; s;d), provided DU � s; DU ’ 1=½ð1=2lÞþð1=DUÞ�, that is, half the harmonic mean of the diploid
mutation rate to mutator alleles and the elevation in the
genome-wide deleterious mutation rate per such mutation,
which approaches 2l if DU � 2l: An evaluation of a more
extensive model with an array of mutator classes (differingby a constant multiplicative factor) demonstrates that this
expression still closely approximates the inflation of U if
DU is taken to be the mutation rate difference between
the two least mutagenic classes, which is where nearly all
of the population resides. Thus, weak mutator alleles gen-
erally result in only a small increase in the population aver-
age mutation rate, which is independent of the effects of
the induced deleterious mutations.
Finite Asexual Populations
Although the preceding results imply that the mutation rate
will evolve to the minimum possible level in an infinite pop-
ulation, they are best viewed as providing a conceptual basis
for determining the influence that finite population size has
on the minimum mutation rate achievable by selection (ig-
noring, for the time being, any counterselection that might
be associated with a cost to replication fidelity). Because s;d
represents the absolute magnitude of selection operatingagainst a cohort of mutator alleles in an infinite population,
the capacity of natural selection to further reduce a prevail-
ing genome-wide mutation rate will be limited unless there
are accessible antimutator alleles with s;d larger than the
power of drift, defined as ;1=Na in asexuals, where Na is
the asexual effective population size. Although the degree
to which mutations operating on highly refined replication/
repair loci can produce alleles with DU.1=Na is uncertain, itis clear that DU cannot exceed U itself.
To evaluate the extent to which a population evolves to
such a barrier, stochastic computer simulations were per-
formed on clonal populations in which the genome-wide del-
eteriousmutation ratewas subject tomodification through an
unbounded range of alternative states, with the mutation
rates (U) of adjacent allelic classes differing by a constant
factor, 1þ k. This has the effect of DU5kU becomingprogressively smaller as U declines, which must occur with
FIG. 1.—Properties of a mutator allele m in an infinite asexual population, assuming a mutation rate to mutator genotype Mm of 2l51026; and
a negligible back mutation rate. Results were obtained by a set of recursion equations that tracked the distributions of deleterious mutation numbers
within MM and Mm individuals, until the population achieved mutation–selection equilibrium. Left: Equilibrium frequency of the Mm mutator
heterozygotes (dashed line) and average selective disadvantage of the Mm genotype at equilibrium (solid line obtained from recursions; dotted line
from eq. (4)). Right: Population average mutation rate at equilibrium.
Mutation-Rate Evolution GBE
Genome Biol. Evol. 3:1107–1118. doi:10.1093/gbe/evr066 Advance Access publication August 4, 2011 1109
diminishing room for improvement. New deleterious muta-tions arose in the variousmutation rate backgrounds in a Pois-
son fashion, and genotypic fitnesses were entirely a function
of the number of deleteriousmutations carried, using themul-
tiplicative fitness function noted above. Each mutation rate
class was subject to stepwise mutational conversion to the
two immediately adjacent classes, with the overall rate of such
conversion being proportional to the class-specific U, anda fraction fd of such events being in the direction of higherU. Drift was imposed by multinomial sampling of the pool
of expected genotype frequencies following each generation
of selection and mutation, as in the classical Wright–Fisher
discrete-generation model.
Because mutations that either increase or decrease the
mutation rate are allowed for in this model, regardless of
the starting conditions, the population average mutation
rate (U ) gradually converges to a quasi-steady-state leveldictated by the effective population size (fig. 2). If the pop-
ulation is initiated at a high genomic mutation rate, antimu-
tators with a substantial selective advantage are produced
relatively quickly, and U rapidly declines toward the quasi-
equilibrium. The latter state is attained when the mean
mutation rate has become so low that the production of
antimutators with an associated DU greater than 1=Na is
no longer possible. At this point, slight further reductionsin U may still result from the fortuitous increase of a very
weak antimutator by drift, but subsequent increases in
U will also occur as weak (and effectively neutral) mutator
alleles arise.
The time to converge on the quasi-equilibrium from
above is especially prolonged in populations of large size be-
cause of the progressively reduced rate of production of
antimutators as the population approaches a lower andlower mutation rate state. In contrast, if the population is
initiated at a very lowmutation rate, themeanmutation rate
increases toward the quasi-equilibrium but does so slowly
because the rate of production of mutator genotypes is
low. This gradual rise of the average mutation rate is not
a reflection of selection for an optimal mutation rate, as
all mutations are deleterious, but a passive outcome of
an upward mutational bias toward the production of muta-tor versus antimutator alleles (fd.0:5).
As anticipated from the theoretical results presented above,
the quasi-equilibrium U is essentially independent of the ef-
fects of mutations on fitness (s), depending only on the effects
of mutator/antimutators on the mutation rate itself, DU (fig.
2). Moreover, U is driven to lower levels in populations with
larger size because of the greater efficiency of selection.
The Temporal Scale of Mutation Rate Evolution
Although the argument laid out above provides a heuristic
basis for understanding the limits to what selection can ac-
complish with replication fidelity, it is of interest to have
a more quantitative picture of the rate at which the drift
barrier is approached, and the degree to which themutationrate itself is subject to drift via the fixation of sufficiently mild
antimutator/mutator alleles in the vicinity of the quasi-
equilibrium. With large numbers of potential mutation rate
states but an unknown distribution of effects in real organ-
isms, a complete understanding of these issues is not yet
possible. However, motivated by the observation that pop-
ulations generally reside in a nearly monomorphic state with
rare and relatively rapid excursions to adjacent states (fig. 2),some insight can be gained by considering the rates of
transition between adjacent pure states via the fixation of
derived alleles. To achieve quantitative expressions for the
waiting times for such transitions, it is useful to subdivide
the process into two phases: 1) the arrival time of newly
derived antimutator/mutator alleles and 2) the time for such
alleles to progress to fixation.
A key to understanding the transition process in an asex-ual population is the fact that newly derived mutator/anti-
mutator genotypes are only likely to go to fixation if they
arise in the most fit background, as all other fitness classes
are destined to eventual loss, assuming the population is
large enough to avoid progressive mutational deterioration.
The latter condition requires that the ratio of the power of
selection to the power of drift, sNa; be much greater than
one (Gordo and Charlesworth 2000). Provided this condi-tion is fulfilled, a population will approach a selection–
mutation balance in which the fraction of individuals con-
tained within the best (deleterious mutation free) class is
e�U=s (Haigh 1978), so the long-term effective population
size is approximatelyNa5Ne�U=s;whereN is the actual num-
ber of adults. If U � s at the mutation rate barrier, as it is in
figure 2, then e�U=s ’ 1; and the effective population size is
near the expectation based on the effective number ofadults (Na ’ N). However, if U at the barrier is such that
e�U=s � 1; the relevant drift barrier (1=Na) will be much
greater than 1=N: In the following, it is assumed that
Na � 1; for if this is not the case, the highest fitness classes
will be progressively lost by Muller’s ratchet, eventually lead-
ing to population extinction viamutational meltdown (Lynch
and Gabriel 1990; Lynch et al. 1993).
Letting l be the mutation rate from the current mutationrate to a derived antimutator genotype, a population arrives
at a state containing one or more such alleles with evolu-
tionary potential at rate ua ’ 1� e�2Nal; which is just the
rate of origin of new sustainable alleles (2Nal) for
2Nal � 1, and approaches one for 2Nal � 1. Given such
a starting point, the probability of fixation of the derived
antimutator allele in an asexual population is:
uf ’1� e�2Nas�p0
1� e�2Nas�: ð6Þ
This is the standard diffusion approximation for the fixa-tion probability for an advantageous mutation, with two
Lynch GBE
1110 Genome Biol. Evol. 3:1107–1118. doi:10.1093/gbe/evr066 Advance Access publication August 4, 2011

modifications: s�5DU þ 2l (whereDU is positive for an anti-
mutator), and p05ð1=NaÞ þ ½2lðNa � 1Þ=Na� ’ ð1=NaÞþ2l: The modified selection coefficient (s�) includes the rate
of production of derived alleles 2l, as this might be nontrivial(relative to DU) near the drift barrier. The modified starting
frequency of the derived allele (p0) allows for the fact that
when 2Nal.1, more than a single copy of the derived
genotype can appear per generation. The mean time to arrive
at a state at which the derived antimutator is destined to
fixation is then:
�ta ’ 1=ðuauf Þ: ð7Þ
To obtain the additional time to fixation, we employ the
following reasoning. Newly derived alleles with small influ-
ences on the mutation rate will be subject to relatively
strong stochastic processes in their early phase of establish-
ment. However, once aweak antimutator allele has arisen to
sufficiently high frequency, here denoted as p�; it can be
promoted by selection in an effectively deterministic
fashion. From a modification of the standard fixationequation for a beneficial allele, the frequency to which
a beneficial mutation must rise in order to have a 0.9 prob-
ability of fixation is:
p� ’ � ln½1 � 0:9ð1 � e� 2Nas� Þ�
2Nas�: ð8Þ
The mean time to fixation of an antimutator is then ap-
proximated by subdividing the dynamics into an early phase
of drift until the derived allele first reaches frequency p�; anda subsequent phase of deterministic selection. Modifying
from Kimura and Ohta (1969), the mean time to drift to fre-
quency p� from starting frequency p0, conditional on even-
tual fixation, is:
�td ’ 4N
�p� � 1 �
�1 � p0
p0
�ln
�1 � p0
��: ð9Þ
The subsequent deterministic time is approximated byassuming that the antimutator simply expands exponen-
tially to frequency 1.0 once it has reached the critical
frequency,
FIG. 2.—Sample evolutionary trajectories for the average genome-wide deleterious mutation rate (U ) in finite asexual populations with different
monomorphic starting conditions. Results are shown for two different population sizes and two different selection coefficients against deleterious
mutations, with 48 mutation rate classes differing by a factor of 1.111 between adjacent classes and with the mutation rate to mutator/antimutator
genotypes being equal to 0.02 times the total genome-wide mutation rate to deleterious alleles at fitness loci. Mutations to antimutators were relatively
rare (10% of the total; fd50:1). Note that the quasi-steady-state predictions for U (given by the horizontal gray lines) are simply the points at which
DU50:1U is equal to 1=N:
Mutation-Rate Evolution GBE
Genome Biol. Evol. 3:1107–1118. doi:10.1093/gbe/evr066 Advance Access publication August 4, 2011 1111

�ts ’ � lnðp�Þ=s�: ð10Þ
The average number of generations required for a transi-
tion from a monomorphic ancestral state to fixation of a de-
rived antimutator allele is then:
�ttot ’ �ta þ �td þ �ts: ð11Þ
The results for the arrival time for advantageous antimu-
tator alleles (�ta) are readily extended to deleterious mutator
alleles by allowing DU be negative in the latter case. The to-
tal time to fixation of a mutator (conditional on fixation, de-spite its disadvantage) can be assumed to be equal to that
for an antimutator with the same absolute selective advan-
tage, based on prior work (Nei and Roychoudhury 1973;
Maruyama 1974; Taylor et al. 2006).
The sets of expressions for both mutators and antimuta-
tors yield good approximations to the mean transition times
obtained by computer simulations of the stochastic process,
provided sNa.1 (fig. 3). (When sNa,1, the effective popu-lation size is actually elevated relative to Ne�U=s because
mutator/antimutator alleles in multiple classes of individuals
have the potential for fixation when the permanent main-
tenance of the best class by selection is no longer guaran-
teed.) To obtain a fuller understanding of the dynamics of
mutation rate evolution, the preceding formulations might
be applied in a transition matrix approach for the various
mutation rate classes, although in the absence of explicit in-formation on the rates of origin of mutator/antimutator al-
leles, the issue is not pursued here. Nevertheless, the
preceding results help clarify two key issues with respect
to the constraints on mutation rate evolution.
First, the lower bound on the mutation rate depends not
just on the magnitude of DU that is accomplishable for anti-
mutator alleles but also on the net rate of mutational produc-
tion of such alleles. The latter is treated here as l under theassumption that the antimutator undergoes no backmutation
while en route to fixation, although l should be viewed more
generally as the difference between forward and backward
mutation rates to such an allele. Provided jDUj � 2l; bothmutators and antimutators are potentially driven by indirect
selection on the associated deleterious mutation load. Such
selection is ineffective if jDUj � ð1=NaÞ (below the drift bar-
rier), but otherwise the fixation of mutator alleles is stronglyimpeded, the more so in very large populations. In contrast,
when jDUj � 2l; both mutators and antimutators behave in
an effectively neutral fashion (regardless of population size),
being driven only by directional mutation pressure.
Second, although the success or failure of a mutator/anti-
mutator depends on the magnitude of DU; rather than on
the specific value of U for the derived allele, the absolute
value of U in the ancestral genotype does influence the fates
of derived alleles through its influence on the number of in-dividuals (Na) in the restricted class with evolutionary poten-
tial. Although smaller Na prolongs the arrival times of
potentially fixable mutator/antimutator alleles, it also re-
duces the time to drift to fixation. The latter effect tends
to dominate, so that populations with small Na (either be-
cause of small N or large U ) undergo more frequent tran-
sitions between mutation rate classes (fig. 3).
Sexual Populations
As first pointed out by Kimura (1967), the magnitude of in-
direct selection opposing mutator alleles is greatly dimin-
ished in sexual populations because the statistical
associations with induced deleterious mutations are rapidly
removed by recombination. As loci are no longer inherited
as a unit in recombining species, it is more appropriate to
evaluate mutational properties on a per-locus basis. Consid-ering a modifier allelem that magnifies the mutation rate to
deleterious alleles by an amount Du at a locus directly influ-
encing fitness, Kimura (1967) showed that in an infinite
population, an equilibrium will rapidly be reached where
the input of new deleterious alleles is balanced by their dis-
association from m by recombination, at which point the
selective disadvantage of the mutator allele is approximately
sDu=ðsþ r � srÞ;where s is the heterozygous effect of a del-eterious mutation and r the recombination rate between the
two (fitness and fidelity) loci. To obtain the total selection
coefficient against the mutator, s;d, this expression must
be summed over all loci affecting fitness. For the case of
no recombination (r50), the result from the preceding sec-
tion, s;d ’ DUh, is recovered (where Uh is now the haploid
genome-wide deleterious mutation rate), whereas with free
recombination (r50:5), s;d ’ 2�sDUh=ð1þ �sÞ;which is closelyapproximated by 2�sDUh when �s � 1 (the usual situation;
Lynch and Walsh 1998).
This result, which has been obtained in a number of dif-
ferent ways (Kondrashov 1995; Dawson 1999; Johnson
1999a), shows that free recombination reduces the magni-
tude of indirect selection experienced by a mutator allele by
a factor of ;1=�s: This is because the deleterious mutation
load associated with a mutator quickly reaches a mutation–recombination equilibrium rather than building up to the
much larger mutation–selection equilibrium. With free re-
combination, a mildly deleterious mutation becomes disas-
sociated from the mutator in just two generations on
average. A mutator allele will then have an elevated prob-
ability of being associated with a deleterious mutation of
2Du, the overall indirect fitness reduction being
2�sDu=ð1þ �sÞ, with the denominator accounting for theslight reduction in frequency of associated deleterious alleles
resulting from selection.
Because some mutations will be linked with the mutator
locus, 2�sDUh will be a slight underestimate of the selective
disadvantage of a mutator in a sexual population. However,
Lynch GBE
1112 Genome Biol. Evol. 3:1107–1118. doi:10.1093/gbe/evr066 Advance Access publication August 4, 2011

given that most organisms contain five or more chromo-
somes, the vast majority of mutations induced by a mutator
allele will generally arise on different chromosomes (a frac-
tion 1� n�1 with n chromosomes of equal length) or distant
from the mutator when on the same chromosome. More
precise expressions that account for finite chromosome
numbers and integrate over positions of linked mutationsshow that s;d is generally no more than 4�sDUh (Johnson
1999b; Lynch 2008). Because the excess equilibrium load
of a mutator allele is established within just a few genera-
tions of its appearance in a sexual population, these
expressions provide a very close approximation to the
time-averaged selective disadvantage of a segregating mu-tator allele at all but enormous (and unrealistic) DUh:
RecallingDU52DUh as the diploid genome-wide increase
in the deleterious mutation rate, and noting that the power
of drift in a diploid sexual population is 1=ð2NeÞ, where Ne is
the effective population size, the expected drift barrier to
the downward evolution of the mutation rate in a sexual
species is DU,1=ð2NesÞ; in contrast to 1=Na for an asexual
population. As in figure 2, this prediction is well supportedby simulations of a replication fidelity locus with an array of
alleles differing in the mutation rate by a constant factor
(and acting in an additive fashion to define the genotypic
mutation rates), with deleterious mutations assumed to
arise in a freely segregating background.
Discussion
Although the focus here has been primarily on deleterious
mutation accumulation, the net forces in favor of a newly
arisen antimutator allele in an asexual population can be
viewed as the sum s� ’ DU þ ðl� mÞ þ sp; where DU is
the reduction in the genome-wide deleterious mutation
rate, ðl� mÞ the net mutation pressure in the direction of
antimutator alleles, and sp the pleiotropic selective effect
of the antimutator allele (independent of the reduced mu-tation load). When this summed quantity is smaller than the
power of drift, the ability of natural selection to further re-
duce the mutation rate will be strongly diminished. In the
context of an antimutator allele, DU is positive by definition,
whereas ðl� mÞ is likely to be negative (assuming it is more
difficult to produce antimutator alleles than disrupt them).
Under the assumption that there is a physiological cost to
high replication fidelity, sp would be negative. However,conditions in which sp is positive can be envisioned, for ex-
ample, in multicellular organisms, where the rate of germ-
line replication is unlikely to be a limiting factor in
reproduction, a reduced somatic mutation rate may be
highly advantageous (Lynch 2008).
As the mutation rate is pushed to a lower and lower level
by selection, the effects of further molecular refinements of
the replication/repair apparatus must become progressivelydiminished, and DU will necessarily become smaller, ðl� mÞlikely more negative, and sp smaller (and potentially nega-
tive) as well, eventually leading to the inability of selection to
diminish themutation rate any further in the face of random
genetic drift. Although the ways in which these three com-
ponents vary with U and their relative quantitative contribu-
tions are unknown, and may differ among phylogenetic
lineages, this overall theoretical construct yields qualitativepredictions that have the potential to explain several previ-
ously disconnected observations.
First, consider Drake’s (1991) contention that an inverse
relationship exists between themutation rate per nucleotide
site and genome size in microbes, such that the genome-
FIG. 3.—Mean times (in generations) for transitions from one fixed
mutation rate state to another, given for three asexual population sizes.
Upwardly bowed curves refer to derived mutators, and downward
curves to antimutators. Data points are the averages of 500 stochastic
simulations, whereas the curved lines are the expectations based on the
theory in the text.
Mutation-Rate Evolution GBE
Genome Biol. Evol. 3:1107–1118. doi:10.1093/gbe/evr066 Advance Access publication August 4, 2011 1113

wide mutation rate remains constant across taxa. This orig-inal conjecture was based on rather limited data, but a more
recent analysis (Lynch 2010) continues to support the gen-
eral pattern for bacteriophage and prokaryotes, although
because of the limited range of bacterial genome sizes,
the overall pattern remains highly dependent on the inclu-
sion of bacteriophage in the analysis. Can Drake’s conten-
tion can be explained on theoretical grounds? Imagine
a series of mutation rate states such that U0 is the minimumpossible rate, and with multiplicative increases among states
such that Ui5ð1þ kÞUi�1, or DU5kUi�1: The theory implies
that the minimum selectable genome-wide deleterious mu-
tation rate satisfies DU þ ðl� mÞ þ sp51=Na (for an asexual
population), or in other words,
Umin ’ 1
k
�1
Na� ðl � m þ spÞ
�; ð12aÞ
where the composite term ðl� mþ spÞ is the implied value of
the sum at the boundary that satisfies Umin: Thus, the theory
predicts an approximate inverse scaling between the total ge-
nome-wide deleterious mutation rate and the effective size of
an asexual population. Noting that the minimum mutation
rate per nucleotide site (umin) is equal to Umin=ð/dGÞ; where/d is the fraction of mutations with deleterious effects and Gthe number of nucleotide sites per genome, the lower bound
to the per-site mutation rate is predicted to be:
logðuminÞ5 log
�1
/dk
�1
Na� ðl � m þ spÞ
��� logðGÞ:
ð12bÞ
Thus, for a group of organisms with comparable effective
population sizes, the theory predicts an inverse relationship
between the mutation rate per nucleotide site (umin) and to-
tal genome size (G), with species-specific Umin being distrib-
uted around the regression to a degree that depends on
variation in the composite parameter in large brackets. Al-though the latter quantity must be subject to variation, it is
plausible that the degree of variation among microbes is
small relative to that inG. For example, with few exceptions,
microbial genomes are about 95% coding DNA, so ud is
likely to be roughly constant. In addition, microbial popula-
tions clearly vary in absolute population sizes (N), but a casecan be made that once N exceeds a very large size (as it does
in microbes), the effective population size is no longer lim-ited by absolute numbers but by the physical structure of the
genome, that is, by the selective interference that results
from linked sites on chromosomes (Lynch 2007, 2010). Pos-
sibly, most microbes are near this limit.
In contrast, eukaryotic effective population sizes vary by
a few orders of magnitude, with multicellular species typi-
cally having much smaller Ne (Lynch 2007, 2010). The exist-
ing data on such species suggest that u (per generation)
scales with roughly the�0.6 power of Ne, although the truescaling could be as extreme as �1:0 (Lynch 2010). Thus,
keeping in mind that it is unclear whether the composite
term ðl� mþ spÞ contributes substantially to the overall
pressure on the mutation rate in eukaryotes, it can at least
be stated that the theory is qualitatively consistent with the
negative scaling between u and Ne of cellular species. (For
sexual species, the right side of equation (12a) is only mod-
ified by a factor of 1=s, which does not alter the predictednegative scaling between u and Ne.)
Second, most genomes contain two or more ‘‘error-
prone’’ polymerases, often used in replication across bulky
lesions in the DNA and often elicited in periods of cellular
stress. In vitro studies indicate that the error rates of these
enzymes are typically 10- to 10,000-fold higher than those
for polymerases involved in genome replication (fig. 4). (In
vivo error rates could be lower than those summarized infigure 4, although it is unlikely that the qualitative pattern
would be altered.) Because it is unlikely that such poly-
merases are molecularly constrained to be so inaccurate,
many investigators have argued that natural selection has
promoted stress-induced mutation as a strategy to facilitate
adaptive evolution during challenging periods (Radman
et al. 2000; Rosenberg 2001; Tenaillon et al. 2001; Earl
and Deem 2004; Foster 2007; Galhardo et al. 2007). How-ever, with the vast majority of mutations being deleterious, it
is unclear that there is any net long-term advantage for el-
evated levels of stress-induced mutation, and the preceding
results provide an alternative explanation that eliminates the
need to invoke such an argument.
As implied by equation (12b), the error rate of a polymer-
ase is expected to scale inversely with the number of nucle-
otide transactions engaged in per generation. Thus, there isno reason to invoke selection for evolvability to explain the
error-prone nature of the polymerases involved in stress-
induced mutagenesis. Rather, such a pattern is expected
to be a natural outcome of the reduction in the efficiency
of selection operating on infrequently invoked enzymes.
This argument does not deny the critical role of error-prone
polymerases in the elimination of DNA damage, nor does it
deny the possibility that induced mutagenesis occasionallyplays a role in survival/adaptation in extreme times. The hy-
pothesis that mutation rates should naturally evolve to high-
er levels with enzymes involved in fewer replication events is
also consistent with the fact that polymerases involved in
the replacement of replication initiation primers have higher
error rates than those involved in bulk polymerization (fig. 4)
and that the primases that lay down the RNA primers initially
involved in replication but subsequently replaced are ex-traordinarily error prone (Zhang and Grosse 1990; Sheaff
and Kuchta 1994; Kuchta and Stengel 2010).
Third, for the reasons just noted, the error rates of path-
ways downstream in the stages of genome replication are
expected to be elevated relative to those for the initial
Lynch GBE
1114 Genome Biol. Evol. 3:1107–1118. doi:10.1093/gbe/evr066 Advance Access publication August 4, 2011

polymerization machinery, as a smaller number of nucleo-
tide sites will remain to be serviced. Thus, it is worth noting
that the in vitro proofreading error rates associated with the
major replication polymerases in Escherichia coli and Sac-charomyces cerevisiae, the only species for which data exist,
are much higher than those in the initial polymerization step
(Bebenek et al. 1990; Cai et al. 1995; Bloom et al. 1997;
Shimizu et al. 2002; Hashimota et al. 2003; Shcherbakova
et al. 2003; Fortune et al. 2005; Nick McElhinny et al. 2007;
Pursell et al. 2007; McCulloch et al. 2009). Observations on
the still further downstream mismatch repair (MMR) path-
way are also consistent with theoretical expectations. InE. coli, the in vitro error rate of the major replicative
polymerase is approximately 10�6 per base incorporation
(fig. 4), whereas the in vivo error rate associated with
MMR in this and most other species of eubacteria is in
the range of 0.01 to 0.05 (e.g., Schaaper and Dunn
1998; Prudhomme et al. 1991; Schaaper 1993; Fujii et al.
1999; Oliver et al. 2000; Richardson and Stojilkovic 2001;
Rossolillo and Albertini 2001; Young and Ornston 2001;Merino et al. 2002; Shaver and Sniegowski 2003; Prunier
and Leclercq 2005). (Here, the MMR error rate is simply de-
fined as the fraction of errors emerging after polymerase ac-
tion that are not eliminated by MMR.) Similarly, in the yeast
S. cerevisiae, the in vitro error rate of the major replicative
polymerase is approximately 5� 10�5 (fig. 4), whereas that
for MMR is approximately 0:025 (Prolla et al. 1994; Johnson
et al. 1996;Marsischky et al. 1996; Sia et al. 1997; Harringtonand Kolodner 2007); and in mammals, the respective rates
are approximately 10�5 (fig. 4) and 0.05 (Bhattacharyya
et al. 1995; Glaab and Tindall 1997; Tindall et al. 1998; Umar
et al. 1998; Baross-Francis et al. 2001; Xu et al. 2001; Zhang
FIG. 4.—In vitro estimates of rates of base misincorporation by polymerases in four species groups (given as averages from multiple estimates from
independent studies in Supplementary Material online). Rates are averaged over all nucleotide contexts, and for the error-prone polymerases, some sites
are replicated at fidelity rates considerably lower (and others considerably higher) than the average. Note that for Escherichia coli, Pol I is used to replace
the small RNA primers that initiate replication, and Pol III is the major replicative polymerase. For eukaryotes, Pol a is used to extend the RNA primers to
a DNA length sufficient for Pol d to take over, and Pols d and e are the major replicative polymerases (one for the leading and the other for the lagging
strand). Data are limited for archaeal polymerases.
Mutation-Rate Evolution GBE
Genome Biol. Evol. 3:1107–1118. doi:10.1093/gbe/evr066 Advance Access publication August 4, 2011 1115

et al. 2002; Dobrovolsky et al. 2003; Hegan et al. 2006). Thus,for the limited systems for which data are available, error rates
associated with MMR are three to four orders of magnitude
greater than those associated with the initial stages of
polymerization. Qualitatively, such a reduction is consistent
with the theory in the sense that during replication, the
MMR pathway operates at only the 10�6 to 10�5 fraction
of genomic sites that emerge with errors following the initial
stages of polymerization, while also engaging in other repairprocesses in nonreplicating DNA.
Fourth, the theory predicts that evolved mutation rates
should be elevated in recombining species relative to asexual
taxa with the same effective population sizes, by a factor
equal to approximately the inverse of the average selective
disadvantage of a new mutation, which is typically in the
range of 0.001–0.01 (Lynch and Walsh 1998). More gener-
ally, if a species switches fromobligate outcrossing to obligateasexual reproduction, selection is expected to reduce the mu-
tation rate if Na.2Ne�s; which suggests that truly asexual
species with very large population sizes will likely harbor par-
ticularly accurate replication systems. In the absence of accu-
rate information onNa=Ne for any such lineages, it is currently
difficult to address this matter in a confident way. It might be
argued that the reduced rate of mutation in prokaryotes rel-
ative to eukaryotes is qualitatively consistentwith this hypoth-esis, as prokaryotes are commonly viewed as being asexual.
However, indirect evidence suggests a comparable amount of
recombination in prokaryotes and eukaryotes when scaled to
the mutation rate (Lynch 2007).
It has been suggested that a bacterial endosymbiont in-
habiting aphids, and thought to haveNa=Ne � 1 and essen-
tially no recombination, has a mutation rate approximately
10� that in free-living bacterial species (Moran et al. 2009).As the two derived life history changes are expected to have
conflicting effects on the mutation rate, the theory suggests
that the reduction in Ne has had a greater effect than the
reduction in the recombination rate, although this interpre-
tation is clouded by the fact that an absence of recombina-
tion is expected to induce a reduction in Ne via hitchhiking
effects. A related point concerns the argument that
increased sensitivity to amino acid-altering mutations inthermophilic bacteria results in the evolution of a reduced
base-substitution mutation rate (Friedman et al. 2004). As
noted above, in nonrecombining species, the magnitude
of selection on the mutation rate is independent of the
fitness effects of mutations, which only become a factor
when the recombination rate is much greater than the
average deleterious effect of mutations. Thus, the validity
of the interpretation of Friedman et al. (2004) dependson the degree to which the genomes of thermophilic
bacteria are inherited in a clonal fashion.
Finally, it should be emphasized that the theory yields pre-
dictions on how the per-generation mutation rate is ex-
pected to evolve in response to deleterious mutation
load. Although large multicellular organisms exhibit sub-stantially higher per-generation germline mutation rates
than do single-celled eukaryotes (Lynch 2010), consistent
with the theory, the former also experience multiple germ-
line cell divisions per generation. As the per-generation mu-
tation rate is a consequence of the net accumulation of
mutations throughout germline development, the theory
predicts that the mutation rate per germline cell division
will scale inversely with the number of such divisions pergeneration. Although the evolution of multicellularity results
in a reduction in Ne, which is predicted to encourage an
increase in the mutation rate per generation, if the number
of germline cell divisions per generation is large enough, some
multicellular species may actually evolve lower mutation
rates per germline cell division than the per-generation
rates observed in microbes. This seems to be the case for
several well-studied model species, including humans, whichexhibit mutation rates per germline cell division that are
comparable with or lower than mutation rates in E. coliand yeast (Lynch 2010). The results in figure 4 suggest that
such low rates may be achieved by a reduction in intracellular
activities (e.g., metabolism) leading to premutations rather
than by an increase in the accuracy of the replication/repair
machinery.
Supplementary Material
Supplementary material is available at Genome Biology andEvolution online (http://www.gbe.oxfordjournals.org/).
Acknowledgments
The author thanks M. Ackerman, C. Baer, J. Drake, T. Kunkel,
and P. Sniegowski for their helpful comments. This work was
supported by the National Institute of Health (grant R01
GM036827 to M.L. and W. K. Thomas), National Science
Foundation (grant EF-0827411 to M.L.), and US Departmentof Defense (grant ONRBAA10-002 toM.L., P. Foster, H. Tang,
and S. Finkel).
Literature CitedBaer CF, Miyamoto MM, Denver DR. 2007. Mutation rate variation in
multicellular eukaryotes: causes and consequences. Nat Rev Genet.
8:619–631.
Baross-Francis A, Makhani N, Liskay RM, Jirik FR. 2001. Elevated mutant
frequencies and increased C: G/T: A transitions in Mlh1-/- versus
Pms2-/- murine small intestinal epithelial cells. Oncogene
20:619–625.
Bebenek A, Carver GT, Kadyrov FA, Kissling GE, Drake JW. 2005.
Processivity clamp gp45 and ssDNA-binding-protein gp32 modulate
the fidelity of bacteriophage RB69 DNA polymerase in a sequence-
specific manner, sometimes enhancing and sometimes compromis-
ing accuracy. Genetics 169:1815–1824.
Bebenek K, Joyce CM, Fitzgerald MP, Kunkel TA. 1990. The fidelity of
DNA synthesis catalyzed by derivatives of Escherichia coli DNA
polymerase I. J Biol Chem. 265:13878–13887.
Lynch GBE
1116 Genome Biol. Evol. 3:1107–1118. doi:10.1093/gbe/evr066 Advance Access publication August 4, 2011

Bessman MJ, Muzyczka N, Goodman MF, Schnaar RL. 1974. Studies on
the biochemical basis of spontaneous mutation. II. The incorpora-
tion of base and its analogue into DNA by wild type, mutator and
antimutator DNA polymerases. J Mol Biol. 88:409–421.
Bhattacharyya NP, et al. 1995. Molecular analysis of mutations in
mutator colorectal carcinoma cell lines. Hum Mol Genet.
4:2057–2064.
Bloom LB, et al. 1997. Fidelity of Escherichia coli DNA polymerase III
holoenzyme. The effects of beta, gamma complex processivity
proteins and epsilon proofreading exonuclease on nucleotide
misincorporation efficiencies. J Biol Chem. 272:27919–27930.
Cai H, Yu H, McEntee K, Kunkel TA, Goodman MF. 1995. Purification
and properties of wild-type and exonuclease-deficient DNA
polymerase II from Escherichia coli. J Biol Chem. 270:
15327–15335.
Casjens S. 1998. The diverse and dynamic structure of bacterial
genomes. Annu Rev Genet. 32:339–377.
Cox RA. 2004. Quantitative relationships for specific growth rates and
macromolecular compositions of Mycobacterium tuberculosis,
Streptomyces coelicolor A3(2) and Escherichia coli B/r: an integrative
theoretical approach. Microbiology 150:1413–1426.
Dawson KJ. 1999. The dynamics of infinitesimally rare alleles, applied to
the evolution of mutation rates and the expression of deleterious
mutations. Theor Popul Biol. 55:1–22.
Dobrovolsky VN, et al. 2003. Pms2 deficiency results in increased
mutation in the Hprt gene but not the Tk gene of Tk (þ/-) transgenic
mice. Mutagenesis 18:365–370.
Drake JW. 1991. A constant rate of spontaneous mutation in DNA-
based microbes. Proc Natl Acad Sci U S A. 88:7160–7164.
Drake JW. 1993. General antimutators are improbable. J Mol Biol.
229:8–13.
Earl DJ, Deem MW. 2004. Evolvability is a selectable trait. Proc Natl Acad
Sci U S A. 101:11531–11536.
Fijalkowska IJ, Dunn RL, Schaaper RM. 1993. Mutants of Escherichia coli
with increased fidelity of DNA replication. Genetics 134:1023–1030.
Fortune JM, et al. 2005. Saccharomyces cerevisiae DNA polymerase d:high fidelity for base substitutions but lower fidelity for single- and
multi-base deletions. J Biol Chem. 280:29980–29987.
Foster PL. 2007. Stress-induced mutagenesis in bacteria. Crit Rev
Biochem Mol Biol. 42:373–397.
Friedman R, Drake JW, Hughes AL. 2004. Genome-wide patterns of
nucleotide substitution reveal stringent functional constraints on the
protein sequences of thermophiles. Genetics 167:1507–1512.
Fujii S, et al. 1999. DNA replication errors produced by the replicative
apparatus of Escherichia coli. J Mol Biol. 289:835–850.
Furio V, Moya A, Sanjuan R. 2005. The cost of replication fidelity in an
RNA virus. Proc Natl Acad Sci U S A. 102:10233–10237.
Furio V, Moya A, Sanjuan R. 2007. The cost of replication fidelity in
human immunodeficiency virus type 1. Proc Biol Sci. 274:225–230.
Galan JC, et al. 2007. Mutation rate is reduced by increased dosage of
mutL gene in Escherichia coli K-12. FEMS Microbiol Lett.
275:263–269.
Galhardo RS, Hastings PJ, Rosenberg SM. 2007. Mutation as a stress
response and the regulation of evolvability. Crit Rev Biochem Mol
Biol. 42:399–435.
Gerrish PJ, Colato A, Perelson AS, Sniegowski PD. 2007. Complete genetic
linkage can subvert natural selection. Proc Natl Acad Sci U S A.
104:6266–6271.
Glaab WE, Tindall KR. 1997. Mutation rate at the hprt locus in human
cancer cell lines with specific mismatch repair-gene defects.
Carcinogenesis 18:1–8.
Gordo I, Charlesworth B. 2000. The degeneration of asexual haploid
populations and the speed of Muller’s ratchet. Genetics 154:
1379–1387.
Haigh J. 1978. The accumulation of deleterious genes in a population—
Muller’s ratchet. Theor Popul Biol. 14:251–267.
Hall LM, Henderson-Begg SK. 2006. Hypermutable bacteria isolated
from humans—a critical analysis. Microbiology 152:2505–2514.
Harrington JM, Kolodner RD. 2007. Saccharomyces cerevisiae Msh2-
Msh3 acts in repair of base-base mispairs. Mol Cell Biol.
27:6546–6554.
Hashimoto K, Shimizu K, Nakashima N, Sugino A. 2003. Fidelity of DNA
polymerase d holoenzyme from Saccharomyces cerevisiae: the
sliding clamp proliferating cell nuclear antigen decreases its fidelity.
Biochemistry 42:14207–14213.
Hegan DC, et al. 2006. Differing patterns of genetic instability in mice
deficient in the mismatch repair genes Pms2, Mlh1, Msh2, Msh3
and Msh6. Carcinogenesis 27:2402–2408.
Ingraham JL, Maaløe O, Neidhardt FC. 1983. Growth of the bacterial
cell. Sunderland (MA): Sinauer Associates.
Johnson RE, Kovvali GK, Prakash L, Prakash S. 1996. Requirement of the
yeast MSH3 and MSH6 genes for MSH2-dependent genomic
stability. J Biol Chem. 271:7285–7288.
Johnson T. 1999a. The approach to mutation-selection balance in an
infinite asexual population, and the evolution of mutation rates.
Proc R Soc Lond B. 266:2389–2397.
Johnson T. 1999b. Beneficial mutations, hitchhiking and the evolution
of mutation rates in sexual populations. Genetics 151:
1621–1631.
Kimura M. 1967. On the evolutionary adjustment of spontaneous
mutation rates. Genet Res. 9:23–34.
Kimura M, Ohta T. 1969. The average number of generations until
fixation of a mutant gene in a finite population. Genetics
61:763–771.
Kondrashov AS. 1995. Modifiers of mutation-selection balance: general
approach and the evolution of mutation rates. Genet Res.
66:53–70.
Kuchta RD, Stengel G. 2010. Mechanism and evolution of DNA
primases. Biochim Biophys Acta. 1804:1180–1189.
Loh E, Choe J, Loeb LA. 2007. Highly tolerated amino acid substitutions
increase the fidelity of Escherichia coli DNA polymerase I. J Biol
Chem. 282:12201–12209.
Loh E, Salk JJ, Loeb LA. 2010. Optimization of DNA polymerase
mutation rates during bacterial evolution. Proc Natl Acad Sci U S A.
107:1154–1159.
Lynch M. 2007. The origins of genome architecture. Sunderland (MA):
Sinauer Associates.
Lynch M. 2008. The cellular, developmental, and population-genetic
determinants of mutation-rate evolution. Genetics 180:933–943.
Lynch M. 2010. Evolution of the mutation rate. Trends Genet.
26:345–352.
Lynch M, Gabriel W. 1990. Mutation load and the survival of small
populations. Evolution 44:1725–1737.
Lynch M, Walsh JB. 1998. Genetics and analysis of quantitative traits.
Sunderland (MA): Sinauer Associates.
Lynch RB, Butcher D, Gabriel W. 1993. Mutational meltdowns in asexual
populations. Heredity J. 84:339–344.
Marsischky GT, Filosi N, Kane MF, Kolodner R. 1996. Redundancy of
Saccharomyces cerevisiae MSH3 and MSH6 in MSH2-dependent
mismatch repair. Genes Dev. 10:407–420.
Maruyama T. 1974. The age of an allele in a finite population. Genet
Res. 23:137143.
Mutation-Rate Evolution GBE
Genome Biol. Evol. 3:1107–1118. doi:10.1093/gbe/evr066 Advance Access publication August 4, 2011 1117
McCulloch SD, Kokoska RJ, Garg P, Burgers PM, Kunkel TA. 2009. The
efficiency and fidelity of 8-oxo-guanine bypass by DNA polymerases
d and g. Nucleic Acids Res. 37:2830–2840.
Merino D, Reglier-Poupet H, Berche P, Charbit A. European Listeria
Genome Consortium. 2002. A hypermutator phenotype attenuates
the virulence of Listeria monocytogenes in a mouse model. Mol
Microbiol. 44:877–887.
Moran NA, McLaughlin HJ, Sorek R. 2009. The dynamics and time scale of
ongoing genomic erosion in symbiotic bacteria. Science 323:379–382.
Nei M, Roychoudhury AK. 1973. Probability of fixation and mean
fixation time of an overdominant mutation. Genetics 74:371–380.
Nick McElhinny SA, Stith CM, Burgers PMJ, Kunkel TA. 2007. Inefficient
proofreading and biased error rates during inaccurate DNA synthesis
by a mutant derivative of Saccharomyces cerevisiae DNA polymerase
d. J Biol Chem. 282:2324–2332.
Oliver A, Canton R, Campo P, Baquero F, Blazquez J. 2000. High
frequency of hypermutable Pseudomonas aeruginosa in cystic
fibrosis lung infection. Science 288:1251–1254.
Prolla TA, Christie DM, Liskay RM. 1994. Dual requirement in yeast DNA
mismatch repair forMLH1 and PMS1, two homologs of the bacterial
mutL gene. Mol Cell Biol. 14:407–415.
Prudhomme M, Mejean V, Martin B, Claverys JP. 1991. Mismatch repair
genes of Streptococcus pneumoniae: HexA confers a mutator
phenotype in Escherichia coli by negative complementation. J
Bacteriol. 173:7196–7203.
Prunier AL, Leclercq R. 2005. Role of mutS and mutL genes in
hypermutability and recombination in Staphylococcus aureus. J
Bacteriol. 187:3455–3464.
Pursell ZF, Isoz I, Lundstrom EB, Johansson E, Kunkel TA. 2007. Regulation
of B family DNA polymerase fidelity by a conserved active site residue:
characterization of M644W, M644L and M644F mutants of yeast
DNA polymerase e. Nucleic Acids Res. 35:3076–3086.
Radman M, Taddei F, Matic I. 2000. Evolution-driving genes. Res
Microbiol. 151:91–95.
Richardson AR, Stojiljkovic I. 2001. Mismatch repair and the regulation of
phase variation in Neisseria meningitidis. Mol Microbiol. 40:645–655.
Rosenberg SM. 2001. Evolving responsively: adaptive mutation. Nat Rev
Genet. 2:504–515.
Rossolillo P, Albertini AM. 2001. Functional analysis of the Bacillus subtilis
y shD gene, a mutS paralogue. Mol Gen Genet. 264:809–818.
Schaaper RM. 1993. Base selection, proofreading, and mismatch repair
during DNA replication in Escherichia coli. J Biol Chem.
268:23762–23765.
Schaaper RM. 1998. Antimutator mutants in bacteriophage T4 and
Escherichia coli. Genetics 148:1579–1585.
Schaaper RM, Dunn RL. 1998. Effect of Escherichia coli dnaE
antimutator mutants on mutagenesis by the base analog N4-
aminocytidine. Mutat Res. 402:23–28.
Shaver AC, Sniegowski PD. 2003. Spontaneously arising mutL mutators
in evolving Escherichia coli populations are the result of changes in
repeat length. J Bacteriol. 185:6076–6082.
Shcherbakova PV, et al. 2003. Unique error signature of the four-subunit
yeast DNA polymerase e. J Biol Chem. 278:43770–43780.
Sheaff RJ, Kuchta RD. 1994. Misincorporation of nucleotides by calf
thymus DNA primase and elongation of primers containing multiple
noncognate nucleotides by DNA polymerase alpha. J Biol Chem.
269:19225–19231.
Shimizu K, et al. 2002. Fidelity of DNA polymerase e holoenzyme from
budding yeast Saccharomyces cerevisiae. J Biol Chem.
277:37422–37429.
Sia EA, Kokoska RJ, Dominska M, Greenwell P, Petes TD. 1997.
Microsatellite instability in yeast: dependence on repeat unit size
and DNA mismatch repair genes. Mol Cell Biol. 17:2851–2858.
Sniegowski PD, Gerrish PJ, Lenski RE. 1997. Evolution of high
mutation rates in experimental populations of E. coli. Nature
387:703–705.
Sturtevant AH. 1937. Essays on evolution. I. On the effects of selection
on mutation rate. Quart Rev Biol. 12:464–476.
Taddei F, et al. 1997. Role of mutator alleles in adaptive evolution.
Nature 387:700–702.
Taylor C, Iwasa Y, Nowak MA. 2006. A symmetry of fixation times in
evolutionary dynamics. J Theor Biol. 243:245–251.
Tenaillon O, Taddei F, Radman M, Matic I. 2001. Second-order
selection in bacterial evolution: selection acting on mutation and
recombination rates in the course of adaptation. Res Microbiol.
152:11–16.
Tian W, Hwang YT, Hwang CB. 2008. The enhanced DNA replication
fidelity of a mutant herpes simplex virus type 1 DNA polymerase is
mediated by an improved nucleotide selectivity and reduced
mismatch extension ability. J Virol. 82:8937–8941.
Tindall KR, et al. 1998. Complementation of mismatch repair gene
defects by chromosome transfer. Mutat Res. 402:15–22.
Trobner W, Piechocki R. 1984. Selection against hypermutability in
Escherichia coli during long term evolution. Mol Gen Genet.
198:177–178.
Umar A, et al. 1998. Functional overlap in mismatch repair by human
MSH3 and MSH6. Genetics 148:1637–1646.
Vieira-Silva S, Touchon M, Rocha EP. 2010. No evidence for elemental-
based streamlining of prokaryotic genomes. Trends Ecol Evol.
25:319–320.
Xu XS, Narayanan L, Dunklee B, Liskay RM, Glazer PM. 2001.
Hypermutability to ionizing radiation in mismatch repair-deficient,
Pms2 knockout mice. Cancer Res. 61:3775–3780.
Young DM, Ornston LN. 2001. Functions of the mismatch repair gene
mutS from Acinetobacter sp. strain ADP1. J Bacteriol.
183:6822–6831.
Zhang S, Lloyd R, Bowden G, Glickman BW, de Boer JG. 2002. Thymic
lymphomas arising in Msh2 deficient mice display a large increase in
mutation frequency and an altered mutational spectrum. Mutat Res.
500:67–74.
Zhang SS, Grosse F. 1990. Accuracy of DNA primase. J Mol Biol.
216:475–479.
Associate editor: Dmitri Petrov
Lynch GBE
1118 Genome Biol. Evol. 3:1107–1118. doi:10.1093/gbe/evr066 Advance Access publication August 4, 2011