The Looming Crisis in the Multifamily Housing Market/media/others/events/2010/risk... · The...
52
The Multifamily Housing Market and Value-at-Risk Implications for Multifamily Lending James D. Shilling† DePaul University This Draft: February 2010 Keywords: affordable rental housing, multifamily lending, mortgages, Fannie Mae, Freddie Mac, government sponsored enterprises, FHA, nonprofit organizations JEL Classifications: G21, G28, R31 †DePaul University, 1 East Jackson Boulevard, Chicago, IL 60606, Email: [email protected] . I thank David Barker, Stuart Gabriel, and Andrey Pavlov for their comments and suggestions. The John D. and Catherine T. MacArthur Foundation provided support for this research.
Transcript of The Looming Crisis in the Multifamily Housing Market/media/others/events/2010/risk... · The...
The Multifamily Housing Market and Value-at-Risk Implications for Multifamily Lending
James D. Shilling† DePaul University
This Draft: February 2010 Keywords: affordable rental housing, multifamily lending, mortgages, Fannie Mae, Freddie Mac, government sponsored enterprises, FHA, nonprofit organizations JEL Classifications: G21, G28, R31 †DePaul University, 1 East Jackson Boulevard, Chicago, IL 60606, Email: [email protected]. I thank David Barker, Stuart Gabriel, and Andrey Pavlov for their comments and suggestions. The John D. and Catherine T. MacArthur Foundation provided support for this research.

1
Summary of Key Findings
• Prices of large (7+ unit) rental properties in Cook County have declined from (an index value of) 166 in the
third quarter of 2006 to 123 in the second quarter of 2009, a decline of 26%. Prices of small (2-6 unit) rental
properties in Cook County have fallen from (an index value of) 193 in the second quarter of 2007 to 104 in the
second quarter of 2009, a decline of 46%.
• Falling property values in Cook County have put roughly $13 billion of multifamily mortgages (or
approximately 30% of the total outstanding multifamily mortgage debt) at risk of default. Total value at risk for
small 2-6 unit rental properties is $12.6 billion. For large 7+ unit rental properties, the total value at risk is $747
million.
• Falling property values have meant a rise in multifamily foreclosures. Foreclosures on both small (2-6 unit) and
large (7+ unit) properties in Cook County have increased considerably in 2009. As a percent of outstanding
loans, foreclosures on small (2-6 unit) properties are between 4 to 14%, depending on income submarket.
Among large (7+ unit) properties, foreclosures are between 2 to 8% of outstanding loans in the same income
submarkets. By loan cohort, foreclosures are led by loans originated between 2005 and 2007, a period of over-
lending and over-spending.
• Multifamily foreclosures on both small 2-6 unit rental properties and large 7+ unit rental properties are
estimated to have impacted more than 32,000 units in the Cook County rental market (as of year-end 2009). In
contrast, there are currently about 38,000 single-family units in foreclosure in Cook County.
• Falling property values have forced many lenders to “pretend and extend.” Lenders have delayed foreclosures
on about $1.5 billion of multifamily mortgage debt in Cook County.
• Price declines and deleveraging imply less multifamily mortgage lending in Cook County. Multifamily
mortgage debt on small 2-6 unit rental properties in Cook County, on average, grew from $17.4 billion in 2004
to $28.8 billion in 2007, an increase of 66%. Debt on large 7+ unit properties also increased significantly over
this same time period, from $5.4 billion in 2004 to $12.5 billion in 2007, an increase of 128%. However, new
issuance of multifamily mortgage debt on small 2-6 unit properties in Cook County fell to $5 billion in 2008,
down 39% from 2007, and fell even further in 2009. Similarly, the new issuance of multifamily mortgage debt
2
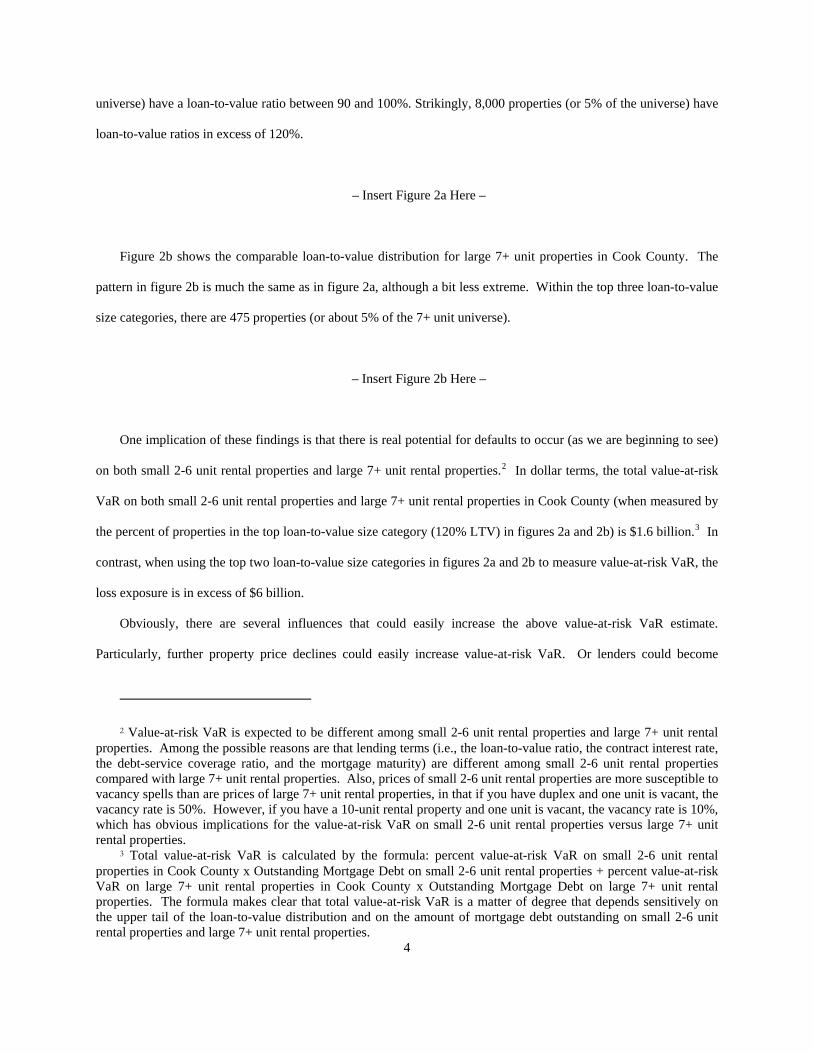
on large 7+ unit properties in Cook County fell to $2.7 billion in 2008, down 45% from 2007, and fell again in
2009.
• As local lending institutions have scaled backed their lending to large 7+ unit properties in 2008 and 2009,
Fannie Mae and Freddie Mac have essentially become indispensable to the Cook County multifamily mortgage
market. The GSEs’ share of the large 7+ unit multifamily mortgage market in Cook County is around 65 to 70%
of all lending. Fannie Mae and Freddie Mac are also indispensable to the small 2-6 unit multifamily mortgage
market in Cook County, but for an altogether different reason.
• Disinvestment is occurring as rents and property values are declining. Net rental revenues are currently at or
below total operating costs for about 74,000 rental units in the city of Chicago.
• Certain short-run policy prescriptions are clear from the analysis, including the need Fannie Mae or Freddie
Mac to provide continued liquidity and stability to the multifamily mortgage market in the immediate term.
• The analysis also sees an expanded lending role for FHA in the current environment. FHA multifamily lending
has always featured financing for the purchase, construction, and substantial rehabilitation of rental properties,
and a strong case can be made that, if any one thing is most needed in this environment, it is joint financing for
the purchase and rehabilitation of rental properties.
• Long-run policy must necessarily take into account the extent to which Fannie Mae and Freddie Mac subsidize
interest and create an incentive to take on excessive debt.

1
1. Introduction
This paper examines the recent property price declines and foreclosure experience on multifamily mortgages in
Cook County (Chicago) over the period 1998 to 2009. Falling property prices in Cook County have put roughly $13
billion of multifamily mortgages (or approximately 30% of the total outstanding multifamily mortgage debt) at risk
of default; have led to significant disinvestment by landlords; have caused the percent of multifamily mortgage loans
in foreclosures to increase to 6.8% (or about $3 billion); have forced lenders to “pretend and extend” about $1.5
billion of multifamily mortgages to date; and have compelled most banks to cut back on their multifamily mortgage
lending significantly, raising the question of what will happen as $15 billion of multifamily mortgage debt (or about
33% of the stock of outstanding debt) matures between 2010 and 2015. Fortunately or unfortunately, as it may be,
there is Fannie Mae and Freddie Mac. Combined, Fannie Mae and Freddie Mac currently account for 65 to 70% of
all multifamily mortgage originations in Cook County. Thus, as it has turned out, Fannie Mae and Freddie Mac
have become an indispensable part of today’s multifamily mortgage market. Yet many policy advocates would like
to reduce the size of the portfolios held by Fannie Mae and Freddie Mac in order to limit the taxpayers’ exposure for
high risk single-family mortgages and mortgage-backed securities. However, reducing the size of the portfolios held
by Fannie Mae and Freddie Mac in the current environment could, all things considered, make the multifamily
housing market worse off and the resulting volatility could impose large welfare losses on tenants.
The policy implications for the multifamily housing market, however, are markedly different over a longer run
than in the immediate situation. Long-run policy, extending beyond the next five years, must necessarily take into
account the extent to which Fannie Mae and Freddie Mac subsidize interest and create an incentive to take on
excessive debt. Too much debt, as we have seen, can have a destabilizing effect on markets. Thus, over a longer
run the theory supports a much more targeted policy approach in dealing with Fannie Mae and Freddie Mac.
2. Trend in Multifamily Property Prices
This section analyzes the trends in property prices for both small 2-6 unit rental properties and large 7+ unit
rental properties in Cook County over the past decade. The methodology used to estimate these price trends is the
repeat sales methodology. The data are collected from the Cook County Recorder property sales data. The study
analyzes 25,822 repeat sales of small 2-6 unit rental properties and 591 repeat sales of large 7+ unit rental properties.
All seventy-seven community areas of Chicago (including 935 census tracts) as well as North Shore suburbs such as

2
Winnetka and Evanston, northwest suburbs such as Schaumburg, Arlington Heights, and parts of Barrington,
western suburbs such as Oak Park and La Grange, and south suburbs such as Homewood and Harvey are included in
our sample. The sample period is from 1991 to 2009 and all data are quarterly. The methodology measures average
price changes in repeat sales of the same property. A multivariate regression is employed to compute the average
price changes across the different properties within the sample.
Prices of large 7+ unit rental properties in Cook County, after rising dramatically through the 2000s, fell from
an index value 166 in the third quarter of 2006 to 123 in the second quarter of 2009, a decline of 26% (see figure 1).
In real terms, using the Consumer Price Index for Chicago to correct for inflation, the decline in value between these
two dates is 30%. The decline is quite similar to the price declines that are taking place in virtually all other
multifamily property markets in the US; for example, the NPI apartment price index, a nationwide index of
multifamily properties acquired in the private market for investment purposes only by institutional investors, has
fallen 21% from its peak in the second quarter of 2008.1 In real terms the NPI apartment price index fell 24%.
– Insert Figure 1 Here –
Figure 1 also plots the data on prices of small 2-6 unit rental buildings in Cook County over the same time
period. Beginning in the second quarter of 2007, property prices of small 2-6 rental buildings in Cook County
started to fall. For another year and a half, the price of small 2-6 unit rental properties falls (as shown in figure 1)
from 193 to 103, a decrease of 46%. The real price decline (deflated using the Consumer Price Index for Chicago)
between the second quarter of 2007 and the second quarter of 2009 is 48%, in this case partly sparked by a much
bigger run-up in price than we saw in large 7+ unit rental buildings – between the first quarter of 2000 and the
second quarter of 2007 (price peak), prices of small 2-6 unit rental buildings in Cook County increased by 61% in
real terms, whereas prices of large 7+ rental properties increased by only 43% (from the first quarter of 2000 to the
third quarter of 2006).
1 An important problem to realize is that the NPI Index is based on appraised values, and incorporates information into prices much later than transaction prices. In contrast, our repeat sales methodology is based on actual transactions prices.

3
These price declines raise a series of concerns, many of which have not been examined before. For example,
what is the overall value-at-risk within the multifamily mortgage market that is implied by current property prices?
How much of this value-at-risk is coming from loans that were bad from the beginning (where investors over-spent
and/or over-levered)? How has this value-at-risk affected the sudden downturn in lending activities within the
multifamily mortgage market? Has the multifamily housing market been seriously impaired as a result? Has the
value-at-risk grown so large that risky loans are being automatically rolled over as they mature? Would we expect a
large number of the impacted rental properties to filter down in value and are we at risk of permanently losing a
portion of the foreclosed inventory? What policy prescriptions follow from this assessment? To begin to address
these questions, a loss assessment is conducted in the next section using current or contemporaneous debt-to-value
ratios.
3. Contemporaneous Debt-to-Value Ratios
Falling property values have put scores of multifamily borrowers into extremely vulnerable situations. A
simple way to measure the extent of this vulnerability is via current loan-to-value ratios. While a high loan-to-value
ratio (i.e., a loan-to-value ratio in excess of 100%) is, by itself, not a sufficient condition to force a borrower into
default, it tends to be the main characteristic (for obvious reasons) influencing the default decision.
To compute current loan-to-value ratio measures, the following procedure is used. The calculations begin with
the actual loan-to-value ratio at loan origination on small 2-6 unit rental properties and large 7+ unit rental properties
(which are inferred from mortgage title information). The increases or decreases in the property price index are then
used to update the property’s market value over time. The current outstanding principal amount of the loan is
computed by finding the loan’s proportion outstanding factor (an amount that depends on three factors – the contract
interest rate, the mortgage maturity, and the holding period) and multiplying this factor by the original loan amount.
The loan’s contract interest rate and its mortgage maturity are approximated by using survey interest rates and
maturities on multifamily mortgages reported for the nation on the whole and matched to origination year. The
properties are then ranked on loan-to-value and assigned to one of seven groups.
Figure 2a shows the loan-to-value distribution for small 2-6 unit properties in Cook County as of the second
quarter of 2009. Clearly, the distribution is highly skewed to the right. There are 96,000 properties (or 42% of the
2-6 unit universe) with loan-to-value ratios in excess of 100%, and another 30,000 properties (or 21% of the
4
universe) have a loan-to-value ratio between 90 and 100%. Strikingly, 8,000 properties (or 5% of the universe) have
loan-to-value ratios in excess of 120%.
– Insert Figure 2a Here –
Figure 2b shows the comparable loan-to-value distribution for large 7+ unit properties in Cook County. The
pattern in figure 2b is much the same as in figure 2a, although a bit less extreme. Within the top three loan-to-value
size categories, there are 475 properties (or about 5% of the 7+ unit universe).
– Insert Figure 2b Here –
One implication of these findings is that there is real potential for defaults to occur (as we are beginning to see)
on both small 2-6 unit rental properties and large 7+ unit rental properties.2 In dollar terms, the total value-at-risk
VaR on both small 2-6 unit rental properties and large 7+ unit rental properties in Cook County (when measured by
the percent of properties in the top loan-to-value size category (120% LTV) in figures 2a and 2b) is $1.6 billion.3 In
contrast, when using the top two loan-to-value size categories in figures 2a and 2b to measure value-at-risk VaR, the
loss exposure is in excess of $6 billion.
Obviously, there are several influences that could easily increase the above value-at-risk VaR estimate.
Particularly, further property price declines could easily increase value-at-risk VaR. Or lenders could become
2 Value-at-risk VaR is expected to be different among small 2-6 unit rental properties and large 7+ unit rental properties. Among the possible reasons are that lending terms (i.e., the loan-to-value ratio, the contract interest rate, the debt-service coverage ratio, and the mortgage maturity) are different among small 2-6 unit rental properties compared with large 7+ unit rental properties. Also, prices of small 2-6 unit rental properties are more susceptible to vacancy spells than are prices of large 7+ unit rental properties, in that if you have duplex and one unit is vacant, the vacancy rate is 50%. However, if you have a 10-unit rental property and one unit is vacant, the vacancy rate is 10%, which has obvious implications for the value-at-risk VaR on small 2-6 unit rental properties versus large 7+ unit rental properties.
3 Total value-at-risk VaR is calculated by the formula: percent value-at-risk VaR on small 2-6 unit rental properties in Cook County x Outstanding Mortgage Debt on small 2-6 unit rental properties + percent value-at-risk VaR on large 7+ unit rental properties in Cook County x Outstanding Mortgage Debt on large 7+ unit rental properties. The formula makes clear that total value-at-risk VaR is a matter of degree that depends sensitively on the upper tail of the loan-to-value distribution and on the amount of mortgage debt outstanding on small 2-6 unit rental properties and large 7+ unit rental properties.
5
unwilling to roll over existing loans, causing defaults to rise at loan maturity. Or there could be a further increase in
vacancies or decrease in rents, setting off further cash flow problems. Further, there is a significant amount of
skewness in the distributions in figures 2a and 2b. To illustrate, the effect of an additional 10 to 15% decline in
property prices would be to increase total value-at-risk VaR in Cook County to about $12.5 billion, which is highly
significant.
Were one to draw conclusions from these estimates, one would have to conclude that lenders in Cook County
(or nationwide for that matter) are hardly in a position to absorb these potential losses. Assuming the loss exposure
calculated above for Cook County can be applied to the other 3,141 counties in the US (albeit a heroic assumption),
and re-weighting the results to reflect the actual distribution of small 2-6 unit rental properties and large 7+ unit
rental properties nationwide,4 the total value-at-risk VaR for the nation as whole is estimated to be between $300
and $700 billion, which puts the total value-at-risk VaR on par with the subprime mortgage meltdown.5
4. Multifamily Default Rates
In 2009, new foreclosure filings continued at a record pace. With the exception of the second quarter of 2009,
new foreclosure filings on both 2-6 unit rental properties and large 7+ unit rental properties were higher than in the
same quarter the previous year. On 2-6 unit rental properties, new foreclosure filings are between 1900 and 2100
per quarter. On 7+ unit rental properties, new foreclosure filings are between 50 and 100 per quarter.
4.1 Eighteen-Month Trailing Foreclosure Inventory
The eighteen-month trailing foreclosure inventory on both small 2-6 unit rental properties and large 7+ unit
rental properties in Cook County in the fourth quarter of 2009 is up year-over-year. See figure 3. Further, as can be
4 The vast majority of the multifamily housing stock in Cook County (62% of the universe) consists of small 2-6 unit rental properties. That means that Cook County is very much different from most counties in the US. In other counties in the US, small 2-6 unit rental properties generally make up only a small portion (about 20%) of the multifamily housing stock (at least according to American Community Survey data).
5 Outstanding mortgage data used for the purpose of these at-risk VaR calculations are the estimates of the Federal Reserve Board Flow of Funds. We take the outstanding mortgage debt on small 2-6 unit rental properties nationwide to be about $1.3 trillion (estimated using a fair-share formula based on number of multifamily dwelling units by size of structure) and the outstanding mortgage debt on large 7+ unit rental properties nationwide to be $824 billion (estimated as a residual, by deducting total mortgage debt on multifamily buildings having 5 or 6 units from total multifamily mortgage debt).

6
seen in figure 3, the inventory of foreclosures has substantially gone up in Cook County over the past several years,
both on small 2-6 unit rental properties and large 7+ unit rental properties. 6 Five years ago, the foreclosure rate
(percent of loans in foreclosure) on small 2-6 unit properties was only 1.67%. In contrast, in the fourth quarter of
2009, the foreclosure rate on small 2-6 unit rental properties was in excess of 8.75%. This is a sea-change of
behavior.7 Similarly, on large 7+ unit rental properties, foreclosure rates have increased from 0.3% in 2004, to 0.7%
in 2007, and to approximately 3% in the fourth quarter of 2009. These numbers generally reflect the trends in the
national multifamily CMBS market (see figure 4).
– Insert Figure 3 Here –
– Insert Figure 4 Here –
Figure 3 highlights another crucially important fact. The solid gray line in figure 3 represents the mean
foreclosure rate on all multifamily properties in Cook County. Here a foreclosure rate of approximately 7% means
that about $3 billion of multifamily mortgage loans in Cook County are currently (as of the fourth quarter of 2009)
in foreclosure. Surprisingly enough, these numbers translate into a total number of multifamily rental units
impacted of more than 32,000 units. In contrast, there are currently about 38,000 single-family units in foreclosure
in Cook County (which suggests that the multifamily rental market has not been spared in the current financial
crisis).
4.2 Foreclosure Rates by Loan Cohort
Of the multifamily mortgages originated on small 2-6 unit rental properties between 2005 and 2007 around 15%
have already gone into foreclosure (see figure 5). In contrast, of the multifamily mortgages originated on small 2-6
unit rental properties between 2000 and 2004 the cumulative foreclosure rate is only 5%. It is not easy for so many
loans originated between 2005 and 2007 to go into foreclosure unless these loans were bad almost at the first – i.e.,
6 The foreclosures inventory is an eighteen month trailing calculation from foreclosure filing data obtained from Record Information Services and Property Insight.
7 These increases have occurred despite the moratorium that started in second quarter of 2009 on foreclosures that prevented lenders from foreclosing for up to 3 months. Moreover, we are told anecdotally that many lenders earlier in the year instituted a self-imposed moratorium on foreclosures aimed at reducing the extended waiting times to take possession of a property because of a longstanding backlog of cases.

7
unless they suffered from over-lending and over-spending from the beginning. For the earlier loan vintages, there
appears to be something of a flattening out of defaults, suggesting that perhaps the early defaults on these loans were
“rotten apples” and unusual from the beginning, and now that they have subsequently defaulted we may see less
defaults going forward, that is, until the loan matures and the borrower is forced to come up with additional
collateral to offset the decline in property value, creating significant risk that these mortgages will default on their
principal at loan maturity.
– Insert Figure 5 Here –
The total size of the 2005-2007 loan cohort is quite large. In contrast to the earlier loan cohorts, the 2005-2007
loan cohort of multifamily mortgages originated on small 2-6 unit properties represents about 88% of total stock of
outstanding mortgage debt on small 2-6 unit properties in Cook County. It is certainly possible for foreclosure rates
on the loan cohorts 2005-2007 to have higher default rates than loans originated in earlier years. One of the
paradoxes of mortgage lending is that lenders do not initially know when property prices are inflated and when they
are not. Another paradox is that lenders generally make their worst loans during periods of rising property values,
when both good and bad borrowers rush to borrow, over-spending and over-levering along the way. As a result,
cohort effects in mortgages can be significant and persistent.
Not too surprising, the foreclosure rates of multifamily mortgages originated on large 7+ unit rental properties
between 2005 and 2007 are also quite high. Of the multifamily mortgages originated on large 7+ unit rental
properties in Cook County between 2005 and 2007, the cumulative foreclosure rate is between 3 and 4.2%. In
contrast, on multifamily mortgages originated on large 7+ unit rental properties before 2005, the foreclosure rate is
only approximately 2%; surely much more manageable from a public policy perspective. However, as was
discussed earlier, the total value-at-risk on large 7+ unit rental properties could essentially increase the foreclosure
rate by 1.67 times. Further, it needs to be pointed out that the 2005-2007 loan cohort of multifamily mortgages
originated on large 7+ unit rental properties is nearly $11 billion in size, which is approximately 79% of the total
stock of outstanding mortgage debt on large 7+ unit rental properties in Cook County. Of these loans, the total
value-at-risk VaR is considerably greater than it is on those loans originated before 2005.

8
4.3 Foreclosure Rates by Income Submarkets
Multifamily foreclosures in Cook County are highly concentrated (at least 3 to 4 times higher in concentration)
in low- and moderate-income markets compared to higher income markets. To illustrate, in low- and moderate-
income markets, multifamily foreclosure rates (as of the fourth quarter of 2009) are as high as 13.9% on small 2-6
unit rental properties and 7.8% on large 7+ unit rental properties. In contrast, in high-income markets multifamily
foreclosure rates are only 4.2% on small 2-6 unit rental properties and approximately 2% on large 7+ unit rental
properties. See table 1.
– Insert Table 1 Here –
As to why foreclosures are highly concentrated in low- and moderate-income markets, the possible explanations
are several: the economic recession has had significant impacts on low- and moderate-income households. As a
result, low- and moderate-income households have seen their incomes drop considerably. This drop in household
income has generally worsened rental affordability for most low- and moderate-income households, despite the fact
that rents have dropped. Further, the reduced affordability has meant high overall vacancy rates and lower net
effective rents in low- and moderate-income markets, placing strains on property cash flows in these markets.
4.4 Foreclosure Rates by Area Submarket
By submarket, the highest foreclosure rates on small 2-6 unit rental properties are being experienced by the
West submarket, containing community areas such as West Garfield Park and Humboldt Park, by the South
submarket with community areas such as Englewood and New City, and by the Northwest submarket with
community areas such as Belmont Craigin and Hermosa. See figure 6. There are 7,000 small 2-6 unit rental
properties in foreclosure (representing 21,000 units) located in these three concentrated geographic areas. These
21,000 units constitute over 75% of the small 2-6 unit rental foreclosed inventory in the city of Chicago. Alongside,
for comparison, figure 6 also shows the Neighborhood Stabilization Program (NSP) 1 target areas.
– Insert Figure 6 Here –

9
Among large 7+ unit rental properties, the highest foreclosure rates are in community areas such as Austin and
West Garfield Park on the West side of Chicago, in community areas such as Avalon Park and Kenwood on the
South side, and in Far South-side community areas such as Chatham and South Shore. These three concentrated
geographic areas contain over 65% of the large 7+ unit rental foreclosed inventory (representing 5,000 units).
In suburban Cook County, multifamily foreclosure rates are generally much lower than in the city of Chicago as
a whole. Suburban Cook County contains approximately 22% (or 161,000 units) of the total rental housing stock in
the county. However, suburban Cook County only accounts for 15% (representing 6,500 units) of the multifamily
foreclosures in 2009. Further, most rental submarkets in suburban Cook County have foreclosure rates between 0
and 7 % on small 2-6 unit rental properties and between 0 and 1% on large 7+ unit rental properties.
5. Multifamily Lending
From a micro perspective, as prices fall, lenders generally become unwilling (and justifiably so) to make any
new loans or roll over any existing loans. Under these conditions, lending generally stops (this includes lending on
new projects as well as lending to existing projects). While such behavior may be rational from a micro perspective,
it can, nonetheless, be counterproductive (as we are seeing today) from a macro perspective.
The data reveal an epic decrease in multifamily lending activity in Cook County. Over the period 2004-2007,
as illustrated in figure 7 multifamily mortgage debt on small (2-6 unit) rental properties in Cook County grew from
$17 billion in 2004 to $29 in 2007, an increase of 66%. Debt on large (7+ unit) rental properties also increased
significantly over this same time period, from $5 billion in 2004 to $13 billion in 2007, an increase of 128%.
Several reasons for this expansion suggest themselves, ranging from the complete and absolute mispricing of risk, to
more liberal lending policies, and to financial deepening (with a broadening of multifamily securitization markets).
– Insert Figure 7 Here –
Since 2007, however, conditions in the multifamily mortgage market have changed dramatically. For example,
new issuance of multifamily mortgage debt in Cook County in the first-half of 2009 reached only $2.4 billion, down
51% from the first half of 2008, and down 66% from the first-half of 2007. See figure 8. This decline is certainly
10
tied to softening conditions in the Cook County rental market. As we have mentioned in a recent IHS report, rental
markets on the South and West sides of Chicago have witnessed rising vacancies and declining real rents in 2009.
One driver is the massive loss of jobs over the past 18 months. Job losses in the eight-county Chicago metropolitan
area, which includes Naperville and Joliet, 186,600 in November 2009 from 143,600 in May and 159,600 last
January, since November 2008. These job losses are high and are expected to remain high for the next two years.
Further, these job losses (despite the economic growth we have seen in 2009, and despite the recent surprise fall in
the jobless rate) have negatively affected the rent-to-income ratios of many renter households, and have caused some
households to double up or move back with family members, reducing the overall demand for multifamily housing.
– Insert Figure 8 Here –
5.1 Adjusting Credit Flows for Falling Property Prices
The impact of falling property prices on multifamily credit flows in Cook County is shown in figure 9. Figure 9
plots the actual growth in multifamily credit in Cook County and a credit impulse function measuring the change in
multifamily credit relative to multifamily property prices.8 As credit growth has turned negative, multifamily
property prices have fallen, implying less overall need for credit. Thus, as shown in figure 9, our credit impulse
function for Cook County turns down less than the actual observed decline in multifamily credit flows during the
period 2005-2008. Further, the figure shows a significant upturn in actual multifamily credit flows in 2009
(measured by the left axis), but only in a relative sense. Actual multifamily credit growth in 2009 is still quite
negative. A similar pattern is observed in the credit impulse function (measured by the right axis). The credit
impulse function for Cook County is negative in both 2008 and 2009, which says not enough multifamily lending
activity is taking place in Cook County even after conditioning on the (albeit lower) price of multifamily properties.
– Insert Figure 9 Here –
8 Our credit impulse function is defined as the year-over-year change in the flow of new multifamily credit relative to the multifamily property price level over time. Thus, if credit changes at a relatively stable rate, the credit impulse function will be zero. If credit growth is volatile, however, changes in the credit impulse function could be large.

11
Obviously, one of the leading causes of the sharp change in the flow of multifamily mortgage credit is the steep
decline in the demand for multifamily CMBS debt over this time period. The decline in multifamily CMBS new
issuances began in the third quarter 2007, but no material setback occurred until the third quarter 2008. Since then,
the multifamily CMBS market has been negatively impacted by property market conditions.9 One obvious way in
which this affects multifamily originations is through liquidity costs. Without an active multifamily CMBS market
(essentially for mortgages on large 7+ unit rental properties), lenders are less likely to make loans because they are
forced to keep the loans on their balance sheet and suffer the liquidity costs.
5.2 Adjusting Credit Flows for Income Submarkets
The following trends are noted with respect to lending on affordable rental housing during the current financial
crisis. First, in all submarkets in Cook County – including those markets where multifamily rental housing is least
affordable (areas like Wilmette and Winnetka on the North Side, Rolling Meadows and Schaumburg in the
Northwest, and Orland Park in the Southwest) and those where multifamily rental housing is most affordable (areas
such as south side Chicago) – the actual growth in mortgage lending activity has generally been negative the past
two years. Second, after conditioning the growth in credit flows on the price of multifamily properties, the turn
down in credit over the period 2007-2009 was not nearly as great in the most affordable submarkets in Cook County
as it was in the least affordable submarkets. Generally, the credit impulse functions in the least affordable
submarkets are quite negative and lie below the actual observed decline in multifamily credit flows during the past
two years, while the credit impulse functions in the most affordable submarkets are currently showing signs of
positive growth. See figures 10-11.
For this analysis, least affordable markets are defined as areas where less than 30% of the rental stock of units is
affordable to a family of four with income at 150% of poverty. In contrast, most affordable markets are areas where
70+% of the rental housing stock is affordable to a family of four with income at 150% of poverty.
9 Total CMBS lending in the US reached a height of $230 billion in 2007, falling to $12 billion in 2008, and falling further to $3 billion in 2009.
12
– Insert Figure 10 Here –
– Insert Figure 11 Here –
The modest rebound in credit in the most affordable submarkets can be attributed to the presence of Fannie Mae
and Freddie Mac. Fannie Mae and Freddie Mac are essentially subject to minimum dollar-based special affordable
multifamily lending goals. These minimum lending goals help keep mortgage funds flowing to affordable rental
housing when other lenders cut back. We also note that small 2-6 unit rental properties make up about 67% of the
multifamily housing stock in most affordable submarkets in Cook County. The latter is important because both
Fannie Mae and Freddie Mac are a traditional source of financing for most of these units.
6. Fannie Mae and Freddie Mac Multifamily Loan Originations
During this financial crisis, unlike any unanticipated default crises in the past, we are undergoing an episode in
which the mix of lenders that are willing to lend on multifamily properties has changed dramatically. In the large, of
course, during upswings and downswings, one does expect the mix of lenders to vary, and for competition to
intensify or weaken. But in the current environment, the multifamily mortgage market on the whole has become
largely dependent on funding from just two lenders, Fannie Mae and Freddie Mac. During any other downswing,
this increased dependency would be no problem. But clearly Fannie Mae and Freddie Mac are having their own
problems, which raise policy issues that we think are very serious policy issues.
As recently as 2004-2006, Fannie Mae and Freddie Mac were a relatively minor source of financing for large
multifamily properties. The financial crisis of 2007-2009 changed all that with the multifamily CMBS market
seizing up. Over the period 2007 to 2009, Fannie Mae and Freddie Mac have gone from a negligible participant to,
for all intents and purposes, the dominant source of funding for large 7+ unit multifamily properties in Cook County.
As figure 12 shows, Fannie Mae and Freddie Mac’s share of the large 7+ unit multifamily mortgage originations
market in Cook County, computed by dividing actual multifamily loan purchases by total originations prior to 2008
and estimated loan purchases by total originations thereafter, was never really more than 11to 20% of all
originations during the 2004-2006 period (which coincidentally has almost certainly limited Fannie Mae and Freddie
Mac’s exposure to multifamily losses on large 7+ unit properties in Cook County). A shift then occurred in 2007, as
commercial banks and other private lenders began to cut their lending activities in order to contract their balance

13
sheets. Now, as a result of these developments, Fannie Mae and Freddie Mac are de facto in the position (whether
by design or by happenstance) of the most important multifamily lenders to large rental properties in Cook County,
accounting for about 65 to 70% of all large 7+ unit multifamily mortgage originations in Cook County.10
– Insert Figure 12 Here –
Similarly, the market for small 2-6 unit rental property loans is another sector in which Fannie Mae and Freddie
Mac dominate. The two GSEs – Fannie Mae and Freddie Mac – were established, by Congress, as a means of
channeling funds directly into the 1-4 single-family residential mortgage market. Of this market nationwide, Fannie
Mae and Freddie Mac currently securitize around 90 to 95% of all conforming 1-4 single-family residential
originations. Of the small 2-6 unit multifamily property market, most properties consist of 2-4 units. For example,
our rough estimates suggest that small 2-4 unit rental properties make up approximately 90% of the overall 2-6 unit
rental property market in Cook County.11 Thus, if we were to assume that Fannie Mae and Freddie Mac securitizes,
in the aggregate, around 90 to 95% of all originations on small 2-4 unit rental properties but does not purchase loans
on 5-6 unit rental properties, we calculate Fannie Mae and Freddie Mac’s share of originations for small 2-6 unit
rental property loans in Cook County, estimated as a weighted average, to be about 80 to 85%; which suggests that
Fannie Mae and Freddie Mac are now the dominant lender in both the small 2-6 unit multifamily lending market and
the large 7+ unit multifamily lending market, and their presence should not be taken lightly.12
10 This market share calculation is the true market share prior to 2008 and an upper bound of the true market share thereafter, given that for the latter period we estimated loan purchases made by Fannie Mae and Freddie Mac by identifying all loans originated by qualified Fannie Mae and Freddie Mac lenders during this time period and then assuming 100% of these loans are sold. This apparent upward bias in Fannie Mae and Freddie Mac’s share of the market is offset, however, to some extent by a downward bias created by not including in Fannie Mae and Freddie Mac’s total loan purchases of seasoned loans purchased from qualified lenders.
11 Two sources of data are central to our estimation of the number of small 2-4 rental properties in Cook County. Compiled from the 2000 Census, we have the total number of 5+ rental units in Cook County. Data from the Cook County Assessor’s Office (for 2000) gives us the total number of 7+ rental units in Cook County. Accordingly, the total number of 5-6 rental units in Cook County is the difference between these two values. Performing this calculation yields a value of 19,442 units. Then, we can subtract this value from the total number of 2-6 rental units in Cook County (for 2000) to obtain an estimate of the total number of 2-4 rental units. This calculation yields a value of 152,434 units (= 171,876 units in small 2-6 unit rental properties – 19,442 units in 5-6 unit rental properties), which is 90% of the total 2-6 rental units in Cook County.
12 It is noteworthy that Fannie Mae and Freddie Mac multifamily loans generally have lower interest rates, longer amortizations, and smaller down payments than those on alternative but comparable loans (which, in effect,

14
Finally, it bears pointing out that most multifamily loans purchased by Fannie Mae and Freddie Mac are
retained as investments in their portfolios. For instance, Fannie Mae has a retained portfolio of $768 billion in
mortgages and mortgage-backed securities, including $117 billion (15%) in whole multifamily mortgage loans on
large 5+ unit rental properties. In contrast, Freddie Mac has a retained portfolio of mortgages and mortgage-backed
securities of $748 billion, which consists of $72 billion (or about 10%) in whole multifamily mortgage loans on 5+
unit rental properties.13 But the portfolios of Fannie Mae and Freddie Mac are scheduled to be gradually reduced at
a rate of 10% annually starting next year until each entity’s portfolio is winnowed to $250 billion, largely to limit
taxpayer risk.
It is hard to know how large Fannie Mae and Freddie Mac’s holdings of small 2-4 unit multifamily mortgage
loans are. What we do know for a fact is that Fannie Mae and Freddie Mac together own or guarantee around half
of the $11 trillion in single-family (one-to-four) residential mortgages outstanding, of which $600 billion are likely
to be loans on small 2-4 unit multifamily properties (assuming Fannie Mae and Freddie Mac buy their fair share of
residential mortgages on 2-4 unit multifamily properties).14
7. What Would Happen if Fannie Mae and Freddie Mac Stopped Lending?
The following suggests that a much-reduced presence by Fannie Mae and Freddie Mac could increase
foreclosures and abandonment significantly. This prediction is based on the following assumptions. The cost of
owner-occupied housing is low compared with the cost of renting, in part because of aggressive interest rate cutting
which has lowered the cost of home mortgages, partly because of a large homebuyer tax credit for first-time
mean a lower total cost to the borrower). Typically, a 5, 7, 10, 15, or 30-year term is permitted on loans purchased by Fannie Mae and Freddie Mac. Additionally, Fannie Mae and Freddie Mac will normally allow a loan-to-value ratio of 70 to 75% compared to 60 to 65% on loans provided by institutional lenders.
13 Fannie Mae and Freddie Mac together also guarantee $52 billion in multifamily mortgage loans on large 5+ unit rental properties. Thus, between Fannie Mae and Freddie Mac, they own or back more than $241 billion of multifamily mortgage loans (or around 27% of the $905 billion in US multifamily mortgages outstanding on large 5+ unit rental properties).
14 Clearly, an important distinction needs to be made in this discussion, that is, between small 2-4 multifamily units that are used as primary residences and those that are investment properties. For investment properties, all mortgages must pass a much tougher risk-indicator test; a maximum payment-to-income ratio of 45% applies (which equates to a debt service coverage ratio of 2.2); no more than four financed properties are permitted per borrower; the maximum loan-to-value ratio (without secondary financing) is limited to 75% (which compares to a maximum loan-to-value ratio without secondary financing on 2-4 unit primary residences of 80%); and the borrower must have substantial experience (at least a two-year history) with managing 2-4 unit investment properties, especially if rental income is used to qualify the borrower.
15
homebuyers (which is set to expire soon), but mainly because of a large drop in home prices. For example, home
prices in Chicago are off 23% from their peak – and nationwide home prices are down 30%, as per the S&P/Case-
Shiller (value-weighted) home price index. These factors have increased affordability for home buyers to all-time
highs,15 and just about everyone who is credit-qualified (and who has enough saved up for a 20% down payment) is
currently finding it a lot cheaper to own rather than rent. The latter explaining why pending home sales nationwide
have increased consecutively since February (including a large 10% jump in October).
These dramatic price changes are likely to have two important effects on the stock of housing besides those
usually expected. First, consider the upper panel of figure 13. It shows the typical bid-rent curves and land-use
patterns for multifamily and single-family housing during a housing boom. The bid-rent curves (which show
willingness to pay for housing as a function of distance from the city center) slope downward because as households
move away from the city center the cost of commuting to jobs in the central business district (CBD) increases. The
latter leaves the household with less income leftover after commuting costs, thereby reducing the price the
household is able to pay for housing farther from the CBD. The upper panel of figure 13 further assumes that
housing will be allocated the highest bidding sector – either multifamily or single-family. In this theoretical
analysis, the central business district of the city is occupied by low-income households living in relatively small
multifamily dwelling units because the income elasticity of demand for housing is large relative to the income
elasticity of commuting costs. In contrast, high-income households live in single-family housing concentrated on
the urban-fringe.
– Insert Figure 13 Here –
The lower panel of figure 13 shows the average bid-rent curves during a housing slump, prompted by a large
decline in household income (with the decline harming low-income households the hardest). In the lower panel of
figure 13 both the multifamily and single-family housing curves have slid down the rent axis reflecting the decline
in income. However, the multifamily housing bid-rent curve has slid down the rent axis further reflecting the
15 The affordability ratio of existing homes (i.e., the ratio of actual household income to qualifying income needed to own a median single-family home) has increased to 1.66 times nationwide and to slightly over 2.00 times in the Midwest, as per the National Association of Realtors.
dominance of owning versus renting in the current environment, at least for credit-qualified households. Both
gradients have also become steeper owing to the increase in the relative importance of commuting costs (which have
not changed noticeably) during the housing slump. Under these circumstances, under-maintenance occurs, until
dwelling units fall into a lower-price class, with the decline causing the lowest quality units to be removed from the
housing stock (reflecting the now reduced household formations). This situation is represented in lower panel of
figure 13 by the area labeled loss – which could be viewed either as a permanent or temporary loss depending on the
shape of the current recession, and whether (or not) income will recover, and how quickly income will recover.16
Second, as households become credit-constrained from buying a home, the bid-rent curve for multifamily
housing will shift from to , reducing the share of housing which is single-family, while increasing the share of
housing which is multifamily.
m 'm
17 However, when compared with the upper panel of figure 13, differences can be
observed, the most notable is how single-family housing comprises a larger proportion of the housing stock.
Furthermore, in detail, of the total number of housing units removed from the housing stock, a large proportion is
multifamily.
The general lesson is the following: The greatly improved affordability of single-family housing in this
environment (brought about in part by profound changes in federal housing policies) is likely to cause a significant
amount of disinvestment on multifamily properties to occur, with units initially filtering down to lowest-income
renters (who are renting out of necessity), and then eventually being demolished or otherwise removed from the
housing stock (as long as household formations remain low). Further, as a great many previous homeowners who
have defaulted on their mortgages are able to rebuild their credit, the single-family housing market should be able to
remedy itself over time. The transition from renter to owner-occupancy as of late has certainly been made easier in
part by the Federal Reserve Bank keeping interest rates low and partly by the strong lending activity of Fannie Mae
and Freddie Mac, who, with support from the Treasury, have stood ready to buy single-family home mortgages for
cash when no one else would. However, such support is causing vacancy rates on multifamily properties to
increase, rents to fall and property values to turn down.
16
16 If income is expected to rise again, so that rents will again rise, it may pay to hold the deteriorating units vacant rather than to demolish today and re-build later. In addition, if population is growing, it could also be better to mothball deteriorating units rather than to demolish today and re-build later.
17 Other transaction costs (e.g., the cost of moving) and access to credit may also inhibit the switch from renting to owning.
17
The point, in any case, is that a significant amount of disinvestment could occur in this environment,
particularly in those markets where the housing inventory has been vastly overbuilt. The usual argument is that
negative equity and declining rents will fuel foreclosures, which in turn will force down multifamily property prices,
setting off a downward spiral, particularly if credit is tight and lenders (including Fannie Mae and Freddie Mac) are
unwilling to make loans. A side implication, of course, is that, other things equal, as rents decline, the quantity of
space demanded should increase. But where there are requirements that multifamily units meet some minimum
building standards, investors will generally find operating these units financially infeasible when rents fall below
this operating cost threshold level. Thus, at or below this point the property will generally be vacated or abandoned.
Consider next the effect of deficiency judgments. An argument is that deficiency judgments should deter losses
on multifamily foreclosures. However, in practice it can be very costly to pursue a deficiency judgment. In
addition, the borrower can always file for bankruptcy and get rid of the unsecured deficiency debt. All of which
leads one to conclude that foreclosure losses on multifamily properties can be substantial.
8. How Much Disinvestment is Taking Place?
This section performs a value at-risk VaR analysis using rent and vacancy data for the city of Chicago to
determine the extent to which disinvestment is taking place. The analysis proceeds as follows. Estimates (both of
the mean and standard deviation of the distribution) of rents and vacancies are calculated for seven submarkets in
Chicago, including rental apartment markets in the West, Southwest, and South, which appear to be suffering the
greatest so far (both in terms of declining real rents and increasing vacancies) from the cyclical downturn, and
markets in the North, Northwest, Central, and Far South, where rent declines and increases in vacancies remain
more moderate. These rents and vacancies are then compared with estimates of total annual operating costs for each
submarket. Total annual operating costs equal user costs, meant to include the opportunity cost of debt capital plus
heat and janitorial services that are not incurred if the unit were vacant, plus fixed costs like property taxes and
insurance, which are incurred whether or not the unit is vacant, and plus normal maintenance costs, which include
expenditures that offset depreciation expenses due to physical deterioration and technological obsolescence. The
comparisons are crude, but they are interesting.
Theoretically there are several concerns here. First, given a point to which a building has filtered, there will
generally be some optimal maintenance strategy. But, of course, if the borrower is in financial distress, and the roof,
18
for example, is not leaking yet, then it might be best to postpone repairing the roof. Further, where the borrower
knows he or she will inevitably lose the building in foreclosure but frictions prevent the lender from foreclosing
right away, the borrower may not only defer maintenance, he or she may also cannibalize the building for parts. In
the end, these cannibalized buildings will invariably sit vacant and abandoned (especially if the low rents do not
justify rehab construction), creating significant problems for the local community. Second, building owners can
always find some ways to lower fixed costs. However, in the simulations reported here these costs are held
constant. For this reason, the simulations may overstate the total number of units currently at-risk of under-
maintenance. Third, if there is a “silver lining” here, it is that declining rents are welfare improving from the
tenant’s point of view. Low or declining rents imply that renters now have the alternative of a better dwelling unit at
the same rent. Of course, there is a risk that quality decline could hasten.
The results of the at-risk simulations are shown in figure 14.18 What figure 14 shows is that 74,000 rental
units in the city of Chicago – roughly one in eight – are experiencing a revenue shortfall, in which total revenues
are less than total operating expenses. These revenue shortfalls should cause a significant amount of discontinued
or decreased maintenance. As this discontinued or decreased maintenance occurs, some filtering down of units
will take place.
– Insert Figure 14 Here –
The at-risk simulations further show that there are roughly 3,000 rental units in Cook County – less than 0.4%
of all units – in which the revenue shortfall is less than total fixed costs. These units are currently at-risk of
demolition, since revenues per unit fall short of variable operating costs and since there is an alternative use of
land.
18 In addition to looking at Cook County as a whole, the value-at-risk VaR analysis looked at four different submarkets based on the percentage of affordable units in each market. For instance, in the “least affordable” market, affordable rental units (for a family of four with an income 150% of poverty) make up less than 30% of the total rental housing stock. Inversely, in the “most affordable” market, affordable units make up more than 70% of the total rental housing stock. In the “less affordable” and the “more affordable” markets affordable housing make up 30-50% and 51-70% of the rental housing stock respectively.
19
As we see in figure 14, there is a slightly greater risk of discontinued or decreased maintenance in the least
affordable submarkets than in the most affordable submarkets. Several explanations suggest themselves for these
results. For the most part, during a housing slump, as single-family house prices fall, the demand for single-
family housing rises and this causes the demand for multifamily housing to fall. This shift in demand will force
rents down, causing economic losses for landlords. In time these losses will force landlords to defer maintenance
to save on costs. Those submarkets most affected by the shift are those that have the most qualified borrowers,
which principally forces the filtering process to start in higher income areas, only to end up in lower-income
areas. Here the definition of most and least affordable submarkets is the same as before. In the submarkets in
between, where rental units are not as nearly affordable, the shift in demand will invariably mean that rents will be
lower than they are now, causing deferred maintenance and filtering to rise in the future.
The result of this filtering process is that a large amount of affordable rental housing might be lost, especially
in areas with the most stringent building codes; the latter providing a floor, below which normal operating costs
cannot fall. Almost certainly when rents fall and vacancies rise, a squeeze on cash flows will occur, causing not
only increased foreclosures (and imposing significant spillover costs), but also increased filtering. As increased
filtering occurs, tenant welfare will improve (since rents are now lower), but operating losses will arise, inevitably
forcing some units to be abandoned. As units are abandoned, the economic costs are not equally distributed;
rather, the costs are borne heavily by low- and moderate-income areas. Further, disinvestment through under-
maintenance and abandonment is much more than an economic catastrophe; it is a social catastrophe as well.
Disinvestment through under-maintenance and abandonment (whether in the single- or multifamily housing
market) can impose considerable social costs (e.g., tenant dislocations, crime delinquency, fires, illness, etc.) on
local communities and on individual tenants.19
19 For evidence that foreclosure costs are potentially large, see Dan Immergluck and Geoff Smith. 2006. “The Impact of Single-Family Mortgage Foreclosures on Neighborhood Crime,” Housing Studies 21(6): 851-866. See also John Harding, Eric Rosenblatt, and V.W. Yao. 2008. “The Contagion Effect of Foreclosed Properties,” Unpublished working paper, and William Apgar and Mark Duda. 2005. “Collateral Damage: the Municipal Impact of Today’s Mortgage Foreclosure Boom,” Minneapolis: Homeownership Preservation Foundation. Anecdotal evidence suggests that foreclosures can massive tenant dislocations, especially among small 2-6 unit rental properties located in low- and moderate-income neighborhoods. Further, as the inventory of foreclosures and potential foreclosures rise, tenant dislocations will generally rise.
9. How are Overexposed Lenders Dealing with Multifamily Foreclosures?
Many multifamily lenders who might once have pursued foreclosing on a property are now willing to give
extensions (in light of the lack of liquidity in the resale market) and wait (hopefully) for the multifamily housing
market to turn. However, such loans are typically for shorter periods of time and at higher interest rates.
To estimate the extent to which multifamily mortgage loans in the current financial crisis have been “extended
and pretended,” the following analysis is performed. First, a simple model of default risk for multifamily mortgage
loans in Cook County is estimated using loan cohorts for 2005-2007 as the examples. What is measured – an age
pattern of default rates – is portrayed by the solid lines in figures 15 and 16.20 The model is estimated over the time
period from the first quarter of 2005 to the second quarter of 2009.
– Insert Figure 15 Here –
– Insert Figure 16 Here –
Next, the model is estimated over the unrestricted time period from the first quarter of 2000 to the fourth quarter
of 2004. The time period 2000-2004 was chosen to coincide with a period in which multifamily lenders were
generally under no duress to extend loans to tide them over.21 From the discussion above, we know that multifamily
20 The model estimated is
2210 tataaDt ++= lnlnln
where is the ratio of defaults to the original number of mortgages at mortgage age t and t is the duration of the mortgage. The value of governs the amplitude of the default curve and the variations in and govern the time shape of the default curve. For the period 2005-2009, the complete equation estimated for multifamily mortgage loans on small 2-6 unit rental properties is
tD
0a 1a 2a
21100590652 ttDt .ln..ln −+−= with 7302 .=R
The equation estimated for multifamily mortgage loans on large 7+ unit rental properties is
210607150833 ttDt .ln..ln −+−= with 3202 .=R
21 For the period 2000-2004, the complete equation estimated for small 2-6 unit multifamily mortgage loans is
20306550923 ttDt .ln..ln −−−= with 8502 .=R
20
property prices were generally increasing over this time period and that prevailing financial conditions were far from
vulnerable.
A simulation analysis is then performed keeping the overall level of the default curve pattern at its 2000-2004
level (devoid of any extend and pretend influence), while allowing the time shape parameters of the default curve to
take on values from 2005-2009.22 The simulation results are then compared to actual observed default rates.
The simulation results for small 2-6 unit multifamily mortgage loans and large 7+ unit multifamily mortgage
loans are shown in figures 15 and 16, respectively. The simulations show that, while actual observed default rates
on both small 2-6 unit rental properties and large 7+ unit rental properties in Cook County are high, the cumulative
rate would have potentially be much higher – in the vicinity of 3 to 8% higher (the difference between simulated and
actual) – were it not for a great many lenders in the current climate to roll over loans made in the past five years,
hoping that rental rates and properties values (and consequently loan-to-value ratios) will eventually come back to
levels seen during the peak of the market in 2007. In dollar terms, the scale of lending activity in Cook County –
with $44 billion of multifamily mortgage debt originated between 2005 and 2007 – suggests that problems at banks
have led lenders to extend between $1.3 and $3.5 billion of multifamily mortgage debt in Cook County.
One may ask whether “pretend and extend,” temporary loan guarantees, or foreclosure moratoria are ever the
correct policy choice. Ordinarily, the sooner a property can be placed in the hands of someone who believes that
they will be able to keep it, the less maintenance deferral and cannibalization there will be. So the process of
“pretend and extend” could simply make things worse. But this argument overlooks the fact that there can be
significant feedback effects from falling property prices to the lack of financing and to increased foreclosures, back
to reduced property prices and further decreases in lending and increased foreclosures.
21
202601570335 ttDt .ln..ln −−−= 3402 .=R
The equation estimated for large 7+ unit multifamily mortgage loans is
with
22 The simulations are performed under the following assumptions. We set xa =0 (which governs the amplitude
of default), and and (which govern the time shape of defaults) to obtain . We then solve this model for all mortgage ages t to determine the level of default rates. Results of the simulations are shown in figures 15 and 16.
xa =1 xa =22
210
taat etaD =
22
10. Short-Run Policy Prescriptions to Deal with the Credit Crunch
The following policy options present themselves as a way to stabilize the multifamily rental property market in
the short-run.
10.1 Fannie Mae and Freddie Mac are Key in the Short-Run
What may be the best or most appropriate solution to the federal bail-out of Fannie Mae and Freddie Mac with
respect to their role in the subprime crisis may not be appropriate when considering the short-term needs of the
multifamily mortgage market and the indispensable role that Fannie Mae and Freddie Mac now play in the
multifamily mortgage market. The Treasury has pledged so far more than $1.5 trillion, including $85 billion in
direct aid, to support Fannie Mae and Freddie Mac’s single-family lending activities. Proposals now being
considered to overhaul Fannie Mae and Freddie Mac include, among others, the following:
a) Return Fannie Mae and Freddie Mac to their Pre-Conservatorship Status, but with a Much Smaller Retained
Portfolio.
One argument is that Fannie Mae and Freddie Mac have largely funded their mortgage purchases by pooling
them and issuing credit-enhanced (guaranteed) mortgage-backed securities. But then in the early 2000s Fannie Mae
and Freddie Mac veered off-course (expanding into higher-risk lending) by progressively augmenting their
securitization activities by issuing debt to add increasingly to their retained portfolios. Fannie Mae and Freddie
Mac’s original business plan generally worked well, but their expansion into higher-risk lending was costly. Hence,
going forward, Fannie Mae and Freddie Mac should go back to doing what they did well, with a much smaller
proportion of all mortgage debt held in their portfolio (see above discussion of plan to reduce the size of Fannie and
Freddie Mac’s retained portfolios starting next year).
b) Close Fannie Mae and Freddie Mac Down, Seeing Since the Originate-to-Securitize Model has Clear Flaws.
Fannie Mae and Freddie Mac ordinarily issue plain vanilla pass-through securities where, for example, someone
purchasing 25% of the pool will receive 25% of all cash flows (interest and repayments). However, it is now
realized that this originate-to-securitize model has certain flaws, namely, that originators will typically stop
collecting useful information and focus instead only on ensuring borrowers have good credit scores and observable
low loan-to-value ratios. One way to fix this problem is for lenders to issue covered bonds, which are debt
obligations issued by financial institutions and secured by a pool of high-quality mortgages. But then this means

23
that Fannie Mae and Freddie Mac ought to be shut down (since neither Fannie Mae nor Freddie Mac is essential to
this type of financing).
c) Adopting a Public Utility Model for Incorporating Private Ownership.
Such an approach realizes that there are economies of scale in providing financing to single-family and
multifamily housing. Normally, when the economies of scale are particularly pronounced, such industries are given
exclusive government franchises. But in return for this exclusive government franchise, government reserves the
right to regulate the operations of these industries to prevent abuses of power.
None of these policy options looks attractive at present, because they all ignore the fact that Fannie Mae and
Freddie Mac have become the dominant lender in the multifamily mortgage market. It is clear, from our analysis,
that closing Fannie Mae and Freddie Mac down or effectively restricting the size of their retained portfolio would
cause substantial losses in the multifamily mortgage market. For example, over the next four years, roughly $15
billion of multifamily mortgage debt (or about 33% of the stock of outstanding debt) in Cook County should mature
(see figure 17). Without the presence of Fannie Mae and Freddie Mac in the multifamily mortgage market buying
loans, these property owners are unlikely to be able to refinance, causing a great number of borrowers to default at
loan term. The latter in particular should lower property prices, which could lead to increased foreclosures and
further decreases in property values.
– Insert Figure 17 Here –
How can we ensure that, in the future, such needless defaults are avoided? There would appear to be several
alternative options. Each of the options discussed here would involve loan guarantees as opposed to tax
expenditures or subsidy programs which cost explicit money. Loan guarantees have generally been justified in
terms of market failures. Further, each option arises out of existing programs/interventions.
a) Maintain Status Quo.
As we are seeing in the single-family housing market, markets need a credible system of providing financing in
order for transactions to take place and for markets to remedy themselves over time. Without such a system, the loss
to the economy could be great. One expedient way to ensure that such a financial system exists for the multifamily
24
housing market is to maintain the status quo when it comes to Fannie Mae and Freddie Mac’s presence in the
multifamily mortgage market.
b) Restrict the Size of Fannie Mae and Freddie Mac’s Retained Portfolio of Home Mortgage Loans, But Allow
for Public Purposes, at Least until When Financial Conditions Become More Normal, the Size of Fannie Mae and
Freddie Mac’s Retained Portfolio of Multifamily Mortgages to Grow.
Clearly, if Congress did not intend for Fannie Mae and Freddie Mac to serve a “public purpose,” they would not
have authorized their creation and establishment in 1954 and 1970 in the first place. The 2010 and beyond
affordable housing goals require Fannie Mae and Freddie Mac to expand their qualified affordable activities
(including the buying of a large number of mortgages on multifamily residential housing affordable to very low-
income families and low-income families). Historically, Fannie Mae and Freddie Mac have been instrumental in
reducing and standardizing mortgage interest rates (including mortgage interest rates on multifamily mortgages). In
addition, Fannie Mae and Freddie Mac have helped to reduce risks, improve lending standards, and raise efficiency.
However, initially the government promoted the idea of a secondary mortgage market as a method of combating the
credit cycle and housing depressions. Perhaps it is time to return to these goals?
c) Have One GSE Securitize Home Mortgage Loans and the Other Securitize Multifamily Mortgages. One
possible plan would be to create a less duplicative system by altering Fannie Mae and Freddie Mac’s government
charter, requiring one entity to provide a secondary market and, hence, liquidity for conventional single-family
mortgages, and the other entity to provide a secondary market for multifamily mortgage loans.
Such a system would remove any market competition between Fannie Mae and Freddie Mac, limiting the extent
to which competition would encourage greater efficiencies. However, such competition is only possible if Fannie
Mae and Freddie Mac are returned to their pre-conservatorship status of being a private company. But several
problems exist in this process. First is the problem of the inherent conflict between the objectives of the companies’
private shareholders and the objectives of public policy (including the incentive to pick and choose the single-family
and multifamily mortgage markets in which not to operate). Second is the inclination of Fannie Mae and Freddie
Mac, as private companies, to take what amounts to levered bets (i.e., to take advantage of their low cost of funds –
due either to their implicit or explicit government guarantee – to invest in risky assets). Third is their incentive to
maximize the size of their portfolios.

25
10.2 Policies to Address the (Unequal) Economic Costs of Foreclosures and Disinvestment
The economic costs of foreclosures and abandonment are not equally distributed. For example, the above
analysis suggests that foreclosures are heavily concentrated in low- and moderate-income areas, compared with
high-income areas. Obviously, an increase in foreclosures and abandonment would be more tolerable if every
community were equally affected and the social costs were spread out over a large number of areas. But, clearly,
this is not the case. Further, there are feedback effects from falling property prices to increased foreclosures, back to
reduced property prices and increased foreclosures about which to be concerned in the short-run.
Ultimately, if one is troubled by the unequal burden of these economic and non-economic costs, then certain
short-run policy prescriptions present themselves. For example, Fannie Mae and Freddie Mac could be required to
expand their multifamily housing lending, which already has been expanded under the 2010-2011 Enterprise
Affordable Housing Goals. Expanding lending in these areas could be risky. But presumably the public should be
willing to bear some of this increased risk, especially if this increased lending activity were to reduce the feedback
effects in the short-run from falling property prices to increased foreclosures, back to reduced property prices and
increased foreclosures.
But there are some caveats to this policy prescription: if the US economy were to stumble along for years – like
Japan’s economy did during the “lost decade” in the 1990s – then presumably it would be best to accelerate
foreclosures and abandonment, rather than take steps that might prolong the process. The sooner properties are
removed from the housing stock, the sooner rents will begin to rise and the sooner the long-run equilibrium will be
restored.
However, short of that, to limit the economic and non-economic costs of foreclosures and abandonment in this
environment, one policy option would be to set goals for Fannie Mae and Freddie Mac to purchase mortgages on
multifamily residential housing affordable to low-income households in certain targeted markets (i.e., where
intervention will be the most cost effective), rather than simply on a population basis. But the latter is more the
norm rather than the exception, especially when it comes to most housing assistance programs, including funding
from Title III of the Housing and Economic Recovery Act of 2008 that is intended to help revitalize blighted
neighborhoods, and other housing assistance programs like Head Start, Low-Income Home Energy Assistance

26
Program (LIHEAP), Community Development Block Grant (CDBG), the Section 8 Housing Choice Voucher
Program, and Low-Income Housing Tax Credits.
Lastly, it is pretty certain that the lower cost of owning in this environment is likely to keep the demand for
rental housing fairly low over the next few years. Thus, without question, a target of government focus in this
environment should be on the uneven burden created by multifamily foreclosures and disinvestment.
10.3 An Expanded Role for FHA Lending
There is an important role for FHA insurance and lending in this environment. FHA multifamily lending has
always featured financing for the purchase, construction, and substantial rehabilitation of rental properties. Under
the most popular of these programs (section 221(d)(4) substantial rehab and section 223(f) mod rehab), borrowers
are generally able to obtain funds for repairs, deferred maintenance and capital improvements. A strong case can be
made in this environment that more FHA multifamily lending will be needed to deal with the consequence of
deferred maintenance and abandonment which is clearly an emerging issue in most multifamily rental housing
markets.
11. Longer Run Policy Prescriptions
The longer run policy prescriptions are much different than the short-run policy options described above in
section 10.
11.1 The Causes of the Current Crisis
During the decade 1997-2007, the US experienced a mortgage debt bubble essentially for all types of property,
including both single- and multifamily properties. The increase in debt generally fueled a massive boom in property
prices. For example, housing prices in Cook County more than doubled between 1997 and 2006, before falling by
25% between 2006 and the fourth quarter of 2009. How much of this price rise was a house price bubble is
uncertain; still, it is interesting to note that the pattern in single-family house prices is very consistent with property
price patterns shown in Figure 1 for both small 2-6 unit rental properties and large 7+ unit rental properties.
Generally, during this time period a large number of unqualified buyers received access to mortgage debt for the
purchase of both single-family homes and small (owner-occupied) 2-6 unit rental properties. As these buyers
entered the single-family housing market and the small 2-6 unit rental property market, prices were bid up, resources
27
were misallocated, and eventually the markets became destabilized (with a great deal of help from the issuance of
exotic new financial instruments which allowed lenders to generate high returns on investment).
11.2 Some Long-Run Solutions
Longer run policy prescriptions must necessarily take into account the extent to which Fannie Mae and Freddie
Mac subsidize interest. A lower interest rate would raise the amount of debt and lower the amount of equity used to
finance multifamily rental properties, especially in the case of small 2-6 unit rental properties where average loan-to-
value ratios tend to be much higher than on large 7+ unit rental properties. See Figures 18 and 19.
– Insert Figure 18 Here –
– Insert Figure 19 Here –
Notice that there have been cycles in the loan-to-value ratios on both small 2-6 unit rental properties and large
7+ unit rental properties, with the proportion of small 2-6 unit multifamily loans with loan-to-value ratios above
85% increasing in the mid-1990s, then falling in the late 1990s, only to rise again in the late 2000s. Strikingly, the
proportion of large 7+ unit multifamily loans with loan-to-value ratios above 85% increased significantly in the late
2000s.
But too much debt can have a destabilizing effect on markets. Thus, the rise in multifamily loans with loan-to-
value ratios above 85% during the late 2000s is hard to justify from a macro perspective. Further, any policy – like
GSE subsidized interest – that creates an incentive for too much debt is hard to justify.
However, to some extent GSE subsidized interest can be justified as a means of promoting affordable rental
housing (assuming the promotion of affordable rental housing is correcting a market failure in the supply of
housing). Further, the use of GSE funds to purchase mortgages on multifamily residential housing affordable to
very low- and low-income families could make these neighborhoods better off, which means less dislocation costs
and lower state and local tax burdens in the future.
11.3 Other Interventions
Additional interventions like ways of improving on the Community Reinvestment Act or increased tax breaks
for landlords (or perhaps income transfers and/or human capital programs) can be rationalized in the longer run as
follows. Holding rents constant, a decrease in leverage (coming about as a result of the deleveraging process that the
28
economy is going through) implies an increase in the weighted average cost of capital and a corresponding decrease
in the price of rental housing. But with the cost of providing decent and affordable rental housing held constant, a
decrease in property price renders the supply of low- and moderately-priced rental dwelling units financially
infeasible. Fundamentally, the problem involved is the high cost of constructing multifamily homes in most
communities (a condition which has existed for some time). Also, declines in household incomes in low- and
moderate-income neighborhoods have not helped the situation much. Ideally, then, as the production of more and
better affordable rental housing begins to lag in the future, one obvious solution is for more federally-regulated bank
community redevelopment, tougher affordable housing goals for Fannie Mae and Freddie Mac, or even increased
tax breaks for landlords providing multifamily residential housing affordable to very low and low-income families
(these tax breaks are loosely related to housing finance), or perhaps some combination of these three elements.
These various programs would have a relatively small impact on budget deficits, but could dramatically substitute
for subprime lending activities.
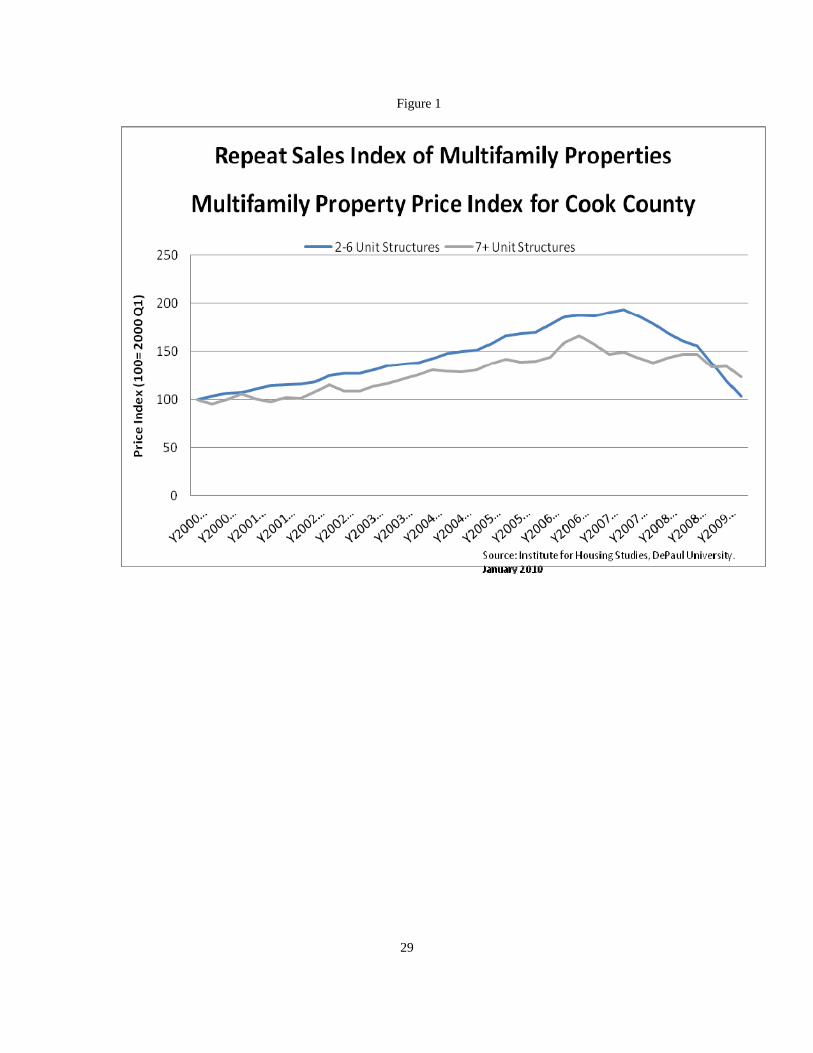
Figure 1
29
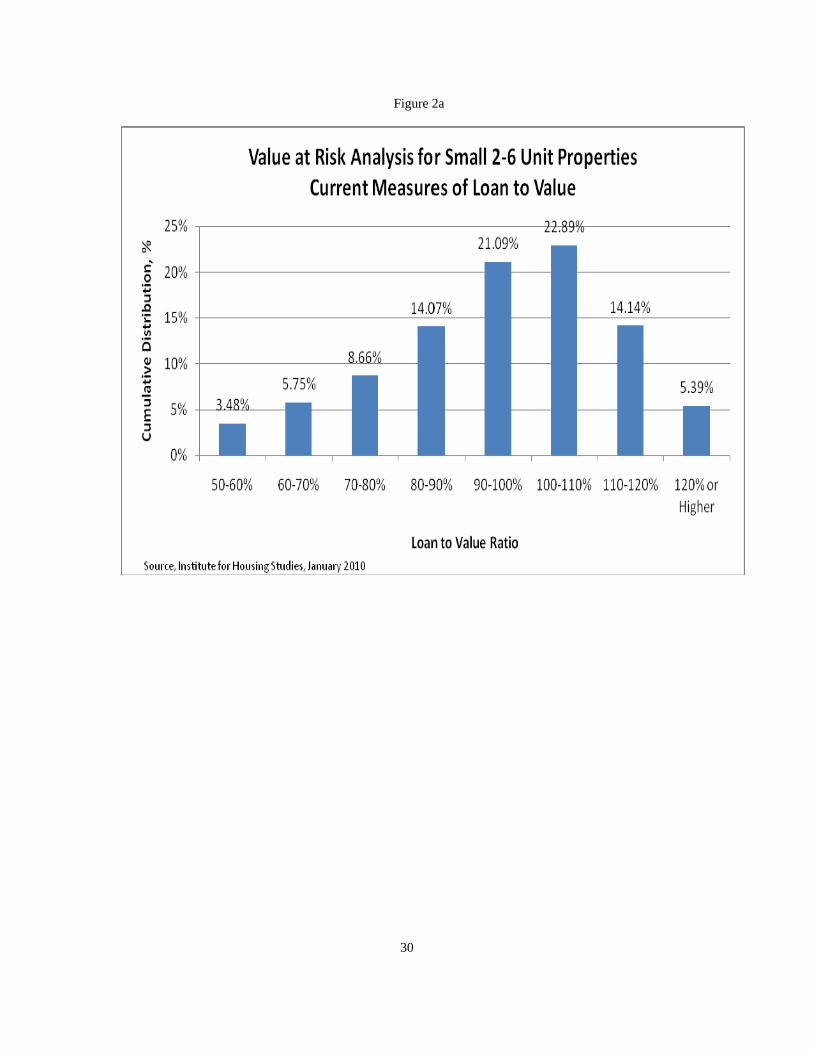
Figure 2a
30
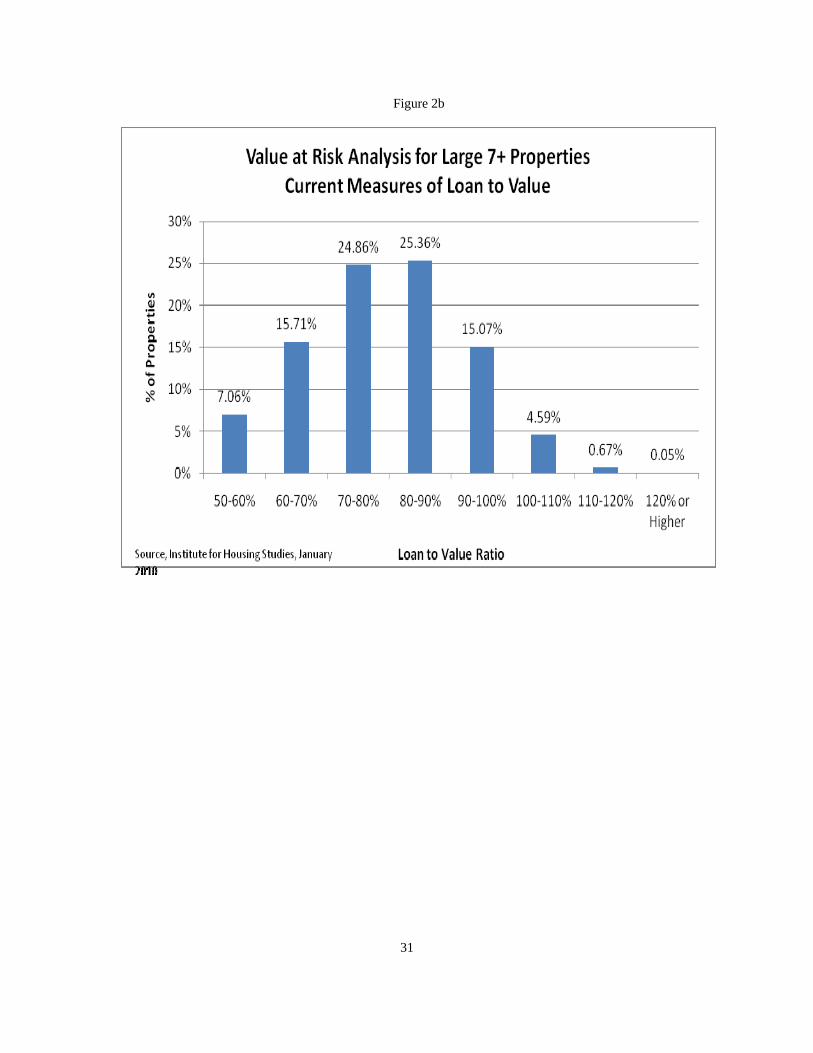
Figure 2b
31

Figure 3
32
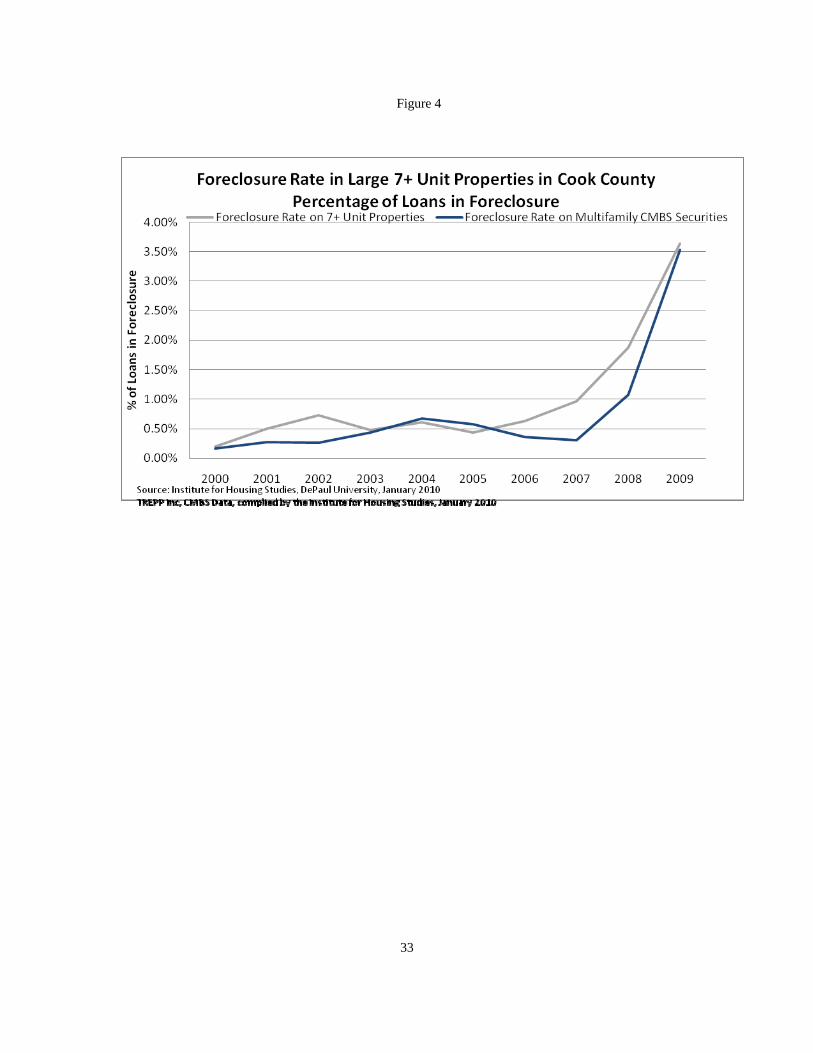
Figure 4
33

Figure 5
34

Figure 6
35

Figure 7
36

Figure 8
37

Figure 9
38
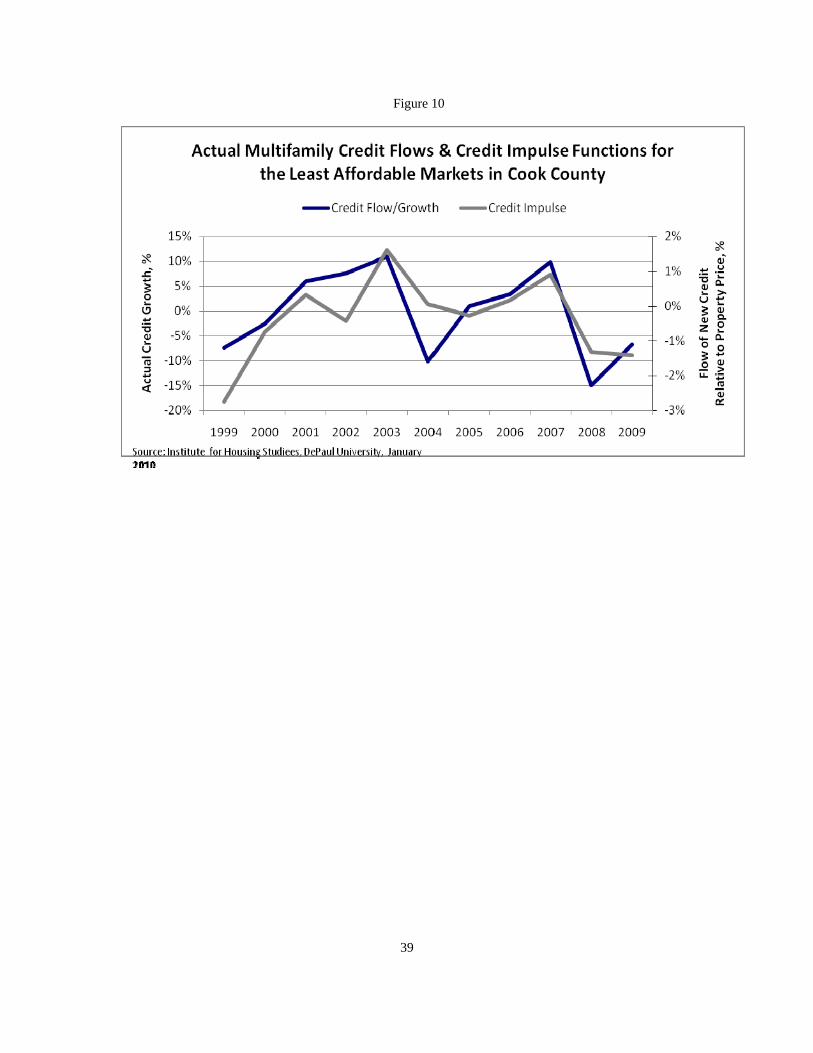
Figure 10
39

Figure 11
40
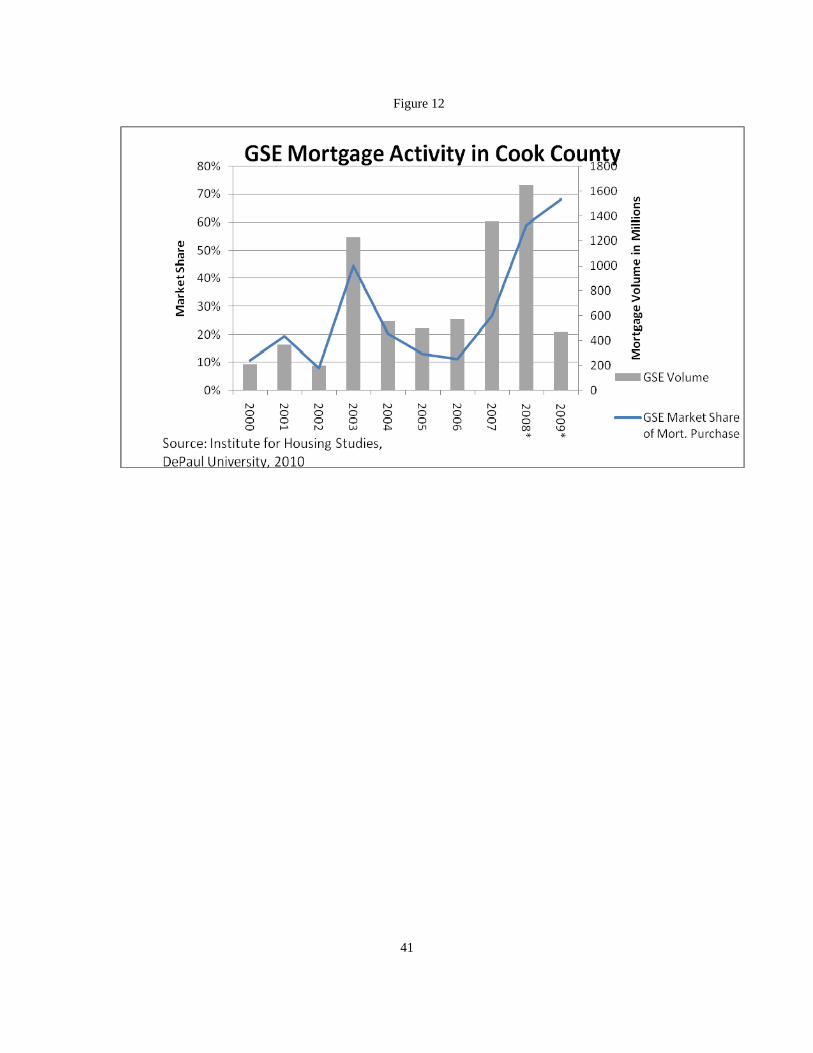
Figure 12
41

Figure 13 Demand for Mulitfamily Housing in a Housing Boom and Slump
42

Figure 14
Source: Institute for Housing Studies, DePaul University. January 2010
43
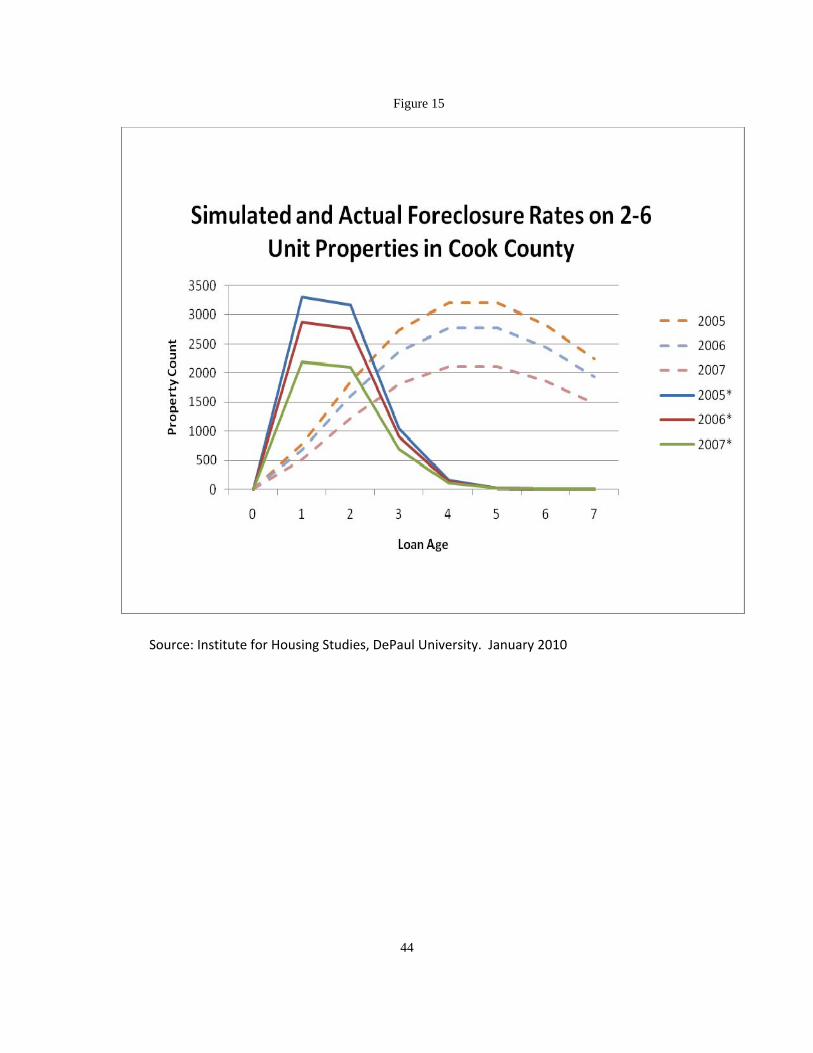
Figure 15
Source: Institute for Housing Studies, DePaul University. January 2010
44

Figure 16
Source: Institute for Housing Studies, DePaul University. January 2010
45
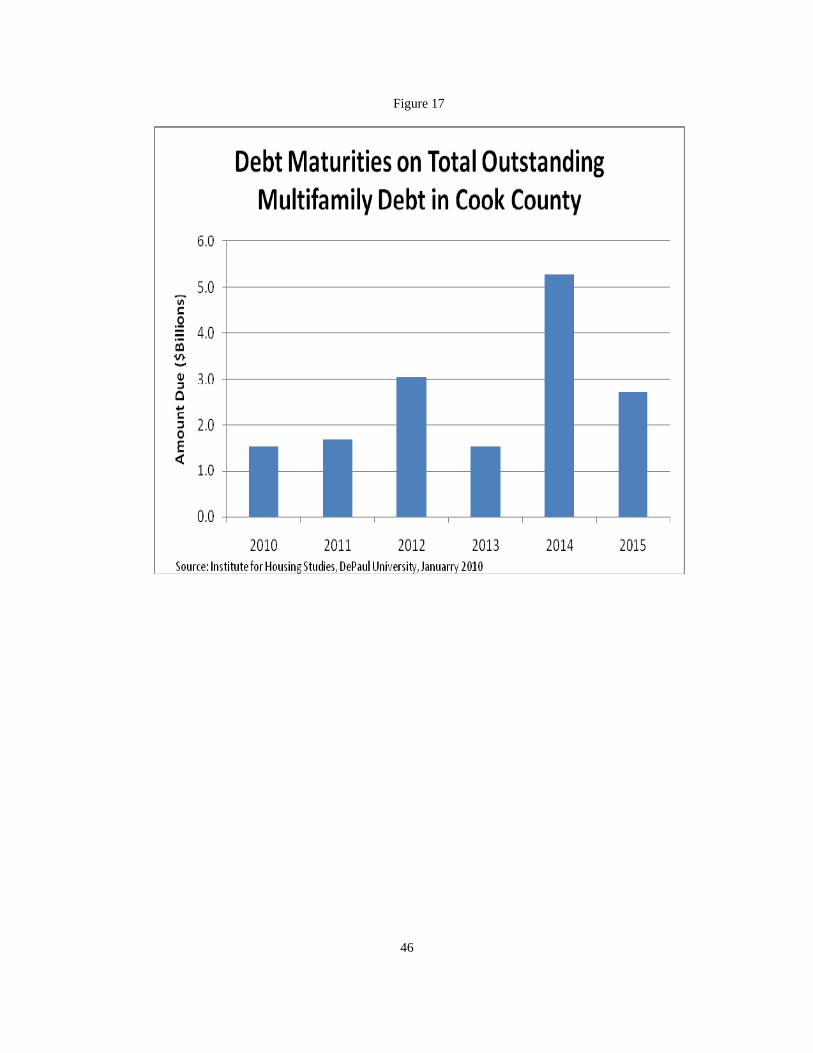
Figure 17
46
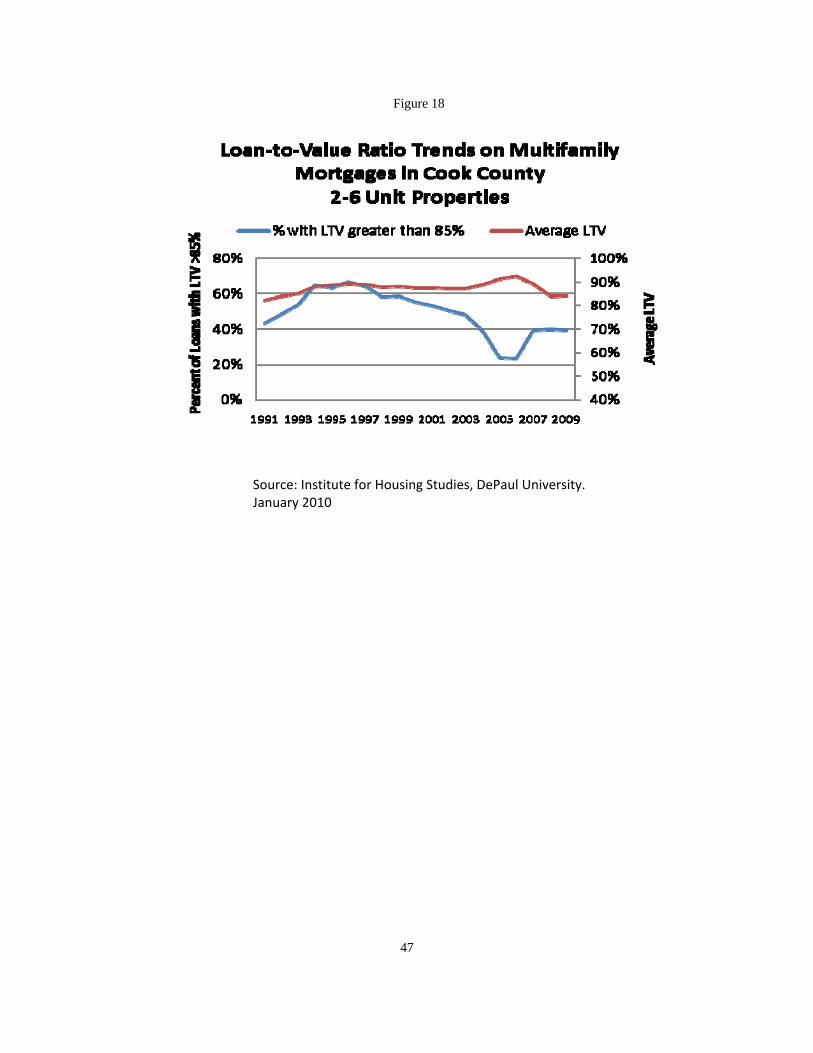
Figure 18
Source: Institute for Housing Studies, DePaul University. January 2010
47
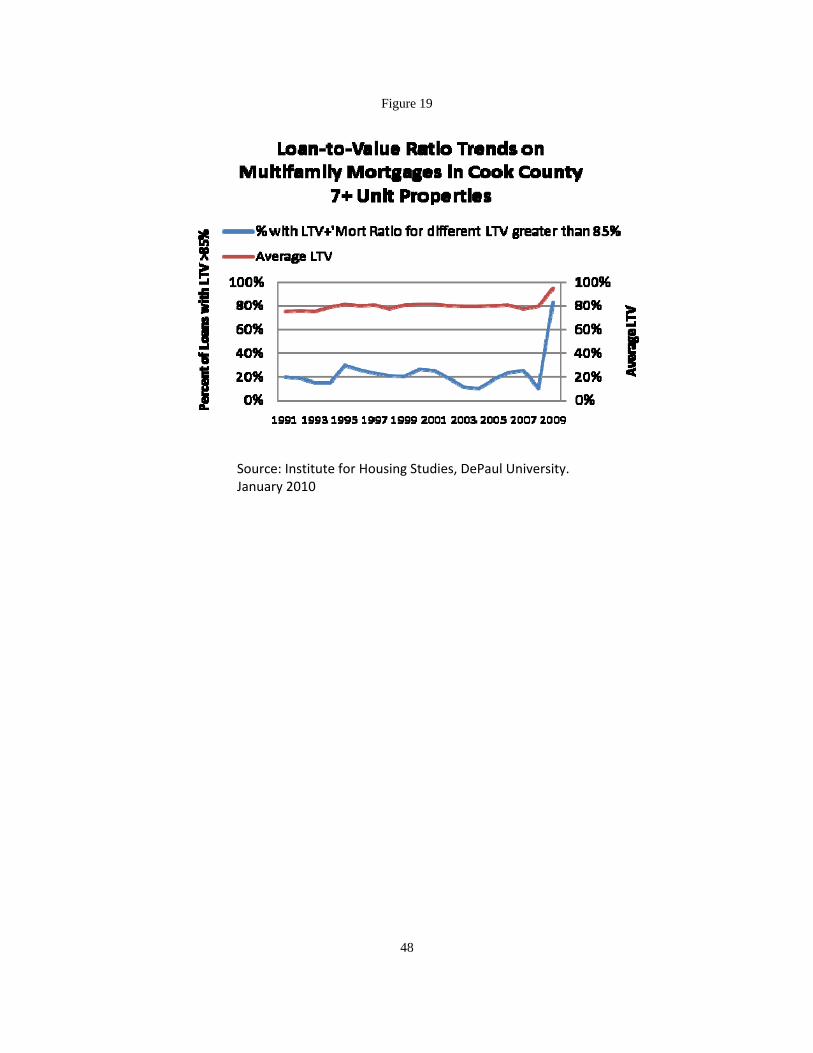
Figure 19
Source: Institute for Housing Studies, DePaul University. January 2010
48

49
Table 1
Cook County Foreclosure Rate by Income Submarkets and Property Type
Year 2‐6 Units 7 or More Units
Low * Moderate High Low Moderate High 1999 3.5% 2.2% 0.5% 0.8% 0.7% 0.1% 2000 4.2% 2.5% 0.5% 0.7% 0.3% 0.0% 2001 6.0% 2.1% 0.8% 1.7% 0.8% 0.1% 2002 7.0% 2.9% 0.9% 2.5% 1.2% 0.2% 2003 4.6% 2.6% 0.7% 1.0% 0.9% 0.2% 2004 5.2% 2.5% 0.7% 3.3% 0.6% 0.1% 2005 4.7% 2.3% 0.5% 2.3% 0.5% 0.0% 2006 6.2% 3.1% 0.8% 1.6% 0.9% 0.8% 2007 9.6% 5.0% 1.7% 3.1% 1.4% 0.1% 2008 12.7% 7.4% 2.4% 3.5% 2.5% 0.1%
2009 13.9% 10.8% 4.2% 7.8% 4.3% 2.1% * The low‐income submarket includes all census tracts where median household income in 2000 was less than 150% of poverty level for
a family of four in 2000 ($26,405).
The moderate income submarket includes all census tracts where 2000 median income for the tract was between 150% and 300% of
poverty level for family of four (up to $52,809).
The high income submarket includes all tracts where median household income was higher than 300% of poverty level for family of four
(above $52,809).
Source: Institute for Housing Studies, DePaul University, January 2010