Pre-electoral Coalitions, Party System and Electoral Geography

IZA DP No. 2311
The Looks of a Winner:Beauty, Gender and Electoral Success
Niclas BerggrenHenrik JordahlPanu Poutvaara
DI
SC
US
SI
ON
PA
PE
R S
ER
IE
S
Forschungsinstitutzur Zukunft der ArbeitInstitute for the Studyof Labor
September 2006
The Looks of a Winner:
Beauty, Gender and Electoral Success
Niclas Berggren Ratio Institute, Stockholm
Henrik Jordahl
Research Institute of Industrial Economics, Stockholm
Panu Poutvaara University of Helsinki
and IZA Bonn
Discussion Paper No. 2311 September 2006
IZA
P.O. Box 7240 53072 Bonn
Germany
Phone: +49-228-3894-0 Fax: +49-228-3894-180
Email: [email protected]
Any opinions expressed here are those of the author(s) and not those of the institute. Research disseminated by IZA may include views on policy, but the institute itself takes no institutional policy positions. The Institute for the Study of Labor (IZA) in Bonn is a local and virtual international research center and a place of communication between science, politics and business. IZA is an independent nonprofit company supported by Deutsche Post World Net. The center is associated with the University of Bonn and offers a stimulating research environment through its research networks, research support, and visitors and doctoral programs. IZA engages in (i) original and internationally competitive research in all fields of labor economics, (ii) development of policy concepts, and (iii) dissemination of research results and concepts to the interested public. IZA Discussion Papers often represent preliminary work and are circulated to encourage discussion. Citation of such a paper should account for its provisional character. A revised version may be available directly from the author.
IZA Discussion Paper No. 2311 September 2006
ABSTRACT
The Looks of a Winner: Beauty, Gender and Electoral Success*
We study the role of beauty in politics. For the first time, focus is put on differences in how women and men evaluate female and male candidates and how different candidate traits relate to success in real and hypothetical elections. We have collected 16,218 assessments by 2,772 respondents of photos of 1,929 Finnish political candidates. Evaluations of beauty explain success in real elections better than evaluations of competence, intelligence, likability, or trustworthiness. The beauty premium is larger for female candidates, in contrast to findings in previous labor-market studies. JEL Classification: D72, J45, J7 Keywords: beauty, gender, elections, political candidates, beauty premium Corresponding author: Panu Poutvaara Department of Economics University of Helsinki P.O. Box 17 (Arkadiankatu 7) FIN-00014 Helsinki Finland E-mail: [email protected]
* The authors wish to thank Mikael Priks and participants at the 2006 IIPF conference on Cyprus for helpful comments and suggestions, all respondents and those who helped us attract them (especially our colleagues, who advertised the study to their students in several countries, and several bloggers), as well as Otto Kässi for excellent research assistance, Karl Bengtsson for outstanding technical assistance, and the Torsten and Ragnar Söderberg Foundations (Berggren and Jordahl), the Jan Wallander and Tom Hedelius Foundation (Jordahl) and the Yrjö Jahnsson Foundation (Poutvaara) for financial support.

1
1. Introduction
It is well established that being beautiful confers many advantages on a person. Langlois et
al. (2000), in a meta-analysis of 102 studies, report that the looks of people influence how
they are perceived and treated by others, even by those who know them. And interestingly,
attractive persons exhibit more positive behaviors and traits than unattractive persons.1 An
emerging literature in economics demonstrates that the benefits of having good looks, as
perceived by others, extend to and are substantial in the labor market. Beautiful people re-
ceive higher wages (a so-called beauty premium). According to Hamermesh and Biddle
(1994), workers of above-average beauty earn about 10 to 15 percent more than workers of
below-average beauty. Other studies obtain qualitatively similar results: see e.g. Frieze et al.
(1991), Biddle and Hamermesh (1998), Harper (2000), Pfann et al. (2000), Hamermesh et al.
(2002), French (2002) and Mocan and Tekin (2006). Experimental studies confirm this picture,
e.g. Andreoni and Petri (2004) and Mobius and Rosenblat (2006).2
We take this line of inquiry further and ask whether there are benefits to being beauti-
ful in the political arena as well. Is there a political “beauty premium”, such that better-
looking candidates have a higher chance of becoming elected to public office? In fact the ad-
vantage of beauty could, according to the logic of expressive voting, be even greater in elec-
tions: in the absence of opportunity cost people might as well vote for the most handsome or
beautiful candidate.3 If so, this might be part of what some see as a tendency in elections to
legislatures to put focus on candidates rather than on political platforms.4 We are the first to
study how evaluations of male and female political candidates, in particular of their beauty,
by male and female respondents differ. Our use of photos representing real political candi-
dates allows us to outline how gender differences in evaluations are related to the electoral
performance of male and female candidates.
1 It is e.g. found that attractive children are more popular and better adjusted; and that attractive adults experi-
ence more occupational success, are more popular, have better physical health, are somewhat more extroverted,
have somewhat higher self-esteem, have somewhat better social skills and have a little better mental health. Cf.
Feingold (1992a) and Eagly et al. (2001).2 There are more general experimental studies of the effects of beauty, e.g. Mulford et al. (1998) on the Prisoners’
Dilemma, Solnick and Schweitzer (1999) on the Ultimatum Game, and Eckel and Wilson (2004) on trust games.3 On expressive voting, see e.g. Brennan and Lomasky (1993).4 See e.g. Wattenberg (1991), Stewart and Clarke (1992) and Mughan (2000) for such views. Cf. King (2002) for
some dissent.

2
To study the role of beauty in politics, we have carried out a web survey with over
1,900 facial photos of Finnish political candidates, collecting evaluations from about 2,800
respondents who were asked to assess their beauty, as well as a few other traits, on a five-
point scale. The survey was carried out outside of Finland, to minimize the risk that respon-
dents would recognize the persons in the photos. Each candidate’s beauty score, on average
based on about nine assessments, has then been related to the number of votes they obtained
in the 2003 and 2004 elections. Respondents were shown the same photos that Finnish voters
had seen in the advertisements by political parties. We also asked respondents to choose
whom they would vote for in a hypothetical election among four candidates.
Our main contribution to the literature on the role of beauty in politics consists of a sys-
tematic investigation of the role of gender. If beauty matters for electoral success, then the
question is if it confers differential advantages on male and female candidates. Furthermore,
we investigate whether male and female respondents differ in their evaluation of candidates’
beauty and other traits. The beauty literature so far has paid scant attention to the gender
issue. In their broad and general meta-study, Langlois et al. (2000: 399) report the following:
The meta-analyses showed that, both within and across cultures, people agreed about who is and is not at-
tractive. Furthermore, attractiveness is an advantage in a variety of important, real-life situations. We found
not a single gender difference and surprisingly few age differences, suggesting that attractiveness is as important
for males as for females and for children as for adults. (Our italics.)
In the labor market, Hamermesh and Biddle (1994: 1187) conclude that there is an
absence of significantly larger penalties and premia, especially the latter, for women than for men. If any-
thing, the evidence goes in the opposite direction: men’s looks may have slightly larger effects on their
earnings than do women’s.5
In electoral studies, rather little is reported on gender and beauty. Banducci et al. (2003)
find that female candidates are evaluated as less attractive, on average, than male candidates
but do not indicate whether the electoral effect of beauty differs between men and women.
5 Similar qualitative results are obtained in other labor market studies, e.g. on lawyers (Biddle and Hamermesh,
1998), on young U.S. workers (Mocan and Tekin, 2006), on Chinese workers (Hamermesh et al., 2002) and on U.K.
workers (Harper, 2000). There are also studies that look at different treatments of men and women in the labor
market that do not focus on beauty, e.g. Neumark et al. (1996) on restaurants and Goldin and Rouse (2000) on
symphony orchestras.

3
Hamermesh (forthcoming) looks at elections to the high offices of the American Economic
Association, and his results indicate that there is a large and almost statistically significant
effect of beauty on the electoral success of a male candidate; but also that there is virtually no
such effect for a female candidate. This may be the result of the fact that 74 percent of the
female candidates in his sample were elected, which makes one expect female candidates’
beauty have little marginal effect.6 Klein and Roser (2006) find that being a man influences a
candidate’s vote share positively, but only by about 0.5 percentage point. They do not inves-
tigate if there is a gender difference in beauty assessments.
In addition to the main focus on gender, beauty and electoral success, we make three
other contributions to the literature. First, we not only study how evaluations are related to
actual electoral success but also, using the same photos, how the candidates succeed in hypo-
thetical elections. Second, we ask respondents to evaluate not only perceived beauty but also
other traits. Third, our study is the first study of the effects of facial appearance on the suc-
cess of politicians in a wholly proportional electoral system, enabling us to focus on within-
party competition. The benefits of focusing on this type of competition are i) that many elec-
toral systems are proportional and that, hence, political candidates in many places do com-
pete against other candidates from the same party, ii) that plurality-vote systems like the
American one also contain intraparty competition between candidates in the primary-
election stage, and for that reason our study has clear implications for American politics as
well, and iii) that there are methodological advantages to studying within- rather than be-
tween-party competition, like most previous studies do. The main reason is that it is much
easier to isolate the effect of beauty on electoral success, as the choice between candidates of
different parties can be expected to be influenced by many other factors, such as ideology,
which we are able to control for with our approach.
We relate our findings to an emerging literature on the role of beauty in politics, the
initial results of which can generally be said to be in need of verification and extension, not
least in terms of whether they are characterized by gender differences. Banducci et al. (2003)
find that attractive candidates to British community boards are at an advantage – moving
6 Hamermesh and Schmidt (2003), in a study of gender discrimination in elections to the Econometric Society,
find that men and women are treated identically, if their qualifications are identical. Donald and Hamermesh
(2006), in a study of elections to the American Economic Association, find that women are at an advantage: their
chance of victory is much better than for men, and even more so when other determinants are accounted for.
Dillingham et al. (1994), in another study of elections in a professional society, found that women tend to vote for
other women to a disproportionate degree, whereas men were not guided by candidate gender in their voting.
These three studies do not explicitly look at beauty, however.
4
from the lowest rating to the highest increases the candidate’s share of the votes by 14 per-
centage points. Klein and Rosar (2006), in a study of a German state election, find that the
effect of beauty is higher the lower the average attractiveness of the candidates in the con-
stituency and that variations in a candidate’s attractiveness can cause a change in his or her
vote share of two to four percentage points. Todorov et al. (2005) find that inferences of com-
petence from photos predict the outcomes of actual elections to the U.S. Congress quite well
(71.6 percent of the Senate races and 66.8 percent of the House races).7 Benjamin and Shapiro
(2006) report that about 20 percent of the variation of the actual vote shares in U.S. guberna-
torial elections can be explained by assessments of video clips.
Our main result is that beauty is conducive to electoral success, but far from a neces-
sary condition for it. In a hypothetical election, we observe that perceived competence and
trustworthiness are more strongly related to the voting decision than beauty, even if beauty
also plays a statistically significant role. However, in real elections, when candidates are cho-
sen in competition with others on the same party list, beauty is more strongly correlated with
success than the other traits. Although the estimated effect of beauty on the vote share is
small, it might tip the scale for some candidates at the cut-off point on a list. Furthermore, we
observe in the hypothetical election that female respondents tend to favor female candidates,
while male respondents tend to vote equally often for men and women.
One could also mention that we use more respondents than other studies – almost
2,800 compared to four (Hamermesh, forthcoming), 50 (Mobius and Rosenblat, 2006), 100
(Banducci et al., 2003), 264 (Benjamin and Shapiro, 2006) and 843 (Todorov et al., 2005).8 This
is a kind of sensitivity test. We also use a larger number of photos (to reduce the risk that
results are driven by outliers), other respondents than students (e.g. from blogs and from
postings to colleagues and university alumni), and respondents from many different coun-
tries. Our cross-country analysis allows us to rule out that a single country accounts for the
observed patterns.
7 Todorov et al. (2005) have virtually nothing to say about the gender aspects of their findings, aside from the
observation that candidates who were perceived as more competent only had a small advantage from this in
races between one male and one female candidate. Their hypothesis is that people may not wish to assess the
relative competence of male and female candidates.
8 Todorov et al. (2005) collected evaluations of beauty only from 34 respondents.

5
2. Institutional Facts, Survey and Data
2.1 Institutional Facts
The political setting for this study is Finland, and its electoral system is proportional.9
Finland has a one-chamber legislature, and the country is divided into fourteen mainland
districts electing in total 199 legislators and the autonomous province of Åland (Ahvenan-
maa in Finnish) electing one. Elections are held every four years. Currently, eight parties are
represented in the Parliament.
In each district, parties10 present lists of their candidates in alphabetical order, and each
voter can and must choose one candidate on one list in the elections. The number of candi-
dates that a party can present equals the number of representatives elected from the district
if this is 14 or more, and otherwise 14. The number of seats in the 14 mainland districts varies
between seven and 32. The legislature seats of a given district are allocated based on party
vote shares to the candidates in accordance with their “competitive indices”. The candidate
in each party with the highest number of votes receives as his or her competitive index the
total number of votes obtained by his or her party, the candidate with the second highest
number of votes obtains an index calculated as half of the party votes, the third candidate
gets an index equal to a third of the party votes, etc. Then all candidates are ranked on the
basis of their indices, and from this list, there will be elected as many candidates as there are
seats in the electoral district. In the municipal elections, competitive indices are calculated in
a similar way, with each municipality forming a district.
In the 2003 national election, the participation rate among eligible citizens was 69.7
percent. Female candidates received 42.6 percent of all votes, and 75 of the elected 200 mem-
bers of parliament were women (Statistics Finland, 2006). Finnish voters also elect a Presi-
dent. At present, Social Democrat Tarja Halonen serves her second six-year term.
2.2 The Survey
In order for beauty to be a meaningful variable for social scientists to study, perceptions of it
need to be quantified as well as reflect somewhat of a stable consensus. Langlois et al. (2000)
in fact find that there is considerable and statistically significant agreement about who is and
9 See Raunio (2005) and the Election Act of 1998 at <http://www.finlex.fi/pdf/saadkaan/E9980714.PDF>10 Or electoral alliances or joint lists. For simplicity, only parties are mentioned forthwith.

6
who is not attractive, both within and across cultures. As Hamermesh and Biddle (1994:
1175) put it: “within a culture at a point in time there is tremendous agreement on standards
of beauty, and these standards change quite slowly.”11 On this basis, we have conducted a
web survey.12 We did not only ask about beauty but also about possibly related traits in or-
der to pinpoint more precisely how the beauty results are to be interpreted and what deter-
mines electoral success.13
The survey was conducted in the spring and summer of 2006. With the help of dozens
of colleagues, students in various universities outside of Finland were invited to participate,
either in lectures or by e-mail. As for traditional student recruitment, the biggest participant
numbers, more than 100 from each, came from Sciences Po in France and Uppsala University
in Sweden. To attract also non-students, invitations to participate in our study were sent to
Uppsala University alumni as well as to members of two professional associations (Interna-
tional Institute of Public Finance and European Public Choice Society). We also cooperated
with several blogs14 that advertised our study. Our data collection method allows us to study
separately traditional student respondents and respondents recruited in other ways. The
respondents had the option to participate in a lottery of 100 euros and could also order a fu-
ture summary of the results.15
11 The same point is made by e.g. Adams (1977), Feingold (1992b), Jones and Hill (1993), Perrett et al. (1994), Cun-
ningham et al. (1995) and Aharon et al. (2001). We also find remarkably small differences between countries. For
example, the average beauty rating on a five-point scale by Swedes was 2.7, by Americans 2.8, by French 2.6, by
Germans 2.8, by Danes 2.7 and by others 2.7. Since respondents from different countries may not have evaluated
the same photos the same share of times, one can also compare the mean deviation of national evaluations from
the mean evaluations of each photo among respondents from all nationalities. Then we get the following results:
Swedes –0.0002, Americans 0.0164, French –0.1092, Germans 0.0288, Danes –0.0246 and others 0.0151. It is clear
that respondents in different countries make very similar evaluations of the same photos (with the French possi-
bly finding candidates a little less beautiful than others).12 For an excerpt of questions asked, including reply alternatives, see Box A1 in the Appendix.13 We do not claim that the evaluations represent true characteristics of the persons in the photos. This study is
about perceptions and how these are related. None of the relationships reported should be interpreted as claims
of a relationship in any underlying true characteristics.14 A “blog” is a weblog, i.e. a website with personal commentary, often on current affairs and topics.15 We have conducted another web survey with the same photos, getting almost 39,000 responses from about
3,500 participants. We focus on the current survey as we did not report in the earlier survey that the photos depict
political candidates or that we are studying politics, and thus did not ask who the respondents would vote for.
Nonetheless, the earlier survey serves as an extensive sensitivity analysis of the results and indicates high test-
retest reliability. When both surveys are combined, each photo has received almost 30 ratings on average, render-
ing the results statistically very robust. Importantly, we found that the results were relatively similar whether the

7
Each respondent was shown four photos one at a time, two of women and two of men,
randomly chosen from the database of photos. In connection with each of them, several ques-
tions were asked. There was an option, after having evaluated four photos, to evaluate addi-
tional rounds of four photos, this time with a choice as to whether to evaluate only women,
only men or a continued mixture. There was no time limit for looking at the photos.16 The
size of the photos was approximately 5 x 3.5 centimeters (2 x 0.7 inches), and they depicted
faces only. No other information than the photo was given about anyone. In Finland, politi-
cal parties have in each district a poster that has a photo of each candidate. These photos
were provided to us by the participating political parties. Thus, our respondents were shown
the same photos as the voters.17 The candidates on the photos come from four parties: the
Social Democratic Party, the National Coalition Party, the Left Alliance and the Green
League. These parties represent 63 percent of elected members of parliament in the 2003 elec-
tion.
2.3 Data
Number of photos
The database contained 1,929 photos of Finnish political candidates – 1,009 of men (52 per-
cent) and 920 of women (48 percent), from the municipal (57 percent) and national level (43
percent). We only include evaluations by respondents who evaluated at least a full round of
four photos. Except when studying hypothetical elections we only include photos with at
least three evaluations. This gives us 1,789 photos. In the section on real elections, we confine
most of the analysis to 1,569 photos of non-incumbents.
respondents knew that the persons in photos are politicians or not. The results for the earlier survey are available
upon request.16 Presumably, respondents have used different periods of time when looking at the photos, but this need not be a
problem. Ambady and Rosenthal (1992) document that studies using longer periods of behavioral observation
do not yield greater predictive accuracy, something which seems to hold, not least, with regard to faces (cf. To-
dorov et al., 2005: 1623–1624).17 Our usage of photos that have actually been shown to the voters means that the quality of the photos or what
the candidates wear etc. are less important issues than if other photos had been used. Even more, one could argue
that using other photos than those actually shown to voters could bias estimates of the effects of appearance on
electoral success. After all, most voters do not participate in events in which they could see the candidates in
person and therefore have to rely on the photos provided in advertisements.

8
Number of responses
The number of photo evaluations from respondents evaluating at least four photos (one full
round) was 16,432. On average, each photo was evaluated by nine respondents.
Number of respondents (per country and in total)
Table 1. Respondents by countryCountry Country of residence Home country
Number Percent Number PercentUS 859 31.0 800 28.9Sweden 850 30.7 863 31.1France 261 9.4 230 8.3Germany 220 7.9 219 7.9Denmark 156 5.6 154 5.6Other country 426 15.4 506 18.2Total 2,772 100 2,772 100
Note: Respondents denote those who assessed at least four photos (one full round). 66 percent were men, 34 per-cent women. 32 percent were students, an additional 14 percent doctoral students. Average age: 31.
In order to guarantee that respondents did not recognize politicians in the photos, re-
spondents who lived in Finland were shown photos of Swedish politicians, and their evalua-
tions are not part of this study.
3. Perceptions of Beauty and Other Traits
Each photo was evaluated using five reply options, which we have converted to a five-
number scale. The lowest possible beauty rating corresponds to 1, the highest possible
beauty rating to 5, etc. In evaluating each trait, respondents had an option to abstain. The
share of those who abstained varied between 0.5 percent for beauty and 7.9 percent for
trustworthiness. There is substantial agreement among respondents; if we concentrate on
two groups of beauty evaluations above average (4 and 5) and below average (1 and 2)
the kappa coefficient of inter-rater agreement is 0.48 and highly statistically significant.
However, men and women did not always agree on their evaluations (Table 2). There is
a clear tendency for male respondents, on average, to give photos of women less positive
evaluations than female respondents do. There are smaller differences in the evaluations of
photos of men; the only statistically significant difference at the 5 percent level is that male

9
respondents find men in photos more handsome or beautiful compared to what female re-
spondents find. 18
Table 2. Average evaluationsVariable Male re-
spondentsevaluatingmale candi-dates
Femalerespondentsevaluatingmale candi-dates
Male re-spondentsevaluatingfemalecandidates
Femalerespondentsevaluatingfemalecandidates
Beauty 2.644 2.573 2.790 3.009Competence 3.304 3.272 3.205 3.389Likability 3.069 3.060 3.223 3.371Trustworthiness 3.043 3.015 3.292 3.418Intelligence 3.382 3.352 3.229 3.367
On average, male respondents perceive male candidates to be more intelligent and compe-
tent than female candidates, and female candidates to be more beautiful, likable and trust-
worthy. Female respondents give more positive evaluations of female candidates in all re-
spects, even though the difference in the evaluation of intelligence is small and not statisti-
cally significant.19
4. Hypothetical Election
The respondents were asked to vote for one of four candidates (the ones they had just evalu-
ated) in a hypothetical election, or to abstain from voting or choose “Prefer not to answer”.20
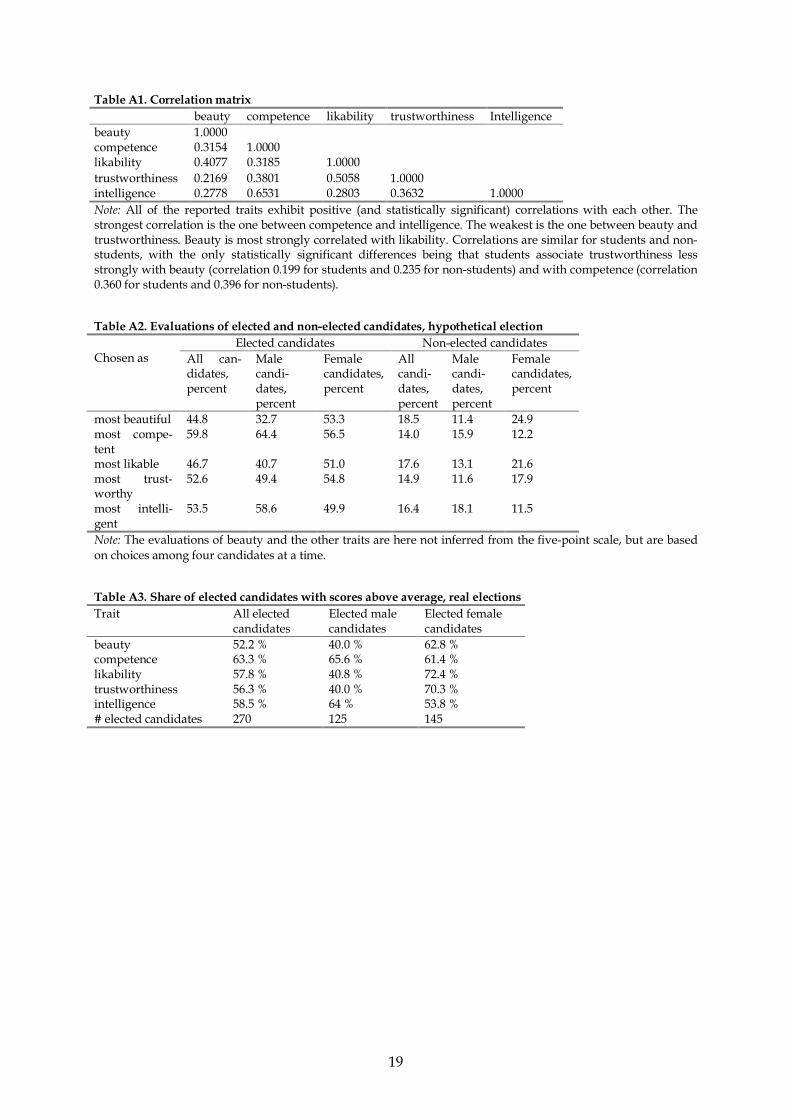
If one looks at the share of the thus “elected” candidates that were also picked as the most
extreme one (positively so) in the evaluated traits, one actually finds that beauty gets the
lowest score: only 45 percent of the respondents thought that the candidate they chose to
vote for was also the most beautiful one. Competence seems to be the most important trait in
18 The evaluations by (undergraduate and graduate) students and other respondents are remarkably similar, with
the only statistically significant differences being that students evaluate the candidates somewhat more nega-
tively in beauty (average of 2.69 vs. 2.79 for non-students) and somewhat more positively in trustworthiness (av-
erage of 3.23 vs. 3.17 for non-students).19 For correlation coefficients, see Table A1 in the Appendix.20 The instruction reads: “Sometimes people have to vote in an election with only a little information. Let us as-
sume that you would have to either vote for one of these persons as a member of Parliament [non-US respon-
dents]/the House of Representatives [US respondents], or abstain from voting. Which would be your choice?”.

10
this regard: 60 percent of the respondents thought that the candidate they chose to vote for
was the most competent one. 21
Looking at gender differences also among the respondents, Table 3 reveals that women
are elected more often than their share of photos in the hypothetical election (which here by
construction is 50 percent), since women relatively often choose female candidates (in 68.3
percent of the cases). Men, on the other hand, show a much weaker inclination to favor male
candidates. This result is in line with that of Dillingham et al. (1994), indicating that women
are sometimes at an advantage in elections.
Table 3. Gender differences in the hypothetical electionSample Women’s share of “elected” candidatesFull 56.2Male respondents 48.4Female respondents 68.3Note: The table is based on choices between four candidates, two women and two men. Thus 50 percent of thecandidates in this set of hypothetical elections are women.
The female respondents’ preference for female candidates is largely consistent with re-
sults in Table 4 from a linear probability model with the respondents’ choices of candidates
in the hypothetical election as the dependent variable.
Because of multicollinearity between the five traits, only beauty, competence, and
trustworthiness are used in our regressions in this and in the following section: we exclude
likability, which is quite highly correlated with beauty, and intelligence, which is strongly
correlated with competence. The explanatory variables are dummy variables for choices as
the most beautiful, the most competent and the most trustworthy candidate. Male candidate
is a dummy for male candidates. The table is only based on choices between two male and
two female candidates. It turns out that both men and women prefer candidates of their own
gender, a pattern which is especially strong for women. Beauty is less important than compe-
tence for both men and women.22
21 See Table A2 in the Appendix for detailed figures.22 The results are confirmed in a probit model, the results of which are available upon request.

11
Table 4. Linear probability model of the hypothetical election(1) (2)Elected by female Elected by malerespondents respondents
beautychoice 0.161*** 0.143***(0.012) (0.009)
competencechoice 0.294*** 0.295***(0.012) (0.009)
trustchoice 0.210*** 0.210***(0.012) (0.009)
male candidate -0.063*** 0.024***(0.010) (0.008)
Observations 5172 8650R-squared 0.27 0.24Standard errors in parentheses. The regressions include a constant term.* significant at 10 percent; ** significant at 5 percent; *** significant at 1 percent
When looking at choices between four female candidates, we find somewhat similar results:
beauty matters in the electoral choice for both male and female respondents; but for choices
between four male candidates, beauty only attains statistical significance and a decent coeffi-
cient size for female respondents. Furthermore, to see whether the effect of beauty is non-
linearly related to being elected, we have replaced the beauty variable with dummies for
each of the five beauty levels. Overall, the effect is approximately linear.23
5. Real Elections
We next estimate the importance of beauty and other perceived traits on electoral success.
Given that the estimates by Finnish voters would likely be influenced by their knowledge of
the candidates, using Finnish respondents would create a systematic measurement error.
This problem does not arise in our study as we only have respondents from outside of
Finland.24 Like Hamermesh (forthcoming), we look at the share of the candidates elected in
real elections who score above average on their list for the traits.25 In the case of beauty, a
little more than half of those elected had an above-average rating. This indicates that al-
though beauty may be an asset in politics, it is by no means a necessary requirement for get-
ting elected. However, again we find that there is a clear gender gap: whereas only 40 per-
23 All these results are available upon request.24 None of the respondents correctly recognized anyone of the candidates. In 17 cases the respondent mistook a
candidate for another politician. Tarja Halonen was the only Finnish politician that anyone, incorrectly, claimed
to recognize. Ten answers were of the kind “I recognize her but don’t remember her name.”25 See Table A3 in the Appendix.
12
cent of the elected male candidates had a beauty rating above average, the corresponding
number for female candidates is 63 percent. Compared to other non-incumbent candidates of
their own gender, 57 percent of elected men and 65 percent of elected women were evaluated
to be of above-average beauty.
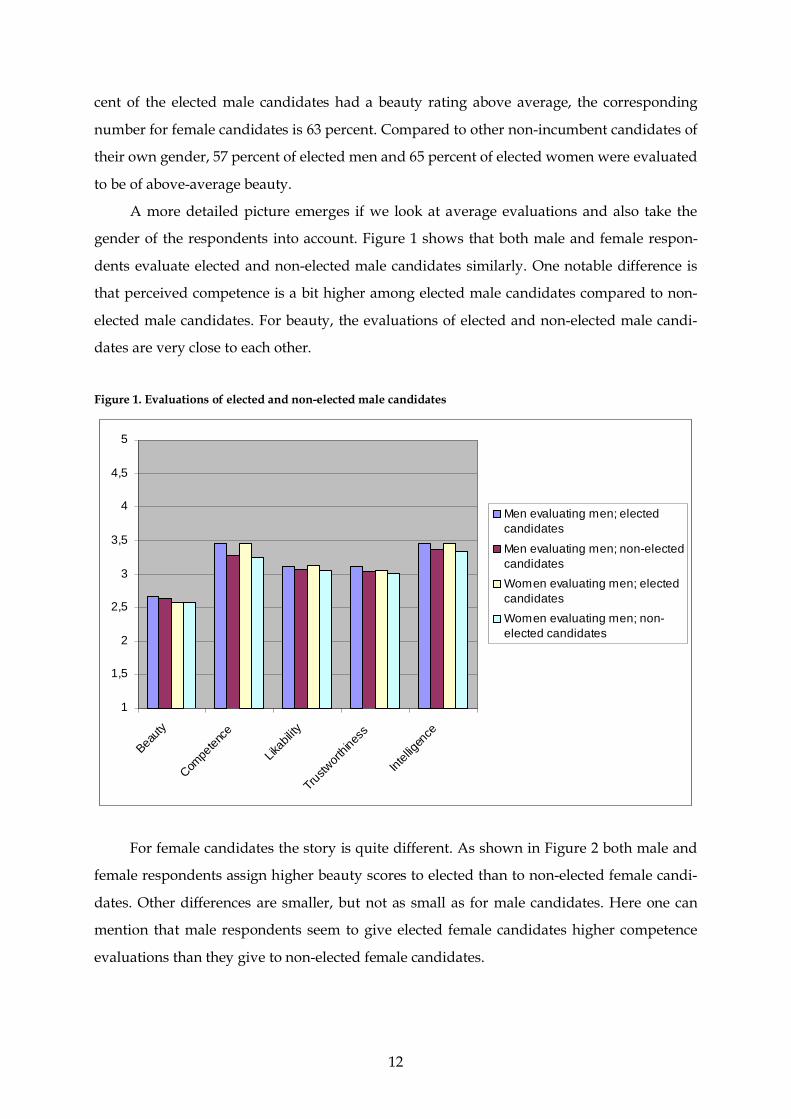
A more detailed picture emerges if we look at average evaluations and also take the
gender of the respondents into account. Figure 1 shows that both male and female respon-
dents evaluate elected and non-elected male candidates similarly. One notable difference is
that perceived competence is a bit higher among elected male candidates compared to non-
elected male candidates. For beauty, the evaluations of elected and non-elected male candi-
dates are very close to each other.
Figure 1. Evaluations of elected and non-elected male candidates
1
1,5
2
2,5
3
3,5
4
4,5
5
Beauty
Compe
tence
Likab
ility
Trustw
orthin
ess
Intell
igenc
e
Men evaluating men; electedcandidates
Men evaluating men; non-electedcandidatesWomen evaluating men; electedcandidatesWomen evaluating men; non-elected candidates
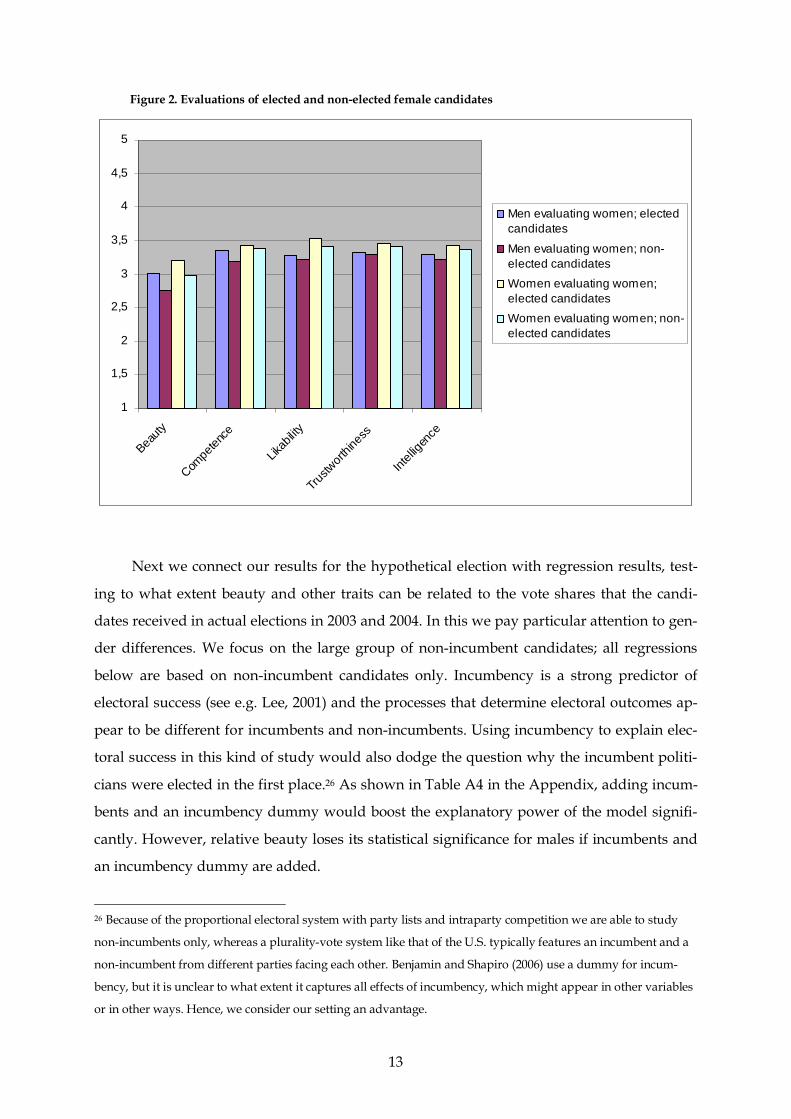
For female candidates the story is quite different. As shown in Figure 2 both male and
female respondents assign higher beauty scores to elected than to non-elected female candi-
dates. Other differences are smaller, but not as small as for male candidates. Here one can
mention that male respondents seem to give elected female candidates higher competence
evaluations than they give to non-elected female candidates.
13
Figure 2. Evaluations of elected and non-elected female candidates
1
1,5
2
2,5
3
3,5
4
4,5
5
Beauty
Compe
tence
Likab
ility
Trustw
orthin
ess
Intell
igence
Men evaluating women; electedcandidates
Men evaluating women; non-elected candidatesWomen evaluating women;elected candidatesWomen evaluating women; non-elected candidates
Next we connect our results for the hypothetical election with regression results, test-
ing to what extent beauty and other traits can be related to the vote shares that the candi-
dates received in actual elections in 2003 and 2004. In this we pay particular attention to gen-
der differences. We focus on the large group of non-incumbent candidates; all regressions
below are based on non-incumbent candidates only. Incumbency is a strong predictor of
electoral success (see e.g. Lee, 2001) and the processes that determine electoral outcomes ap-
pear to be different for incumbents and non-incumbents. Using incumbency to explain elec-
toral success in this kind of study would also dodge the question why the incumbent politi-
cians were elected in the first place.26 As shown in Table A4 in the Appendix, adding incum-
bents and an incumbency dummy would boost the explanatory power of the model signifi-
cantly. However, relative beauty loses its statistical significance for males if incumbents and
an incumbency dummy are added.
26 Because of the proportional electoral system with party lists and intraparty competition we are able to study
non-incumbents only, whereas a plurality-vote system like that of the U.S. typically features an incumbent and a
non-incumbent from different parties facing each other. Benjamin and Shapiro (2006) use a dummy for incum-
bency, but it is unclear to what extent it captures all effects of incumbency, which might appear in other variables
or in other ways. Hence, we consider our setting an advantage.

14
The trait variables are constructed in two steps. First we compute the mean over all re-
spondents who evaluated a particular photo. From this measure we then subtract its mean
over the non-incumbent candidates on the same list.
The dependent variable, vote share, refers to each non-incumbent candidate’s vote share
among the non-incumbent candidates of the same party in the same district (i.e. on the same
party list) times 100.27 As regressors, we use the three trait variables beauty, competence and
trustworthiness, measuring for each non-incumbent candidate the average trait evaluation
minus the average evaluation of that trait over all non-incumbent candidates on the same
list. In an extended regression we also include young, which is the difference between the
candidate’s estimated age and the (estimated) mean on the list, multiplied by a dummy for
age below 40, and old, which is the difference between the candidate’s estimated age and the
(estimated) mean on the list, multiplied by a dummy for age above 39.28
We begin by looking at the effects in the national election for females and males, as re-
ported in Table 5. Most notably, we find that relative beauty is by far the most important
explanatory variable of the vote share both for female and for male candidates, and the only
regressor that attains statistical significance. A higher beauty score of one unit implies an
increase of between 2.5 and 2.8 percentage points in the vote share for female candidates and
between 1.5 and 2.1 percentage points for male candidates. For young men (below 40), there
is a disadvantage of being younger than average on the list.
Table 5. Vote share explained by candidate traits, national election, by candidate gender(1) (2) (3) (4)
Vote share Vote share Vote share Vote sharefemale candidates male candidates female candidates male candidates
beauty 2.515*** 1.531** 2.754*** 2.052***(0.62) (0.72) (0.73) (0.77)
competence 0.344 1.348* 0.125 0.892(1.05) (0.79) (1.08) (0.82)
trustwothiness 0.790 0.323 0.862 0.156(1.05) (0.86) (1.06) (0.86)
young 0.0754 0.151*(0.081) (0.078)
old -0.0257 0.0336(0.085) (0.069)
Observations 348 298 348 298R-squared 0.06 0.04 0.06 0.05Standard errors in parentheses. The regressions include a constant term.* significant at 10 percent; ** significant at 5 percent; *** significant at 1 percent.
27 The results are similar if we instead use each candidate’s vote share among non-incumbents minus 1/n, where
n is the number of non-incumbents on each list.28 To reduce the influence of a small number of surprising age estimates, we use median rather than mean age to
calculate the estimated age of each candidate.
15
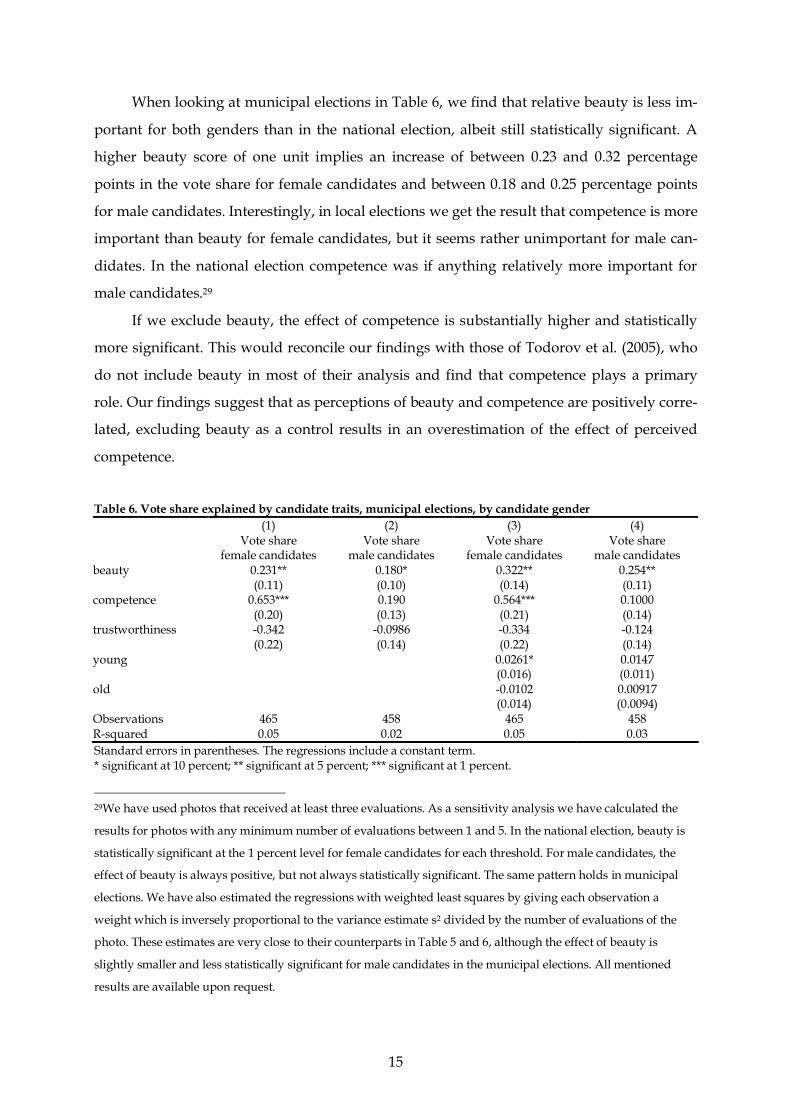
When looking at municipal elections in Table 6, we find that relative beauty is less im-
portant for both genders than in the national election, albeit still statistically significant. A
higher beauty score of one unit implies an increase of between 0.23 and 0.32 percentage
points in the vote share for female candidates and between 0.18 and 0.25 percentage points
for male candidates. Interestingly, in local elections we get the result that competence is more
important than beauty for female candidates, but it seems rather unimportant for male can-
didates. In the national election competence was if anything relatively more important for
male candidates.29
If we exclude beauty, the effect of competence is substantially higher and statistically
more significant. This would reconcile our findings with those of Todorov et al. (2005), who
do not include beauty in most of their analysis and find that competence plays a primary
role. Our findings suggest that as perceptions of beauty and competence are positively corre-
lated, excluding beauty as a control results in an overestimation of the effect of perceived
competence.
Table 6. Vote share explained by candidate traits, municipal elections, by candidate gender(1) (2) (3) (4)
Vote share Vote share Vote share Vote sharefemale candidates male candidates female candidates male candidates
beauty 0.231** 0.180* 0.322** 0.254**(0.11) (0.10) (0.14) (0.11)
competence 0.653*** 0.190 0.564*** 0.1000(0.20) (0.13) (0.21) (0.14)
trustworthiness -0.342 -0.0986 -0.334 -0.124(0.22) (0.14) (0.22) (0.14)
young 0.0261* 0.0147(0.016) (0.011)
old -0.0102 0.00917(0.014) (0.0094)
Observations 465 458 465 458R-squared 0.05 0.02 0.05 0.03Standard errors in parentheses. The regressions include a constant term.* significant at 10 percent; ** significant at 5 percent; *** significant at 1 percent.
29We have used photos that received at least three evaluations. As a sensitivity analysis we have calculated the
results for photos with any minimum number of evaluations between 1 and 5. In the national election, beauty is
statistically significant at the 1 percent level for female candidates for each threshold. For male candidates, the
effect of beauty is always positive, but not always statistically significant. The same pattern holds in municipal
elections. We have also estimated the regressions with weighted least squares by giving each observation a
weight which is inversely proportional to the variance estimate s2 divided by the number of evaluations of the
photo. These estimates are very close to their counterparts in Table 5 and 6, although the effect of beauty is
slightly smaller and less statistically significant for male candidates in the municipal elections. All mentioned
results are available upon request.

16
To further pinpoint the relationship between beauty and electoral success, and to see
whether the relationship is driven by outliers, we have computed Spearman rank correla-
tions for the 449 non-incumbent candidates in the Helsinki municipal elections.30 The Spear-
man rank correlation between beauty and vote share is especially strong for female candidates,
for whom Spearman’s rho is 0.278.31
The analysis of Spearman rank correlations also allows us to compare the relationship
between electoral success and the evaluations of the five different traits one at a time and to
implement a horse race between these as explanatory variables for electoral success. For both
females and males, the Spearman rank correlation between electoral success and beauty is
larger and has a higher statistical significance than the rank correlation between electoral
success and perceived competence, intelligence, trustworthiness and likability.
To summarize, is perceived beauty an asset in politics? Our findings indicate that it is,
especially in the national context and to a higher extent for female than for male candidates.
However, although it generally appears to be a bigger asset than e.g. competence, as inferred
from photos, it does not seem to be a dominant explanation of vote shares in the Finnish, pro-
portional electoral system. First of all, the R2s reported are everywhere quite low, indicating
that the fit of the empirical model is not all that precise. Second, the size of the effect is rather
modest, even where it matters the most (in the national election for female candidates, as
seen in Table 5). However, even a small difference in vote shares may make a difference in-
side a party list if the candidates like they are in Finland are elected in the order deter-
mined by the number of personal votes.
6. Concluding Remarks
People’s visual appearance has been shown to exert an independent influence on how they
are treated in many settings. For example, good looks seem to be a distinct advantage in the
labor market. An emerging literature indicates that beauty may play an important role in
politics as well (see e.g. Banducci et al., 2003, and Klein and Roser, 2006). We add to this lit-
erature by studying whether there are differences in how men and women are assessed by
30The Helsinki municipal elections are best suited for this, thanks to the large number of candidates and all four
parties having about the same number of non-incumbents.31 See Table A5 in the Appendix.

17
male and female respondents. Our study is the first one to analyze the role that beauty and
other perceived traits play both in hypothetical and in real political elections, taking into ac-
count gender differences among both electoral candidates and respondents.
As voters in Finland vote for a person on a party list in multi-member jurisdictions, our
analysis sheds light on the role of beauty for electoral success in a proportional electoral sys-
tem, but the results are valuable also for majoritarian electoral systems with primary elec-
tions. Our results, based on a much bigger dataset than has previously been used, imply that
beauty does play a role for electoral success – candidates who are more beautiful than their
list competitors receive higher vote shares. We also find that evaluations of beauty and com-
petence are positively correlated. Therefore, excluding beauty as a control results in an over-
estimation of the effect of perceived competence on electoral success.
In a hypothetical election, we furthermore observe that female respondents tend to fa-
vor female candidates, while male respondents tend to vote equally often for men and
women. Controlling for choices of the most beautiful, most competent, and most trustworthy
candidate in a linear probability model confirms this general picture: female respondents
tend to vote for women to a larger extent than men tend to vote for men. We find a similar
pattern in general evaluations: female respondents tend to evaluate women in photos clearly
more positively than male respondents do, while the gender differences in evaluating photos
of men are small.
18
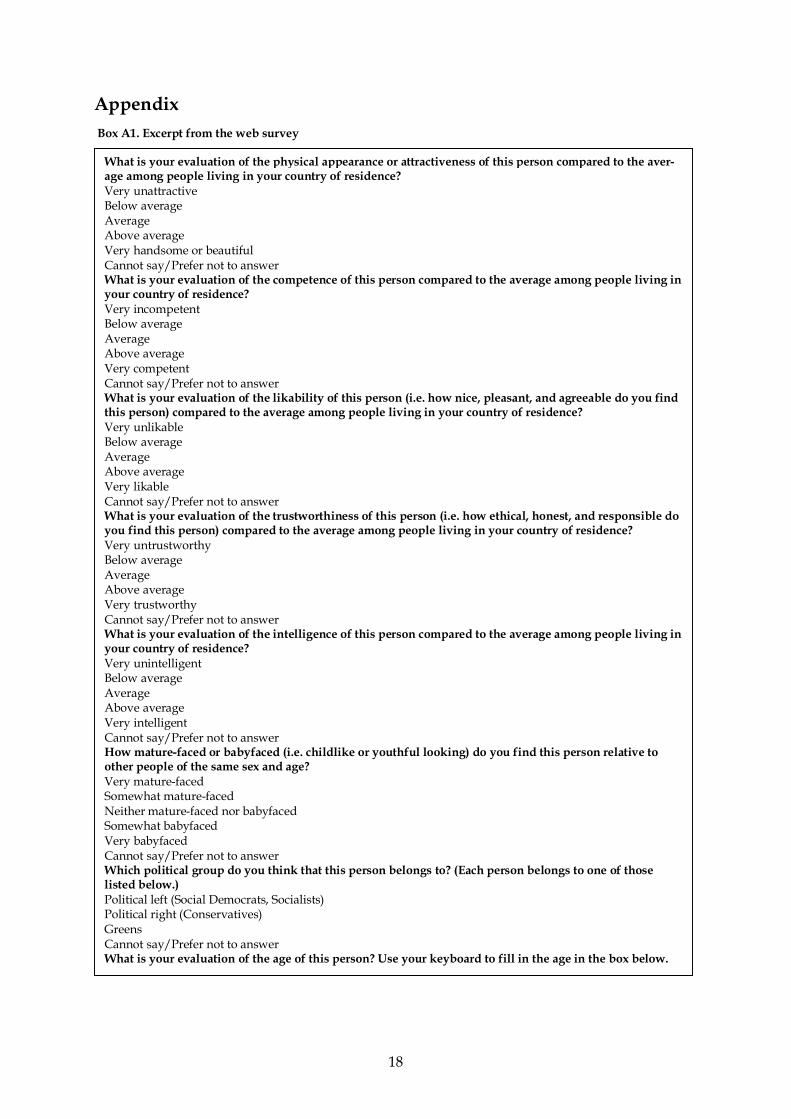
Appendix Box A1. Excerpt from the web survey
What is your evaluation of the physical appearance or attractiveness of this person compared to the aver-age among people living in your country of residence?Very unattractiveBelow averageAverageAbove averageVery handsome or beautifulCannot say/Prefer not to answerWhat is your evaluation of the competence of this person compared to the average among people living inyour country of residence?Very incompetentBelow averageAverageAbove averageVery competentCannot say/Prefer not to answerWhat is your evaluation of the likability of this person (i.e. how nice, pleasant, and agreeable do you findthis person) compared to the average among people living in your country of residence?Very unlikableBelow averageAverageAbove averageVery likableCannot say/Prefer not to answerWhat is your evaluation of the trustworthiness of this person (i.e. how ethical, honest, and responsible doyou find this person) compared to the average among people living in your country of residence?Very untrustworthyBelow averageAverageAbove averageVery trustworthyCannot say/Prefer not to answerWhat is your evaluation of the intelligence of this person compared to the average among people living inyour country of residence?Very unintelligentBelow averageAverageAbove averageVery intelligentCannot say/Prefer not to answerHow mature-faced or babyfaced (i.e. childlike or youthful looking) do you find this person relative toother people of the same sex and age?Very mature-facedSomewhat mature-facedNeither mature-faced nor babyfacedSomewhat babyfacedVery babyfacedCannot say/Prefer not to answerWhich political group do you think that this person belongs to? (Each person belongs to one of thoselisted below.)Political left (Social Democrats, Socialists)Political right (Conservatives)GreensCannot say/Prefer not to answerWhat is your evaluation of the age of this person? Use your keyboard to fill in the age in the box below.
19
Table A1. Correlation matrixbeauty competence likability trustworthiness Intelligence
beauty 1.0000competence 0.3154 1.0000likability 0.4077 0.3185 1.0000trustworthiness 0.2169 0.3801 0.5058 1.0000intelligence 0.2778 0.6531 0.2803 0.3632 1.0000Note: All of the reported traits exhibit positive (and statistically significant) correlations with each other. Thestrongest correlation is the one between competence and intelligence. The weakest is the one between beauty andtrustworthiness. Beauty is most strongly correlated with likability. Correlations are similar for students and non-students, with the only statistically significant differences being that students associate trustworthiness lessstrongly with beauty (correlation 0.199 for students and 0.235 for non-students) and with competence (correlation0.360 for students and 0.396 for non-students).
Table A2. Evaluations of elected and non-elected candidates, hypothetical electionElected candidates Non-elected candidates
Chosen as All can-didates,percent
Malecandi-dates,percent
Femalecandidates,percent
Allcandi-dates,percent
Malecandi-dates,percent
Femalecandidates,percent
most beautiful 44.8 32.7 53.3 18.5 11.4 24.9most compe-tent
59.8 64.4 56.5 14.0 15.9 12.2
most likable 46.7 40.7 51.0 17.6 13.1 21.6most trust-worthy
52.6 49.4 54.8 14.9 11.6 17.9
most intelli-gent
53.5 58.6 49.9 16.4 18.1 11.5
Note: The evaluations of beauty and the other traits are here not inferred from the five-point scale, but are basedon choices among four candidates at a time.
Table A3. Share of elected candidates with scores above average, real electionsTrait All elected
candidatesElected malecandidates
Elected femalecandidates
beauty 52.2 % 40.0 % 62.8 %competence 63.3 % 65.6 % 61.4 %likability 57.8 % 40.8 % 72.4 %trustworthiness 56.3 % 40.0 % 70.3 %intelligence 58.5 % 64 % 53.8 %# elected candidates 270 125 145

20
Table A4. National election regression results including incumbentsVote share Vote share
female candidates male candidatesbeauty 1.663*** 0.614
(0.54) (0.63)competence 0.187 1.204*
(0.78) (0.68)trustworthiness 0.246 0.448
(0.79) (0.69)incumbent 10.27*** 12.64***
(0.90) (0.86)young 0.0793 0.0568
(0.057) (0.064)old -0.0185 -0.0452
(0.061) (0.056)Observations 394 349R-squared 0.30 0.41Note: incumbent is a dummy variable for incumbent candidates.Standard errors in parentheses. *** p<0.01, ** p<0.05, * p<0.1
Table A5. Spearman rank correlations for Helsinki, non-incumbent candidates onlyAll candidates Male candidates Female candidates
Spearman’s 0.247 0.138 0.278beautyTest of H0: beauty and voteshare are independent
Prob > |t| = 0.000 Prob > |t| = 0.041 Prob > |t| = 0.000
Spearman’s 0.134 0.069 0.181competenceTest of H0: competence andvote share are independent
Prob > |t| = 0.004 Prob > |t| = 0.311 Prob > |t| = 0.0061
Spearman’s 0.148 0.062 0.132likabilityTest of H0: likability and voteshare are independent
Prob > |t| = 0.002 Prob > |t| = 0.357 Prob > |t| = 0.047
Spearman’s 0.095 -0.063 0.006trustworthinessTest of H0: truworthiness andvote share are independent
Prob > |t| = 0.044 Prob > |t| = 0.353 Prob > |t| = 0.926
Spearman’s 0.051 0.013 0.167intelligenceTest of H0: intelligence andvote share are independent
Prob > |t| = 0.284 Prob > |t| = 0.843 Prob > |t| = 0.011
# candidates 449 220 229

21
References
Adams, G. (1977). “Physical Attractiveness Research: Toward a Devolopmental Social Psy-
chology of Beauty.” Human Development 20: 217−239.
Aharon, I., Etcoff, N., Ariely, D., Chabris, C., O’Connor, E. and Breiter, H. (2001). “Beautiful
Faces Have Variable Reward Value: fMRI and Behavioral Evidence.” Neuron 32: 537–
551.
Ambady, N. and Rosenthal, R. (1992). “Thin Slices of Expressive Behavior as Predictors of
Interpersonal Consequences: A Meta-Analysis.” Psychological Bulletin 111(2): 256–274.
Andreoni, J. and Petri, R. (2004). “Beauty, Gender and Stereotypes: Evidence from Labora-
tory Experiments.” Working Paper. University of Wisconsin, Madison, WI.
Banducci, A. A., Thrasher, M., Rallings, C. and Karp, J. A. ( 2003). “Candidate Appearance
Cues in Low-Information Elections.” Paper presented at the Annual Conference of
the American Political Science Association, Philadelphia.
Benjamin, D. J. and Shapiro, J. M. (2006). “The Rational Voter, Thinly Sliced: Personal Appeal
as an Election Forecaster.” Unpublished paper. Harvard University, Cambridge, MA.
Biddle, J. E. and Hamermesh, D. S. (1998). ”Beauty, Productivity and Discrimination: Law-
yers’ Looks and Lucre.” Journal of Labor Economics 16(1): 172–201.
Brennan, G. and Lomasky, L. (1993). Democracy and Decision: The Pure Theory of Electoral Pref-
erence. Cambridge: Cambridge University Press.
Cunningham, M., Roberts, A. R., Barbee, A. P., Cruen, P..B. and Wu, C.-H. (1995). “Consis-
tency and Variability in the Cross-Cultural Perception of Female Physical Attractive-
ness.” Journal of Personality and Social Psychology 68: 261–279.
Dillingham, A., Ferber, M. and Hamermesh, D. S. (1994). “Gender Discrimination by Gender:
Voting in a Professional Society.” Industrial and Labor Relations Review 47(4): 622-633.
Donald, S. G. and Hamermesh, D. S. (forthcoming). “What Is Discrimination? Gender in the
American Economic Association, 1925-2004.” American Economic Review.
Eagly, A. H., Ashmore, R.D., Makhijani, M. G. and Longo, L. C. (2001).”What Is Beautiful Is
Good, But: A Meta-Analytic Review of Research on the Physical Attractiveness
Stereotype.” Journal of Management 27: 363–381.
Eckel, C. C. and Wilson, R. K. (2004). “Detecting Trustworthiness: Does Beauty Confound
Intuition?” Discussion Paper. Virginia Polytechnic Institute and State University,
Blacksburg, VA.
22
Feingold, A. (1992a). “Good-Looking People Are Not What We Think.” Psychological Bulletin
111: 304–341.
Feingold, A. (1992b). “Gender Differences in Mate Selection Preferences: A Test of the Paren-
tal Investment Model.” Psychological Bulletin 112: 125–139.
French, M. (2002). “Physical Appearance and Earnings: Further Evidence.” Applied Economics
34: 569−572.
Frieze, I., Olson, J. and Russell, J. (1991). “Attractiveness and Income for Men and Women in
Management.” Journal of Applied Social Psychology 21(3): 1039−1057.
Goldin, C. and Rouse, C. (2000). “Orchestrating Impartiality: The Impact of ‘Blind’ Auditions
on Female Musicians.” American Economic Review 90(4): 715–741.
Hamermesh, D. S. (forthcoming). “Changing Looks and Changing 'Discrimination': The
Beauty of Economists.” Economics Letters.
Hamermesh, D. S. and Biddle, J. E. (1994). “Beauty and the Labor Market.” American Eco-
nomic Review 84 (5): 1174−1194.
Hamermesh, D. S., Meng, X. and Zhang, J. (2002). “Dress for Success – Does Primping Pay?”
Labour Economics 9(3): 361–373.
Hamermesh, D. S. and Schmidt, P. (2003). “The Determinants of Econometric Society Fellows
Elections.” Econometrica 71(1): 399–407.
Harper, B. (2000). “Beauty, Stature and the Labour Market: A British Cohort Study.” Oxford
Bulletin of Economics and Statistics 62: 771−800.
Jones, D. M. and Hill, K. (1993). “Criteria of Facial Attractiveness in Five Populations.” Hu-
man Nature 4: 271–296.
King, A. (Ed.) (2002). Leaders’ Personalities and the Outcomes of Democratic Elections. Oxford:
Oxford University Press.
Klein, M. and Rosar, U. (2006). “The Frog Pond Beauty Contest: Physical Attractiveness and
Electoral Success of the Constituency Candidates at the North Rhine-Westphalia State
Election 2005.” Unpublished paper. University of Köln, Köln, Germany.
Langlois, J. H., Kalakanis, L., Rubenstein, A. J., Larson, A., Hallamm, M. and Smoot, M.
(2000). “Maxims or Myths of Beauty? A Meta-Analytic and Theoretical Review.” Psy-
chological Bulletin 126(3): 390–423.
Lee, D. S. (2001). ”The Electoral Advantage to Incumbency and Voters’ Valuation of Politi-
cians’ Experience: A Regression Discontinuity Analysis of the Elections to the U.S.
House.” NBER Working Paper No. 8441. National Bureau of Economic Research
(NBER), Cambridge, MA.

23
Mobius, M. M. and Rosenblat, T. S. (2006). “Why Beauty Matters.” American Economic Review
96(1): 222–235.
Mocan, N. and Tekin, E. (2006). “Ugly Criminals.” IZA Discussion Paper No. 2048. Institute
for the Study of Labor (IZA), Bonn, Germany.
Mughan, A. (2000). Media and the Presidentialization of Parliamentary Elections. Basingstoke:
Palgrave.
Mulford, M., Orbell, J., Shatto, C. and Stockard, J. (1998). “Physical Attractiveness, Opportu-
nity and Success in Everyday Exchange.” The American Journal of Sociology 103: 1565–
1593.
Neumark, D., Bank R. J. and Nort, K. D. van (1996). “Sex Discrimination in Restaurant Hir-
ing: An Audit Study.” Quarterly Journal of Economics 111(3): 915–941.
Perrett, D. I., Burt, M. D., Penton-Voak, I .S., Lee, K. J., Rowland, D. A. and Edwards, R.
(1999). “Symmetry and Human Facial Attractiveness.” Evolution and Human Behavior
20: 295–307.
Pfann, G. A., Biddle, J. E., Hamermesh, D. S. and Bosman, C. M. (2000). “Business Success
and Businesses’ Beauty Capital.” Economics Letters 67(2): 201–207.
Raunio, T. (2005). “Finland: One Hundred Years of Quietitude.” In Gallagher, M. and
Mitchell, P. (Eds.) The Politics of Electoral Systems. Oxford: Oxford University Press.
Rosenberg, S. W., Bohan, L., McCafferty, P. and Harris, K. (1986). “The Image and the Vote:
The Effect of Candidate Presentation on Voter Preference.” American Journal of Politi-
cal Science 30(1): 108–127.
Rosenberg, S. W. and McCafferty, P. (1987). “The Image and the Vote: Manipulating Voters’
Preferences.” The Public Opinion Quarterly 51(1): 31–47.
Siegelman, L., Siegelman, C. K. and Fowler, C. (1987). ”A Bird of a Different Feather? An
Experimental Investigation of Physical Attractiveness and the Electability of Female
Candidates.” Social Psychology Quarterly 50(1): 32–43.
Solnick, S. J. and Schweitzer, M. E. (1999). ”The Influence of Physical Attractiveness and
Gender on Ultimatum Game Decisions.” Organizational Behavior and Human Decision
Processes 79(3): 199–215.
Statistics Finland (2006). “Parliamentary Elections, 2003.”
<http://www.tilastokeskus.fi/tup/suoluk/suoluk_vaalit_en.html>
Stewart, M. and Clarke, H. (1992). “The (Un)importance of Party Leaders: Leader Images and
Party Choice in the 1987 British Election.” Journal of Politics 54: 447–470.

24
Todorov, A., Mandisodza, A. N., Goren, A. and Hall, C. C. (2005). “Inferences of Competence
from Faces Predict Election Outcomes.” Science 308(5728): 1623–1626.
Wattenberg, M. (1991). The Rise of Candidate-Centred Politics: Presidential Elections of the
1980s. Cambridge, MA: Harvard University Press.