
The Long-Term Effects of Universal Preschool in Boston
52
NBER WORKING PAPER SERIES THE LONG-TERM EFFECTS OF UNIVERSAL PRESCHOOL IN BOSTON Guthrie Gray-Lobe Parag A. Pathak Christopher R. Walters Working Paper 28756 http://www.nber.org/papers/w28756 NATIONAL BUREAU OF ECONOMIC RESEARCH 1050 Massachusetts Avenue Cambridge, MA 02138 May 2021 Thanks to Jason Sachs and staff at Boston Public Schools and Massachusetts Department of Elementary and Secondary Education for assistance in conducting this study. Pathak thanks the W. T. Grant Early Career Scholars Program for financial support. Eryn Heying provided superb support and Robert Upton provided excellent research assistance. We have benefitted from comments from seminar participants at Harvard, UC Riverside, USC, UC Berkeley, UCLA, and the University of Chicago. The views expressed herein are those of the authors and do not necessarily reflect the views of the National Bureau of Economic Research. NBER working papers are circulated for discussion and comment purposes. They have not been peer-reviewed or been subject to the review by the NBER Board of Directors that accompanies official NBER publications. © 2021 by Guthrie Gray-Lobe, Parag A. Pathak, and Christopher R. Walters. All rights reserved. Short sections of text, not to exceed two paragraphs, may be quoted without explicit permission provided that full credit, including © notice, is given to the source.
Transcript of The Long-Term Effects of Universal Preschool in Boston

NBER WORKING PAPER SERIES
THE LONG-TERM EFFECTS OF UNIVERSAL PRESCHOOL IN BOSTON
Guthrie Gray-LobeParag A. Pathak
Christopher R. Walters
Working Paper 28756http://www.nber.org/papers/w28756
NATIONAL BUREAU OF ECONOMIC RESEARCH1050 Massachusetts Avenue
Cambridge, MA 02138May 2021
Thanks to Jason Sachs and staff at Boston Public Schools and Massachusetts Department of Elementary and Secondary Education for assistance in conducting this study. Pathak thanks the W. T. Grant Early Career Scholars Program for financial support. Eryn Heying provided superb support and Robert Upton provided excellent research assistance. We have benefitted from comments from seminar participants at Harvard, UC Riverside, USC, UC Berkeley, UCLA, and the University of Chicago. The views expressed herein are those of the authors and do not necessarily reflect the views of the National Bureau of Economic Research.
NBER working papers are circulated for discussion and comment purposes. They have not been peer-reviewed or been subject to the review by the NBER Board of Directors that accompanies official NBER publications.
© 2021 by Guthrie Gray-Lobe, Parag A. Pathak, and Christopher R. Walters. All rights reserved. Short sections of text, not to exceed two paragraphs, may be quoted without explicit permission provided that full credit, including © notice, is given to the source.

The Long-Term Effects of Universal Preschool in BostonGuthrie Gray-Lobe, Parag A. Pathak, and Christopher R. WaltersNBER Working Paper No. 28756May 2021JEL No. I20,I21,I24,I28
ABSTRACT
We use admissions lotteries to estimate the effects of large-scale public preschool in Boston on college-going, college preparation, standardized test scores, and behavioral outcomes. Preschool enrollment boosts college attendance, as well as SAT test-taking and high school graduation. Preschool also decreases several disciplinary measures including juvenile incarceration, but has no detectable impact on state achievement test scores. An analysis of subgroups shows that effects on college enrollment, SAT-taking, and disciplinary outcomes are larger for boys than for girls. Our findings illustrate possibilities for large-scale modern, public preschool and highlight the importance of measuring long-term and non-test score outcomes in evaluating the effectiveness of education programs.
Guthrie Gray-LobeUniversity of [email protected]
Parag A. PathakDepartment of Economics, E52-426MIT77 Massachusetts AvenueCambridge, MA 02139and [email protected]
Christopher R. WaltersDepartment of EconomicsUniversity of California, Berkeley530 Evans Hall #3880Berkeley, CA 94720-3880and [email protected]

1 Introduction
A substantial body of evidence establishes that early-life deficits have persistent negative impacts
on lifetime well-being (see, e.g., Knudsen et al., 2006; Almond et al., 2018). High-quality early
childhood interventions are seen as a promising tool to address such deficits, improve economic
outcomes, and reduce socioeconomic disparities (Duncan and Magnuson, 2013; Heckman, 2013;
Elango et al., 2016; Chaudry et al., 2017). Contemporary policy efforts in the United States focus
on expanding public preschool programs, many funded by state and local governments. The share
of US four-year-olds enrolled in state-funded preschool grew from 14% in 2002 to 34% in 2019.1 By
2019, 44 states and 24 of the 40 largest US cities operated large-scale public preschool programs,
and nearly half of four-year-olds attended some form of publicly-funded preschool (NIEER, 2003;
2019a; 2019b). Recent proposals at the federal, state, and local levels aim to continue this rapid
expansion (Obama, 2013; Biden, 2021).2
Enthusiasm for public preschool derives in part from encouraging experimental evidence pro-
duced by small-scale demonstration programs in the 1960s and 1970s. The High/Scope Perry
Preschool Project and Carolina Abecedarian Project randomly assigned small numbers of chil-
dren to intensive preschool programs or to control groups without program access. Comparisons
between the treatment and control groups show that the Perry and Abecedarian interventions
improved short-term test scores and behavior as well as long-term outcomes such as educational
attainment, crime, and earnings (Campbell and Ramey, 1994; Schweinhart et al., 2005; Campbell
et al., 2012; Heckman et al., 2013; Garcia et al., 2020). Cost/benefit analyses suggest that these
interventions are among the most cost-effective social programs on record (Barnett, 1985; Belfield
et al., 2006; Heckman et al., 2010b; Hendren and Sprung-Keyser, 2020).
These promising results notwithstanding, it is unclear what lessons small-scale experiments from
decades ago offer for more recent public preschool expansions. Evidence from larger-scale programs
is mixed. Non-experimental studies of the federal Head Start program find initial test score gains
that subsequently fade out, but positive effects often reappear for long-term outcomes (Currie and
Thomas, 1995; Garces et al., 2002; Ludwig and Miller, 2007; Deming, 2009; Miller et al., 2019;
Bailey et al., 2020; Pages et al., 2020). This pattern may be due to persistent impacts operating
1For comparison, 20% of four-year-olds attended a private preschool and 7% enrolled in the federal Head Startprogram in 2019 (NIEER 2019b).
2President Biden’s proposed American Families Plan would provide free universal preschool for all three- andfour-year-olds. 2020 ballot initiatives in Portland, St. Louis, San Antonio, and Colorado proposed to expand publicpreschool.
2

through non-cognitive channels (Heckman et al., 2013) or to biases in non-experimental research
strategies (Hoxby, 2014). Two randomized trials evaluating Head Start and Tennessee’s Voluntary
Pre-Kindergarten Program find modest positive test score impacts that fade out by elementary
school (Puma et al., 2010, 2012; Lipsey et al., 2018). Some analysts interpret these findings as
reflecting ineffective programs, while others argue that medium-term test scores are a poor measure
of program effectiveness (Mongeau, 2015; Bailey et al., 2017; Heckman, 2017; Whitehurst, 2017).
These disagreements may stem from the fact that no study to date has used a randomized research
design to study the long-term effects of a large-scale preschool program.3
We fill this gap by using a lottery-based research design to estimate the impacts of large-scale
public preschool in Boston, Massachusetts on long-term post-secondary educational outcomes. Our
approach compares students who were randomly lotteried in or out of public preschool as a result
of tie-breaking embedded in Boston’s school assignment mechanism. This analysis builds on earlier
work based on tie-breaking in centralized assignment systems (Abdulkadiroğlu et al., 2011, 2017)
as well as previous studies looking at short-term impacts of preschool in Boston (Weiland and
Yoshikawa, 2013; Weiland et al., 2019).
We estimate causal effects of public preschool on college enrollment and persistence, grade
progression and high school graduation, SAT and state achievement test scores, and behavioral
outcomes related to truancy, suspension, and juvenile incarceration. Our study considers more
than 4,000 randomized four-year-old applicants covering seven admissions cohorts from 1997-2003.
We measure post-secondary outcomes from a special extract of the National Student Clearinghouse,
covering roughly 99% of applicants. The lottery-based research design, together with high follow-up
rates for long-term outcomes covering roughly 20 years following preschool enrollment, enable us
to surmount many empirical challenges plaguing previous studies of early-childhood interventions.
Our analysis shows that preschool enrollment improves post-secondary outcomes. Attendance
at a public preschool in Boston boosts on-time college enrollment by 8 percentage points, an 18%
increase relative to the baseline college-going rate of 46%. Children who randomly win a seat at a
Boston preschool are 5.5 percentage points more likely to attend a four-year college by the fall after
projected high school graduation and 8.5 percentage points more likely to attend a Massachusetts
college. Preschool enrollment leads to a 5.4 percentage point increase in the probability of ever
enrolling in college and a 5.9 percentage point gain in the likelihood of ever attending a four-year
3In a review of the US early-childhood educational literature, Cascio (2021) concludes that there is no long-termevidence on the impacts of large-scale preschool programs from randomized social experiments.
3

college. Estimates for college graduation are also positive, though these results are less precise since
some cohorts are too young to observe graduation outcomes.
To probe mechanisms for these results, we also study outcomes on the pathway to college.
We find positive effects on several college preparatory outcomes. Preschool enrollment boosts
the likelihood of graduating from high school by 6 percentage points. Preschool also causes a
9 percentage point increase in SAT test-taking and raises the probabilities of scoring above the
bottom quartile and in the top quartile of the SAT distribution.
We measure effects on academic achievement using scores on Massachusetts Comprehensive As-
sessment System (MCAS) tests, and study impacts on student behavior by looking at suspensions,
attendance, and juvenile incarceration. We find no evidence of impacts on student achievement in
elementary, middle, or high school: estimated effects on MCAS scores in grades 3 through 10 are
uniformly small and statistically insignificant. In contrast, we find significant effects on disciplinary
outcomes. Preschool attendance reduces the frequency of suspensions and the probability that stu-
dents are incarcerated while in high school. Aggregating several measures into a summary index,
we find that preschool enrollment improves high school disciplinary outcomes by 0.17 standard
deviations (σ) on average.
Studies of model early-childhood demonstration programs, Head Start, and state-funded preschool
programs emphasize heterogeneity in impacts by sex, race, and income (Garces et al., 2002; Gorm-
ley et al., 2005; Anderson, 2008; Heckman et al., 2010a; Cascio, forthcoming). We therefore examine
variation in the impacts of Boston’s preschool program on these dimensions. The causal effects of
preschool are generally larger for boys than for girls. Enrollment in a Boston preschool increases
on-time college enrollment for both sexes, but effects on college graduation, high school graduation,
SAT-taking, and the discipline index are positive and significant for boys and insignificant for girls.
Differences in estimates by race and income are generally statistically insignificant.
Our analysis makes two main contributions to the literature. First, we present the first evidence
from a randomized research design on the long-term effects of a large-scale preschool program.
Previous randomized studies typically look at small-scale programs (Campbell and Ramey, 1994;
Schweinhart et al., 2005) or are limited to short-term outcomes (Puma et al., 2010, 2012; Bitler
et al., 2014; Walters, 2015; Kline and Walters, 2016; Feller et al., 2016; Lipsey et al., 2018; Weiland
et al., 2019). Other studies look at large-scale programs using observational research designs (Garces
et al., 2002; Gormley et al., 2005; Ludwig and Miller, 2007; Fitzpatrick, 2008; Wong et al., 2008;
Deming, 2009; Carneiro and Ginja, 2014; Thompson, 2018; Johnson and Jackson, 2019; Bailey et al.,
4

2020; De Haan and Leuven, 2020; Pages et al., 2020; Cascio, forthcoming).4 Studying long-term
impacts requires data following students over a long time horizon, which is rare among modern
publicly-funded preschool programs. Boston operated an unusually large public preschool program
by the late 1990s and allocated seats with a centralized mechanism, allowing us to study program
impacts over multiple decades with a randomized design. The program is run by the Boston Public
Schools district, so our results are relevant for evaluating expansions of preschool provided by state
and local governments (Muralidharan and Niehaus, 2017). Our positive estimates for educational
attainment are similar to those from model demonstration programs and non-experimental studies
of Head Start, illustrating the potential for modern public preschool programs to improve long-term
outcomes.
Second, our findings inform the debate regarding the link between short-term and long-term ef-
fects of education programs. Evaluations of new programs require assumptions to forecast long-term
impacts using short-term data (Kline and Walters, 2016; Athey et al., 2019).5 Previous evidence
suggests that immediate test score gains may be a more reliable indicator of long-term effects than
later test scores, and that non-cognitive outcomes are an important mediator of long-term impacts
(Chetty et al., 2011; Heckman et al., 2013; Chetty et al., 2014). Our results corroborate these ideas
by showing positive long-term impacts for an intervention that improves adolescent behavioral out-
comes, but not test scores. Analyses of recent cohorts in the same Boston program studied here
find initial test score gains during preschool that are no longer detectable in elementary school,
a result that is consistent with our MCAS estimates for older cohorts (Weiland and Yoshikawa,
2013; Weiland et al., 2019). Our findings suggest that this pattern masks persistent effects on
skill formation that ultimately result in higher educational attainment. More generally, our results
highlight the importance of considering non-test score and long-term outcomes when assessing the
effectiveness of education programs.
The rest of this paper is organized as follows. The next section provides background on Boston’s
preschool program and describes the data used to evaluate it. Section 3 outlines our empirical
approach and conducts validity checks on our research design. Section 4 reports lottery-based
estimates of preschool effects on post-secondary outcomes. Section 5 details results for grade
progression, high school graduation, and SAT scores. Section 6 reports effects on MCAS test scores
4Related studies outside the US include Baker et al. (2008, 2019), Havnes and Mogstad (2011, 2015), Gertleret al. (2014), Cornelissen et al. (2018), and Felfe and Lalive (2018).
5Deming (2009) writes: “... without some sense of the connection between short-run and long-run, researchersmust wait at least 15-20 years to evaluate the effect of early childhood programs.”
5

and disciplinary outcomes. Section 7 investigates heterogeneity across subgroups and compares our
estimates to results from related studies in the literature. The last section concludes.
2 Background and Data
2.1 Public Preschool in Boston
Boston Public Schools (BPS) operates separate kindergarten programs across grade levels K0
(three-year-olds), K1 (four-year-olds), and K2 (five-year-olds). Grade K0 programs enroll a small
number of special needs students, and grade K2 corresponds to traditional kindergarten. We fo-
cus on K1 programs because they enroll four-year-olds, a common entry point for public preschool.
Much of the growth in US public preschool enrollment in recent years has also come from expansions
of programs for four-year-olds (NIEER, 2019b).
Public preschool in Boston is universal in the sense that the program is open to all children
residing in Boston, regardless of income. As we show later, in practice the program enrolls a
relatively disadvantaged student population with high shares of non-white and low-income students.
Programs are housed in public school facilities, including elementary schools, early learning centers,
and special school facilities covering early grades. BPS preschools are staffed by teachers who hold
either bachelor’s or master’s degrees and must complete the same certification requirements as BPS
teachers in higher grades. In a survey of 43 randomly-selected K1 classrooms during the 2005-2006
school year, Marshall et al. (2006) found that all K1 teachers held bachelor’s degrees and 56% held
master’s degrees. On average, K1 teachers had 8 years of experience in BPS and 6 years at their
current school. More than half of the teachers were non-Hispanic white, 11% were Hispanic or
Latino, 10% were Black, and 6% described themselves as biracial.
During the time period of our study (1997-2003), BPS operated under an “autonomous district
model” giving school principals freedom to hire teachers and choose curricula. Many programs
used the Harcourt Trophies curriculum and later switched to Opening World of Learning (OWL)
and Building Blocks (Schickendanz and Dickinson, 2005; Clements and Sarama, 2007).6 Class sizes
ranged from 10 to 25 students, with an average of 19 (Marshall et al., 2006). BPS Children’s First
estimates that the program costs roughly $13,000 (2020 dollars) for full-day preschool and about
half as much for half-day programs (DESE, 1995). BPS preschool scores highly on observed metrics
6Marshall et al. (2006) report that in 2005, 60% of K1 classrooms used OWL, 40% used Building Blocks, 20%used Harcourt Trophies/Reading First, 20% used a self-developed curriculum based on best practices in the field,12% used TERK Investigations, and 8% used Readers and Writers Workshop.
6

of program quality, receiving 8 out of 10 benchmarks and ranking 6th out of 40 city-wide programs
in a recent NIEER report (NIEER, 2019a). Weiland and Yoshikawa (2013) describe more details
on the curriculum and program implementation in Boston, focusing on the period just after our
last application cohort.
Boston’s preschool offerings expanded after a period of initial uncertainty. As of 1997, most K1
programs were half-day, with students attending preschool in either the morning or the afternoon
for two and half hours. In 1997, the Boston school committee decided to partially phase out half-day
K1 programs in favor of offering full-day, six-hour kindergarten for all five-year-olds (BPS, 1997;
1998). As a result, the number of K1 seats declined from roughly 2,500 to 900 and the number of
programs dropped from about 60 to 40 between 1997 and 1998 (Figure 1).
In 1998, Boston opened three new Early Education Centers offering full-day programs. The
district also opened five additional full-day programs over the next few years, resulting in a mix of
full-day and half-day K1 programs. In 2005, Boston mayor Thomas Menino proposed expanding
the supply of K1 seats citywide and created a dedicated Department of Early Childhood (Sachs
and Weiland, 2010). Figure 1 shows that Boston preschool subsequently grew to about 2,500 K1
students per year. Recent administrations have attempted to provide enough capacity for all of
Boston’s four-year-olds, but as of 2019 there was only enough capacity to serve roughly half of
Boston’s four-year old students (Martin, 2021). The rationing of BPS preschool seats is a key
element of our research design.
2.2 Data and Sample
The Boston Public Schools district provided data covering all preschool applicants from fall 1997
to fall 2003. The application files contain demographics, address information, and the inputs used
to implement the school assignment algorithm (described further below), including students’ rank-
ordered choices over schools, admission priorities, and random tie-breaking numbers. BPS also
provided a second post-application file recording school assignments, BPS preschool enrollment,
and applicant names and dates of birth, which we link to the application file using a unique BPS
identifier.
We measure outcomes for BPS preschool applicants by matching the applicant records to several
additional data sources. The primary outcomes for our study are measures of college attendance,
college type, and college graduation derived from a special National Student Clearinghouse (NSC)
data extract. We submitted names and dates of birth for BPS applicants for matching to the
7

NSC in Spring 2020. Dynarski et al. (2015) reports that the NSC covered more than 90% of US
undergraduate institutions as of 2011, the earliest year of college enrollment for our cohorts, and
95% of Massachusetts undergraduate institutions.
We use the NSC records to construct two sets of post-secondary outcomes distinguished by the
timing of measurement. The “on-time” concept refers to whether a student achieves an outcome
within a data window that assumes normal academic progress from his or her initial application.
For example, a student who applied to preschool in fall 1997 would finish 12th grade on-time in
spring 2011, enroll in college on-time by fall 2011, and graduate from a four-year college on-time by
summer 2015. The “ever” concept records the same outcomes with no restrictions on the follow-up
window, which allows us to capture late enrollment but implies a shorter data window for more
recent applicant cohorts. Table A1 summarizes the data windows available to measure outcomes
for each cohort. Since students applying for preschool in 2002 and 2003 would not finish a four-year
college on time until after our NSC search, we do not observe college graduation outcomes for these
cohorts.
Outcomes prior to college enrollment are measured by linking preschool applicants to adminis-
trative data from the Massachusetts Department of Elementary and Secondary Education (DESE).
This database contains school enrollment records, demographics, and Massachusetts Comprehensive
Assessment System (MCAS) test scores in grades 3-8 and 10 for students enrolled at Massachusetts
public schools. The DESE data also record disciplinary outcomes including suspensions, truancy,
and codes for students in juvenile incarceration, as well as SAT scores and high school graduation
for Massachusetts public high schools. Appendix A provides further information on the procedures
used to clean and link data sets and construct outcomes.
Table 1 summarizes the characteristics of our sample of BPS preschool applicants. Column (1)
displays statistics for the sample of 8,786 first-time BPS preschool applicants who applied for a K1
slot between 1997 and 2003. As shown in Panel A, nearly three-quarters of preschool applicants
are Black or Hispanic, 10% are classified as bilingual Spanish, and the typical applicant is 4.6 years
old at the time of potential preschool enrollment. On average, students rank three schools on their
application forms (Panel B, column (1)). Panel C displays neighborhood characteristics measured
by matching an applicant’s geographic information to block groups in the 2010 US Census. The
average applicant lives in a neighborhood with a median family income of $54, 000 and a poverty
rate of 23%.
As discussed in the next section, our analysis focuses on applicants subject to random assign-
8

ment, defined as those whose preschool offers are determined by a random tie-breaker. Column (2)
of Table 1 shows descriptive statistics for the randomized subsample. In total, 4,215 applicants are
subject to random assignment. Characteristics of randomized applicants are generally similar to
those of the full applicant population.
3 Empirical Framework
3.1 Research Design
Our research design relies on random tie-breaking within Boston’s centralized school assignment
mechanism. Households applying to BPS preschools submit rank-ordered lists of preferences for
preschool programs to the district. Applicants receive priorities at each program based on sibling
status and geographic proximity (those within a program’s “walk-zone” receive higher priority).
Within priority groups, tie-breaking is based on a random number assigned by the district. The
mechanism combines preferences, priorities, and random tie-breakers to output a single assign-
ment for each applicant, which is either a specific BPS preschool program or no program. During
our study period, the city used the immediate acceptance (or “Boston”) mechanism to determine
assignments (Abdulkadiroğlu and Sönmez, 2003).
Differences in assignments between students with the same preferences and priorities arise solely
because of the random tie-breaking number. Few students share all the same preferences and prior-
ities, but in practice the probability of an offer depends on a coarser set of school-level cutoffs. This
motivates a strategy of controlling for the assignment propensity score, defined as the conditional
probability of a preschool offer given an applicant’s preferences and priorities (Abdulkadiroğlu et al.,
2017). The propensity score theorem of Rosenbaum and Rubin (1983) implies that if preschool of-
fers are random (independent of potential outcomes) conditional on preferences and priorities, then
offers are also random conditional on the assignment propensity score. A special feature of the cen-
tralized school assignment setting is that the propensity score can be calculated with knowledge of
preferences, priorities, and the structure of the assignment algorithm.7 We compute the assignment
propensity score using an analytic large-market approximation derived by Abdulkadiroğlu et al.
(2017).8 Our data include the random tie-breaker, so we code preschool offers based on whether a
7We compute the probability of assignment to any preschool by summing the propensity score associated withan offer at each ranked preschool program. This method allows us to isolate all randomly generated offers from theassignment mechanism and extract a greater number of applicants subject to random assignment than approachesthat only consider first choices (c.f., Abdulkadiroğlu et al., 2011; Weiland et al., 2019).
8Abdulkadiroğlu et al. (2017) derive the propensity score for the deferred acceptance (DA) algorithm. Appendix
9

student’s random number fell below the relevant cutoff.9
We use preschool assignment as an instrument for preschool enrollment, controlling for the
assignment propensity score. The primary estimating equations for our analysis are:
Yi = βDi +∑
p
αp1{Pi = p}+X ′iγ + εi, (1)
Di = πZi +∑
p
δp1{Pi = p}+X ′iλ+ ηi, (2)
where Yi is an outcome for student i, Di indicates BPS preschool attendance, and Zi indicates
an offer to any BPS preschool program. Both equations include a saturated set of indicators
for values of the propensity score Pi, which measures the probability of an offer to any Boston
preschool (computed by summing the propensity scores for each individual program). We refer to
the propensity score indicators as “risk” controls. Baseline covariates Xi include race, sex, and
bilingual Spanish indicators. The parameter of interest is β, which represents the causal effect of
public preschool attendance.
We estimate equations (1) and (2) by two-stage least squares (2SLS) in the sample of randomized
applicants (those with values of Pi strictly between zero and one). The first stage fits equation
(2) by ordinary least squares (OLS) and constructs predicted values D̂i. The second stage fits
equation (1) by OLS after substituting D̂i for Di. The resulting estimate of β is interpretable as
a weighted average of local average treatment effects (LATEs) for “compliers” induced to attend
BPS preschools by random offers (Imbens and Angrist, 1994; Angrist et al., 1996).
Kline and Walters (2016) show that the LATE associated with public preschool attendance
captures a treatment effect relative to a mix of counterfactual alternatives for compliers, which
may include other preschools. While we do not observe data on alternative programs, Weiland
et al. (2019) report that a large share of students lotteried out of Boston preschools in more recent
years attend other center-based preschool programs (most commonly private preschools), so the
counterfactual for our estimates likely includes other preschools as well. As Kline and Walters
A.10 of their paper shows that it is possible to construct the propensity score for the immediate acceptance algorithmby redefining priorities so that priority groups at a given school consist of applicants who share original priority statusat the school and rank it the same way, then applying the formula for the DA propensity score.
9Appendix Table A2 shows that this coding replicates 94% of observed assignments. In 1997-1999, BPS used racialre-balancing to modify a small number of assignments after running the assignment algorithm, a practice that aimedto reduce segregation in Boston (Willie and Alves, 1996). These post-assignment moves drive the lower replicationrates in 1997-1999, but do not contaminate our research design since our coding disregards rebalanced offers. Anydifferences between our coding of offers and final student assignments can be interpreted as non-compliance with theassignment algorithm.
10

(2016) note, the LATE represents the policy-relevant parameter for evaluating expansions of BPS
preschool regardless of the mix of counterfactuals when alternative programs are not rationed. Our
estimates therefore speak directly to policy debates regarding the expansion of public preschool in
Boston and elsewhere.
3.2 Balance and Attrition
Before presenting our main estimates, we turn to two tests of the validity of our research design.
Table 1 checks whether predetermined characteristics are balanced between offered and non-offered
students, as would be expected under random assignment. Column (3) reports coefficients from
OLS regressions of student characteristics on an offer indicator, controlling for cohort indicators but
not adjusting for assignment risk. These contrasts show significant imbalances by Hispanic status,
bilingual Spanish, and application and neighborhood characteristics, likely because students from
different demographic groups and neighborhoods apply to different programs. Column (4) restricts
the sample to randomized applicants and adds a saturated set of propensity score controls. Risk
controls eliminate all of the statistically significant imbalances from column (3), illustrating the
balancing properties of the assignment propensity score. By chance we find that females are more
likely to receive offers conditional on risk. We account for this imbalance by controlling for a female
indicator when estimating preschool effects.
Next, we investigate followup rates for our key outcomes. Even with random assignment of
preschool slots, non-random attrition may compromise the comparability of lottery winners and
losers, possibly generating selection bias. This has been a major concern in studies of preschool
programs, where long time intervals between interventions and outcomes create the potential for
substantial attrition (see, e.g., Armor, 2014; Elango et al., 2016). This possibility motivated us to
conduct a custom search of NSC records for all preschool applicants based on the names and dates
of birth provided by BPS.
Column (1) of Table 2 shows that information for roughly 99% of control group (non-offered)
applicants was submitted to the NSC. This establishes that overall attrition for post-secondary
outcomes in our study is very low. As shown in column (2) of Table 2, applicants who were offered
a preschool seat were 0.8% more likely to be submitted to the NSC. This reflects a slight imbalance
in the availability of names and dates of birth in the (post-treatment) data file we received from
BPS, likely because missing information was updated for a few applicants who enrolled in preschool.
With 4,215 randomized applicants and an offer rate of about one-third, the 0.8% gap corresponds
11

to 11 extra offered students. Our impact estimates for post-secondary outcomes are unlikely to be
affected by this small difference in follow-up.
To measure earlier outcomes in Massachusetts public schools, we link preschool applicants based
on name and date of birth to records from the state’s administrative database, known as the Student
Information Management System (SIMS). About 91% of non-offered applicants are observed in the
SIMS file, and applicants who receive offers are 2.8% more likely to be observed. This difference
may reflect a causal impact of BPS preschool on the likelihood of attending a Massachusetts public
school, perhaps because public preschool enrollment increases attachment to the public education
system. Similarly, we are 3.8 percentage points more likely to observe a follow-up test score for
students assigned to preschool, and we see an average of 0.5 more scores for the treatment group
(out of a total of up to 14 math and reading scores in grades 3-8 and 10). As a result of these
modest but significant differences in attrition, results for test score and behavioral outcomes derived
from the Massachusetts administrative data should be interpreted with more caution than results
for our primary post-secondary outcomes.
4 Effects on Post-Secondary Outcomes
Boston preschool attendance increases on-time college enrollment. We arrive at this result in Table
3, which reports 2SLS estimates of equations (1) and (2) for post-secondary outcomes. Column
(2) reports estimates of the first-stage coefficient π, which show that a preschool offer increases
the probability of preschool attendance by 65 percentage points. Column (3) displays the reduced
form effect of an offer on the outcome, estimated by replacing Di with Yi on the left-hand side
of equation (2). A preschool offer increases on-time college enrollment by 5.4 percentage points.
Since the 2SLS model is just-identified, the 2SLS estimate in column (4) equals the ratio of the
reduced form to the first stage, which reveals that enrollment at a Boston preschool increases on-
time college enrollment by 8.3 percentage points. This estimate, which is statistically significant
at the 1% level, implies an 18% increase in on-time college enrollment relative to the 46% rate for
non-offered students (column (1)).
The bulk of this increase in college-going is driven by attendance at four-year and Massachusetts
colleges. The second and third rows of column (4) in Table 3 suggest that preschool enrollment
increases on-time enrollment in both two-year and four-year colleges, but the four-year estimate
is larger (5.5 vs. 2.8 percentage points) and the two-year estimate is statistically insignificant.
12

Preschool enrollment increases the likelihood of on-time enrollment at a Massachusetts college by
8.5 percentage points (p < 0.01).10 We find positive estimates for both public and private colleges,
though only the private estimate is statistically significant for on-time enrollment.
The positive on-time enrollment effects of Boston preschools translate into positive effects on
ever attending college. Columns (5)-(8) of Table 3 display results for post-secondary outcomes
measured at any time (the “ever” outcome concept). The non-offered college attendance rate
increases from 46% to 65% when we drop the on-time restriction, implying that many students
enroll late. The 2SLS estimates show a slight convergence between treatment and control groups
when we include late enrollment: the estimated effect on ever enrolling at any college equals
5.4 percentage points, which is marginally statistically significant (p < 0.1). We continue to see
large estimated impacts on four-year enrollment (5.9 percentage points, p < 0.1) and enrollment
at Massachusetts institutions (7.1 percentage points, p < 0.05). Estimates for both public and
private institutions are positive, but the effect for public institutions is larger when we include late
enrollment (5.1 percentage points, p < 0.1). Adding up the number of semesters enrolled across
all institution types, we find that BPS preschool attendance increases postsecondary enrollment by
0.6 semesters, an 11% gain relative to the control mean of 5.6 semesters (p < 0.1).
The bottom rows of Table 3 display estimates for college graduation. Since we do not observe
graduation outcomes for two out of seven applicant cohorts, the sample size for these outcomes falls
by roughly 20%, and we have less statistical precision to detect effects. The estimated impact on
ever graduating from any college in column (8) suggests that Boston preschool enrollment increases
graduation by 5.2 percentage points. This is a quantitatively large estimate equal to 15% of the
control graduation rate of 33%. Due to a lack of precision, however, we cannot rule out that this
finding is due to chance.
Our results for postsecondary outcomes are robust to several reasonable changes in estimation
strategy. The chance imbalance by sex shown in Table 1 motivates a sensitivity analysis that
drops the control for female from equations (1) and (2). Appendix Table A3 shows that dropping
this control leads to slightly larger estimates than those in Table 3 but does not change the key
results. Similarly, Appendix Table A4 shows that our results are robust to dropping the 1997
applicant cohort, which attended BPS preschool prior to the restructuring discussed in Section
2.1. Finally, Appendix Table A5 reports an analysis that replaces the offer indicator Zi with
10The most common colleges attended by BPS preschool students in our sample are Bunker Hill Community Col-lege, the University of Massachusetts campuses at Amherst, Boston, and Dartmouth, Newbury College, FraminghamState, Cambridge College, Ben Franklin Institute of Technology, and the Urban College of Boston.
13

the randomly assigned tie-breaking number as the instrument in equation (2). Using the random
number itself as the instrument reduces statistical power since this simpler strategy does not fully
exploit the structure of the assignment mechanism, but the pattern of estimates and statistical
significance is similar to our baseline results in Table 3. Estimates for college graduation are
marginally statistically significant in specifications without the female control and using the random
number as instrument.
Taken together, our results reveal a clear pattern of positive impacts of preschool attendance on
post-secondary educational outcomes for students in Boston. These findings are noteworthy in light
of large gaps in graduation rates and time to degree by race and income (Bowen and Bok, 2000).
Our results show that BPS preschool boosts post-secondary education for a population with high
shares of minority and low-income children: 72% are Black or Hispanic, and more than two-thirds
are eligible for a free or reduced price lunch (a proxy for low family income).11 We next turn to an
analysis of outcomes prior to college to investigate the channels driving these results.
5 Effects on College Preparation
5.1 Grade Progression, Special Education, and High School Graduation
Studies of preschool often consider outcomes related to grade retention and special education status
(Gramlich, 1986; Currie and Thomas, 1995; Currie, 2001; Magnuson et al., 2004; Deming, 2009;
Miller and Bassok, 2017). Preschool may ease the transition to elementary school and reduce the
need for remediation and special education services (Bailey et al., 2017). Currie (2001) emphasizes
that prevention of special education and avoidance of grade retention is a potential cost savings
created by preschool programs. Furthermore, special education classification and grade progression
outcomes may contain information on skills and behaviors that are not captured by test scores.
We find no detectable impacts of BPS preschool on grade repetition and special education
outcomes. The first row of Table 4 displays a 2SLS estimate of the effect of BPS preschool on
starting 1st grade on time. The sample for this outcome is limited to those who are observed
in 1st grade in a Massachusetts public school at some point. Eighty-seven percent of non-offered
students start 1st grade on time, and the estimated effect of BPS preschool is small and statistically
insignificant. Similarly, we find no effect on the probability of appearing in a BPS school in 6th or
11The fraction of students eligible for a subsidized lunch is calculated based on free or reduced price lunch statusin the first year a student appears in the SIMS database using students who appear in the SIMS data in at least oneyear.
14

9th grade, and a small negative but statistically insignificant effect on repeating a grade (defined as
appearing in the same grade in more than one year). The samples for these outcomes are restricted
to students who appear in a Massachusetts public school in at least one year. The bottom rows of
Panel A in Table 4 show small and insignificant estimates of effects on special education classification
in 1st and 3rd grades for students observed in these grades.
In contrast, Panel B of Table 4 reveals that preschool attendance boosts high school gradu-
ation. Enrollment in a BPS preschool increases the probability that students graduate from a
Massachusetts public high school on time by 5.4 percentage points (p < 0.1), and this effect grows
to 6.0 percentage points when we include students who graduate at any time (p < 0.05). The esti-
mated effect on ever graduating high school is a 9% increase relative to the non-offered graduation
rate of 64%. Combined with the insignificant effects on grade repetition in Panel A, the high school
graduation results suggest that BPS preschool increases the likelihood that students successfully
complete high school rather than causing them to enroll in high school earlier. It’s worth empha-
sizing, however, that these estimates are based on students who appear in the Massachusetts public
school database at some point, so the results should be interpreted with some caution given the
differential attrition documented in Table 2.
5.2 SAT Test-taking and Scores
The SAT is an important assessment for college-bound high school students since it is widely used for
college admissions. Students usually take the SAT in 11th or 12th grade after taking standardized
tests in Massachusetts required for high school graduation. The SAT outcome is also of particular
interest for the low-income population studied here, since the SAT is seen as a significant hurdle
for students who may not have access to test preparation (see, e.g., Bowen and Bok, 2000).
Enrollment in a BPS preschool raises the likelihood that students take the SAT. Column (1)
of Table 5 shows that among non-offered BPS preschool applicants who attend a Massachusetts
public high school, roughly two-thirds take the SAT. Preschool attendance causes a statistically
significant 8.5 percentage point increase in the rate of SAT test-taking. The size of this impact is
similar to the estimated effect of preschool attendance on on-time college enrollment, suggesting
that taking the SAT may play a role in accounting for our results on increased college attendance.
Since preschool attendance affects SAT test-taking, we examine how preschool influences SAT
performance defined by unconditional score thresholds. A student scores above a given quartile
in the state distribution if she both takes the SAT and scores above the threshold defined by the
15

state quartile. Students who do not take the test and those who take the test but fail to reach the
relevant threshold are coded as zeros for these outcomes. Column (3) of Table 5 shows that by this
definition, less than one-quarter of preschool applicants score above the state median on the SAT
Reasoning test (defined as the sum of Math and Verbal scores). Likewise, column (5) shows that
less than a quarter score above the state median on the SAT Composite test (defined as the sum
of Math, Verbal, and Writing).
Preschool attendance affects the bottom and top quartiles of performance on the SAT. Column
(4) of Table 5 shows that preschool attendance marginally increases the likelihood that a student
scores above the bottom quartile on SAT Reasoning. Since the outcome is coded as zero for non-
takers, this effect combines the extensive-margin impact on SAT-taking and any intensive-margin
impacts on scores. The effect on scores in the bottom quartile is driven by a 5-7 percentage point
improvement in the likelihood of clearing the bottom quartile in each component subject test, with
the estimates for Math and Verbal significant at the 10% level.
Only about 10% of non-offered preschool applicants score in the top quartile of SAT scores in
Massachusetts. The top quartile of the state distribution corresponds to an SAT Reasoning score
of roughly 1,200 or higher, a range which is often seen as relevant for the top 100 most selective
colleges.12 BPS preschool generates a large positive effect on this part of the score distribution.
Specifically, preschool attendance boosts the likelihood of an SAT Reasoning score in the top
quartile by 3.6 percentage points. This effect is driven by a substantial increase in top-quartile
Math scores. As shown in the column (2) of the bottom panel in Table 5, preschool enrollment
causes a 5.7 percentage point gain in the probability of scoring in the top quartile of the state SAT
Math distribution (p < 0.01), an effect which corresponds to a 60% increase from the non-offered
mean of 9.7%.
The bottom row of Table 5 also reports 2SLS estimates of impacts on average SAT scores in the
sample of test-takers. These conditional results are difficult to interpret since preschool offers have
a direct impact on the likelihood of taking the test. Estimated effects on average SAT scores are
imprecise and statistically indistinguishable from zero, but these estimates may be contaminated
by composition effects due to the large impact of preschool attendance on SAT test-taking.
12SAT percentiles for test-takers in the US appear in College Board (2020).
16

6 Effects on Test Scores and Disciplinary Outcomes
6.1 MCAS Scores
Previous studies of Boston preschools show that for recent applicant cohorts, the program increased
test scores measured during the preschool year, but test score impacts were not detectable by third
grade (Weiland and Yoshikawa, 2013; Weiland et al., 2019). We do not observe test scores in the
preschool year for our applicant sample, but we can study effects on medium-term test scores on the
Massachusetts Comprehensive Assessment System (MCAS). Massachusetts started administering
MCAS exams in 1998 with tests in grade 4 and 8. The state subsequently expanded tests to other
grades, and tests are now administered in grades 3-8 and 10. MCAS performance is consequential
for schools, since it factors into the state’s accountability framework. A student must also pass
MCAS Math and English Language Arts (ELA) tests to earn a high school diploma.
Table 6 reports estimated effects of preschool attendance on MCAS test scores. We standardize
these scores to have mean zero and standard deviation one in the sample of all Massachusetts test-
takers in each grade and year. Among non-offered BPS preschool applicants, mean scores on Math
and ELA tests in elementary school are around −0.3σ to −0.4σ, implying achievement substantially
below the state average. As shown in columns (2) and (4), we find that preschool attendance
has no statistically detectable impact on these achievement levels. This result is consistent with
Weiland et al. (2019) who report that attendance at a first-choice BPS preschool did not affect
third-grade MCAS performance for cohorts applying between 2007 and 2011. More broadly, our
findings echo those in other recent randomized studies of preschool programs, which often find
limited achievement impacts in elementary school (Puma et al., 2010; Lipsey et al., 2018).
Our data offer the opportunity to study achievement impacts in middle and high school as well.
As in elementary school, we find no evidence of impacts on MCAS scores in later grades. Table 6
shows a mix of positive and negative estimates for grades 6, 7, 8, and 10. None of the estimates
are significantly different from zero. The bottom row shows 2SLS estimates from a model that
stacks all observed MCAS scores in grades 3-8 and 10, with standard errors clustered by student.
Estimates from this model are also statistically insignificant, and the precision of the estimates
allows us to rule out positive impacts larger than 0.14σ in Math and 0.12σ in ELA. Although we
observe at least one MCAS score for roughly 85% of the sample and an average of nine test scores
per non-offered applicant, an important caution is that the MCAS follow-up differential shown in
Table 2 may influence our estimates of test score effects.
17

6.2 Disciplinary Outcomes
While the results of the previous section suggest that BPS preschool has limited effects on test
scores, previous studies suggest that preschool programs can generate persistent impacts through
non-cognitive channels. For example, Heckman et al. (2010b) emphasizes the role of criminal justice
outcomes in the high social rate of return to the Perry Preschool program. Heckman et al. (2013)
demonstrate that the Perry intervention substantially improved externalizing behaviors (aggressive,
antisocial, and rule-breaking behaviors), and that these effects account for the bulk of its long-term
impacts. A related literature shows impacts of teachers and schools on non-test outcomes such as
suspensions, truancy, absenteeism, course grades, and crime (Deming, 2011; Jackson, 2018; Petek
and Pope, 2021). Bacher-Hicks et al. (2019) and Rose et al. (2019) argue that short-term effects of
teachers and schools on non-cognitive outcomes predict longer-term effects on criminal behavior.
Motivated by these findings, Table 7 displays 2SLS estimates of the effects of preschool atten-
dance on several disciplinary outcomes measured in high school. Preschool attendance reduces the
total number of suspensions students receive in high school by 0.24 (p < 0.1). Estimates for the
number of times a student is truant and the number of days a student is absent are also negative,
though estimates for these outcomes are less precise. We measure juvenile incarceration based on
whether a student is ever observed attending a Massachusetts Department of Youth Services (DYS)
school. DYS operates the state’s juvenile justice service and DYS facilities provide rehabilitation
for students who have committed crimes. Only 0.7% of non-offered preschool applicants are ever in-
carcerated according to this definition.13 Incarceration is a conservative measure of interaction with
the criminal justice system, since a student must be arrested before they are incarcerated. Preschool
enrollment is estimated to reduce juvenile incarceration by 0.8 percentage points (p < 0.1).14
Most of the estimates in Table 7 suggest that BPS preschool improves disciplinary outcomes,
but several are statistically insignificant due to a lack of precision. To aggregate information across
outcomes, we estimate impacts on a summary index of discipline. Following Jackson (2018), the
disciplinary index equals the first principal component of all outcomes in the table, standardized
to have mean zero and standard deviation one among non-offered students. When constructing the
index, outcomes are coded so that a positive estimate reflects a decrease in discipline, which can
be interpreted as an improvement in student behavior. We find that preschool attendance boosts
13This measure seems to be a reliable measure of incarceration, as we never observe a student simultaneouslyenrolled in a traditional public school and a DYS facility.
14The estimated incarceration effect is larger than the non-offered mean but smaller than the the complier controlmean, which equals 0.8%.
18

this index by 0.17σ, a large and statistically significant impact (p < 0.01).
7 Further Results and Discussion
7.1 Effects on Subgroups
The literature on early childhood programs often finds important differences in treatment effects
across student subgroups. In a reanalysis of the Abecedarian, Perry, and Early Training Projects,
Anderson (2008) finds significant short- and long-term benefits for girls but no significant long-
term effects for boys after adjusting for multiple testing. Heckman et al. (2010a) account for
compromised randomization in the Perry experiment and find that Perry generated significant
long-term benefits for both sexes. Research on Head Start has emphasized differences in effects
between Black and white students (Currie and Thomas, 1995; Garces et al., 2002; Deming, 2009).
Gormley and Gayer (2005) show that Tulsa’s public preschool program produces larger gains for
middle-income students than for low-income students. Cascio (forthcoming) finds larger test score
impacts for universal state-funded preschool programs than for means-tested programs, including
larger effects on low-income students.
Table 8 reports 2SLS estimates of the effects of BPS preschool attendance on key outcomes
for student subgroups. We probe for effect heterogeneity by sex, race, and income. Since large
differences in point estimates are likely to arise by chance with small subgroup samples, we also
report p-values from tests of the hypothesis that effects are equal for each sample split.
The effects of BPS preschool attendance are generally larger for boys than for girls. As shown
in columns (1) and (2) of Table 8, preschool enrollment is estimated to increase on-time college
enrollment for both sexes, but effects on four-year college enrollment are driven by boys. In addition,
we find a positive effect of 13 percentage points for graduation at any time for boys, while the
corresponding estimate for girls is negative and statistically insignificant. Gender differences in
estimates for ever enrolling in a four-year college and ever graduating from college are significant
at conventional levels (p ≈ 0.05). Similarly, for boys we find significant increases in SAT-taking
(16 percentage points), high school graduation (16 percentage points), and the discipline index
(0.33σ), with small and insignificant corresponding estimates for girls, and statistically significant
differences by sex for each of these outcomes (p < 0.07).
Differences in estimates by race and income are generally statistically insignificant. Columns
(3), (4), and (5) of Table 8 present estimates for Black, Hispanic, and white students. The pattern
19

of point estimates suggests somewhat larger impacts for whites, but the white subgroup is small
and none of the racial differences in estimates are statistically significant at conventional levels
(p > 0.11). To assess heterogeneity by income, columns (6) and (7) show estimates for students
eligible and ineligible for a free or reduced price lunch, a proxy for low family income. Students
are included in this analysis if they appear in the SIMS database, and are classified as eligible
for a subsidized lunch if they are recorded as receiving a free or reduced price lunch in their first
year in the SIMS. Estimates for low- and higher-income students are generally not statistically
distinguishable. We do see marginally significant differences for four-year college enrollment and
MCAS scores (p = 0.08), but these may be chance findings given the many splits examined.
7.2 Comparison to Estimates in the Literature
Previous estimates of the effects of preschool programs on educational attainment come from small-
scale experiments and non-experimental studies of the Head Start program for earlier cohorts. To
understand whether the effects of large-scale preschool in Boston differ from effects for these earlier
programs, we compare our results to estimates from prominent studies in the literature. Table 9
lists study characteristics and estimated educational attainment effects for our evaluation of the
Boston preschool program along with several previous studies evaluating other programs including
the Perry Preschool Project, Abecedarian Project, and Head Start.15
Three key patterns are evident in this comparison. First, as shown in columns (1)-(3), ours is
the only study that combines a randomized design, long-term outcomes, and a large-scale program.
The other studies listed in Table 9 each lack one of these characteristics. It is important to note,
however, that several of the other studies are able to look at other long-term outcomes such as
earnings and criminal activity, while we can only look at educational attainment. Second, the
standard errors in columns (4) and (5) show that the precision of our design compares favorably
to most previous studies. The precision of our post-secondary impact estimates is comparable to
estimates from Bailey et al. (2020)’s study of the initial rollout of Head Start using the Social
Security Administration Numident file (though our estimates for high school graduation are less
precise). Third, our impact estimates for educational attainment are consistent with estimates
from previous studies. Though the studies in Table 9 estimate a variety of parameters for multiple
15Some subsequent analyses building on the studies in Table 9 arrive at different estimates for the same programsdue to changes in sample or methodology (see, e.g., Heckman et al., 2010a; Miller et al., 2019; Pages et al., 2020).We include studies in Table 9 to provide one set of benchmark estimates against which our estimates for Bostonpreschool can be compared.
20

programs using a mix of randomized and non-randomized research designs, the estimated effects
on high school graduation and college enrollment are surprisingly similar.
The bottom rows of Table 9 formally investigate the similarity of effect sizes across studies.
Specifically, we use classical minimum distance (CMD) to fit a model that assumes the effect in
each study is the same, treating each study as an independent unbiased estimate of this single effect
with variance equal to its squared standard error. Under the null hypothesis of no heterogeneity in
effects across studies, the minimized CMD criterion function follows a χ2 distribution with degrees
of freedom equal to the number of studies minus one. This CMD procedure generates precise
average effect estimates of 3.8 percentage points for high school graduation (s.e. = 0.7) and 6.5
percentage points for college attendance (s.e. = 1.2). The χ2 goodness of fit test fails to reject
for either outcome (p > 0.23), indicating that the differences in estimates across studies can be
rationalized by sampling error. This exercise reveals a consistent picture of positive preschool
effects on educational attainment across a diverse set of studies. Our results show that this pattern
continues to hold in a randomized evaluation of a large-scale public preschool program.
8 Conclusion
High-quality preschool programs have the potential to produce lasting impacts on skills and improve
long-term outcomes for disadvantaged students (Elango et al., 2016). While public preschool has
expanded rapidly in recent decades, little evidence exists on the long-term impacts of modern
large-scale preschool programs. Such evidence is important both for understanding the efficacy
of programs operating at scale and for interpreting links between short- and long-outcomes. This
paper uses random variation from Boston’s centralized school assignment mechanism to provide
the first evidence on the long-term effects of a modern, large-scale public preschool program from
a lottery-based research design.
The results of our analysis show that public preschool enrollment boosts post-secondary and
college preparatory outcomes. Students randomly assigned to attend a Boston preschool experience
fewer disciplinary incidents in high school, take the SAT and graduate high school at higher rates,
and are more likely to enroll in college. These findings illustrate the potential for a universal
preschool program to improve educational attainment for a disadvantaged student population.
Boston’s public preschool program expanded rapidly after the time period of our study, and
the program also scores highly on ratings of preschool quality (NIEER, 2019a). It’s therefore
21
possible that the effects reported here differ from effects for more recent cohorts in Boston or for
lower-quality programs elsewhere. At the same time, Boston’s program shares important features
with other publicly-funded state and local preschool programs, so our estimates seem relevant
for evaluating contemporary proposals for public preschool expansion (Biden, 2021). While we
are able to document effects on educational attainment, other work has shown impacts of early-
childhood programs on even longer-term outcomes such as employment, earnings, and criminal
activity (Garcia et al., 2020). In future work, we hope to study impacts on these and other
economic outcomes over the lifecycle.
22

Figure 1: Boston preschool students and schools by year (four-year-olds)
Notes: This figure plots the number of four-year-old students enrolled in Boston public preschools (top panel) and the number of schools offering preschool for four-year-olds (bottom panel) by year.
0
500
1000
1500
2000
2500
3000
1997 1998 1999 2000 2001 2002 2003 2004 2005 2006 2007 2008 2009 2010 2011
Stud
ents
Number of Students
0
10
20
30
40
50
60
70
80
1997 1998 1999 2000 2001 2002 2003 2004 2005 2006 2007 2008 2009 2010 2011
Scho
ols
Number of Schools

All Randomized No Riskapplicants applicants controls controls
(1) (2) (3) (4)
Black 0.432 0.407 -0.011 -0.015(0.011) (0.017)
White 0.166 0.149 -0.012 -0.023*(0.008) (0.012)
Hispanic 0.291 0.344 0.036*** 0.020(0.011) (0.015)
Female 0.495 0.488 0.011 0.060***(0.011) (0.020)
Age at enrollment 4.569 4.580 -0.025 -0.031(0.017) (0.031)
Bilingual Spanish 0.108 0.187 0.044*** 0.004(0.008) (0.005)
3.055 2.949 -0.098*** 0.041(0.028) (0.038)
First choice walkzone 0.215 0.176 0.154*** -0.005(0.010) (0.005)
Population 1255.2 1252.7 -56.747*** -8.681(12.067) (21.408)
Median family income 53731.9 54039.2 1339.143* 1605.203(765.277) (1230.354)
Poverty rate 0.234 0.232 0.004 -0.011(0.004) (0.007)
Share Black 0.388 0.399 0.027*** -0.012(0.007) (0.010)
Share white 0.366 0.357 -0.030*** 0.014(0.007) (0.009)
Share Hispanic 0.251 0.260 -0.014*** -0.002(0.004) (0.006)
Sample size 8786 4215 8786 4215
*significant at 10%; ** significant at 5%; ***significant at 1%.
Notes: This table displays average characteristics and differences in characteristics by offer status for applicants to BPS K1 programs from 1997-2003. Panel A shows results for applicant demographics, panel B reports on application characteristics, and panel C shows results for characteristics of an applicant's block group measued in the 2010 US Census. Column (1) shows characteristics for all applicants, and column (2) shows characteristics for applicants subject to random assignment (those with assignment propensity scores strictly between zero and one). Column (3) reports coefficients from regressions of each characteristic on an offer indicator, controlling for year indicators. Column (4) adds controls for assignment risk and restricts the sample to applicants subject to random assignment. Robust standard errors in parentheses.
Number of programs ranked
Table 1: Descriptive statistics and covariate balance
A. Applicant demographics
C. Neighborhood characteristics
Offer differentialsAverage characteristics
B. Application characteristics

Non-offered Offerfollowup rate differential
(1) (2)Name submitted to NSC 0.987 0.008**
(0.003)4215
Ever observed in SIMS 0.910 0.028***(0.010)4215
Any MCAS score 0.845 0.038***(0.013)4215
Number of MCAS scores 9.052 0.520***(0.184)4215
*significant at 10%; ** significant at 5%; ***significant at 1%.
Table 2: Attrition
Notes: This table reports followup rates and offered/non-offered differences for key outcomes. The sample includes all randomized BPS preschool applicants. Column (1) displays the fraction of non-offered applicants observed in each sample. Column (2) reports coefficients from regressions of followup on an offer indicator with controls for assignment risk.

Non-offered First Reduced 2SLS Non-offered First Reduced 2SLSmean stage form estimate mean stage form estimate(1) (2) (3) (4) (5) (6) (7) (8)
Any college 0.459 0.645*** 0.054*** 0.083*** 0.650 0.645*** 0.035* 0.054*(0.015) (0.019) (0.030) (0.015) (0.019) (0.029)
2669 4175 2669 4175
Two-year college 0.096 0.018 0.028 0.291 0.019 0.030(0.012) (0.019) (0.018) (0.028)
2669 4175 2669 4175
Four-year college 0.363 0.035* 0.055* 0.506 0.038* 0.059*(0.019) (0.029) (0.020) (0.030)
2669 4175 2669 4175Massachusetts college 0.329 0.055*** 0.085*** 0.504 0.045** 0.071**
(0.019) (0.029) (0.020) (0.030)2669 4175 2669 4175
Public college 0.260 0.025 0.038 0.474 0.033* 0.051*(0.018) (0.027) (0.020) (0.031)
2669 4175 2669 4175
Private college 0.200 0.029* 0.045* 0.316 0.015 0.024(0.016) (0.025) (0.018) (0.028)
2669 4175 2669 4175
Number of semesters 5.567 0.396* 0.614*(0.220) (0.340)
2669 4175
Graduation 0.208 0.621*** 0.003 0.005 0.325 0.621*** 0.033 0.052(0.017) (0.018) (0.029) (0.017) (0.021) (0.034)
2108 3281 2108 3281Graduation from four-year 0.207 0.005 0.008 0.297 0.022 0.035
(0.018) (0.029) (0.020) (0.033)2108 3281 2108 3281
*significant at 10%; ** significant at 5%; ***significant at 1%.
Table 3: Effects of preschool attendance on post-secondary outcomes
Notes: This table reports two-stage least squares (2SLS) estimates of the effects of Boston preschool attendance on post-secondary outcomes. Outcomes in columns (1)-(4) measure college enrollment within 6 months of a student's projected high school graduation date given his/her BPS preschool application year. Columns (5)-(8) display results based on college attendance at any time. On-time graduation equals one if a student graduates from a four-year college by the end of the fourth calendar year after projected high school graduation or a two-year college by the end of the second calendar year after projected high school graduation. The sample for graduation excludes students who applied to preschool in 2002 or 2003, who would not finish a four-year college on-time given normal academic progress. Columns (1) and (5) show mean outcomes for non-offered students. Columns (2) and (6) display coefficients from regressions of preschool attendance on the preschool offer. Columns (3) and (7) show coefficients from regressions of outcomes on the offer. Columns (4) and (8) report 2SLS coefficients instrumenting preschool attendance with the offer. All models control for a saturated set of indicators for the assignment propensity score along with sex, bilingual status, and race.
Enrollment on-time Enrollment at any time

Non-offered 2SLSmean estimate(1) (2)
Started 1st grade on time 0.874 0.016(0.023)
1529 2375
Enrolled in BPS in 6th grade 0.810 0.032(0.024)
2459 3883
Enrolled in BPS in 9th grade 0.806 0.031(0.025)
2459 3883
Repeated a grade 0.325 -0.036(0.029)
2459 3883Special education in 1st grade 0.090 0.009
(0.015)1529 2375
Special education in 3rd grade 0.144 0.002(0.015)
2459 3883
Graduated high school on time 0.624 0.054*(0.030)
2459 3883
Ever graduated high school 0.636 0.060**(0.030)
2459 3883
*significant at 10%; ** significant at 5%; ***significant at 1%.
Notes: This table reports two-stage least squares (2SLS) estimates of the effects of Boston preschool attendance on grade progression, special education classification, and high school graduation. The on-time first grade outcome equals one if a student appears in first grade by the expected year given his or her BPS preschool application year. The sample for this outcome is restricted to students observed in first grade in a Massachusetts public school. BPS enrollment outcomes equal one if a student is ever observed enrolled in a BPS school for the relevant grade. The grade repetition outcome equals one for students who are ever observed in the same grade in multiple years. Samples for BPS enrollment and grade repetition include students who are ever observed in a Massachusetts public school. Samples for 1st and 3rd-grade special education include students observed in the relevant grade. On-time high school graduation equals one if a student is recorded as graduating from a Massachusetts public high school by the end of his/her projected 12th grade year. Samples for the graduation outcomes include students who are ever observed in a Massachusetts public school. Column (1) displays the non-offered mean for each outcome. Column (2) reports 2SLS coefficients from models instrumenting preschool attendance with the preschool offer. All models control for the risk of an offer along with sex, bilingual status, and race.
Table 4: Effects of preschool attendance on grade progression, special education, and high school graduation
B. High school graduation

Non-offered 2SLS Non-offered 2SLS Non-offered 2SLSmean estimate mean estimate mean estimate
(1) (2) (3) (4) (5) (6)Took SAT 0.685 0.085**
(0.034)
Score above MA bottom quartile 0.384 0.062* 0.376 0.057(0.036) (0.035)
Score above MA median 0.225 0.008 0.216 -0.001(0.030) (0.029)
Score in MA top quartile 0.096 0.036* 0.0920 0.031(0.021) (0.021)
N 2559
Average score 940.6 3.9 1392.0 7.2(Ffor takers) (16.6) (24.2)
N 1863
Non-offered 2SLS Non-offered 2SLS Non-offered 2SLSmean estimate mean estimate mean estimate
(1) (2) (3) (4) (5) (6)Score above MA bottom quartile 0.419 0.070* 0.366 0.063* 0.379 0.050
(0.037) (0.036) (0.036)
Score above MA median 0.241 0.002 0.202 0.007 0.205 0.057*(0.030) (0.029) (0.030)
Score in MA top quartile 0.0968 0.057*** 0.103 0.002 0.0865 0.004(0.021) (0.022) (0.020)
N 2559
Average score 482.5 -0.6 458.1 4.5 451.4 3.3(for takers) (8.8) (9.1) (8.7)
N 1863
*significant at 10%; ** significant at 5%; ***significant at 1%.
Notes: This table reports two-stage least squares (2SLS) estimates of the effects of Boston preschool attendance on SAT test-taking and scores. The sample is restricted to students with a 10th-grade MCAS score. Outcomes for scoring above the bottom quartile, above the median, and in the top quartile are coded to zero for students who did not take the SAT. Column (1) displays mean outcomes for non-offered students, and column (2) displays 2SLS estimates instrumenting BPS preschool attendance with the preschool offer. All models control for the risk of an offer along with sex, bilingual status, and race.
Taking Reasoning (1600) Composite (2400)Table 5: Effects of preschool attendance on SAT test-taking and scores
Math (800) Verbal (800) Writing (800)

Non-offered Non-offeredmean 2SLS mean 2SLS(1) (2) (3) (4)
Grade 3 -0.424 -0.048 -0.400 0.024(0.068) (0.094)
2025 3241 677 1092
Grade 4 -0.340 -0.025 -0.302 -0.063(0.067) (0.066)
2020 3219 2022 3226
Grade 5 -0.366 0.071 -0.276 0.022(0.080) (0.076)
1316 2056 1319 2059Grade 6 -0.311 0.027 -0.221 -0.023
(0.072) (0.067)1690 2625 1948 3113
Grade 7 -0.203 0.049 -0.180 -0.003(0.064) (0.064)
1948 3109 1950 3114
Grade 8 -0.194 -0.009 -0.157 0.024(0.065) (0.063)
1936 3087 1939 3093
Grade 10 -0.158 0.066 -0.096 -0.031(0.062) (0.064)
1801 2852 1785 2847
Average Score -0.279 -0.012 -0.228 -0.034(0.055) (0.056)
2279 3615 2247 3569
All grades (stacked) -0.283 0.029 -0.215 0.005(0.056) (0.057)
2279 3615 2249 3569
*significant at 10%; ** significant at 5%; ***significant at 1%.
Notes: This table reports two-stage least squares (2SLS) estimates of the effects of Boston preschool attendance on Massachusetts Comprehensive Assessment System (MCAS) achievement test scores. MCAS scores are standardized to have mean zero and standard deviation one among all Massachusetts test-takers. The bottom row stacks all observed test scores in grades 3-8 and 10, and clusters standard errors by student. Columns (1) and (2) show results for math scores, while columns (3) and (4) show results for English Language Arts (ELA) scores. Columns (1) and (3) display mean outcomes for non-offered students. Columns (2) and (4) show 2SLS coefficients from models instrumenting preschool attendance with the preschool offer. All models control for the risk of an offer along with sex, bilingual status, and race.
ELA scoresMath scoresTable 6: Effects of preschool attendance on MCAS test scores

Non-offeredmean 2SLS(1) (2)
Ever suspended 0.166 -0.021(0.023)
2099 3335
Number of suspensions 0.166 -0.060*(0.035)
2099 3335
Ever truant 0.654 0.027(0.029)
2099 3335
Times truant 7.011 -1.102(0.889)
2099 3335
Days absent 16.55 -1.617(1.262)
2099 3335
Juvenile incarceration 0.007 -0.008*(0.005)
2099 3335
Disciplinary index 0.000 0.167***(0.063)
2099 3335
*significant at 10%; ** significant at 5%; ***significant at 1%.
Table 7: Effects of preschool attendance on disciplinary outcomes
Notes: This table reports two-stage least squares (2SLS) estimates of the effects of Boston preschool attendance on disciplinary outcomes measured in high school (grades 9-12). The sample is restricted to students to students observed in a Massachusetts public school in 9th grade. Juvenile incarceration equals one if a student is ever recorded as incarcerated or attending a Department of Youth Services institution. The non-cognitive index is the first principle component of all outcomes in the table, standardized to have mean zero and standard deviation one among non-offered students. Column (1) displays the non-offered mean for each outcome and column (2) reports coefficients from 2SLS models instrumenting preschool attendance with the preschool offer. All models control for the risk of an offer along with sex, bilingual status, and race.

Boys Girls Black Hispanic White FRPL Not FRPL(1) (2) (3) (4) (5) (6) (7)
Any college enrollment (on-time) 0.117** 0.076* 0.032 0.134*** 0.214** 0.068* 0.105**(0.046) (0.042) (0.047) (0.048) (0.100) (0.038) (0.058)2099 2076 1692 1405 643 2554 1329
Joint p -valueFour-year college enrollment (on-time) 0.087** 0.017 0.027 0.052 0.231** 0.029 0.119**
(0.044) (0.041) (0.045) (0.045) (0.100) (0.036) (0.059)2099 2076 1692 1405 643 2554 1329
Joint p -value
College graduation (on-time) 0.069 -0.049 0.014 -0.019 0.166 0.003 0.050(0.044) (0.043) (0.041) (0.041) (0.109) (0.035) (0.054)1657 1624 1340 1096 503 2029 995
Joint p -value
Any college enrollment (ever) 0.074 0.053 0.040 0.069 0.159* 0.033 0.100*(0.045) (0.039) (0.046) (0.048) (0.089) (0.037) (0.051)2099 2076 1692 1405 643 2554 1329
Joint p -valueFour-year college enrollment (ever) 0.126*** -0.006 0.059 0.041 0.211** 0.022 0.103*
(0.046) (0.042) (0.047) (0.049) (0.096) (0.038) (0.058)2099 2076 1692 1405 643 2554 1329
Joint p -valueCollege graduation (ever) 0.130** -0.011 0.089* 0.012 0.254** 0.053 0.135**
(0.052) (0.048) (0.049) (0.053) (0.111) (0.042) (0.057)1657 1624 1340 1096 503 2029 995
Joint p -value
MCAS math scores (stacked) 0.070* -0.064* 0.056 -0.131*** 0.194** -0.049 0.125**(0.041) (0.036) (0.038) (0.040) (0.088) (0.031) (0.051)1797 1760 1446 1194 539 2393 1164
Joint p -value
Took SAT 0.158*** 0.028 0.132** 0.068 0.028 0.098** 0.103*(0.055) (0.045) (0.052) (0.062) (0.094) (0.044) (0.056)1247 1260 1015 791 371 1680 828
Joint p -value
Ever graduated high school 0.163*** -0.035 0.066 0.009 0.161* 0.070* 0.087*(0.046) (0.040) (0.047) (0.049) (0.090) (0.037) (0.053)1899 1861 1526 1268 552 2480 1278
Joint p -value
Ever suspended -0.039 -0.022 -0.052 0.030 -0.090 -0.008 -0.051(0.037) (0.029) (0.041) (0.035) (0.062) (0.029) (0.039)1616 1597 1296 1067 460 2174 1051
Joint p -value
Ever incarcerated -0.017 -0.000 -0.013 -0.008 -0.010 -0.009(0.011) (0.000) (0.011) (0.005) (0.007) (0.006)1616 1597 1296 1067 2174 1051
Joint p -value
Disciplinary index 0.331*** 0.035 0.224** 0.118 0.090 0.234*** 0.075(0.108) (0.074) (0.109) (0.093) (0.169) (0.079) (0.103)1616 1597 1296 1067 460 2174 1051
Joint p -value
*significant at 10%; ** significant at 5%; ***significant at 1%.
0.174
0.426
0.471
0.265
0.084
0.220
0.854
0.369
0.792
0.936
By free/reduced price lunchBy sex By race
0.510
0.245
0.055
0.048
0.034
0.734
0.023
0.158
0.136
0.697
0.129
0.712
Notes: This table reports two-stage least squares (2SLS) estimates of the effects of Boston preschool attendance on key outcomes for subgroups. Columns (1) and (2) compare estimates for boys and girls, columns (3)-(5) display estimates by race, and columns (6) and (7) show estimates by free/reduced price lunch (FRPL) status. Students are included in the FRPL analysis if they appear in the SIMS database, and are classified as FRPL if they receive a subsidized lunch in their first year in the SIMS. Joint p -values come from tests of the null hypothesis that effects are equal across subgroups. Estimates are 2SLS coefficients instrumenting preschool attendance with the preschool offer. All models control for the risk of an offer along with sex and race. The estimated effect on juvenile incarceration for white students is omitted because very few white students in the data are incarcerated.
Table 8: Effects of preschool attendance for subgroups
0.002
0.069
0.226
0.182
0.137
0.372
0.079
0.436
0.475
0.175
0.540
0.112
0.119
0.257

Randomized Long-term Large-scaledesign outcomes program High school grad. College attendance
Study Program (1) (2) (3) (4) (5)This paper Boston preschool Yes Yes Yes 0.060 (0.030) 0.054 (0.029)
Belfield et al. (2006)a Perry Preschool Project Yes Yes No 0.165 (0.084) -
Campbell et al. (2012)b Abecedarian Project Yes Yes No 0.068 (0.072) 0.170 (0.068)
Garces et al. (2002)c Head Start No Yes Yes 0.037 (0.053) 0.092 (0.056)
Deming (2009)d Head Start No Yes Yes 0.086 (0.031) 0.057 (0.036)
Bailey et al. (2020)e Head Start No Yes Yes 0.024 (0.012) 0.054 (0.028)
Puma et al. (2010) Head Start Yes No Yes - -
Lipsey et al. (2018) TN-VPK Yes No Yes - -
0.038 (0.007) 0.065 (0.012)0.239 0.564
Impact estimates (standard errors)Table 9: Comparison of study characteristics and educational attainment estimates from preschool evaluations
Notes: This table compares study characteristics and educational attainment estimates from prominent evaluations of preschool programs. The top row shows estimates for the Boston preschool program studied in this paper, and the remaining rows display literature studies of other programs. Column (1) labels studies that use research designs with random assignment, column (2) labels studies that look at long-term outcomes, and column (3) labels studies that evaluate large-scale programs. For evaluations with long-term outcomes, column (4) shows each program's estimated impact on ever graduating high school and the corresponding standard error, while column (5) reports estimates and standard errors for the effect of attending college. Average effects and p -values come from a classical minimum distance (CMD) procedure that treats each estimate in a column as an independent estimate of the same effect. The average effect is the CMD estimate and the p -value comes from a comparison of the minimized CMD criterion function to a chi-squared distribution with degrees of freedom equal to the number of estimates minus one.aHigh school graduation estimate and standard error are derived from the age 40 counts and percentages in Table 1. College impact is not reported because few students attended college.
eATET estimates from Table 1. Standard errors are calculated as the width of the 95% confidence interval divided by 3.92.
Average effect:P -value for test of no heterogeneity:
bEstimates and standard errors are derived from counts and percentages in Table 3. Estimate in column (5) is impact on graduation because the impact on any attendance is not reported.cMother fixed effects estimates from Table 2.dFamily fixed effects estimates from Table 5.

Calendar yearGrade Age Grade Age Grade Age Grade Age Grade Age Grade Age Grade Age
(1) (2) (3) (4) (5) (6) (7) (8) (9) (10) (11) (12) (13) (14)1997 K1 41998 K2 5 K1 41999 1 6 K2 5 K1 42000 2 7 1 6 K2 5 K1 42001 3 8 2 7 1 6 K2 5 K1 42002 4 9 3 8 2 7 1 6 K2 5 K1 42003 5 10 4 9 3 8 2 7 1 6 K2 5 K1 42004 6 11 5 10 4 9 3 8 2 7 1 6 K2 52005 7 12 6 11 5 10 4 9 3 8 2 7 1 62006 8 13 7 12 6 11 5 10 4 9 3 8 2 72007 9 14 8 13 7 12 6 11 5 10 4 9 3 82008 10 15 9 14 8 13 7 12 6 11 5 10 4 92009 11 16 10 15 9 14 8 13 7 12 6 11 5 102010 12 17 11 16 10 15 9 14 8 13 7 12 6 112011 post-hs 18 12 17 11 16 10 15 9 14 8 13 7 122012 post-hs 19 post-hs 18 12 17 11 16 10 15 9 14 8 132013 post-hs 20 post-hs 19 post-hs 18 12 17 11 16 10 15 9 142014 post-hs 21 post-hs 20 post-hs 19 post-hs 18 12 17 11 16 10 152015 post-hs 22 post-hs 21 post-hs 20 post-hs 19 post-hs 18 12 17 11 162016 post-hs 23 post-hs 22 post-hs 21 post-hs 20 post-hs 19 post-hs 18 12 172017 post-hs 24 post-hs 23 post-hs 22 post-hs 21 post-hs 20 post-hs 19 post-hs 182018 post-hs 25 post-hs 24 post-hs 23 post-hs 22 post-hs 21 post-hs 20 post-hs 192019 post-hs 26 post-hs 25 post-hs 24 post-hs 23 post-hs 22 post-hs 21 post-hs 202020 post-hs 27 post-hs 26 post-hs 25 post-hs 24 post-hs 23 post-hs 22 post-hs 21
On-time 1st gradeOn-time hs gradOn-time college enrollOn-time 4-year college grad Notes: This table displays the timing of outcome measurements by preschool applicant cohort. Application years refer to the fall of the school year that a student applies, and on-time outcome years refer to the calendar year of measurement. The Student Information Management System (SIMS) data begins in 2001, so we do not observe on-time 1st grade enrollment for the 1997 or 1998 cohorts, who would reach first grade prior to 2001. Our search of the National Student Clearinghouse occurred in spring 2020, so we do not observe on-time four-year graduation for the 2002 and 2003 applicant cohorts, who would graduate on-time in summer 2020 or later. Grey areas indicate grades in which we observe Massachusetts Comprehensive Assessment System (MCAS) test scores.
Table A1: Application cohorts and outcome windows1997 1998 1999 2000 2001 2002 2003
By 2005By 2011 By 2012 By 2013 By 2014 By 2015 By 2016 By 2017
n.a. n.a. By 2001 By 2002 By 2003 By 2004
By 2017By 2015 By 2016 By 2017 By 2018 By 2019 n.a. n.a.By 2011 By 2012 By 2013 By 2014 By 2015 By 2016

Total applicants Number incorrect Percent correctApplication year (1) (2) (3)
1997 2144 170 92%1998 1463 152 90%1999 1494 123 92%2000 1450 54 96%2001 1357 41 97%2002 1383 52 96%2003 1306 46 96%All 10597 638 94%
Notes: This table reports the number and share of applicants whose re-constructed assignments based on preferences, priorities, and random tie-breakers match the observed assignments recorded by BPS.
Table A2: Mechanism replication rate

Non-offered First Reduced 2SLS Non-offered First Reduced 2SLSmean stage form estimate mean stage form estimate(1) (2) (3) (4) (5) (6) (7) (8)
Any college 0.459 0.645*** 0.060*** 0.094*** 0.650 0.645*** 0.041** 0.063**(0.015) (0.020) (0.030) (0.015) (0.019) (0.029)
2669 4175 2669 4175
Two-year college 0.096 0.019 0.030 0.291 0.022 0.034(0.012) (0.019) (0.018) (0.028)
2669 4175 2669 4175
Four-year college 0.363 0.041** 0.064** 0.506 0.044** 0.068**(0.019) (0.029) (0.020) (0.030)
2669 4175 2669 4175Massachusetts college 0.329 0.060*** 0.093*** 0.504 0.051*** 0.079***
(0.019) (0.029) (0.020) (0.030)2669 4175 2669 4175
Public college 0.260 0.028 0.044 0.474 0.038* 0.058*(0.018) (0.027) (0.020) (0.031)
2669 4175 2669 4175
Private college 0.200 0.032** 0.050** 0.316 0.021 0.032(0.016) (0.025) (0.018) (0.028)
2669 4175 2669 4175
Number of semesters 5.567 0.483** 0.749**(0.221) (0.342)
2669 4175
Graduation 0.208 0.621*** 0.009 0.015 0.325 0.621*** 0.040* 0.064*(0.017) (0.018) (0.029) (0.017) (0.021) (0.034)
2108 3281 2108 3281Graduation from four-year 0.207 0.011 0.017 0.297 0.028 0.045
(0.018) (0.029) (0.020) (0.033)2108 3281 2108 3281
*significant at 10%; ** significant at 5%; ***significant at 1%.
Table A3: Effects of preschool attendance on postsecondary outcomes without female controlEnrollment on-time Enrollment at any time
Notes: This table reports two-stage least squares (2SLS) estimates of the effects of Boston preschool attendance on post-secondary outcomes. Unlike the estimates in Table 3, the 2SLS models in this table do not control for a female indicator. Outcomes in columns (1)-(4) measure college enrollment within 6 months of a student's projected high school graduation date given his/her BPS preschool application year. Columns (5)-(8) display results based on college attendance at any time. On-time graduation equals one if a student graduates from a four-year college by the end of the fourth calendar year after projected high school graduation or a two-year college by the end of the second calendar year after projected high school graduation. The sample for graduation excludes students who applied to preschool in 2002 or 2003, who would not finish a four-year college on-time given normal academic progress. Columns (1) and (5) show mean outcomes for non-offered students. Columns (2) and (6) display coefficients from regressions of preschool attendance on the preschool offer. Columns (3) and (7) show coefficients from regressions of outcomes on the offer. Columns (4) and (8) report 2SLS coefficients instrumenting preschool attendance with the offer. All models control for a saturated set of indicators for the assignment propensity score along with bilingual status and race.
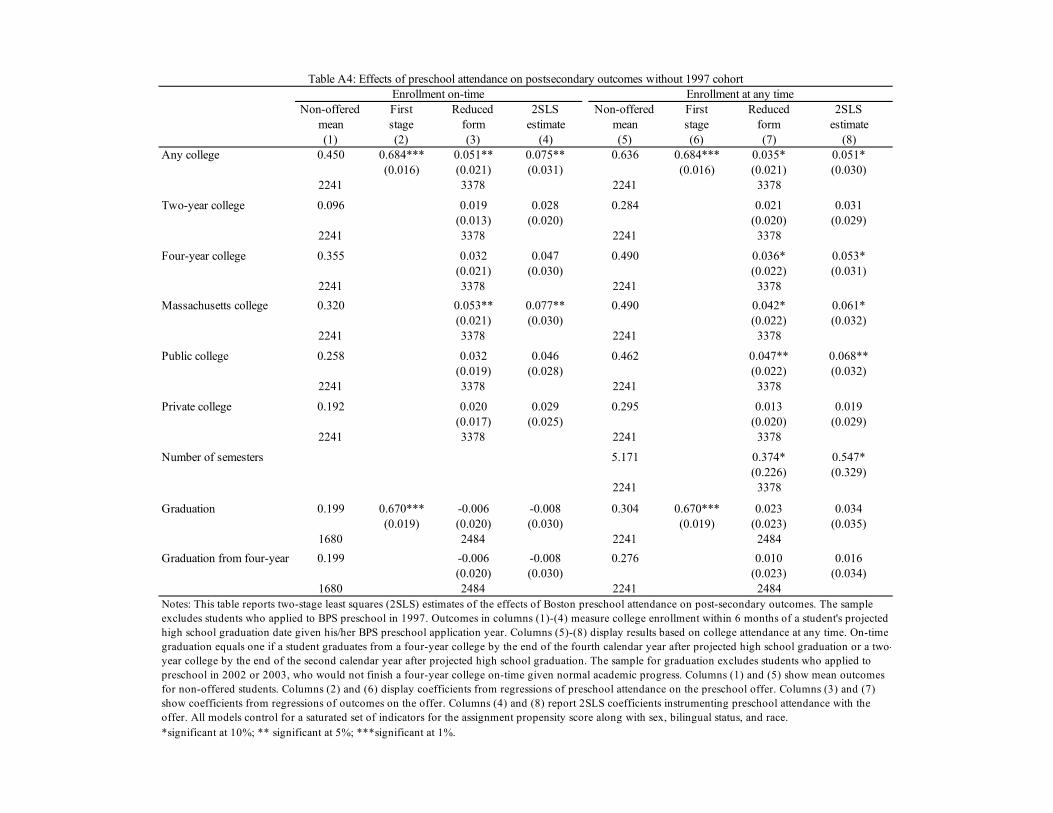
Non-offered First Reduced 2SLS Non-offered First Reduced 2SLSmean stage form estimate mean stage form estimate(1) (2) (3) (4) (5) (6) (7) (8)
Any college 0.450 0.684*** 0.051** 0.075** 0.636 0.684*** 0.035* 0.051*(0.016) (0.021) (0.031) (0.016) (0.021) (0.030)
2241 3378 2241 3378
Two-year college 0.096 0.019 0.028 0.284 0.021 0.031(0.013) (0.020) (0.020) (0.029)
2241 3378 2241 3378
Four-year college 0.355 0.032 0.047 0.490 0.036* 0.053*(0.021) (0.030) (0.022) (0.031)
2241 3378 2241 3378Massachusetts college 0.320 0.053** 0.077** 0.490 0.042* 0.061*
(0.021) (0.030) (0.022) (0.032)2241 3378 2241 3378
Public college 0.258 0.032 0.046 0.462 0.047** 0.068**(0.019) (0.028) (0.022) (0.032)
2241 3378 2241 3378
Private college 0.192 0.020 0.029 0.295 0.013 0.019(0.017) (0.025) (0.020) (0.029)
2241 3378 2241 3378
Number of semesters 5.171 0.374* 0.547*(0.226) (0.329)
2241 3378
Graduation 0.199 0.670*** -0.006 -0.008 0.304 0.670*** 0.023 0.034(0.019) (0.020) (0.030) (0.019) (0.023) (0.035)
1680 2484 2241 2484Graduation from four-year 0.199 -0.006 -0.008 0.276 0.010 0.016
(0.020) (0.030) (0.023) (0.034)1680 2484 2241 2484
*significant at 10%; ** significant at 5%; ***significant at 1%.
Table A4: Effects of preschool attendance on postsecondary outcomes without 1997 cohortEnrollment on-time Enrollment at any time
Notes: This table reports two-stage least squares (2SLS) estimates of the effects of Boston preschool attendance on post-secondary outcomes. The sample excludes students who applied to BPS preschool in 1997. Outcomes in columns (1)-(4) measure college enrollment within 6 months of a student's projected high school graduation date given his/her BPS preschool application year. Columns (5)-(8) display results based on college attendance at any time. On-time graduation equals one if a student graduates from a four-year college by the end of the fourth calendar year after projected high school graduation or a two-year college by the end of the second calendar year after projected high school graduation. The sample for graduation excludes students who applied to preschool in 2002 or 2003, who would not finish a four-year college on-time given normal academic progress. Columns (1) and (5) show mean outcomes for non-offered students. Columns (2) and (6) display coefficients from regressions of preschool attendance on the preschool offer. Columns (3) and (7) show coefficients from regressions of outcomes on the offer. Columns (4) and (8) report 2SLS coefficients instrumenting preschool attendance with the offer. All models control for a saturated set of indicators for the assignment propensity score along with sex, bilingual status, and race.
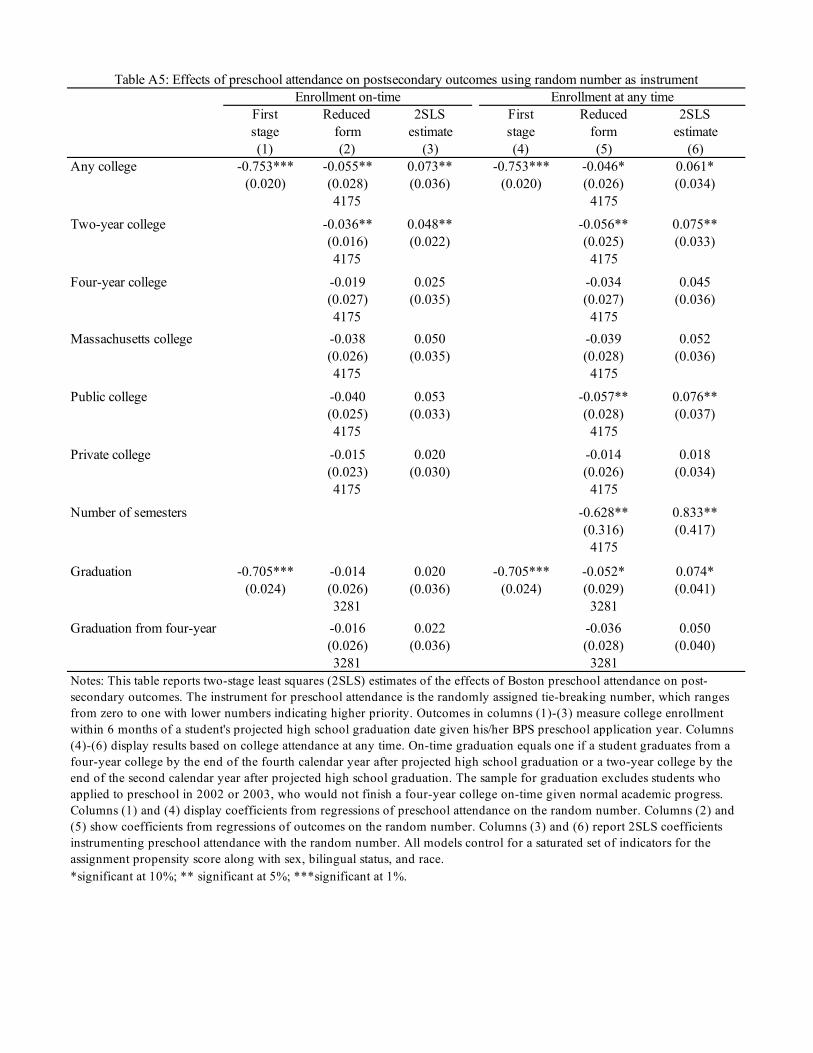
First Reduced 2SLS First Reduced 2SLSstage form estimate stage form estimate(1) (2) (3) (4) (5) (6)
Any college -0.753*** -0.055** 0.073** -0.753*** -0.046* 0.061*(0.020) (0.028) (0.036) (0.020) (0.026) (0.034)
4175 4175
Two-year college -0.036** 0.048** -0.056** 0.075**(0.016) (0.022) (0.025) (0.033)4175 4175
Four-year college -0.019 0.025 -0.034 0.045(0.027) (0.035) (0.027) (0.036)4175 4175
Massachusetts college -0.038 0.050 -0.039 0.052(0.026) (0.035) (0.028) (0.036)4175 4175
Public college -0.040 0.053 -0.057** 0.076**(0.025) (0.033) (0.028) (0.037)4175 4175
Private college -0.015 0.020 -0.014 0.018(0.023) (0.030) (0.026) (0.034)4175 4175
Number of semesters -0.628** 0.833**(0.316) (0.417)
4175
Graduation -0.705*** -0.014 0.020 -0.705*** -0.052* 0.074*(0.024) (0.026) (0.036) (0.024) (0.029) (0.041)
3281 3281Graduation from four-year -0.016 0.022 -0.036 0.050
(0.026) (0.036) (0.028) (0.040)3281 3281
*significant at 10%; ** significant at 5%; ***significant at 1%.
Table A5: Effects of preschool attendance on postsecondary outcomes using random number as instrumentEnrollment on-time Enrollment at any time
Notes: This table reports two-stage least squares (2SLS) estimates of the effects of Boston preschool attendance on post-secondary outcomes. The instrument for preschool attendance is the randomly assigned tie-breaking number, which ranges from zero to one with lower numbers indicating higher priority. Outcomes in columns (1)-(3) measure college enrollment within 6 months of a student's projected high school graduation date given his/her BPS preschool application year. Columns (4)-(6) display results based on college attendance at any time. On-time graduation equals one if a student graduates from a four-year college by the end of the fourth calendar year after projected high school graduation or a two-year college by the end of the second calendar year after projected high school graduation. The sample for graduation excludes students who applied to preschool in 2002 or 2003, who would not finish a four-year college on-time given normal academic progress. Columns (1) and (4) display coefficients from regressions of preschool attendance on the random number. Columns (2) and (5) show coefficients from regressions of outcomes on the random number. Columns (3) and (6) report 2SLS coefficients instrumenting preschool attendance with the random number. All models control for a saturated set of indicators for the assignment propensity score along with sex, bilingual status, and race.
ReferencesAbdulkadiroğlu, A., J. D. Angrist, S. M. Dynarski, and T. J. Kane (2011): “Account-ability and Flexibility in Public Schools: Evidence from Boston’s Charters and Pilots,” QuarterlyJournal of Economics, 126, 699–748.
Abdulkadiroğlu, A., J. D. Angrist, Y. Narita, and P. A. Pathak (2017): “Research De-sign Meets Market Design: Using Centralized Assignment for Impact Evaluation,” Econometrica,85, 1373–1432.
Abdulkadiroğlu, A. and T. Sönmez (2003): “School Choice: A Mechanism Design Approach,”American Economic Review, 93, 729–747.
Almond, D., J. Currie, and V. Duque (2018): “Childhood Circumstances and Adult Out-comes: Act II,” Journal of Economic Literature, 56(4), 1360–1446.
Anderson, M. L. (2008): “Multiple Inference and Gender Differences in the Effects of EarlyIntervention: A Reevaluation of the Abecedarian, Perry Preschool, and Early Training Projects,”Journal of the American Statistical Association, 103, 1481–1495.
Angrist, J. D., G. W. Imbens, and D. B. Rubin (1996): “Identification of Causal Effects UsingInstrumental Variables,” Journal of the American Statistical Association, 91, 444–455.
Armor, D. J. (2014): “The Evidence on Universal Preschool: Are Benefits Worth the Cost?”CATO Institute: Policy Analysis, October 15.
Athey, S., R. Chetty, G. Imbens, and H. Kang (2019): “The Surrogate Index: CombiningShort-Term Proxies to Estimate Long-Term Treatment Effects More Rapidly and Precisely,”NBER Working Paper 26463.
Bacher-Hicks, A., S. B. Billings, and D. J. Deming (2019): “The School to Prison Pipeline:Long-Run Impacts of School Suspensions on Adult Crime,” NBER Working Paper 26257.
Bailey, D., G. Duncan, C. Odgers, and W. Yu (2017): “Persistence and Fadeout in the Im-pacts of Child and Adolescent Interventions,” Journal of Research on Educational Effectiveness,10, 7–39.
Bailey, M., B. D. Timpe, and S. Sun (2020): “Prep School for Poor Kids: The Long-RunImpacts of Head Start on Human Capital and Economic Self-Sufficiency,” NBER Working Paper28268.
Baker, M., J. Gruber, and K. Milligan (2008): “Universal Child Care, Maternal LaborSupply, and Family Well-Being,” Journal of Political Economy, 116, 709–745.
——— (2019): “The Long-Run Impacts of a Universal Child Care Program,” American EconomicJournal: Economic Policy, 11, 1–26.
Barnett, S. (1985): “Benefit-Cost Analysis of the Perry Preschool Program and its Policy Impli-cations,” Educational Evaluation and Policy Analysis, 7(4), 333–342.
Belfield, C. R., M. Nores, S. Barnett, and L. Schweinhart (2006): “The High/ScopePerry Preschool Program: Cost-Benefit Analysis Using Data from the Age-40 Followup,” Journalof Human Resources, 41, 162–190.
38

Biden, J. (2021): “Fact Sheet: The American Families Plan,” The White House.https://www.whitehouse.gov/briefing-room/statements-releases/2021/04/28/fact-sheet-the-american-families-plan/.
Bitler, M. P., H. W. Hoynes, and T. Domina (2014): “Experimental Evidence on Distribu-tional Effects of Head Start,” Working paper.
Board, C. (2020): “SAT Understanding Scores: 2020,”Https://collegereadiness.collegeboard.org/pdf/understanding-sat-scores.pdf, Last accessed:March 31, 2021.
Boston Public Schools (BPS) (1997): “Introducing the Boston Public Schools: A Guide forParents and Students,” .
——— (1998): “Introducing the Boston Public Schools: A Guide for Parents and Students,” .
Bowen, W. G. and D. Bok (2000): The Shape of the River: Long-term Consequences of Con-sidering Race in College and University Admissions, Princeton, NJ: Princeton University Press.
Campbell, F. A., E. P. Pungello, M. Burchinal, K. Kainz, Y. Pan, B. H. Wasik, O. A.Barbarin, J. J. Sparling, and C. T. Ramey (2012): “Adult Outcomes as a Function ofan Early Childhood Education Program: An Abecedarian Project Follow-up,” DevelopmentalPsychology, 48, 1033–1043.
Campbell, F. A. and C. T. Ramey (1994): “Effects of Early Intervention on Intellectual andAcademic Achievement: A Follow-Up Study of Children from Low-Income Families,” Child De-velopment, 65(2), 684–698.
Carneiro, P. and R. Ginja (2014): “Long-Term Impacts of Compensatory Preschool on Healthand Behavior: Evidence from Head Start,” American Economic Journal: Economic Policy, 6,135–173.
Cascio, E. (2021): “Early Childhood Education in the United States: What, When, Where, Who,How, and Why,” NBER Working Paper 28722.
——— (forthcoming): “Does Universal Preschool Hit the Target? Program Access and PreschoolImpacts,” Journal of Human Resources.
Chaudry, A., T. Morrissey, C. Weiland, and H. Yoshikawa (2017): Cradle to Kinder-garten: A New Plan to Combat Inequality, New York: Russell Sage Foundation.
Chetty, R., J. N. Friedman, N. Hilger, E. Saez, D. W. Schanzenbach, and D. Yagan(2011): “How Does Your Kindergarten Classroom Affect Your Earnings? Evidence from ProjectSTAR,” The Quarterly Journal of Economics, 126, 1593–1660.
Chetty, R., J. N. Friedman, and J. E. Rockoff (2014): “Measuring the Impacts of TeachersII: Teacher Value-added and Student Outcomes in Adulthood,” American economic review, 104,2633–79.
Clements, D. H. and J. Sarama (2007): SRA Real Math, PreK-Building Blocks, Columbus,OH: SRA/McGraw-Hill.
39
Cornelissen, T., C. Dustmann, A. Raute, , and U. Schönberg (2018): “Who Benefits fromUniversal Child Care? Estimating Marginal Returns to Early Child Care Attendance,” Journalof Political Economy, 126.
Currie, J. (2001): “Early Childhood Education Programs,” Journal of Economic Perspectives,15(2), 213–238.
Currie, J. and D. Thomas (1995): “Does Head Start Make a Difference?” American EconomicReview, 85(3), 341–364.
De Haan, M. and E. Leuven (2020): “Head Start and the Distribution of Long-Term Educationand Labor Market Outcomes,” Journal of Labor Economics, 38, 727–766.
Deming, D. (2009): “Early Childhood Intervention and Life-Cycle Skill Development: Evidencefrom Head Start,” American Economic Journal: Applied Economics, 1, 111–134.
——— (2011): “Better Schools, Less Crime?” Quarterly Journal of Economics, 126, 2063–2115.
Duncan, G. J. and K. Magnuson (2013): “Investing in Preschool Programs,” Journal of Eco-nomic Perspectives, 27(2), 109–32.
Dynarski, S., S. Hemelt, and J. Hyman (2015): “The Missing Manual: Using National Stu-dent Clearinghouse Data to Track Postsecondary Outcomes,” Educational Evaluation and PolicyAnalysis, 37.
Elango, S., J. L. Garcia, J. J. Heckman, and A. Hojman (2016): “Early Childhood Educa-tion,” in Economics of Means-Tested Transfer Programs in the United States, ed. by R. Moffitt,The University of Chicago Press, vol. 2.
Felfe, C. and R. Lalive (2018): “Does Early Child Care Affect Children’s Development?”Journal of Public Economics, 159, 33–53.
Feller, A., T. Grindal, L. Miratrix, and L. C. Page (2016): “Compared toWhat? Variationin the Impacts of Early Childhood Education by Alternative Care Type,” Annals of AppliedStatistics, 110, 1245–1285.
Fitzpatrick, M. D. (2008): “Starting School at Four: The Effect of Universal Pre-kindergartenon Children’s Academic Achievement,” The BE Journal of Economic Analysis & Policy, 8.
Garces, E., D. Thomas, and J. Currie (2002): “Longer-term Effects of Head Start,” AmericanEconomic Review, 92, 999–1012.
Garcia, J. L., J. J. Heckman, D. E. Leaf, and M. J. Prados (2020): “Quantifying theLife-Cyle Benefits of an Influential Early Childhood Program,” Journal of Political Economy,128.
Gertler, P., J. Heckman, R. Pinto, A. Zanolini, C. Vermeersch, S. Walker, S. M.Chang, and S. Grantham-McGregor (2014): “Labor Market Returns to an Early ChildhoodStimulation Intervention in Jamaica,” Science, 344, 998–1001.
Gormley, W. T. and T. Gayer (2005): “Promoting School Readiness in Oklahoma: An Eval-uation of Tulsa’s Pre-K Program,” Journal of Human resources, 40, 533–558.
40

Gormley, W. T., T. Gayer, D. Phillips, and B. Dawson (2005): “The Effects of UniversalPre-K on Cognitive Development,” Developmental Psychology, 41, 872–884.
Gramlich, E. M. (1986): “Evaluation of Education Projects: The Case of the Perry PreschoolProgram,” Economics of Education Review, 5(1):17- 24.
Havnes, T. and M. Mogstad (2011): “No Child Left Behind: Subsidized Child Care andChildren’s Long-Run Outcomes,” American Economic Journal: Economic Policy, 3, 97–129.
——— (2015): “Is Universal Child Care Leveling the Playing Field?” Journal of Public Economics,127, 100–114.
Heckman, J. (2013): Giving Kids a Fair Chance, MIT Press.
Heckman, J., S. H. Moon, R. Pinto, P. Savelyev, and A. Yavitz (2010a): “AnalyzingSocial Experiments as Implemented: A Reexamination of the Evidence from the HighScopePerry Preschool Program,” Quantitative Economics, 1(1), 1–46.
Heckman, J., R. Pinto, and P. Savelyev (2013): “Understanding the Mechanisms ThroughWhich an Influential Early Childhood Program Boosted Adult Outcomes,” American EconomicReview, 103, 2052–2086.
Heckman, J. J. (2017): “With Supports, the Impact of High-Quality Preschool Does Not FadeOut,” Washington Post letter to the editor.
Heckman, J. J., S. H. Moon, R. Pinto, P. A. Savelyev, and A. Yavitz (2010b): “TheRate of Return to the HighScope Perry Preschool Program,” Journal of public Economics, 94,114–128.
Hendren, N. and B. Sprung-Keyser (2020): “A Unified Welfare Analysis of GovernmentPolicies,” Quarterly Journal of Economics, 135(5), 1209–1318.
Hindley, B. and A. V. Eaton (2018): “Staying the Course Six-Year College Enrollment andCompletion Experiences of BPS Class of 2011 Graduates,” The Boston Private Industry Council.
Hoxby, C. (2014): “Comment on Elizabeth Cascio and Diane Schanzenbach, The Impacts of Ex-panding Access to High-Quality Preschool Education,” Brookings Papers on Economic Activity,179–184.
Imbens, G. and J. D. Angrist (1994): “Identification and Estimation of Local Average Treat-ment Effects,” Econometrica, 62(2), 467–475.
Jackson, K. (2018): “What Do Test Scores Miss? The Importance of Teacher Effects on Non-TestScore Outcomes,” Journal of Political Economy, 126(5).
Johnson, R. C. and C. K. Jackson (2019): “Reducing Inequality through Dynamic Comple-mentarity: Evidence from Head Start and Public School Spending,” American Economic Journal:Economic Policy, 11, 310–349.
Kline, P. and C. R. Walters (2016): “Evaluating Public Programs with Close Substitutes:The Case of Head Start,” The Quarterly Journal of Economics, 131, 1795–1848.
41

Knudsen, E. I., J. J. Heckman, J. L. Cameron, and J. P. Shonkoff (2006): “Economic,Neurobiological, and Behavioral Perspectives on Building America’s Future Workforce,” Proceed-ings of the National Academy of Sciences, 103(27), 10155–10162.
Lipsey, M. W., D. C. Farran, and K. Durkin (2018): “Effects of the Tennessee Prekinder-garten Program on Children’s Achievement and Behavior Through Third Grade,” Early Child-hood Research Quarterly, 45, 155–176.
Ludwig, J. and D. L. Miller (2007): “Does Head Start Improve Children’s Life Chances?Evidence from a Regression Discontinuity Design,” The Quarterly Journal of Economics, 122,159–208.
Magnuson, K. A., M. K. Meyers, C. J. Ruhm, and J. Waldfogel (2004): “Inequalityin Preschool Education and School Readiness,” American Educational Research Journal, 41(1),115–157.
Marshall, N. L., J. Roberts, and L. Mills (2006): “Boston Public Schools K1 and K2Programs Needs Assessment,” Wellesley, September 7.
Martin, N. (2021): “Eight Years after Walsh’s Promises, Boston Prekindergarten is Still NotUniversal,” Boston Globe, February 22.
Massachusetts Department of Elementary and Secondary Education (DESE) (1995):“Children First: A Plan for an Early Care and Education System for Massachusetts: Report ofthe Special Commission on Early Childhood.” In: Massachusetts State Department of Education,Malden. December 1995.
Miller, D. L., N. Shenhav, and M. Z. Grosz (2019): “Selection into Identification in FixedEffects Models, with Application to Head Start,” Tech. rep., National Bureau of Economic Re-search.
Miller, L. C. and D. Bassok (2017): “The Effects of Universal Preschool on Grade Retention,”EdPolicyWorks Working Paper Series No. 57.
Mongeau, L. (2015): “Tennesse Preschool Study Receives Significant Coverage, Reaction,” Edu-cation Week.
Muralidharan, K. and P. Niehaus (2017): “Experimentation at Scale,” Journal of EconomicPerspectives, 31, 103–124.
National Institute for Early Education Research (NIEER) (2003): “The State ofPreschool 2003,” Rutgers University.
——— (2019a): “Pre-K in American Cities,” Rutgers University.
——— (2019b): “The State of Preschool 2019,” Rutgers University.
Obama, B. (2013): “State of the Union Address,” Remarks by the President.Washington DC. February 12, 2013. https://obamawhitehouse.archives.gov/the-press-office/2013/02/12/president-barack-obamas-state-union-address-prepared-delivery.
Pages, R., D. J. Lukes, D. H. Bailey, and G. J. Duncan (2020): “Elusive Longer-RunImpacts of Head Start: Replications Within and Across Cohorts,” Educational Evaluation andPolicy Analysis, 42, 471–492.
42

Petek, N. and N. G. Pope (2021): “The Multidimensional Impact of Teachers on Students,”Working paper, University of Maryland.
Puma, M., S. Bell, R. Cook, and C. Heid (2010): “Head Start Impact Study: Final Report,”U.S. Department of Health and Human Services, Administration for Children and Families:Washington DC, January.
Puma, M., S. Bell, and C. Heid (2012): “Third Grade Follow-Up to the Head Start ImpactStudy,” U.S. Department of Health and Human Services, Washington DC, October.
Rose, E. K., J. Schellenberg, and Y. Shem-Tov (2019): “The Effects of Teacher Quality onCriminal Behavior,” Working paper.
Rosenbaum, P. R. and D. B. Rubin (1983): “The Central Role of the Propensity Score inObservational Studies for Causal Effects,” Biometrika, 70, 41–55.
Sachs, J. and C. Weiland (2010): “Boston’s Rapid Expansion of Public School-Based Preschool:Promoting Quality, Lessons Learned,” Young Children, 65.
Schickendanz, J. and D. Dickinson (2005): Opening the World of Learning, Iowa City, Iowa:Pearson.
Schweinhart, L. J., J. Montie, Z. Xiang, W. S. Barnett, C. R. Belfield, and M. Nores(2005): Lifetime Effects: The High/Scope Perry Preschool Study Through Age 40, Ypsilanti, MI:HighScope Press.
Thompson, O. (2018): “Head Start’s Long-Run Impact: Evidence from the Program’s Introduc-tion,” Journal of Human Resources, 53, 1100–1139.
Walters, C. R. (2015): “Inputs in the Production of Early Childhood Human Capital: Evidencefrom Head Start,” American Economic Journal, 7, 76–102.
Weiland, C., R. Unterman, A. Shapiro, S. Staszak, S. Rochester, and E. Martin(2019): “The Effects of Enrolling in Oversubscribed Prekindergarten Programs Through ThirdGrade,” Child Development, 91, 140–1422.
Weiland, C. and H. Yoshikawa (2013): “Impacts of a Prekindergarten Program on Children’sMathematics, Language, Literacy, Executive Function, and Emotional Skills,” Child Develop-ment, 84, 2112–2130.
Whitehurst, G. (2017): “Rigorous Preschool Research Illuminates Policy (and Why the HeckmanEquation May Not Compute),” Brookings Institution, May 4.
Willie, C. V. and M. J. Alves (1996): “Controlled Choice: A New Approach to School Deseg-rated Education and School Improvement,” New England Desegregation Assistance Center forEquity in Education, Brown University.
Wong, V. C., T. D. Cook, W. S. Barnett, and K. Jung (2008): “An Effectiveness-BasedEvaluation of Five State Pre-Kindergarten Programs,” Journal of Policy Analysis and Manage-ment, 27, 122–154.
43

A Data Appendix
The data used for this study come from several sources. Lists of preschool applicants, applicant
rank order lists, and assignments are constructed from annual records from the Boston Public
Schools (BPS) school assignment system. Information on schools attended and student behavior
come from the Student Information Management System (SIMS), a centralized database that covers
all public school students in Massachusetts. Achievement test scores are from the Massachusetts
Comprehensive Assessment System (MCAS). SIMS, MCAS, and SAT data were provided by the
Massachusetts Department of Elementary and Secondary Education (DESE). College attendance
information comes from the National Student Clearinghouse (NSC). This Appendix describes each
data source and details the procedures used to clean and match them.
BPS Assignment Data
We received assignment data from BPS for all applicants to prekindergarten between 1997-2003.
These data cover applications for K0, K1, K2, 6th grade, and 9th grade. The data include random
tie-breakers, preference lists of schools, final assignments, and walk-zone priority status for each
applicant. In the assignment data, applicants rank programs. Individual schools usually contain
multiple programs, including bilingual or special education programs. Assignment data also include
the applicant’s geocode, a list of 800 geographic areas that determine walk-zone priority.
Our analysis sample consists of applicants to the first round of assignment for K1 preschool
programs. We restrict our analysis to valid, complete applications to K1 between 1997 and 2003.
The number of valid applications to K1 in the fall of each year are shown in column (1) of Table B1.
The sample is further restricted to exclude applicants who have empty preference lists (column (2)
of Table B1). Finally, a small number of applicants who have duplicate random lottery numbers
and who have the same parents listed are dropped, and applicants who had previously applied
to a BPS prekindergarten program are also excluded (column (3) of Table B1). Applicants with
duplicate random lottery numbers are likely cases of twins (or triplets, etc.), which are treated
differently in the assignment system and therefore excluded.
Using a student’s random tie-breaker, preference list, walk-zone priority, and sibling status,
we recreate student priorities. Some information on priorities used to assign applicants are not
contained in the assignment files. The data show if an applicant was assigned to a school as
a result of their sibling priority, but do not record sibling status for other unassigned schools.
44

Since siblings are generally guaranteed admission, we use sibling priority at the assigned school to
infer sibling priority in the assignment process. Prior to 2001, BPS engaged in post-assignment
rebalancing of offers for some students to reduce racial segregation. We do not observe the criteria
used to conduct this re-balancing, so we treat any discrepancies between final assignments and the
assignments implied by the observed preferences, priorities, and tie-breakers as non-compliance with
the assignment mechanism. Preferences, priorities, and capacities for each program (computed by
summing the number of observed offers) are used to replicate the match. We achieve a replication
accuracy of 94.6% across all years, shown in Table A2.
In addition to the application file, we also received a second post-enrollment extract from BPS.
This data set includes enrollment records for all students who applied to a BPS preschool between
1997-2003, allowing us to determine which applicants attended a BPS preschool program. The
post-enrollment extract also includes applicant names, dates of birth, race, first language, and
free lunch status. The application and post-enrollment data files include a unique BPS applicant
identifier that links records across these files.
SIMS Data
Our study uses SIMS data from the 2001-2002 through the 2017-2018 school year. Each year of data
includes files corresponding to October and June. The SIMS files include information on student
demographics, special education status, limited English proficiency, subsidized lunch status, and
schools attended for students in Massachusetts public schools each year. SIMS also contains a
student identifier known as the SASID, which is used to match students to the MCAS and SAT
data sets.
We use the SIMS data to code school enrollment, grade repetition, special education, subsidized
lunch status, and high school graduation. If a student attended multiple schools within the same
school year, we assign the student to the school they attended longest. Students classified as special
education or eligible for a free or reduced price lunch in any record within a school-year-grade retain
that designation for the entire year-grade. The SIMS includes exit information indicating a student’s
status at the end of each time period, which we use to determine high school graduation.
We also use SIMS data to track disciplinary outcomes in high school. The SIMS tracks the
number of days a student is registered at a school, the number of days a student attended a school,
and the number of days a student is truant. If a student enrolled in multiple schools within the
same school year, we add days registered, days absent, and days truant across all schools. We use
45

this information to track number of absences, number of truancies, rates of absence, and rates of
truancy. Juvenile incarceration is measured based on a unique enrollment code corresponding to a
Department of Youth Services facility.
MCAS Data
The MCAS is the standardized state exam for Massachusetts. We use MCAS Math and English
Language Arts (ELA) data from the 2001-2002 school year through the 2017-2018 school year. Each
observation in the MCAS database corresponds to a single test score. These scores are associated
with SASIDs linking MCAS data to SIMS data. We use MCAS ELA and Math test scores from
the 3rd, 4th, 5th, 6th, 8th and 10th grade exams. Since the Math 3, Math 5, ELA 5, and ELA 6
tests were created between 1997 and 2003, some cohorts are missing these tests. Table B2 shows
MCAS availability by subject. The raw test score variables are standardized to have mean zero
and standard deviation one within a subject-grade-year among all Massachusetts test-takers. If a
student has multiple scores for a subject-grade, we use the best score the student achieves.
SAT Data
We use SAT data files provided to the Massachusetts Department of Elementary and Secondary
Education by College Board for Massachusetts public school students taking the SAT. The SAT
files include scores for every section of the SAT and every cohort but application year 2003. If a
student took the SAT more than once, the file records the most recent exam. The SAT file also
includes a student’s SASID, which is used to merge SAT outcomes with the SIMS database.
NSC Data
Data on college outcomes comes from the National Student Clearinghouse (NSC) database, which
captures enrollment for 96% of US college students (Hindley and Eaton, 2018). We submitted all
available names and dates of birth for BPS preschool applicants to the NSC in May 2020. The
resulting data set includes each student/school enrollment record found in the NSC database. We
use the date of enrollment, date of exit, type of school (2/4 year, in state, out of state, private,
public) as well as exit status. Exit status includes graduation or transfer.
46

Data Linking Procedure
To match our assignment data to the SIMS and NSC data sets, we associate a unique name and
SASID with each identifier (“student number") in the assignment file. We first use the BPS post-
enrollment extract to associate a unique name and date of birth for every student number. Some
student numbers have multiple names in the post-enrollment extract, usually due to variations in
spellings or the use of middle names for students who applied multiple times. Where there are
multiple names and dates of birth, we match BPS student numbers to the earliest observed name
and date of birth. We refer to this name and date of birth combination as the Primary-ID. We
refer to the name component of the Primary-ID as the Primary Name. We are able to identify a
Primary-ID for every unique BPS student number in the BPS assignment file.
After constructing the Primary-ID, we link students to the SIMS by finding a unique SASID
for each Primary-ID. We do this using the following algorithm.
• For every SIMS time period (October or end of year)
– For every Primary-ID
1. Find every SIMS name with the same first initial, last initial, and date of birth.
2. Calculate the Levenshtein string distance between the Primary-Name and each as-
sociated SIMS name.
3. Keep the SIMS name with the smallest Levenshtein string distance. This links a
SASID to every Primary-ID.
4. Keep the match if the string distance between the Primary-Name and the SIMS
name is less than 0.2.
• Once we have done this for every time period, we append all Primary-ID/SASID matches
together. For each Primary-ID, we keep the SASID associated with the earliest MCAS test
score. If a Primary-ID still has multiple SASIDs, we keep the SASID with the closest name
to the Primary-Name in terms of Levenshtein string distance.
Following this procedure, we have a crosswalk that links each student number to a unique
SASID.
47

Census Block Group Data
Data on census block characteristics, including median household income, poverty rates, and racial
group shares come from the 2010 United States Census. The block group map was obtained from
the TIGER/Line shapefiles.
Census block group data are merged to applicant files by first linking the 2010 census block
group map to a map of Boston’s geocodes (centroids). The geocodes are then matched directly to
geocode identifiers contained in the BPS assignment file.
Final Data Construction and Attrition
To construct the final data we match applications to the NSC and the SIMS using the Primary ID
as described above. Table B1 shows the number of valid applications to K1 that can be linked to
the NSC and SIMS. Because we sent every available name to the NSC, we were able to conduct
the search for all students who could be linked to the Primary ID.
The non-offered attrition rate and differential between those students who received an offer and
those who did not is shown in Table B3. Among non-offered applicants 98.7% had names and
dates of birth that we searched for in the NSC data. Offered applicants were 0.8% more likely to
be included in the NSC search. Among non-offered applicants, 91% were found in the SIMS data.
Offered applicants were 2.9% more likely to be found in the SIMS and linked to a SASID.
48

All first round
applicants
Dropping invalid
priority or preference
Dropping duplicate random
number or ID
Has Primary ID/NSC Has SIMS
Dropping duplicate random
number or ID
Has Primary ID/NSC Has SIMS
Application year (1) (2) (3) (4) (5) (6) (7) (8)1997 2,144 2,125 2,121 2,101 1,854 808 797 7031998 1,463 1,460 1,343 1,340 1,219 880 877 8051999 1,494 1,486 1,244 1,232 1,148 608 603 5712000 1,450 1,437 1,081 1,072 1,004 563 558 5232001 1,357 1,342 991 986 937 447 446 4222002 1,383 1,366 1,047 1,042 988 482 479 4612003 1,306 1,284 959 907 870 427 415 398
All 10,597 10,500 8,786 8,680 8,020 4,215 4,175 3,883
Table B1: Sample construction and linkage to outcome files
Notes: This table describes the restrictions we impose to construct our analysis sample from the BPS preschool applicant records. Column (1) shows the number of first round applications in the applicant data file. Column (2) removes applications with invalid priority or preference data. Column (3) drops applicants with duplicate random numbers or duplicate unique identifiers. Column (4) drops applications that cannot be linked to the BPS enrollment file from which the Primary ID (name and date of birth) is obtained. Column (5) drops applications that cannot be linked to the Student Information Management System (SIMS). Columns (6)-(8) show the effects of these restrictions in the sample with non-degenerate preschool assignment risk.
Randomized applicants

Application year 3 4 5 6 7 8 10
1997 - 0.848 - 0.809 0.809 0.811 0.758
1998 - 0.831 - 0.835 0.831 0.824 0.740
1999 - 0.849 0.813 0.802 0.809 0.802 0.727
2000 - 0.822 0.807 0.780 0.784 0.786 0.744
2001 0.791 0.803 0.801 0.799 0.794 0.787 0.709
2002 0.824 0.844 0.826 0.785 0.787 0.777 0.727
2003 0.799 0.814 0.809 0.802 0.807 0.799 0.726
All 0.805 0.832 0.811 0.805 0.806 0.801 0.736
1997 0.831 0.845 - - 0.822 0.812 0.765
1998 0.862 0.830 - 0.817 0.822 0.821 0.748
1999 0.872 0.846 0.814 0.806 0.806 0.795 0.723
2000 0.820 0.828 0.799 0.778 0.780 0.782 0.751
2001 0.803 0.803 0.799 0.801 0.791 0.789 0.709
2002 0.826 0.835 0.826 0.787 0.783 0.779 0.711
2003 0.799 0.812 0.807 0.802 0.802 0.794 0.721
All 0.835 0.831 0.809 0.799 0.804 0.799 0.737
Table B2: MCAS followup ratesGrade
A. Math
B. ELA
Notes: This table displays the fraction of Boston preschool applicants with observed Massachusetts Comprehensive Assessment System (MCAS) test scores by application cohort and grade. Panel A shows followup rates for Math scores, and Panel B shows followup rates for English Language Arts (ELA) scores. The sample is restricted to students matched to the Student Information Managment System (SIMS) data.

Non-offered Offer Non-offered OfferSample size followup rate differential followup rate differential
Application year (1) (2) (3) (4) (5)1997 808 0.977 0.013* 0.856 0.030
(0.007) (0.033)1998 880 0.995 0.003 0.904 0.021
(0.002) (0.022)1999 608 0.990 0.003 0.934 0.004
(0.002) (0.021)2000 563 0.987 0.032** 0.911 0.043*
(0.015) (0.026)2001 447 0.997 0.002 0.914 0.069***
(0.002) (0.018)2002 482 0.993 -0.001 0.957 0.010
(0.010) (0.021)2003 427 0.966 0.013 0.918 0.034
(0.019) (0.026)
All 4215 0.987 0.008** 0.910 0.028***(0.003) (0.010)
*significant at 10%; ** significant at 5%; ***significant at 1%.
Table B3: NSC and SIMS followup ratesNSC followup SIMS followup
Notes: This table displays non-offered follow-up rates and offer differentials in followup rates for the National Student Clearinghouse (NSC) and Student Information Management System (SIMS) data sets. The sample is restricted to Boston preschool applicants subject to random assignment. Columns (1) and (3) show followup rates for non-offered applicants. Columns (2) and (4) report coefficients from regressions of an indicator for followup on an offer indicator, controlling for assignment risk. Robust standard errors in parentheses.