Vadose Zone Profiling to Better Understand Vadose Zone - CLU-IN
University of Nebraska - LincolnDigitalCommons@University of Nebraska - Lincoln
Faculty Publications from The Water Center Water Center, The
2018
The long term effect of agricultural, vadose zoneand climatic factors on nitrate contamination inNebraska’s groundwater systemPongpun JuntakutUniversity of Nebraska–Lincoln
Daniel D. SnowUniversity of Nebraska - Lincoln, [email protected]
Erin M.K. HaackerUniversity of Nebraska, [email protected]
Chittaranjan RayUniversity of Nebraska-Lincoln, [email protected]
Follow this and additional works at: http://digitalcommons.unl.edu/watercenterpubs
Part of the Environmental Indicators and Impact Assessment Commons, Fresh Water StudiesCommons, Hydraulic Engineering Commons, Hydrology Commons, Sustainability Commons, andthe Water Resource Management Commons
This Article is brought to you for free and open access by the Water Center, The at DigitalCommons@University of Nebraska - Lincoln. It has beenaccepted for inclusion in Faculty Publications from The Water Center by an authorized administrator of DigitalCommons@University of Nebraska -Lincoln.
Juntakut, Pongpun; Snow, Daniel D.; Haacker, Erin M.K.; and Ray, Chittaranjan, "The long term effect of agricultural, vadose zone andclimatic factors on nitrate contamination in Nebraska’s groundwater system" (2018). Faculty Publications from The Water Center. 41.http://digitalcommons.unl.edu/watercenterpubs/41
Juntakut e t al . in Journal of Contaminant Hydrology ( 2018 ) 1
Published in Journal of Contaminant Hydrology (2018) doi 10.1016/j.jconhyd.2018.11.007 Copyright © 2018 Pongpun Juntakut, Daniel D. Snow, Erin M.K. Haacker, and Chittaranjan Ray. Published by Elsevier B.V. Used by permission. Submitted 23 January 2018; revised 12 October 2018; accepted 20 November 2018.
The long term effect of agricultural, vadose zone and climatic factors on nitrate contamination in Nebraska’s
groundwater system
Pongpun Juntakut,1,2 Daniel D. Snow,3 Erin M.K. Haacker,4 and Chittaranjan Ray 1,4
1 Department of Civil Engineering, University of Nebraska–Lincoln, Lincoln, NE 68588-6105, United States
2 Department of Civil Engineering, Chulachomklao Royal Military Academy, Nakhon Nayok 26001, Thailand
3 Water Sciences Laboratory, University of Nebraska, Lincoln, NE 68583, United States
4 Nebraska Water Center, University of Nebraska, Lincoln, NE 68588, United States
Corresponding author — C. Ray, Department of Civil Engineering, University of Nebraska–Lincoln, Lincoln, NE 68588-6105, United States. email [email protected]
Abstract A four-decade dataset (1974–2013) of 107,823 nitrate samples in 25,993 wells from western and eastern parts of Nebraska was used to assess long-term trends of groundwater nitrate concentration and decadal changes in the extent of ground-water nitrate-contaminated areas (NO3-N≥10 mg N/L) over the entire state. Spa-tial statistics and regressions were used to investigate the relationships between groundwater nitrate concentrations and several potential natural and anthropo-genic factors, including soil drainage capacities, vadose zone characteristics, crop production areas, and irrigation systems. The results of this study show that there is no statistically significant trend in groundwater nitrate concentrations in west-ern Nebraska, in contrast with the increasing trend (p < .05) to the east. The spatial extent and nitrate concentrations in contaminated groundwater in center pivot-ir-rigated areas was less than in gravity-irrigated areas. Areas with a thicker vadose zone and larger saturated thickness of the aquifer have relatively lower nitrate
digitalcommons.unl.edu

Juntakut e t al . in Journal of Contaminant Hydrology ( 2018 ) 2
concentrations. The results of a classification and regression tree (CART) model indicate the difference in the influence of physical factors on groundwater nitrate concentrations between western and eastern Nebraska, namely that groundwater nitrate concentrations correspond with vadose zone thickness, effective hydraulic conductivity, and saturated thickness in the west, while in eastern Nebraska, con-centrations are correlated with average percent sand in the topsoil (0–150 cm), well depth, and effective hydraulic conductivity.
Keywords: Groundwater nitrate contamination, agricultural, vadose zone and cli-matic factors, CART method, Nebraska
1. Introduction
Nebraska, an agriculturally intensive state in the mid-western United States (U.S.), has a large number of wells with nitrate concentrations above the drinking water standard of 10 mg NO3-N/L (NDEQ, 2015). The High Plains/Ogallala Aquifer (HPOA) is a major alluvial aquifer that extends from South Dakota in the north to Texas in the south, and supplies tremendous amounts of water for agricultural, municipal, and industrial uses. About two thirds of the water in the HPOA is in Nebraska, which also contains a num-ber of large rivers with dams and canal diversions. Groundwater irrigation in Nebraska has increased significantly over the past six decades with the adoption of center pivots, which replaced traditional flood irrigation meth-ods. Now, more than 3.4 million hectares of land rely on groundwater from the HPOA to irrigate crops in Nebraska (USDA, 2014). While nitrate may occur naturally in groundwater, a major cause of high nitrate occurrence in Nebraska’s wells is the extensive fertilizer application across the state (Stan-ton and Lynne, 2006; Gurdak and Qi, 2006; Gurdak et al., 2009; Exner et al., 2014), particularly in irrigated fields.
Consumption of water with elevated nitrate concentrations can cause health problems, primarily for infants; its effects are called “blue baby syn-drome” or methemoglobinemia, which is caused by the inability of the blood to deliver enough oxygen to the infant’s body, as described by Comly (1945). In 1962, the U.S. Public Health Service officially recommended a ni-trate standard of 10 mg NO3-N/L for drinking water (U.S. Public Health Ser-vice, 1962). Though other countries have tighter standards, the U.S. has re-tained this 10 mg NO3-N/L to the present day (Sattelmacher, 1962; Simon et al., 1964; Kross et al., 1995; NAS, 1995; U.S. EPA, 2004, 2007, 2017; Tie-mann, 2017).
Generally, large amounts of nitrogen fertilizers and irrigation are applied annually in agricultural areas of Nebraska to increase and maintain agricul-tural production and crop yields (Spalding, 1975; Exner and Spalding, 1976; Adelman et al., 1985; Grassini et al., 2012; Ferguson, 2015). Consequently,

Juntakut e t al . in Journal of Contaminant Hydrology ( 2018 ) 3
nitrate contamination in Nebraska’s groundwater occurs primarily from ni-trate leaching in agricultural areas. Although these practices and risks are distributed widely across the state, some parts of the HPOA are more vul-nerable than others, for example due to soil drainage characteristics at the land surface (Spalding and Exner, 1993; Nolan et al., 1997; Exner et al., 2010, 2014).
Rising nitrate concentrations in groundwater has prompted Nebras-ka’s Natural Resources Districts (NRDs) to begin implementing ground-water management plans for quality and quantity in the mid- 1980s (NRD, 2017). The Central Platte NRD (CPNRD) plan is representative of those ad-opted throughout the state of Nebraska for groundwater quality manage-ment, although each of the 23 NRDs is free to enact regulations tailored to local conditions. The CPNRD Groundwater Quality Management Pro-gram (GWQMP) was initiated in 1988, and involves a phased approach to nitrogen management (CPNRD, 2016). The CPNRD defined four classes of nitrate contamination: Phase I, II, III, and IV. These classes correspond to nitrate concentrations of<7.5 mg/L (Phase I), 7.6–15 mg/L (Phase II),>15 mg/L (Phase III), and areas where the rate of decline in NO3-N concentra-tions have not been satisfactory (Phase IV) (CPNRD, 2016). Within these ar-eas, the timing and application rates of nitrogen fertilizer on irrigated agri-culture are regulated differently as presented in supplemental information (Table S1).
Although Nebraska NRDs have intensively monitored the extent of ni-trate contamination in groundwater, as published in the Nebraska Ground-water Quality Monitoring Report (NDEQ, 2015), and many researchers and managers have made efforts to minimize the impact of irrigated crop pro-duction on the occurrence of nitrate in Nebraska’s groundwater, it contin-ues to be challenging to control nitrate contamination (Table S2). This is likely due to the complexity of the aquifer system and difficulty in measur-ing the effectiveness of the best management practices (BMPs) from the GWQMP in reducing areas of nitrate contamination in groundwater. Previ-ous studies by Exner et al. (2010, 2014) have analyzed long-term ground-water nitrate concentration trends in several regions of eastern Nebraska, but their analysis did not include the more rural, semi-arid west, which is also extensively cultivated (Dappen et al., 2007). Additionally, the agricul-tural areas are expanding in western Nebraska (Dappen et al., 2007; Hiller et al., 2009), potentially impacting the groundwater quality due to signifi-cant N fertilizer application (Exner and Spalding, 1994). USGS reports have indicated widespread nitrate contamination in both eastern and western Nebraska (Verstraeten and Ellis, 1994; Verstraeten et al., 1994, 1998).
There is a significant difference in climate, precipitation and irrigation practices across the state. Western Nebraska is drier, with greater temper-ature extremes. The predominant bedrock is older (Gutentag et al., 1984),

Juntakut e t al . in Journal of Contaminant Hydrology ( 2018 ) 4
which means the landscape is less flat, soil texture is coarser than in many of the easternmost parts of the state, and hydraulic conductivity is lower in the aquifer. One purpose of this study is the analysis of the long-term groundwater nitrate concentration trends in western Nebraska, which will help increase understanding the occurrence of nitrate contamination in groundwater. Examining the commonalities and distinctions between the eastern and western parts of the state will help in planning the policy for the protection of groundwater from nitrate contamination. Furthermore, we employ a statistical classification method to establish the correlations among interrelated factors which may be important to nitrate concentra-tions in the east and west, which have not been considered in previous studies such as Exner et al. (2014), whose landmark study of eastern Ne-braska demonstrated the increasing trends in nitrate over the course of three decades. This assessment goes beyond Nolan et al. (1997) and Nolan and Hitt (2006), who demonstrated that many states, including Nebraska, are threatened with nitrate contamination in groundwater. Several studies have attempted to identify sources of groundwater nitrate contamination based on the local analysis in various parts of the United States (Van der Schans et al., 2009; Lockhart et al., 2013; Murgulet and Tick, 2013) as a sup-plement to these nationwide surveys. The research presented here shows the spatial-temporal changes of nitrate contamination in groundwater on a local to regional scale for the entire state of Nebraska.
Nitrate may be influenced by many factors, some continuous (e.g., va-dose zone thickness, thickness of the aquifer, depth to groundwater, etc.), and others categorical (e.g., type of well – domestic, irrigation, or monitor-ing; presence of barnyard within the property, older or newer wells, etc.). For the analysis of large data sets, the Classification and Regression Tree (CART) is one of the most commonly used decision tree tools. CART can be used to analyze complex interactions among predictors based on re-gression equations, particularly when there is a large amount of data with many variables (Zhang et al., 2003; Qi et al., 2010). For example, Burow et al. (2010) used CART to identify the relative significance of N inputs, bio-geochemical processes, and physical aquifer properties in explaining ni-trate concentrations in groundwater. In this study, we evaluate additional influential factors which were not considered in Burow et al. (2010), such as soil drainage classes, percent sand and organic matter in the topsoil, and weather data. In addition, we develop CART models to predict ground-water nitrate concentrations based on the presence or degree of these factors.
As mentioned above, Nebraska has clear differences in hydrogeology and spatial characterizations between western and eastern parts (e.g., rain-fall amounts, soil texture, population growth, and crop varieties). Thus, studies of groundwater nitrate contamination should be considered in each

Juntakut e t al . in Journal of Contaminant Hydrology ( 2018 ) 5
region of Nebraska in order to identify the local causes of leaching and so-lutions to nitrate occurrence in Nebraska’s groundwater.
The objectives of this study include: (i) to estimate the long-term trends of groundwater nitrate concentrations in western and eastern Nebraska; (ii) to examine four decades (1974–2013) of change in the spatial distribution of groundwater nitrate concentrations; and (iii) to evaluate relationships be-tween high groundwater nitrate concentrations (≥ 10 mg NO3-N/L), and po-tential natural (e.g., weather, and soil drainage) and anthropogenic (e.g., crop production and price, well type, and irrigation system) factors using CART.
This complements the work by Exner et al. (2014) for the years 1981–2010 in eastern Nebraska, in part by considering a time series that is 33% longer (40 years rather than 30 years) as well as including the western part of the state. This also complements the national-scale analysis of Nolan and Hitt (2006), which contextualizes the local risk of nitrate contamination in groundwater occurring in the High Plains.
Shallower wells are likely to have higher contamination levels than deeper wells. Older wells typically have higher contamination than newer wells and could be linked to construction techniques (Spalding and Exner, 1993). The higher the number of screen zones and the longer the total screen length, the higher the chance for the well to capture the groundwa-ter from the aquifer from all depths. High organic matter tends to preserve soil structure. A higher percentage of sand and organics allows greater in-filtration water to the underlying aquifer. Thick vadose zones attenuate the movement of chemicals. A deeper aquifer may have some dilution effect on contaminants reaching the water table. Precipitation prior to planting and during the growing season affects recharge. Temperature is likely to affect plant evapotranspiration. If the land-applied nitrogen load is high at land surface, there will likely be more nitrate available to leach to ground-water as a portion may not be utilized by plants. Many of these factors are not independent: for example, a shallow well is more likely to be installed where the water table is close to the land surface, which may also co-occur with sandier soils that permit more recharge. Monitoring wells may have higher nitrate concentrations by virtue of purposeful installation in loca-tions known to be contaminated. This study highlights the use of CART to identify the relative importance of these interdependent factors, suggesting possible causal mechanisms for nitrate contamination in eastern and west-ern Nebraska that can be further investigated using process-based model-ing to get specific causal information for smaller areas.
The goal of this paper is to use three statistical techniques – spatial in-terpolation, pairwise regression, and CART – to identify patterns of nitrate contamination in Nebraska. Each of these techniques can help to demon-strate the factors that are associated with nitrate contamination in both space and time.

Juntakut e t al . in Journal of Contaminant Hydrology ( 2018 ) 6
2. Materials and methods
2.1. The study area in western and eastern Nebraska
The study area is the state of Nebraska, representing a geographic area of ~200,000 km2
between latitude 40°N to 43°N and longitude 95° 19′W to 104° 03′W. Nebraska has two major climatic zones: a humid continen-tal climate (average annual precipitation ~750 mm) in the eastern part of the state and a semi-arid climate (average annual precipitation ~350 mm) in the western area of the state (HPRCC, 2016).
In this comparative analysis, the state of Nebraska is divided into west and east regions. The western region includes 8 Natural Resource Districts (NRDs), and the eastern region includes 15 NRDs (Fig. 1). There are 48 weather stations in Nebraska in the network of the High Plains Regional Climate Center (HPRCC) and 201 in the National Oceanic and Atmospheric Administration (NOAA), also shown in Fig. 1.
Fig. 1. The location of the study area and associated NRDs in western and eastern Nebraska with weather stations.

Juntakut e t al . in Journal of Contaminant Hydrology ( 2018 ) 7
2.2. Data collection and analysis
2.2.1. Groundwater nitrate data
A total of 107,823 nitrate concentration measurements were obtained from 25,993 wells, distributed across 6282 wells in the western part and 19,711 wells in the eastern part of Nebraska for the time period from 1974 until 2013, from the Quality-Assessed Agrichemical Contaminant Database for Nebraska Groundwater (http://dnrdata.dnr. ne.gov/clearinghouse) (UNL, 2000). Most of the samples were taken in eastern Nebraska (76% of total samples during 1974 to 2013), which has a higher population and greater density of agricultural land. Well types are shown in Table 1.
Irrigation wells in the dataset have the longest screened intervals, with an average of 24m, compared with 7m for domestic wells and 5m for mon-itoring wells. Most irrigation wells are screened for their entire length, in contrast with other well types which are not screened near the surface. Monitoring wells are commonly shallow, with an average well depth of 24m. The average well depths of domestic and irrigation wells are 43m and 69m, respectively. More comparative descriptions of these well types between western and eastern Nebraska such as well depths, screen zones, pumping capacities, construction details, etc. are in Table 2.
For groundwater nitrate assessment, the NRDs and NDEQ collect sam-ples during July and August every year (NDEQ, 2015). Samples are usually taken from a tap near the well head. Wells which are not in continuous op-eration are pumped for at least 2h before water is sampled (Schepers et
Table 1. The number of samples and well types including D=domestic, I=irrigation, Q=monitoring, C=commercial and industrial, and S=livestock wells that have been recorded in four decades (1974–1983; 1984–1993; 1994–2003; 2004–2013). Not all of these data were used in each part of this analysis.
West — No. of wells East — No. of wells
Time periods No. of samples D I Q C S D I Q C S
1974–1983 4748 426 654 1 2 335 1763 1255 134 3 226 1418 33811984–1993 15,986 857 402 81 6 6 2048 3308 907 21 52 1352 63361994–2003 42,597 669 2045 811 2 7 1821 7053 1030 19 47 3534 99702004–2013 44,492 127 1906 849 5 26 923 7406 562 44 49 2913 89841974–2013 107,823 1518 3397 982 14 371 4499 13,208 1607 67 330 6282 19,711

Juntakut e t al . in Journal of Contaminant Hydrology ( 2018 ) 8
Table 2. General descriptions of well types including domestic, irrigation, and monitoring wells, followed by number of wells and number of samples collected. Not all of these measurements were used in every part of this analysis.
West / (East)
Characteristics Well types No. of data Max Min Mean SD Source
Well depths (m) Domestic 2583 265 2 48 32 UNL and (10,645) (296) (0.3) (39) (25) NDNR Irrigation 12,475 188 6 79 35 (52,072) (373) (4) (58) (30) Monitoring 13,570 248 3 26 19 (20,763) (160) (0.6) (23) (22)Screen zones (m) Domestic 299 43 3 8 5 UNL and (1510) (74) (1.2) (5.5) (4.5) NDNR Irrigation 6889 134 0.6 38 22 (42,900) (146) (0.3) (25.6) (20) Monitoring 12,590 129.5 0.6 7 8 (12,339) (30) (0.01) (3.6) (3.3) Number of screen Domestic 299 2/3% 1/97% – – UNL and intervals (−) (1510) (3/0.07%) (1/96%) – – NDNR Irrigation 6889 4/0.16% 1/95% – – (42,900) (3/1.03%) (1/96%) – – Monitoring 12,590 3/0.43% 1/99% – – (12,339) (2/1%) (1/99%) Pumping capacities Domestic 2583 2000 1 20 37.2 NDNR (gallons/min) (10,645) (2000) (1) (19.5) (28.4) Irrigation 12,475 5000 2 1028 607.7 (52,072) (9020) (3) (876) (331) Monitoring 13,570 1334 1 19 74 (20,763) (1100) (1) (8.4) (45)Construction details All types: Under state regulations of Title 178, Chapter 12, “Water Well Standards” UNL for a variety of intended uses (drinking water, irrigation, livestock watering, geo- (IANR) thermal energy, or others), the NDHHS recommends that after drilling, a casing and of either plastic (PVC), fiberglass, teflon or steel pipe will be placed in the bore NDHHS hole. The casing must be extended at least 12 in. (~30 cm) above the surrounding land and is capped with a watertight seal on the top. The space between the bore hole and the well casing should be maintained a minimum of 2 in. (~5 cm) and must be grouted to protect surface water from running down the casing. A well screen is joined to the casing at one or more intervals in the aquifer’s water- bearing zone. Clean sand or gravel that stabilizes the aquifer material, must be placed in the space between the bore hole and the screen while allowing water to move into the well.
NDEQ is the Nebraska Department of Environmental Quality: http://dnrdata.dnr.ne.gov/clearinghouse ).NDNR is the Nebraska Department of Natural Resources: http://www.dnr.ne.gov/groundwater-data UNL (IANR) is the University of Nebraska-Lincoln, Institute of Agriculture and Natural Resources: http://water.unl.edu/wells/
design-construct NDHHS is the Nebraska Department of Health and Human Services: http://dhhs.ne.gov/Pages/default.aspx

Juntakut e t al . in Journal of Contaminant Hydrology ( 2018 ) 9
al., 1991; Exner et al., 2014). All samples are collected in polyethylene bot-tles and immediately put on ice until delivered for laboratory analysis. Sam-ples are analyzed using the EPA-approved cadmium reduction method or HACH EPA equivalent/compliant methods (Exner et al., 2005; NDEQ, 2015).
To evaluate groundwater nitrate trends, if more than one concentration was reported in a well in a year, the maximum concentration was selected, because the maximum concentration is important for health. The dataset of maximum concentrations for all individual wells was divided into two groups, one for the western half of Nebraska and the other for the eastern part. The concentrations within western and eastern Nebraska were then averaged for each year.
2.2.2. Spatial characterization data
The distribution of irrigated and non-irrigated row crops was available from the MIRAD-US project under the USGS Early Warning and Environmental Monitoring Program (USGS, 2015) and the 2005 Nebraska Land Use Map (University of Nebraska–Lincoln, 2010). The data for irrigation systems in Nebraska were obtained from the University of Nebraska–Lincoln Conser-vation and Survey Division (School of Natural Resources, 2015) and the Center for Advanced Land Management Information Technologies 2005 Nebraska Land Use map (University of Nebraska–Lincoln, 2010). The spa-tial map of soil drainage capacities was made in accordance with Exner et al. (2014) by consolidating the seven drainage classifications of the Soil Survey Geographic Database (USDA, 2015) into three groups: excessively well drained, well drained and poorly drained. The spatial maps of corn and soybean production years were created by stacking raster layers of annual data from the National Agricultural Statistics Service (NASS) Cropland Data Layer (USDA-NASS, 2015).
2.2.3. Weather and crop price data
Weather data were collected from 48 stations of the HPRCC (http://hprcc6.unl.edu/cgi-hpcc/home.cgi ) automated weather data network (AWDN) and 201 NOAA stations (http://www.ncdc.noaa.gov/cdoweb/datatools/findsta-tion). Daily data included precipitation; wind speed; solar radiation; rela-tive humidity; maximum, average and minimum temperatures; and poten-tial evapotranspiration (ETp) across the study area during 2004 and 2013.
Soil nitrate, which can be derived from most nitrogen materials in com-mercial fertilizers, biomass, and animal wastes, is highly soluble in water and can easily be transported through soil to groundwater with recharge from agricultural land. Evapotranspiration (ET) is a highly variable and yet significant driving force (USGS, 2000) that is a primary determinant of the

Juntakut e t al . in Journal of Contaminant Hydrology ( 2018 ) 10
amount and timing of recharge. ET affects nitrate concentrations in ground-water through changes to the water balance, especially by decreasing re-charge. Because most of the area where groundwater is exposed to nitrate contamination is fully irrigated, and therefore unlikely to experience any long-term moisture deficit, the potential evapotranspiration (ETp) is a good approximation for the actual ET. In this study, ETp is calculated on a daily time step using the Penman-Monteith (PM) equation with a fixed surface resistance of 45 sm−1
and fixed plant height of 0.5m for a reference surface of grass and alfalfa (Monteith, 1965).
Assuming that N applied per acre is independent of the number of acres in production, increasing crop land areas leads to more total N fertilizer ap-plication. Typical N application rates for corn and soybeans in Nebraska are ~180 kg/ha (based on an anticipated yield of 150 bu/ac) and ~100 kg/ha (in a case of nitrogen deficiency in soil), respectively (Shapiro et al., 2008; Ferguson et al., 2006). A higher corn price shifts the corn-soybean rota-tion in favor of continuous corn and encourages more fertilizer use. Thus, trends in total N fertilizer should be considered in the context of trends in corn price. Historical corn prices were obtained from the Department of Agricultural and Consumer Economics of the College of Agricultural, Con-sumer and Environmental Sciences at the University of Illinois (http://farm-doc.illinois.edu/manage/pricehistory/price:history.html).
2.3. Groundwater nitrate-contaminated areas
To differentiate factors controlling leaching and vulnerability to contamina-tion, areas with high groundwater nitrate concentration were first identified and delineated. Outlined areas of nitrate concentrations (≥10 mg NO3-N/L) were created using ArcGIS 10.3.1. The nitrate concentration in each well during each decade (1974–1983; 1984–1993; 1994–2003; 2004–2013) was computed across 2 km by 2 km grid cells using the point-to-raster conver-sion tool. Spatial analysis tools (interpolation, reclassify and contour) were used on grid cells with average concentration ≥10 mg NO3-N/L. If more than one concentration was reported in a well in a year, the concentrations were averaged, in contrast with the trend analysis (Section 2.2.1), in which the greatest measured concentration was used in a year. The average con-centration was more representative for spatial comparison among wells, because spatial interpolations are sensitive to outliers.
Four methods of interpolation in ArcGIS 10.3.1 (inverse distance weight-ing, ordinary kriging, interpolation from contours, and natural neighbor) were compared for spatially estimating averaged values of nitrate con-centrations from wells in Table 1. This includes data from some multi-level monitoring wells, including from studies involving nitrates from point sources, which are not representative of nitrates from agricultural drainage.
Juntakut e t al . in Journal of Contaminant Hydrology ( 2018 ) 11
Monitoring wells represented up to 30% of wells in the west (2004–2014) and up to 14% of wells in the east (1984–1993). Nitrate levels from multi-level monitoring wells were averaged across depths before interpolation, since only one value can be used for a given location in any of the above interpolation methods. The selected interpolation methods were cross val-idated by reserving 10% of known data points from the database for error assessment. The results indicated that the natural neighbor method had the smallest error as calculated by the root mean square error (Fig. S1) and the percent of error (Table S3), and so this method was used to delin-eate areas of high nitrate concentrations (≥10 mg NO3-N/L). Our method-ology is different from the previous study by Exner et al. (2014) which used the “topo to raster” contour interpolation tool for determining the areas of high nitrate concentrations (≥10 mg NO3-N/L) and excluded multi-level monitoring wells.
2.4. CART model for estimating groundwater nitrate concentrations
2.4.1. Methodology for the CART analysis
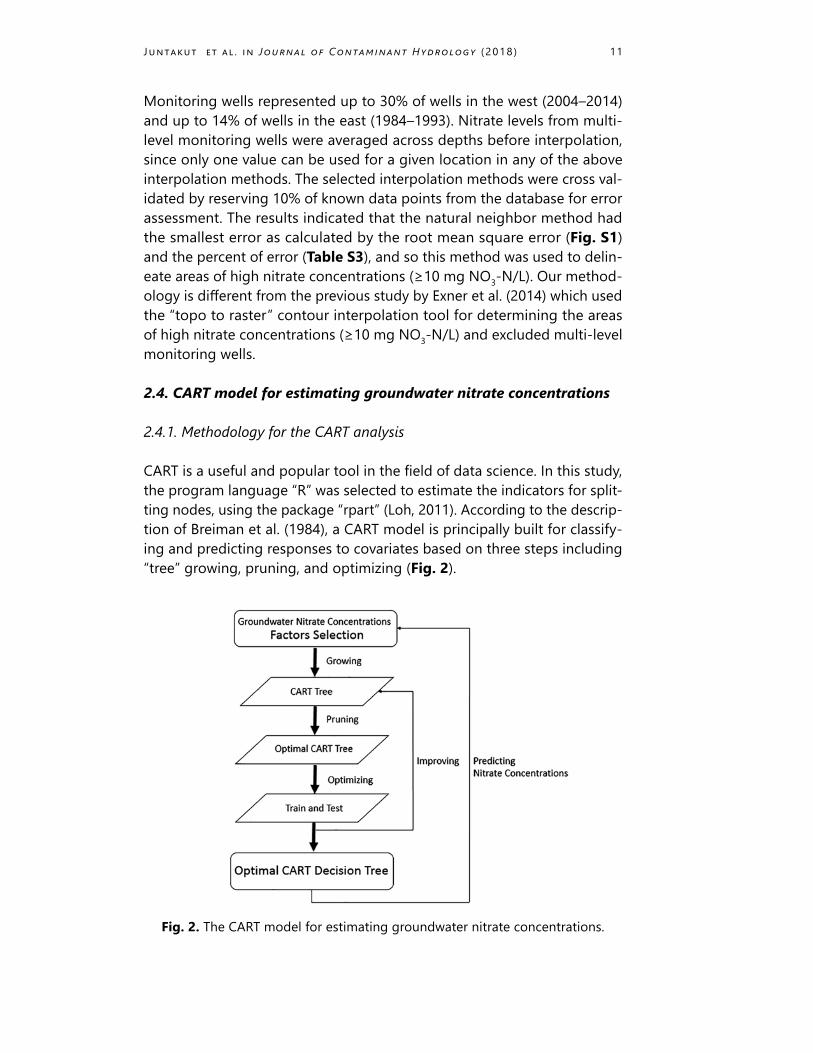
CART is a useful and popular tool in the field of data science. In this study, the program language “R” was selected to estimate the indicators for split-ting nodes, using the package “rpart” (Loh, 2011). According to the descrip-tion of Breiman et al. (1984), a CART model is principally built for classify-ing and predicting responses to covariates based on three steps including “tree” growing, pruning, and optimizing (Fig. 2).
Fig. 2. The CART model for estimating groundwater nitrate concentrations.

Juntakut e t al . in Journal of Contaminant Hydrology ( 2018 ) 12
“Tree” growing requires two steps, as described in the name of the tool: classification, and regression. The first step uses a classification tree – a re-cursive partitioning technique – to run several variables against the or de-pendent variable, to find the most robust and consistent method of sorting the observations into groups based on their similarity. The program checks the greatest improvement of the “purity” score of the resultant nodes (cate-gories), to identify the best splitter in the case of the categorical variable, as well as alternative splitters (“surrogates”) that would create similar groups. Thus CART splits the samples into populations with similar attributes, en-suring that the resulting populations are as similar to each other, and as dif-ferent from other groupings, as possible. For discrete inputs, such as well type in this analysis, the classification is evaluated using a metric known as a Gini coefficient (Breiman et al., 1984). The regression tree, which is gen-erated for continuous input variables such as screen depth and sand con-tent, has the same procedure with the classification tree, except it uses the variance between groups as the indicator instead of the Gini coefficient. CART automatically splits the observations into a large number of small subgroups with very similar characteristics, but only the first several splits are likely to be statistically significant; therefore it is necessary to get rid of the smallest “branches” in the decision tree.
After generating a detailed decision tree from the combination of clas-sification (group membership) and regression (group values) (Fig. S2), the second step of the CART methodology is “tree pruning.” Pruning cuts the “branches” of the tree to reduce over-fitting, thereby increasing the ability of new data prediction in the decision tree (Mingers, 1989). In CART, the “minimum cost complexity” pruning method is used to optimize the deci-sion tree. Typically, the cost-complexity pruning threshold of the decision tree is considered equivalent to the decision tree error.
The final step in CART involves evaluating the pruned trees using the split test method, which is one method of examining the optimal tree (Dob-bin and Simon, 2011). The observed data are divided into two groups, one for training and the other for testing. The groundwater nitrate con-centration dataset within the contaminated area (NO3-N≥10 mg N/L) dur-ing 2004–2013 was randomly separated into two subsets, 80% of the data (12,880 samples) as the model training observations and 20% of the data (2000 samples) as the testing observations. In this study, the groundwa-ter nitrate concentration was the target value, whereas weather conditions, well and soil characteristics, and surface nitrate-nitrogen loading for each well were chosen as the potential contributing factors based on a litera-ture review (Tables 4 and 5). Groundwater nitrate concentrations were esti-mated and evaluated by a CART model through the procedure of growing, pruning, and optimizing based on the optimal tree. An overview of CART methodology is presented in Fig. 2 and the principal equations of the CART model are described in Table 3.

Juntakut e t al . in Journal of Contaminant Hydrology ( 2018 ) 13
Table 3. Principal equations of the CART model (Breiman et al., 1984; Yohannes and Webb, 1999).
Parameter Equation Definition
Gini coefficient Gini(t) is an indication of the purity at node t, k is the number of categorical predictor variables, p ( j | t ) is the probability of a record output being in class j for the node t. When the Gini(t) equals zero, it means all the observations in the node belong to a single group (the most purity).
The reduction of Gini coefficient ΔGini(t) is the reduction of Gini coefficient at node t (the greatest value means the best splitter), Gini(t) is the Gini coefficient of output variables before reducing at node t, Gini(tL) and pL are respectively the Gini coefficient and the proportions of observations at the left child node tL, Gini (tR) and pR are respectively the Gini coefficient and the proportions of observations at the right child node tR.
The variance of the regression tree R(t) is an indicator of the variance at node t, N is the number of observations for the node t, k is the number of categorical predictor variables, xi(t) is the output variables in class j for the node t, and x (t) is the mean of the output variables in class j for the node t.
The reduction of the variance ΔR(t) is the reduction of variance at node t (the greatest value means the best splitter), R(t) is the variance of output variables before reducing at node t, R(tL) and pL are respectively the variance and the proportions of observations at the left child node tL, R(tR) and pR are respectively the variance and the proportions of observations at the right child node tR.
The cost-complexity pruning R∝(T) is the cost-complexity pruning of the decision tree, T, R(T) is the error of classification in the decision tree, T, α is the complexity parameter, which will range from 0 to 1 and increase during the pruning process to represent how much additional accuracy is in the tree. When α is increased, the tree will be pruned. | T̃ | is the number of child nodes.
Gini (t) = 1 – ∑kj=1 p2 ( j| t )
ΔGini(t) = Gini(t) − pLGini(tL) − pRGini(tR)
R(t) = 1 ∑k
j=1 (xi (t) – ‾x (t))2
N – 1
ΔR(t) = R(t) − pLR(tL) − pRR(tR)
R∝(T) = R(T) + α|T̃ |

Juntakut e t al . in Journal of Contaminant Hydrology ( 2018 ) 14
Tabl
e 4.
Sel
ecte
d fa
ctor
s for
the
anal
ysis
of th
e CA
RT m
odel
.
WES
TEA
ST
Fact
ors
M
ax
Min
M
ean
SD
So
urce
Wel
l attr
ibut
es
Wel
l dep
th (m
) 15
3
4.5
33
23
UN
L an
d N
DN
R
373
6
56
29
W
ell a
ge b
ased
on
sam
plin
g da
te (y
r)
75
0
20
14
UNL
and
ND
NR
(cal
cula
ted
from
the
diffe
renc
e be
twee
n
88
0
32
12
sa
mpl
ing
date
and
com
plet
ed d
ate
of w
ells)
Le
ngth
of w
ells
scre
en (m
) 10
4
0.15
10
13
UN
L an
d N
DN
R
109
1.
83
91
28
Num
ber o
f scr
een
inte
rval
s (−)
2
1
1
0.
1
UNL
and
ND
NR
5
1
2
0.
3So
il ch
arac
teris
tics a
nd p
hysic
al v
ados
e zo
ne p
rope
rtie
s
Aver
age
perc
ent s
and
in 0
–150
cm
(%)
95.7
3
9.79
61
.87
21
.37
N
RCS
SSUR
GO
96.3
2.
6
50.9
3
35.8
Av
erag
e pe
rcen
t org
anic
mat
ter i
n 0–
150
cm (%
) 1.
77
0.27
0.
82
0.35
N
RCS
SSUR
GO
5
0.28
0.
87
0.51
Eff
ectiv
e hy
drau
lic c
ondu
ctiv
ity (c
m/d
ay)
163.
54
16.7
3 1
01.0
6 4
7.45
SN
R UN
L (c
alcu
late
d ba
sed
on v
ertic
al fl
ow a
nd
94
.53
19
.27
59.
32
18.6
8
Pe
dotra
nsfe
r Fun
ctio
n in
RO
SETT
A da
taba
se)
Va
dose
zon
e th
ickn
ess (
m)
68
2.14
12
9
N
DN
R
65
2.14
18
12
Sa
tura
ted
thic
knes
s (m
) 13
2
0.15
21
19
UN
L an
d N
DN
R (c
alcu
late
d fro
m w
ell d
epth
357
0.
3
38.4
25
and
vado
se z
one
thic
knes
s)W
eath
er d
ata
M
ean
mon
tly p
reci
pita
tion
durin
g Ap
r-Sep
(mm
) 11
3.47
27
.71
66.
04
16.1
5
PRIS
M C
limat
e Gr
oup
bas
ed o
n 20
04–2
013
data
16
3.33
37
.32
88.
92
19.1
M
ean
annu
al m
ax te
mpe
ratu
re (°
C) b
ased
on
20
.27
14
.02
17.
55
1.02
PR
ISM
Clim
ate
Grou
p
20
04–2
013
data
20
.61
13
.58
16.
56
1.41
M
ean
annu
al m
in te
mpe
ratu
e (°C
) bas
ed o
n
3.83
−0
.71
1.6
9 0.
79
PRIS
M C
limat
e Gr
oup
2004
–201
3 da
ta
5.61
0.
92
3.24
1.
02Su
rface
nitr
ate
load
ing
N
itrat
e-N
load
on
surfa
ce a
roun
d ea
ch w
ell b
ased
50
.95
0.
5
20.7
4
21.9
8
Lite
ratu
re re
view
(see
Tabl
e 5)
on la
nd c
over
(kg/
ha/y
r) 50
.95
1.
44
36.6
7
17.5
5
Abbr
evia
tions
UN
L, U
nive
rsity
of N
ebra
ska-
Linc
oln:
http
://dn
rdat
a.dn
r.ne.
gov/
clea
ringh
ouse
N
RCS
SSU
RGO
is th
e US
DA N
atur
al R
esou
rces
Con
serv
atio
n Se
rvic
e an
d So
il Su
rvey
Geo
grap
hy d
atab
ase:
http
s://w
ebso
ilsur
vey.s
c.ego
v.usd
a.go
v/Ap
p/H
omeP
age.
htm
SN
R U
NL
is th
e Sc
hool
of N
atur
al R
esou
rces
at t
he U
nive
rsity
of N
ebra
ska-
Linc
oln:
http
://sn
r.unl
.edu
/dat
a/ge
olog
ysoi
ls/N
ebra
skaT
estH
ole/
Neb
rask
aTes
tHol
eMap
.asp
x N
DN
R, N
ebra
ska
Dep
artm
ent o
f Nat
ural
Res
ourc
es: h
ttps:/
/dnr
.neb
rask
a.go
v/da
ta/g
roun
dwat
er-d
ata
PRIS
M C
limat
e G
roup
is th
e Pa
ram
eter
ele
vatio
n Re
gres
sion
on In
depe
nden
t Slo
pes M
odel
Clim
ate
Grou
p: h
ttp://
ww
w.pr
ism.o
rego
nsta
te.e
du/

Juntakut e t al . in Journal of Contaminant Hydrology ( 2018 ) 15
2.4.2. Factors for CART modeling
A CART model was created to identify the most significant factors affecting nitrate concentrations in Nebraska’s groundwater, beginning with 13 po-tentially influential factors divided into four groups. These included well at-tributes, soil and vadose zone characteristics, weather conditions, and sur-face nitrate-nitrogen load around each well (see Table 4). Selection of these factors was also influenced by the availability of data.
Figs. 3 and 4 present box plots and trend lines of vadose zone character-istics (well depth, saturated thickness, and vadose zone thickness) with ni-trate sample data for three major well types, domestic, irrigation, and mon-itoring, within the contaminated area (2004–2013) in western and eastern
Fig. 3. Vadose zone characteristics (well depth, saturated and vadose zone thick-ness) with groundwater nitrate concentrations (1974–2013) within the 2004–2013 contaminated area in eastern Nebraska. 1 ft (ft)=0.3048 m (m). The 2004–2013 contaminated area encompasses most of the contaminated area from previous decades.

Juntakut e t al . in Journal of Contaminant Hydrology ( 2018 ) 16
Nebraska. The monitoring well data used in these regressions includes data from multi-level monitoring wells for studies in eastern Nebraska, which were not used for CART analysis, although they were used for spa-tial interpolation.
Wells in a large part of eastern Nebraska exhibited shallower average well depth, less saturated thickness of the aquifer, and smaller vadose zone thickness along with a correlation of increasing nitrate concentrations with depths in wells of all types (domestic, irrigation and monitoring wells) as shown in Figs. 3 and 4. The contrasting shape of the regression in nitrate concentrations in domestic, irrigation, and monitoring wells probably oc-curs from differences in well attributes such as screen depths, well diam-eters, etc. The fitted correlation of median well depth, saturated thick-ness of aquifer, and vadose zone thickness with nitrate concentrations in
Fig. 4. Vadose zone characteristics (well depth, saturated and vadose zone thick-ness) with groundwater nitrate concentrations (1974–2013) within the 2004–2013 contaminated area in western Nebraska. 1 ft (ft) = 0.3048 m (m).

Juntakut e t al . in Journal of Contaminant Hydrology ( 2018 ) 17
monitoring wells presents an exponential relationship with R2 of 0.98, 0.99,
and 0.97, respectively. Comparatively, a linear relationship is found only in irrigation wells with R2
of 0.77 (well depth), 0.66 (saturated thickness), and 0.94 (vadose zone thickness). Deeper well depths and larger thicknesses of saturated and vadose zones are associated with lower nitrate concen-trations in groundwater. The shallow well depth and smaller thicknesses of the saturated and vadose zones in the 0–50 ft (i.e., 0–15 m) range of monitoring wells have definitively higher nitrate concentrations than in domestic and irrigation wells. The well attributes, e.g. screen depths and well diameters, likely impact groundwater nitrate concentrations by af-fecting the part of the aquifer that the well draws from, particularly in the vertical profile of nitrate.
Based on these regressions, it is a valid concern that data from monitor-ing, irrigation, and domestic wells might not be comparable. In particular, monitoring wells are often put into place in areas of known nitrate contam-ination. However, CART analysis explicitly shows that in western Nebraska, monitoring wells in areas with a thin vadose zone and high hydraulic con-ductivity have more in common (in terms of nitrate concentrations) with irrigation and domestic wells in areas with a thin vadose zone and high hydraulic conductivity than with other monitoring wells that do not share these physical and geographical characteristics. No monitoring wells were included in the CART analysis for eastern Nebraska.
In the western part of Nebraska, domestic and monitoring wells have lower nitrate concentrations where the vadose zone is thicker. Except for irrigation wells, there are no obvious correlations of nitrate concentration with well depth and saturated thickness of the aquifer. Eastern Nebraska has higher nitrate concentrations in groundwater than in the west. Interest-ingly, at the same depth to water table or vadose zone thickness, ground-water nitrate concentrations in the east are higher than in the west. The difference in soil properties and other conditions between western and eastern Nebraska, as well as higher rainfall, recharge, and N inputs in the east, likely plays a significant role in predicting nitrate concentrations in groundwater.
Note that, while trends in groundwater concentrations over time were different between domestic, irrigation, and monitoring wells, the type of well was not a significant factor in absolute nitrate concentrations accord-ing to the CART model. The type of well was included as an input fac-tor when creating the CART model, and if the mean groundwater nitrate concentration were significantly different among the types of wells, CART would have identified this factor as part of the classification tree. Instead, well type was identified in the west as a surrogate split in node 22, whereas everything beyond node 5 was considered statistically insignificant. In east-ern Nebraska, no monitoring well data was used for CART analysis.
Juntakut e t al . in Journal of Contaminant Hydrology ( 2018 ) 18
The depth from the land surface to the water table, referred to as vadose zone thickness, was estimated from a map of the depth to water. This was combined with the groundwater nitrate sample database of the University of Nebraska–Lincoln (UNL) between 1974 and 2013 using the extract val-ues to points tool in ArcGIS 10.3.1. The depth to water map was created using the kriging interpolation tool using water depth data from 206,061 registered wells collected by the Department of Natural Resources (DNR) in Nebraska (http://www.dnr.ne.gov/groundwater-data). Saturated thick-ness was estimated from the difference between the well depth and the estimated depth to water table. From the estimation of the thickness of saturated zone, we found that many wells do not extend to the bottom of the aquifer in Nebraska. While the HPOA is known for its rapid depletion due to unsustainable use (Scanlon et al., 2012; McGuire, 2017; Haacker, et al., 2016), the depth to water in Nebraska has remained much more stable than the depth to water in other areas that rely on the aquifer for irriga-tion, such as the Kansas and Texas High Plains.
Average percent of sand and organic matter (OM) in the top soil (0–150 cm) were estimated from a map of a soil layer with the Soil Survey Geog-raphy (SSURGO) Mapunit Key (mukey). Each mukey is associated with spe-cific soil characteristics (sand, silt, clay, organic matter, etc.). The soil layer was downloaded from SSURGO using the Web Soil Survey (WSS) operated by the USDA Natural Resources Conservation Service (NRCS) (WSS, 2017). Effective hydraulic conductivity (Keff) was calculated from soil texture layers in the test hole, collected by the School of Natural Resources (SNR) at the University of Nebraska–Lincoln (UNL) (SNR-UNL, 2017). The Keff was esti-mated based on vertical flow through soil layers. The saturated hydraulic conductivity (Ks) in each soil layer was predicted by the pedotransfer func-tion in the ROSETTA database in HYDRUS-1D based on soil textures, which were obtained from the UNL-CSD test hole database.
Weather data, including monthly precipitation and maximum and mini-mum air temperature, were collected from the Parameter Elevation Regres-sion on Independent Slopes Model (PRISM) Climate Group provided by the Oregon State University (PRISM, 2017). Land-use nitrate export coefficients were used for determining the annual average nitrate loading around each well under each year during 2004–2013. The land use data layers (2004–2013) were collected from the U.S. Department of Agriculture (USDA-NASS, 2016). The nitrate export coefficient for each land cover, which can indi-cate the amount of nitrates available for leaching from the surface due to inputs of fertilizers, crop residues, and atmospheric deposition (Reckhow and Simpson, 1980), were found using literature sources such as Parn et al. (2012) and Keeler and Polasky (2014). In this study, we used the nitrate ex-port coefficients from Keeler and Polasky (2014) as shown in Table 5.
Juntakut e t al . in Journal of Contaminant Hydrology ( 2018 ) 19
3. Results and discussion
3.1. Long-term trends of groundwater nitrate concentration
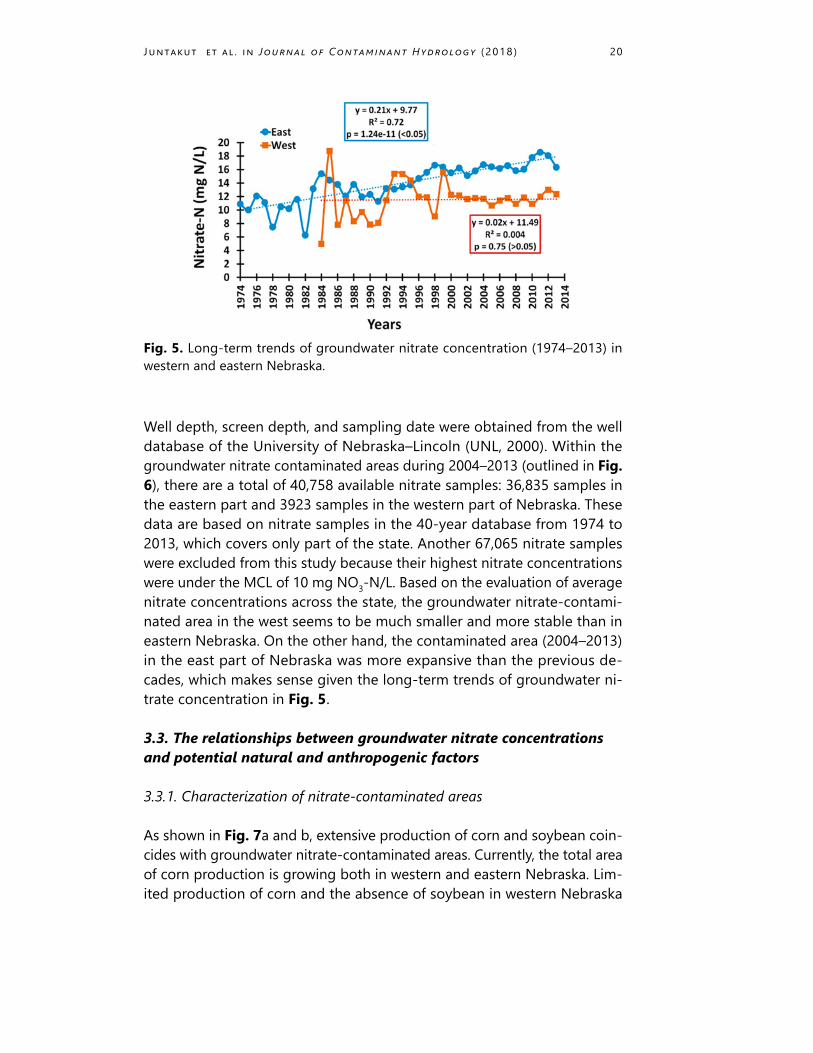
Fig. 5 presents long-term trends of groundwater nitrate concentration (1974–2013) in western and eastern Nebraska. Average annual groundwater nitrate concentrations in eastern Nebraska are increasing (p < .05), proba-bly due to an increase in the intensity of crop production and the adoption of center pivots. Nitrate concentrations remain stable in the west, despite increasing irrigation intensity. Many of Nebraska’s groundwater manage-ment programs implemented since 1988 may have reduced the loading contributing to increasing nitrate concentrations. Interestingly, it is only af-ter the programs started that a clear upward trend begins in eastern wells, possibly a result of legacy nitrates reaching the water table.
3.2. Spatial distribution of groundwater nitrate contamination
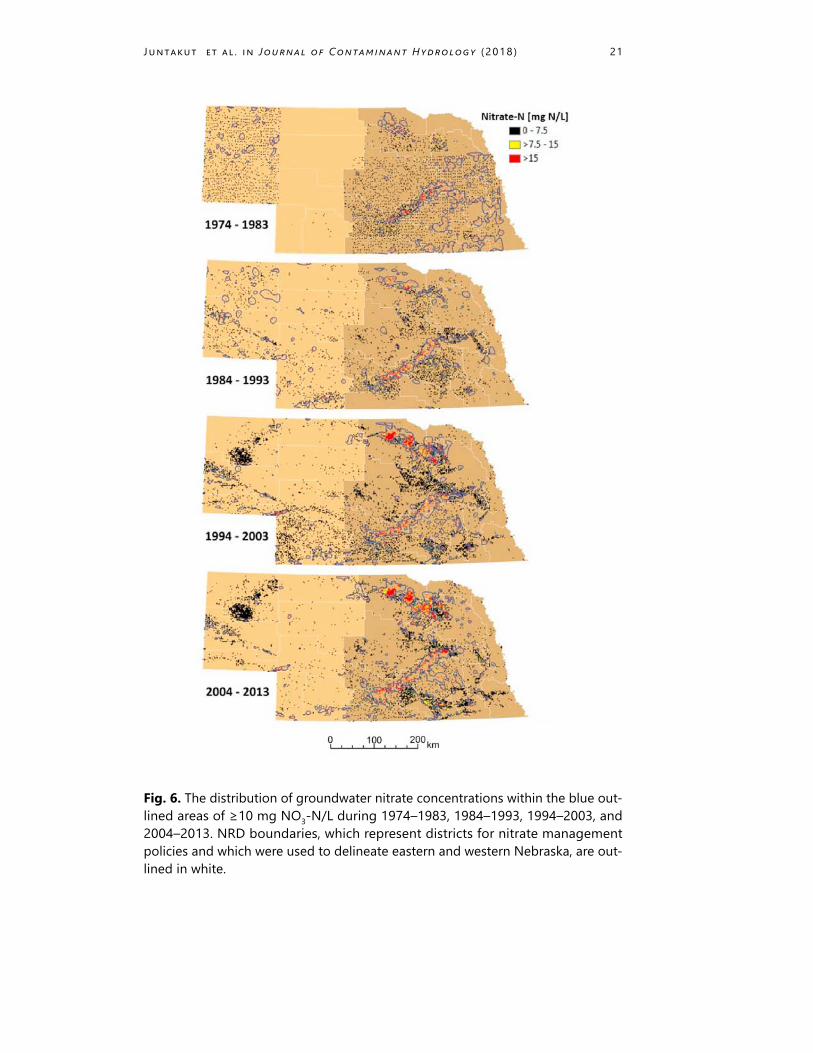
Fig. 6 shows the contaminated areas of groundwater nitrate concentrations ≥10 mg NO3-N/L during each of the previous four decades in Nebraska.
Table 5. Nitrate export coefficients assigned to land use codes based on 2004 to 2013 cropland data layer and Keeler and Polasky (2014).
Land use Land use Nitrate-N loadingcodes description (kg/ha/yr)
1 Corn 50.954 Sorghum 7.565 Soybeans 22.256 Sunflowers 7.5612 Sweet corn 50.9513 Popcorn 50.9524 Winter wheat 7.5626 Double crop winter wheat/soybeans 22.2527 Rye 7.5628 Oats 7.5629 Millet 7.5636 Alfalfa 10.1642 Dry beans 7.5644 Other crops 10.16141 Deciduous forest 3.72176 Pasture 3.2190 Wetlands 1.44225 Double crop winter wheat/corn 50.95241 Double crop corn/soybeans 50.95
Juntakut e t al . in Journal of Contaminant Hydrology ( 2018 ) 20
Well depth, screen depth, and sampling date were obtained from the well database of the University of Nebraska–Lincoln (UNL, 2000). Within the groundwater nitrate contaminated areas during 2004–2013 (outlined in Fig. 6), there are a total of 40,758 available nitrate samples: 36,835 samples in the eastern part and 3923 samples in the western part of Nebraska. These data are based on nitrate samples in the 40-year database from 1974 to 2013, which covers only part of the state. Another 67,065 nitrate samples were excluded from this study because their highest nitrate concentrations were under the MCL of 10 mg NO3-N/L. Based on the evaluation of average nitrate concentrations across the state, the groundwater nitrate-contami-nated area in the west seems to be much smaller and more stable than in eastern Nebraska. On the other hand, the contaminated area (2004–2013) in the east part of Nebraska was more expansive than the previous de-cades, which makes sense given the long-term trends of groundwater ni-trate concentration in Fig. 5.
3.3. The relationships between groundwater nitrate concentrations and potential natural and anthropogenic factors
3.3.1. Characterization of nitrate-contaminated areas
As shown in Fig. 7a and b, extensive production of corn and soybean coin-cides with groundwater nitrate-contaminated areas. Currently, the total area of corn production is growing both in western and eastern Nebraska. Lim-ited production of corn and the absence of soybean in western Nebraska
Fig. 5. Long-term trends of groundwater nitrate concentration (1974–2013) in western and eastern Nebraska.
Juntakut e t al . in Journal of Contaminant Hydrology ( 2018 ) 21
Fig. 6. The distribution of groundwater nitrate concentrations within the blue out-lined areas of ≥10 mg NO3-N/L during 1974–1983, 1984–1993, 1994–2003, and 2004–2013. NRD boundaries, which represent districts for nitrate management policies and which were used to delineate eastern and western Nebraska, are out-lined in white.

Juntakut e t al . in Journal of Contaminant Hydrology ( 2018 ) 22
Fig. 7. Anthropogenic factors: (a) years of corn production between 2002 and 2014, (b) years of soybean production between 2002 and 2014, (c) ir-rigation systems, and (d) irrigated and non-irrigated (dryland) crops, with groundwater nitrate concentrations within the red outlined areas of ≥10 mg NO3-N/L during 2004–2013. (continued)
Juntakut e t al . in Journal of Contaminant Hydrology ( 2018 ) 23
resulted in limited groundwater nitrate-contaminated areas in western Ne-braska compared to eastern Nebraska. Groundwater nitrate-contaminated areas are primarily irrigated with gravity irrigation systems in the eastern central part of Nebraska. This contamination is likely due to more water ponding in this type of irrigation, both within furrows and as tailwater. Con-taminated areas tend not to occur in non-irrigated (dryland) agricultural
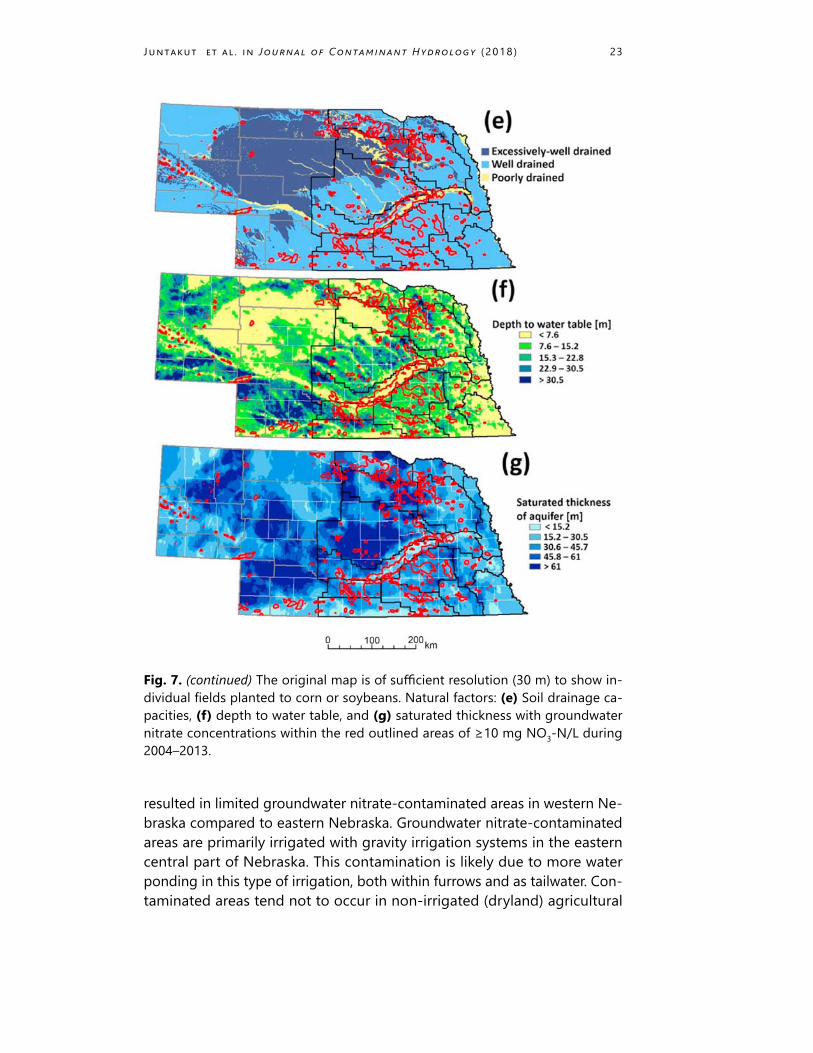
Fig. 7. (continued) The original map is of sufficient resolution (30 m) to show in-dividual fields planted to corn or soybeans. Natural factors: (e) Soil drainage ca-pacities, (f) depth to water table, and (g) saturated thickness with groundwater nitrate concentrations within the red outlined areas of ≥10 mg NO3-N/L during 2004–2013.
Juntakut e t al . in Journal of Contaminant Hydrology ( 2018 ) 24
areas, where less water recharges than in the irrigated areas, particularly in southeastern Nebraska. In the west, smaller groundwater nitrate-contami-nated areas were found in areas of dryland production and larger saturated thickness of the aquifer, as shown in Fig. 7c and d.
The soil drainage capacity can be an important factor in system re-sponse to nitrate applications. In the north-eastern part of the state, es-pecially around the boundary between the Upper Elkhorn and Lower Elk-horn NRDs (Fig. 7e), groundwater under well-drained and excessively well-drained soils frequently exceeds the maximum contaminant level (MCL) of 10 mg NO3-N/L. This is in accordance with Spalding and Hirsh (2012), who mention that the north-eastern area of the state has faced groundwater nitrate contamination beneath intensively spray-irrigated areas with coarse-textured soils. In fact, high levels of nitrate concentra-tion occur in some areas where there is poor soil drainage, particularly in riparian areas in the central-eastern part of the state, such as the Platte River Valley in the Central Platte NRD (Fig. 7e). In the past, gravity irriga-tion dominated these areas. Although soil drainage is low compared to sand, extended ponding time within furrows could have caused greater leaching (Spalding et al., 1978). Extensive groundwater-surface water con-nectivity may also influence nitrate concentrations, and tributaries feeding the Platte River may also contribute nitrate to groundwater. The applica-tion rates of anhydrous ammonia fertilizer declined during the 1980’s in the central area of the state due to lower crop prices (Exner et al., 2010). In comparison with the edges of the state, more of central Nebraska is well drained to excessively well-drained, to the extent that row crop pro-duction is not economically feasible. This part of the state is known as the Sand Hills and is visible as the large area of low crop production in Fig. 7. Except for a few intensively farmed areas near Alliance, Nebraska, the north central part of the state has not been threatened as intensively from high groundwater nitrate contamination, despite the vulnerability of the aquifer in areas with sandy soils.
The depth to the water table plays a significant role in predicting groundwater nitrate concentration. A deeper depth to water table reduces the probability for nitrate contamination compared with a shallower wa-ter table (i.e. thin vadose zone). This was found in both western and east-ern Nebraska (Fig. 7f) and is consistent with the previous studies such as Spalding and Hirsh (2012) and Exner et al. (2014). In addition, the saturated thickness of the aquifer also influences groundwater nitrate concentrations, likely due to dilution and mixing. Areas with greater saturated thickness in both western and eastern Nebraska have lower nitrate concentrations in groundwater (Fig. 7g).
Juntakut e t al . in Journal of Contaminant Hydrology ( 2018 ) 25
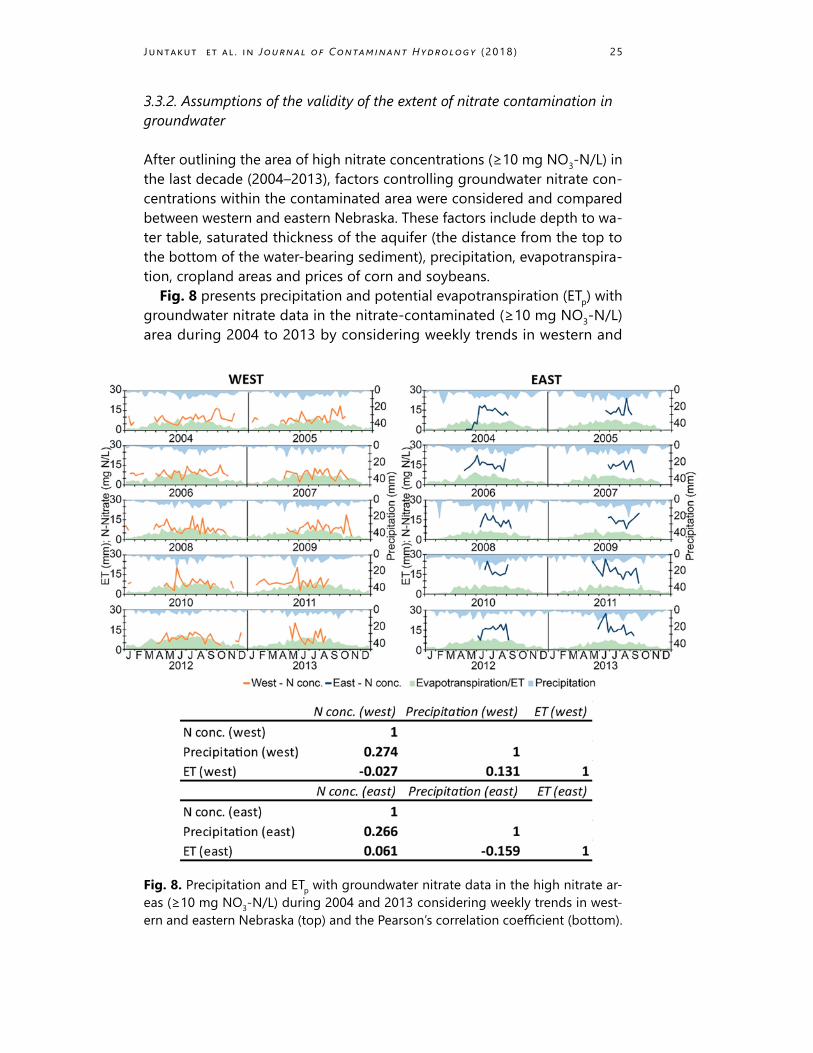
3.3.2. Assumptions of the validity of the extent of nitrate contamination in groundwater
After outlining the area of high nitrate concentrations (≥10 mg NO3-N/L) in the last decade (2004–2013), factors controlling groundwater nitrate con-centrations within the contaminated area were considered and compared between western and eastern Nebraska. These factors include depth to wa-ter table, saturated thickness of the aquifer (the distance from the top to the bottom of the water-bearing sediment), precipitation, evapotranspira-tion, cropland areas and prices of corn and soybeans.
Fig. 8 presents precipitation and potential evapotranspiration (ETp) with groundwater nitrate data in the nitrate-contaminated (≥10 mg NO3-N/L) area during 2004 to 2013 by considering weekly trends in western and
Fig. 8. Precipitation and ETp with groundwater nitrate data in the high nitrate ar-eas (≥10 mg NO3-N/L) during 2004 and 2013 considering weekly trends in west-ern and eastern Nebraska (top) and the Pearson’s correlation coefficient (bottom).

Juntakut e t al . in Journal of Contaminant Hydrology ( 2018 ) 26
eastern Nebraska. Precipitation has a statistically significant correlation (p < .05) with nitrate concentrations in both western and eastern Nebraska (Fig. S3). Total annual precipitation in the eastern part of Nebraska is higher than in the western region (Fig. 8). The ETp differs slightly between western and eastern Nebraska when considering irrigated cropland. ETp is not sig-nificantly related with groundwater nitrate concentrations (p > .05) (Fig. S3). However, precipitation and ETp each show a small Pearson’s correlation coefficient (~0.27 between precipitation and nitrate concentrations in both west and east, and −0.03 and 0.06 between ETp and nitrate concentrations in west and east, respectively) (Fig. 8).
Fig. 9 presents high nitrate (≥10 mg NO3-N/L) and lower nitrate (< 10 mg NO3-N/L) areas under different irrigation systems in western and east-ern Nebraska. Based on this study, center pivot irrigated areas have less risk of groundwater nitrate contamination than gravity irrigation systems. In eastern Nebraska (2,590,005 ha of irrigated area), there is about three times more irrigated area than in the west (806,898 ha of irrigated area), and the increased density of irrigated crops is directly related to high ni-trate in groundwater. These graphs were created by overlaying a map of center pivot and gravity irrigated land with the map of nitrate-contam-inated areas in 2004–2013. The total amount of land for each irrigation technology was then compared with the irrigated land from 2012 from MO-DIS-MIrAD falling within an identified nitrate-contamination zone (Fig. 6). Irrigation technology was obtained from USGS (http://earlywarning.usgs.gov/USirrigation).
Commodity prices are a strong driver of crop and nutrient manage-ment, and very likely play a leading role in increasing groundwater nitrate
Fig. 9. Areas of high (or at the maximum contaminant level, MCL) nitrate concen-trations (≥ exceeding 10 mg NO3-N/L) and low (below the MCL) nitrate concen-trations (< 10 mg NO3-N/L) under different irrigation systems in western and east-ern Nebraska.

Juntakut e t al . in Journal of Contaminant Hydrology ( 2018 ) 27
concentrations. Fig. 10 compares corn prices, area of production and groundwater nitrate concentrations in western and eastern Nebraska during 2002 to 2014. Corn price and production area have a correlation coefficient of 0.84. Application of nitrogen fertilizer is higher when corn production ar-eas increase, but the trend of groundwater nitrate concentrations shows a smaller correlation coefficient (0.48 for eastern Nebraska and 0.59 for west-ern Nebraska) with corn production areas, as compared to corn prices (0.61 for both east and west). This implies that nitrogen is applied more inten-sively (less crop rotation) when corn prices are high, which may lead to in-creases in nitrate leaching to groundwater.
3.4. Estimation of groundwater nitrate concentrations based on CART model
Groundwater nitrate concentrations were forecast in western and eastern Nebraska through the optimized CART model. We found that vadose zone thickness, effective hydraulic conductivity, and saturated thickness were the most significant factors influencing groundwater nitrate concentrations in western Nebraska with an explanatory power of 30%, 16% and 12%, re-spectively, i.e. vadose zone thickness accounted for 30% of the total vari-ability in nitrate concentrations. In eastern Nebraska, the most influential factors were average percent of sand in the top 0–150 cm of soil (21%), well depth (18%), and effective hydraulic conductivity (14%) (Fig. 11). The explanatory power is a measure of how much of the nitrate concentration
Fig. 10. The comparison of corn prices, production area and groundwater nitrate concentrations in western and eastern Nebraska, 2002 to 2014.

Juntakut e t al . in Journal of Contaminant Hydrology ( 2018 ) 28
can be attributed to each of these factors. The results of the model show the mean absolute error in predicting nitrate concentrations are 4.87 mg NO3-N/L (west) and 3.51 mg NO3-N/L (east). The relative errors are 32% (west) and 19% (east) as presented in Table 6. This indicates that the CART model can be used to predict groundwater nitrate concentrations most ac-curately in eastern Nebraska, which is unsurprising given the larger quan-tity of data available in the east.
Fig. 11. The output of CART pruning tree for groundwater nitrate concentration prediction in western and eastern Nebraska.

Juntakut e t al . in Journal of Contaminant Hydrology ( 2018 ) 29
4. Conclusions
This study confirms that nitrate contaminated areas are expanding and new areas continue to emerge beneath irrigated cropland in Nebraska, particu-larly in the east. It is possible that some wells within the identified high-ni-trate areas are still below MCL as all existing wells were not included in the database. However, nitrate concentrations in additional wells can be pre-dicted using the optimal CART model of this study, with an expected accu-racy of about 70–80%. The trends of increasing groundwater nitrate con-centrations have occurred only in eastern Nebraska following an increase in the intensity of crop production and irrigation. While the rate of increase of average nitrate groundwater concentration has slowed in some areas un-der the Nebraska’s GWQMP, intense irrigation increases the rate of nitrate leaching to groundwater.
This study additionally shows that the areal extent and growth of con-taminated groundwater in predominately center pivot-irrigated areas is lower than beneath gravity-irrigated areas. Converting from gravity irri-gation to center pivot may help to protect against the expansion of ni-trate-contaminated groundwater. Based on this study, the spatial differ-ences in climate, soil, cropping, irrigation and vadose zone characteristics
Table 6. The error of the CART model after the validation.
Data WEST EAST
No. of NO3-N Absolute Relative No. of NO3-N Absolute Relative observations conc. error (mg N/L) error (%) observations conc. error (mg N/L) error (%)
Node # 1 Node # 1 Training 421 5.41 2.44 31.08 3,941 11.33 3.93 25.75 Testing 10 7.85 564 15.26Node # 2 Node # 2 Training 1,274 8.65 5.07 37.08 1,796 12.73 5.18 28.92 Testing 136 13.67 266 17.91Node # 3 Node # 3 Training 812 11.59 5.83 33.46 3,548 16.44 2.09 11.28 Testing 83 17.42 685 18.53Node # 4 Node # 4 Training 44 23.13 0.67 2.98 1,025 24.14 2.85 10.56 Testing 13 22.46 199 26.99Node # 5 Training 19 28.85 10.33 55.77 Testing 44 18.52Min 10 5.41 0.67 2.98 29 11.33 2.09 10.56Max 1,274 28.85 10.33 55.77 3,941 40.09 5.18 28.92Mean 286 15.75 4.87 32.08 1,202 21.57 3.51 19.13

Juntakut e t al . in Journal of Contaminant Hydrology ( 2018 ) 30
(e.g. precipitation, ET, soil drainage capacities, depth to water table) signif-icantly predict groundwater nitrate concentrations in western and eastern Nebraska. Thus, the investigation of soil nitrogen processes and nitrate flux through soil into groundwater under climate variability and the complexi-ties of aquifer and vadose zone characteristics are key for analyzing the oc-currence of nitrate contamination in Nebraska’s groundwater.
The CART model was used to identify the relative importance of well attributes, soil and vadose zone characteristics, weather conditions, and nonpoint-source N inputs for each well with groundwater nitrate concen-trations. Physical characteristics – geography and well construction – were found to be significant, irrespective of well type (irrigation, monitoring, or domestic). This supports Burow et al.’s (2010) use of monitoring wells for predicting groundwater nitrate concentrations in CART modeling. Vadose zone thickness and well depth were found to be the most significant fac-tors affecting groundwater nitrate concentrations in western Nebraska, with an explanatory power of 30%, 16%, and 12%, respectively. The most influ-ential factors included average percent of sand in the 0–150 cm topsoil (21%), well depth (18%), and effective hydraulic conductivity (14%) in east-ern Nebraska. After testing the model, we conclude that the CART model can be applied to predict groundwater nitrate concentrations from those influential factors. The CART model proved to be useful for both prediction of groundwater nitrate concentrations, and for identifying potential fac-tors that could place areas at greater risk for groundwater contamination.
Acknowledgments — This paper is the result of an effort between the Nebraska Water Center (NWC) and the Water Sciences Laboratory at the University of Ne-braska–Lincoln to protect Nebraska’s drinking water resources. The authors are thankful for all postdoctoral researchers under the NWC who gave scientific guid-ance, participated in discussions, and provided expertise that greatly assisted the study.
Appendix A. Supplementary data — Supplementary data for this article can be found following the References
References
Adelman, D.D., Schroeder, W.J., Smaus, R.J., Wallin, G.P., 1985. Overview of nitrate in Nebraska’s ground water. Trans. Nebraska Acad. Sci. Affiliat. Soc. 220. http://digitalcommons.unl.edu/tnas/220
Breiman, L., Friedman, J.H., Olshen, R., Stone, C.J., 1984. Classification and Regression Tree. Wadsworth & Brooks/Cole Advanced Books & Software, Pacific California.

Juntakut e t al . in Journal of Contaminant Hydrology ( 2018 ) 31
Burow, K.R., Nolan, B.T., Rupert, M.G., Dubrovsky, N.M., 2010. Nitrate in groundwater of the United States, 1991–2003. Environ. Sci. Technol. 44, 4988–4997. Comly, H.H., 1945. Cyanosis in infants caused by nitrate in well water. JAMA 129, 112–116.
CPNRD (Central Platte Natural Resources District), 2016. Groundwater Management Plan. Grand Island, Nebr. http://cpnrd.org/groundwater-quality/
Dappen, P., Merchant, J., Ratcliffe, I., Robbins, C., 2007. Delineation of 2005 land use patterns for the state of Nebraska department of natural resources. Final Rep. Lincoln. NE. http://www.calmit.unl.edu/2005landuse/data/2005_NE_landuse_finalreport.pdf
Dobbin, K.K., Simon, R.M., 2011. Optimally splitting cases for training and testing high dimensional classifiers. BMC Med. Genet. 4 (31). http://www.biomedcentral.com/1755-8794/4/31
Exner, M.E., Hirsh, A.J., Spalding, R.F., 2014. Nebraska’s groundwater legacy: nitrate contamination beneath irrigated cropland. Water Resour. Res. 50, 4474–4489. doi 10.1002/2013WR015073
Exner, M.E., Perea-Estrada, H., Spalding, R.F., 2010. Long-term response of groundwater nitrate concentrations to management regulations in Nebraska’s central Platte valley. Sci. World J. 10, 286–297. doi 10.1100/tsw.2010.25
Exner, M.E., Spalding, R.F., 1976. Groundwater quality of the central Platte region, 1974. Lincoln, University of Nebraska–Lincoln, Conservation and Survey Division Resource Atlas No. 2, (47 p).
Exner, M.E., Spalding, R.F., 1994. N-15 identification of nonpoint sources of nitrate contamination beneath cropland in the Nebraska Panhandle: two case studies. Appl. Geochem. 9 (1), 73–81. doi 10.1016/0883-2927(94)90054-X
Ferguson, R.B., 2015. Groundwater quality and nitrogen use efficiency in Nebraska’s Central Platte River valley. J. Environ. Qual. 44, 449–459. doi 10.2134/jeq2014.02.0085
Ferguson, R.B., Shapiro, C.A., Dobermann, A.R., Wortmann, C.S., 2006. Fertilizer Recommendations for Soybean. University of Nebraska–Lincoln Extension educational programs. http://digitalcommons.unl.edu/extensionhist/1714 Accessed July 2, 2018.
Grassini, P., Yang, H., Irmak, S., Rees, J., Cassman, K.G., 2012. Evaluation of Water Productivity and Irrigation Efficiency in Nebraska Corn Production. University of Nebraska–Lincoln Extension EC105.
Gurdak, J.J., McMahon, P.B., Dennehy, K.F., Qi, S.L., 2009. Water quality in the High Plains aquifer, Colorado, Kansas, Nebraska, New Mexico, Oklahoma, South Dakota, Texas, and Wyoming, 1999–2004. U.S. Geol. Survey Circular. 1337, 63.
Gurdak, J.J., Qi, S.L., 2006. Vulnerability of recently recharged ground water in the High Plains aquifer to nitrate contamination. U.S. Geol. Survey Sci. Invest. Rep. 2006–5050, 39.
Gutentag, E.D., Heimes, F.J., Krothe, N.C., Luckey, R.R., Weeks, J.B., 1984. Geohydrology of the High Plains Aquifer in parts of Colorado, Kansas, Nebraska, New Mexico, Oklahoma, South Dakota, Texas and Wyoming. U.S. In: Geological Survey Professional Paper 1400-B. https://pubs.usgs.gov/pp/1400b/report.pdf

Juntakut e t al . in Journal of Contaminant Hydrology ( 2018 ) 32
Haacker, E.M., Kendall, A.D., Hyndman, D.W., 2016. Water level declines in the High Plains Aquifer: predevelopment to resource senescence. Groundwater 54 (2), 231–242.
Hiller, T.L., Powell, L.A., McCoy, T.D., Lusk, J.J., 2009. Long-term agricultural land-use trends in Nebraska. 1866–2007. Great Plains Res. 19, 225–237.
HPRCC (High Plains Regional Climate Center), 2016. HPRCC Climate Summaries. https://hprcc.unl.edu/climatesummaries.php Accessed July 2, 2018.
Keeler, B.L., Polasky, S., 2014. Land-use change and costs to rural households: a case study in groundwater nitrate contamination. Environ. Res. Lett. 9, 074002. doi 10.1088/1748-9326/9/7/074002
Kross, B.C., Olson, M.L., Ayebo, A., Johnson, J.K., 1995. In: Rechchigl, J.E. (Ed.), In Soil Amendments: Impacts on Biotic Systems. Lewis Publishers, Boca Raton, pp. 153–214.
Lockhart, K.M., King, A.M., Harter, T., 2013. Identifying sources of groundwater nitrate contamination in a large alluvial groundwater basin with highly diversified intensive agricultural production. J. Contam. Hydrol. 151, 140–154. doi 10.1016/j.jconhyd.2013.05.008
Loh, W.Y., 2011. Classification and Regression Trees. John Wiley & Sons, Inc. WIREs Data Mining Knowl. Discov. 1. pp. 14–23. doi 10.1002/widm.8
McGuire, V.L., 2017. Water-level and recoverable water in storage changes, High Plains aquifer, predevelopment to 2015 and 2013–15 (No. 2017–5040). US Geological Survey.
Mingers, J., 1989. An empirical comparison of pruning methods for decision tree induction. Mach. Learn. 4, 227–243.
Monteith, J.L., 1965. Evaporation and the environment. In: Proc. 19th Symp. Society for Experimental Biology: The State and Movement of Water in Living Organisms. Cambridge University Press, Cambridge, U.K., pp. 205–234.
Murgulet, D., Tick, G.R., 2013. Understanding the sources and fate of nitrate in a highly developed aquifer system. J. Contam. Hydrol. 155, 69–81. doi 10.1016/j.jconhyd.2013.09.004
NAS (National Academy of Sciences), 1995. Board on Environmental Studies and Toxicology. Nitrate and Nitrite in Drinking Water. National Academy of Sciences, Washington, D.C.. https://www.nap.edu/read/9038/chapter/3 Accessed June 22, 2018.
NDEQ (Nebraska Department of Environmental Quality), 2015. 2015 Nebraska Groundwater Quality Monitoring Report. Annual Rep. Lincoln, NE. http://deq.ne.gov/publica.nsf/Pages/WAT230 Accessed May 12, 2018.
Nolan, B.T., Hitt, K.J., 2006. Vulnerability of shallow groundwater and drinking-water wells to nitrate in the United States. Environ. Sci. Technol. 40 (24), 7834–7840.
Nolan, B.T., Ruddy, B.C., Hitt, K.J., Helsel, D.R., 1997. Risk of nitrate in groundwaters of the United States – A national perspective. Environ. Sci. Technol. 31 (8), 2229–2236.
NRD (Nebraska’s Natural Resources Districts), 2017. NRD Groundwater Management Summary. https://www.nrdnet.org/sites/default/files/groundwater_management_summary_2017__1.pdf Accessed June 20, 2018.

Juntakut e t al . in Journal of Contaminant Hydrology ( 2018 ) 33
Parn, J., Pinary, G., Mander, U., 2012. Indicators of nutrients transport from agricultural catchments under temperate climate: a review. Ecol. Indic. 22, 4–15.
PRISM, 2017. The Parameter Elevation Regression on Independent Slopes Model (PRISM) Climate Group. http://prism.oregonstate.edu/
Qi, C.S., Yu, Z.H., Hou, Z., 2010. Study on quality prediction of the complex production based on CART algorithm. Modul. Mach. Tool Automatic Manuf. Tech. 3, 94–97.
Reckhow, K., Simpson, J., 1980. A procedure using modeling and error analysis for the prediction of lake phosphorus concentration from land use information. Can. J. Fish. Aquat. Sci. 37, 1439–1448.
Sattelmacher, P.G., 1962. Methemoglobinemia from nitrates in drinking water, Schriftenreiche des Vererins fur Wasser Boden und Lufthygiene. (No. 21).
Scanlon, B.R., Faunt, C.C., Longuevergne, L., Reedy, R.C., Alley, W.M., McGuire, V.L., McMahon, P.B., 2012. Groundwater depletion and sustainability of irrigation in the US High Plains and Central Valley. Proc. Natl. Acad. Sci. 109 (24), 9320–9325.
Schepers, J.S., Moravek, M.G., Alberts, E.E., Frank, K.D., 1991. Maize production impacts on groundwater quality. J. Environ. Qual. 20, 12–16.
School of Natural Resources, 2015. Water GIS data, Institute of Agriculture and Natural Resources. College of Arts and Sciences. University of Nebraska–Lincoln, Lincoln. Nebr. http://snr.unl.edu/data/geographygis/water.aspx Accessed July 2, 2018.
Shapiro, C.A., Ferguson, R.B., Hergert, G.W., Wortmann, C.S., Walter, D.T., 2008. Fertilizer suggestions for corn. University of Nebraska–Lincoln Extension educational programs. http://extensionpublications.unl.edu/assets/pdf/ec117.pdf
Simon, C., Manzke, H., Kay, H., Mrowetz, G., 1964. Occurrence, pathogenesis, and possible prophylaxis of nitrite induced methemoglobinemia. Z. Kinderheilkunde 91, 124–138.
SNR-UNL, 2017. The School of Natural Resources at the University of Nebraska Lincoln. Test Hole Map Viewer. http://snr.unl.edu/data/geologysoils/NebraskaTestHole/NebraskaTestHoleMap.aspx Accessed July 2, 2018.
Spalding, R.F., 1975. Effects of land use and river seepage on groundwater quality in Hall County. Nebraska: Nebraska Water Survey Paper No. 38, p. 95.
Spalding, R.F., Exner, M.E., 1993. Occurrence of nitrate in groundwater — A review. J. Environ. Qual. 22 (3), 392–402. doi 10.2134/jeq1993.00472425002200030002x.
Spalding, R.F., Gormly, J.R., Curtiss, B.H., Exner, M.E., 1978. Nonpoint nitrate contamination of ground water in Merrick County, Nebraska. Groundwater 16 (2), 86–95. doi 10.1111/j.1745-6584.1978.tb03207.x
Spalding, R.F., Hirsh, A.J., 2012. Risk-managed approach for routing petroleum pipelines: keystone XL pipeline, Nebraska. Environ. Sci. Technol. 46, 12754–12758. doi 10.1021/es303238z

Juntakut e t al . in Journal of Contaminant Hydrology ( 2018 ) 34
Stanton, J.S., Lynne, F., 2006. Ground-water quality beneath irrigated cropland of the northern and southern High Plains aquifer. Nebraska and Texas. 2003–04. U.S. Geological Survey Scientific Investigations Report 2006–5196, 95 p.
Tiemann, M., 2017. Safe drinking water act (SDWA): a summary of the act and its major requirements. In: Congressional Research Service. https://fas.org/sgp/crs/misc/RL31243.pdf
U.S. EPA (Environmental Protection Agency), 2004. Understanding the Safe Drinking Water Act. U.S. Environmental Protection Agency, Washington, D.C. https://www.epa.gov/sites/production/files/2015-04/documents/epa816f04030.pdf
U.S. EPA (U.S. Environmental Protection Agency), 2007. Nitrates and nitrites, TEACH Chemical Summary. U.S. Environmental Protection Agency, Washington, D.C. http://www.epa.gov/teach/chem_summ/Nitrates_summary.pdf
U.S. EPA (U.S. Environmental Protection Agency), 2017. National Primary Drinking Water Regulations. U.S. Environmental Protection Agency, Washington, D.C. https://www.epa.gov/ground-water-and-drinking-water/national-primary-drinking-water-regulations#Inorganic
U.S. Public Health Service, 1962. Public Health Service Drinking Water Standards. Publ. 956. U.S. Dept. of Health. Education and Welfare. Public Health Service, Washington, D.C, pp. 47–51. http://archive.org/details/gov.law.usphs.956.1962
UNL (University of Nebraska–Lincoln), 2000. University of Nebraska–Lincoln. Quality-assessed Agrichemical Contaminant Database for Nebraska Ground Water. https://clearinghouse.nebraska.gov/Clearinghouse.aspx Accessed July 2, 2018.
UNL (University of Nebraska–Lincoln), 2010. 2005 Land use mapping. Lincoln, Nebr. http://calmit.unl.edu/2005landuse/statewide.shtml Accessed July 2, 2018.
USDA, 2014. 2012 CENSUS of Agriculture, Nebraska State and County Data. Geogr. Area Ser. Part 27 1 U.S. Depth of Agriculture and National Agricultural Statistics Service. Washington, D.C. https://www.agcensus.usda.gov/Publications/2012/Full_Report/Volume_1,_Chapter_1_State_Level/Nebraska/nev1.pdf
USDA, 2015. Web soil survey, Natural Resources Conservation Service Soils. United States Department of Agriculture (USDA. https://websoilsurvey.sc.egov.usda.gov/App/WebSoilSurvey.aspx
USDA-NASS, 2015. CropScape – cropland data layer, United States Department of Agriculture (USDA). In: National Agricultural Statistics Service (NASS). https://nassgeodata.gmu.edu/CropScape/
USGS, 2000. Water use in Nebraska, 2005. U.S. Geological Survey. Nebraska Water Science Center, Lincoln, Neb. http://ne.water.usgs.gov/infodata/wateruse/
USGS, 2015. Moderate resolution imaging spectroradiometer (MODIS) irrigated agriculture dataset for the United States (MIrAD-US). U.S. Geological Survey. Early Warning and Environmental Monitoring Program. https://earlywarning.usgs.gov/USirrigation

Juntakut e t al . in Journal of Contaminant Hydrology ( 2018 ) 35
Van der Schans, M.L., Harter, T., Leijinse, A., Mathews, M.C., Meyer, R.D., 2009. Characterizing sources of nitrate leaching from an irrigated dairy farm in Merced County, California. J. Contam. Hydrol. 110, 9–21. doi 10.1016/j.jconhyd.2009.06.002
Verstraeten, I.M., Ellis, M.J., 1994. Reconnaissance of ground-water quality in the Papio-Missouri river natural resources district, Eastern Nebraska, July through September 1992. USGS Water-Resour. Invest. Rep. 94–4197.
Verstraeten, I.M., McGuire, V.L., Heckman, K.L., 1998. Hydrogeology and subsurface nitrate in the Upper Big Blue natural resources district, Central Nebraska, July 1995 through September 1997. USGS Water-Resour. Invest. Rep. 98–4207.
Verstraeten, I.M., Sibray, S.S., Cannia, J.C., Tanner, D.Q., 1994. Reconnaissance of ground-water quality in the North Platte natural resources district, Western Nebraska, June–July 1991. USGS Water-Resour. Invest. Rep. 94–4057.
WSS (Web Soil Survey), 2017. The United States Department of Agriculture (USDA) and the Natural Resources Conservation Service (NRCS). https://websoilsurvey.sc.egov.usda.gov/App/HomePage.htm Accessed July 2, 2018.
Yohannes, Y., Webb, P., 1999. Classification and Regression Trees, CARTTM: A User Manual for Identifying Indicators of Vulnerability to Famine and Chronic Food Insecurity. International Food Policy Research Institute http://www.ifpri.org/publication/classification-and-regression-trees-cart
Zhang, L.B., Zhang, Q.Q., Xu, F., 2003. Research and application of the statistical models based on CART. J. Zhejiang Univ. Technol. 30 (4), 315–318.

1
The Long Term Effect of Agricultural, Vadose Zone and Climatic Factors on Nitrate
Contamination in the Nebraska’s Groundwater System
Pongpun Juntakut1,2, Daniel D. Snow3, Erin M. K. Haacker4, and Chittaranjan Ray1,4*
1Department of Civil Engineering, University of Nebraska-Lincoln, Lincoln, NE 68588-6105, Nebraska, USA 2Department of Civil Engineering, Chulachomklao Royal Military Academy, Nakhon Nayok 26001, Thailand
3Water Sciences Laboratory, University of Nebraska, Lincoln, NE 68583, USA 4Nebraska Water Center, University of Nebraska, Lincoln, NE 68588, USA
Corresponding author:
*Chittaranjan Ray ([email protected])
Contents of this file
Figure S1. Root mean square error (RMSE) calculation results for selected interpolation methods
in ArcGIS.
Figure S2. The CART tree before pruning presented 18 resultant nodes in the western part and 7
resultant nodes in the eastern part of Nebraska.
Figure S3. Correlation of precipitation and evapotranspiration with nitrate concentration in
groundwater.
Table S1. Phased approach under the GWQMP program.
Table S2. References involving the investigation of the occurrence of nitrate in Nebraska’s
groundwater.
Table S3. Percent of wells in areas of the nitrate contamination (NO3-N > 10 mg/L) and the non-
contamination (NO3-N ≤ 10 mg/L) in groundwater from interpolating by selected interpolation
methods in ArcGIS.
Introduction
Elevated nitrate concentration in groundwater prompted Nebraska’s Natural Resources
Districts (NRDs) in the 1988 crop season to institute a groundwater quality management program
(GWQMP) using a phased approach. The NRDs and the State of Nebraska defined four classes of
nitrate contamination, labeled Phase I, II, III, and IV. These correspond to nitrate concentrations
of less than 7.5 mg/L (Phase I), 7.6-15 mg/L (Phase II), greater than 15 mg/L (Phase III), and areas
where rates of decline in NO3 concentration have not been satisfactory (Phase IV). Within these
areas, the timing and application rates of nitrogen fertilizer on irrigated agriculture are regulated
differently as presented in supplemental information (Table S1), below.
To control and monitor nitrate contaminations in groundwater, Nebraska state agencies and
NRDs have continuously collected a large number of samples from wells since 1974. These data
are housed at a digitized warehouse at the University of Nebraska. There are 107,823 nitrate
sample measurements in the database during 1974-2013. Several studies have utilized this nitrate
database for the analysis of the long-term nitrate trends in groundwater, the investigation of factors
affecting occurrence of nitrate in groundwater, and the efforts of the reduction of groundwater
nitrate concentrations (< 10 mg N/L) in Nebraska. Table S2 contains summary results of analysis
on 12 references of the investigation of the occurrence of nitrate in Nebraska’s groundwater.

2
Table S1. Phased approach under the Central Platte NRD’s Groundwater Management Quality
Program (Hard, 2013; Exner et al., 2014; CPNRD, 2016).
Phase
Nitrate-N
concentration (mg
N/L)
Management
I
≤ 7.5
The application of nitrogen fertilizer is banned on sandy soils in Fall and
Winter seasons. After November 1st, this application is allowed only on
heavier-textured soil.
II
7.6 - 15
There are many significant regulations in agricultural areas. The application of
nitrogen fertilizer is not allowed until March 1st. Annual soil and irrigation
water tests are required and if manure is to be applied, laboratory analysis and
nutrient accounting is also required. Then, a certification will be created by
NRDs every four years. In terms of irrigation, the measurement of irrigation
water applied to each crop field is required. Annual reporting of crop growth,
nitrogen credits, recommended nitrogen rate, nitrification inhibitor use, soil
and water analyses, nitrogen fertilizer and water applied, and crop yield will be
recorded and presented in public.
III
≥ 15
All requirements of Phase II need to be completed and the application of
nitrogen fertilizer or a nitrification inhibitor has to be regulated strictly.
IV
NO3-N levels in
groundwater is not
declining at
acceptable rate.
All requirements of Phase III need to be completed. Additionally, the rate of
nitrogen fertilizer application must not exceed the NRD recommendation.
Expected yield will be set by the NRD and NRD staff will closely work with
the University of Nebraska for the best management practices (BMPs).
Table S2. References involving the investigation of the occurrence of nitrate in Nebraska’s
groundwater.
Author(s) (year) Study sites Results of analysis
Gormly and Spalding
(1979)
Central Nebraska
(Buffalo, Hall,
and Merrick
counties)
The nitrate-nitrogen (NO3-N) concentrations were examined from
256 ground-water samples during 1976-1977. They investigated the
potential nitrate sources with the isotopic values. They found that
fertilizer was the primary source of contamination in most wells and
only a small percentage of the wells derived from animal wastes.
Adelman et al. (1985) Central Nebraska
(Holt county and
the Central Platte
region)
They presented an overview of nitrate in Nebraska’s groundwater
showing that most nitrate contamination in groundwater was related
to excessive application of commercial fertilizer on irrigated
cropland with sandy topsoil and a shallow groundwater table. Excess
irrigation water resulted more highly soluble nitrate moving down to
the groundwater table. Moreover, they indicated that some rural
people with contaminated wells were using small home distillation
units to provide nitrate-free water.
Schepers et al. (1991) Central Nebraska
(The Central
Platte Natural
Resource District:
CPNRD)
Their work reported results of a nitrogen and water management
program in the CPNRD in Nebraska. They found that NO3-N
contamination of groundwater was directly influenced by yield goals
and N fertilizer application rates. In 1988, yield goals were 42%
higher from the application of excess N fertilizer rate of 148 kg ha-1
which was more than the recommended rates of 100 kg N ha-1 based
on the University of Nebraska recommendations.
Spalding (1991) Nebraska
(93 counties)
NO3-N concentrations in 2,195 rural domestic wells from 93
counties in Nebraska between 1985 and 1989 averaged 6.6 mg N/L

3
and exceeded the MCL in 17.4% of the sampled wells. In addition,
his study indicated that the weighted mean exposure level of NO3-N
concentrations for the rural population using private drinking water
wells was 7.5 mg N/L and the weighted frequency of exposure to
NO3-N levels exceeding the MCL was 20.4%.
Spalding and Exner
(1993)
USA and
Nebraska
More than 200,000 NO3-N data points were estimated to show nitrate
levels in groundwater in the USA. There was a high probability of
exceeding the MCL of 10 mg N/L on irrigated cropland with well-
drained soils. Higher NO3-N concentrations in groundwater occurred
in shallow wells (< 8 m). A significant increase in NO3-N was found
in older wells and in wells with poor construction. High NO3-N
concentrations were widespread in the northeast of Nebraska due to
the poorly constructed wells. The poorly constructed wells were dug
and lined with cement blocks, bricks, tile, or open-jointed materials.
NO3-N concentrations in 60% of the 87 open-jointed wells exceeded
the MCL; however, concentrations in only 18% of the 221
continuously cased wells exceeded the MCL.
Gosselin et al. (1997) Nebraska NO3-N, pesticides, and coliform bacteria from 1,808 rural domestic
wells in Nebraska were examined for the 1994-1995 statewide
assessment of groundwater quality. An average of 19% of domestic
wells in Nebraska were contaminated by nitrates. They suggested
that the application of best management practices and the sanitary
surveys of existing wells will be required to improve the drinking
water quality in rural domestic wells.
U.S. Department of
the Interior (1999)
Nebraska The U.S. Department of the Interior reported that many small city
and village community water systems in Nebraska faced nitrate
concentration in groundwater above the MCL of 10 mg N/L. The
DRASTIC tool was used for statewide analysis of factors affecting
the potential for groundwater nitrate contamination in Nebraska’s
small communities. The result of DRASTIC showed that the regions
which have two or more of these conditions: intensive agricultural
practices, permeable soils, or shallow water tables; were likely to
cause elevated levels of groundwater nitrate concentrations above
the MCL of 10 mg N/L.
McGinnis and Davis
(2001)
Eastern Nebraska
(The Omaha and
the Santee Sioux
Reservations)
42 wells in the Omaha Reservation between 27 July and 4 August
1994 and 40 wells in the Santee Sioux Reservation during June, July,
and August of 1996 were sampled and analyzed for chemical
parameters such as sulfate, chloride, sodium, calcium, magnesium,
pH, iron, manganese, NO3-N, total dissolved solids, conductivity,
hardness, fluoride, alkalinity, and total coliform bacteria. The results
of this study reported that both reservations (Omaha and Santee
Sioux) had a high percentage of domestic wells containing coliform
bacteria and exceeding the MCL of nitrate-nitrogen (> 10 mg N/L).
Furthermore, they indicated that the occurrence of the
contaminations was linked to factors such as well construction,
maintenance, and land use.
Exner et al. (2010) Central Nebraska The long-term groundwater nitrate concentration trend during 1988-
2003 (16 years) was estimated and shown to have a significant
decrease at the slow rate of 0.26 mg N/L/year (p < 0.0001) on the
terrace of Nebraska’s Central Platte River valley under the GWQMP.
However, average groundwater nitrate concentrations on the
bottomland did not change over the same time period, while N
fertilizer application rates on the terrace remained unchanged during
the study. The management practices under the GWQMP in the
Central Platte Natural Resources District can reduce groundwater

4
nitrate concentrations. The conversion from furrow irrigation to
sprinkler irrigation can reduce groundwater nitrate concentration
about 50%.
Meals et al. (2012) Central Nebraska
(The Central
Platte Natural
Resource District:
CPNRD)
The Nebraska National Institute of Food and Agriculture-
Conservation Effects Assessment Project (NIFA-CEAP) on a Phase
III management area in the CPNRD for the period of 1988 to 2006
(19 years) was described to evaluate the effectiveness of farm
management practices in lowering groundwater nitrate
concentrations underneath irrigated-corn production. Management
practices commonly included the conversion from furrow to
sprinkler irrigation and the improvement of nutrient management.
They concluded that N fertilizer applications, crop canopy sensors,
and more sprinkler irrigation were required for achieving further
reduction in N leaching into groundwater.
Exner et al. (2014) Eastern and
central Nebraska
They analysed 17 management areas with a 31 year record (1981-
2010) of approximately 44,000 nitrate samples from about 11,500
irrigation wells across the eastern and central Nebraska. They
reported that average annual groundwater nitrate concentrations in
10 of the management areas have been significantly increasing (p <
0.05) without yet reaching a steady state, unless the application of
nitrogen fertilizer has been controlled by the GWQMP program. In
addition, they illustrated the decadal expansion of groundwater
nitrate contamination considering areal characteristics, such as
irrigation application methods, soil drainage capacities, distribution
of irrigated and non-irrigated row crops, and years of corn
production.
Ferguson (2015) Central Nebraska
(Central Platte
River Valley)
The study attempted to reduce the groundwater nitrate contamination
in the Platte River Valley of Nebraska by improving nitrogen use
efficiency (NUE) in crops. According to the researcher’s study, the
requirement of N management practices, such as N timing use,
fertigation, controlled-release N formulation, and use of crop sensors
for N application should be considered to increase NUE for the
reduction of nitrate in groundwater. Additionally, this study
suggested that the change from furrow to sprinkler irrigation can also
decrease nitrate concentration in groundwater.

5
Figure S1. Root mean square error (RMSE) calculation results for selected interpolation methods in
ArcGIS.
Table S3. Percent of wells in areas of nitrate contamination (NO3-N > 10 mg/L) and non-
contamination (NO3-N ≤ 10 mg/L) in groundwater from interpolating by selected interpolation
methods in ArcGIS.
2004-2013
Interpolation
methods
Number of wells Percent (%)
NO3-N
≤ 10 mg/L
NO3-N
> 10 mg/L
Sum NO3-N
≤ 10 mg/L
NO3-N
> 10 mg/L
Contaminated
area
IDW 312 2,354 2,666 12 88
Ordinary Kriging 560 2,034 2,594 22 78
Topo to Raster 220 2,315 2,535 9 91
Natural Neighbor 177 2,334 2,511 7 93
Non-
contaminated
area
IDW 6,583 68 6,651 99 1
Ordinary Kriging 6,335 388 6,723 94 6
Topo to Raster 6,675 107 6,782 98 2
Natural Neighbor 6,718 88 6,806 99 1

6
Figure S2. The CART tree before pruning presented 18 resultant nodes in the western part and 7
resultant nodes in the eastern part of Nebraska. Note the data uses US unit of the foot, which is
approximately 30 cm.
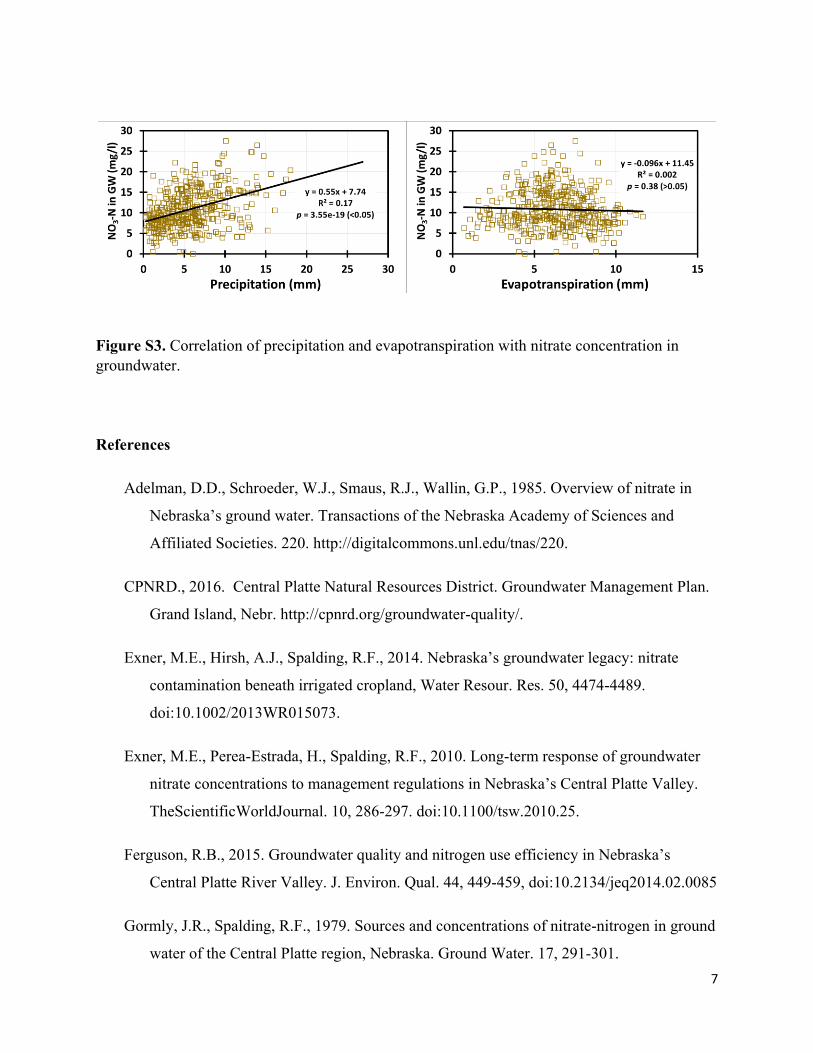
7
Figure S3. Correlation of precipitation and evapotranspiration with nitrate concentration in
groundwater.
References
Adelman, D.D., Schroeder, W.J., Smaus, R.J., Wallin, G.P., 1985. Overview of nitrate in
Nebraska’s ground water. Transactions of the Nebraska Academy of Sciences and
Affiliated Societies. 220. http://digitalcommons.unl.edu/tnas/220.
CPNRD., 2016. Central Platte Natural Resources District. Groundwater Management Plan.
Grand Island, Nebr. http://cpnrd.org/groundwater-quality/.
Exner, M.E., Hirsh, A.J., Spalding, R.F., 2014. Nebraska’s groundwater legacy: nitrate
contamination beneath irrigated cropland, Water Resour. Res. 50, 4474-4489.
doi:10.1002/2013WR015073.
Exner, M.E., Perea-Estrada, H., Spalding, R.F., 2010. Long-term response of groundwater
nitrate concentrations to management regulations in Nebraska’s Central Platte Valley.
TheScientificWorldJournal. 10, 286-297. doi:10.1100/tsw.2010.25.
Ferguson, R.B., 2015. Groundwater quality and nitrogen use efficiency in Nebraska’s
Central Platte River Valley. J. Environ. Qual. 44, 449-459, doi:10.2134/jeq2014.02.0085
Gormly, J.R., Spalding, R.F., 1979. Sources and concentrations of nitrate-nitrogen in ground
water of the Central Platte region, Nebraska. Ground Water. 17, 291-301.
8
Gosselin, D.C., Headrick, J., Tremblay, R., Chen, X.H., Summerside, S., 1997. Domestic
well water quality in rural Nebraska: focus on nitrate-nitrogen, pesticides, and coliform
bacteria. Ground Water Monitoring & Remediation. 17, 77-87. doi:10.1111/j.1745-
6592.1997.tb01280.x.
Hard, E.J., 2013. Nebraska: central platte valley groundwater management program.
https://www.cdfa.ca.gov/is/ffldrs/frep/pdfs/9_Hard_Ferguson.pdf, last accessed on July
2, 2018.
McGinnis, S., Davis, R.K., 2001. Domestic well water quality within tribal lands of eastern
Nebraska. Environmental Geology. Springer-Verlag. 41, 321-329.
Meals, D.W., Spalding, R.F., Exner, M.S., Ferguson, R.B., McFarland, M.L., Osmond, D.L.,
Spooner, J., 2012. Groundwater beneath a phase III management area in the central
platte natural resources district, Nebraska: national institute of food and agriculture –
Conservation effect assessment project. How to Build Better Agricultural Conservation
Programs to Protect Water Quality: The National Institute of Food and Agriculture–
Conservation Effects Assessment Project Experience. Papers in Natural Resources. 325.
Schepers, J.S., Moravek, M.G., Alberts, E.E., Frank, K.D., 1991. Maize production impacts
on groundwater quality. J. Environ. Qual. 20, 12-16.
Spalding, R.F., 1991. Assessment of statewide groundwater quality data from domestic
wells in rural Nebraska. Open-File Rep. Water Center. Inst. of Agric. and Nat. Resour.
Univ. of Nebraska, Lincoln.
Spalding, R.F., Exner, M.E., 1993. Occurrence of nitrate in groundwater-a review, J.
Environ. Qual. 22(3), 392-402. doi:10.2134/jeq1993.00472425002200030002x.
U.S. Department of the Interior, 1999. Nitrate and Nebraska’s small community and rural
domestic water supplies: an assessment of problems, needs, and alternatives, U.S.
Department of the Interior. Bureau of Reclamation.
http://dnr.nebraska.gov/Media/PDF/NitrateReport.pdf.