
The long run impact of rights issues on share price ...
84
The long run impact of rights issues on share price performance and operating performance Kwena Setati 12367372 A research project submitted to the Gordon Institute of Business Science, University of Pretoria, in partial fulfilment of the requirements for the degree of Master of Business Administration. 11 November 2013 MBA 2012/2013 © 2014 University of Pretoria. All rights reserved. The copyright in this work vests in the University of Pretoria.
Transcript of The long run impact of rights issues on share price ...

The long run impact of rights issues on share price
performance and operating performance
Kwena Setati
12367372
A research project submitted to the Gordon Institute of Business Science,
University of Pretoria, in partial fulfilment of the requirements for the degree
of Master of Business Administration.
11 November 2013
MBA 2012/2013
© 2014 University of Pretoria. All rights reserved. The copyright in this work vests in the University of Pretoria.

Declaration
I declare that this research project is my own work. It is submitted in partial fulfilment of the requirements for the degree of Master of Business Administration at the Gordon Institute of Business Science, University of Pretoria. It has not been submitted before for any degree or examination in any other University. I further declare that I have obtained the necessary authorisation and consent to carry out this research.
11/11/2013
© 2014 University of Pretoria. All rights reserved. The copyright in this work vests in the University of Pretoria.

ABSTRACT
Rights issues continue to be a well-researched topic within the field of corporate finance. The focus of this study was to consider the long-run impact of rights issue on company performance both in terms of share price performance and operating performance. The long-run perspective taken in this study adds to the literature, which usually looks at the immediate share price reaction to a rights issue announcement. The study also looked at whether the intended use of capital stated in the SENS announcement had any post-issue effect on the share price.
The study found significantly negative cumulative average abnormal returns within the first year after the rights issue. This study confirms the expected negative share price reaction to a rights issue announcement. The study also found evidence that companies that use the proceeds to repay debt, invest or for general purposes had a negative share price reaction to a rights issue announcement. Companies that were vague about the intended purpose of the rights issue had the largest post-issue underperformance.
The study did not find any statistically significant evidence that the rights issue announcement had any effect on the operating performance. These findings suggest that rights issues have more impact on a company’s share price, and no clear impact on the operating performance of the issuing company.
Keywords: Rights issue, share price performance, operating performance
© 2014 University of Pretoria. All rights reserved. The copyright in this work vests in the University of Pretoria.

Acknowledgements
I would like to thank Professor Mike Ward for sharing his wealth of knowledge,
lessons in modelling, the timeous responses and general guidance during this
journey.
I would also like to thank my family and friends. Your patience and support has been
consistent and I appreciate all the positive energy given to me for the past two years.
A special mention goes to my father and boss. Thanks for giving me the space and
time away from work to complete this degree. I owe the business a world of effort for
everything it has done for me while I was away from work.
To Lesego, I have gotten this far, and this far is only the beginning. Miss you.
To the higher power, I wanted to thank you for equipping me with the ability to achieve my dreams.
© 2014 University of Pretoria. All rights reserved. The copyright in this work vests in the University of Pretoria.

Table of Contents Research Title....................................................................................................................... 1
1. Definition of the Problem................................................................................................... 1
1.1 Research Problem and Purpose.................................................................................. 1
1.2 Research Context .................................................................................................... 2
1.3 Research Objectives ................................................................................................ 3
2. Theory and Literature Review ........................................................................................... 4
2.1 Purpose for Equity Issue .......................................................................................... 5
2.2 Factors affecting Long-Run Post-issue Performance ............................................... 8
2.3 Summary of findings in the related literature .......................................................... 12
2.3.1 Share Price Performance .................................................................................... 12
2.3.2 Operating Financial Performance........................................................................ 15
2.4 Benchmarking for Abnormal Returns ..................................................................... 16
3. Research Objectives and Hypotheses............................................................................. 20
4. Research Design and Methodology ................................................................................ 23
4.1 Unit of Analysis.......................................................................................................... 23
4.2 Population of relevance ............................................................................................. 23
4.3 Event study method................................................................................................... 24
4.4 Data Collection .......................................................................................................... 25
4.4.1 Share Price Performance – Event Window.......................................................... 26
4.4.2 Operating Financial Performance – Event Window ............................................. 26
4.5 Sampling Method and Size........................................................................................ 26
4.6 Data Analysis Approach ............................................................................................ 32
4.6.1. Measuring Abnormal Returns............................................................................. 33
4.6.2 Classifying Intended Use of Proceeds................................................................. 37
4.6.3 Bootstrapping Analysis........................................................................................ 38
4.6.4 Measuring Abnormal Operating Performance ................................................... 39
4.6.5 T-test Analysis .................................................................................................... 41
4.7 Research Limitations ................................................................................................. 42
5. Results......................................................................................................................... 44
5.1 Description of Sample........................................................................................... 44
5.2 Performance of CAARs......................................................................................... 46
5.3 Operating Financial Performance.......................................................................... 55
6. Discussion of Results................................................................................................... 57
6.1 Share price performance ........................................................................................... 57
6.1.1. Cumulative average abnormal returns for full sample......................................... 57
© 2014 University of Pretoria. All rights reserved. The copyright in this work vests in the University of Pretoria.
6.1.2. Hypothesis testing of CAARs for full sample ...................................................... 59
6.1.3. Cumulative average abnormal returns of sub-samples....................................... 60
6.1.4. Hypothesis testing of CAARs for debt-repayment sample .................................. 62
6.1.5. Hypothesis testing for investment sample .......................................................... 64
6.1.6. Hypothesis testing for general sample................................................................ 65
6.2. Operating financial performance............................................................................... 66
6.2.1 Hypothesis testing of operating performance sample .......................................... 68
7. Conclusion ................................................................................................................... 69
Reference List..................................................................................................................... 73
© 2014 University of Pretoria. All rights reserved. The copyright in this work vests in the University of Pretoria.

Table of Figures
Table 1: Cumulative Abnormal Returns (CAR) following a seasoned equity offer from Spiess & Grave (1995) for the period 1975-1989............................................................................ 13 Table 2: Summary of post-issue buy-and-hold returns from selected research papers over different holding and sampling periods................................................................................ 14 Table 3: Results of analysis by McLaughlin et al (1996) on operating financial performance (IACFRA) before and after a seasoned equity offering ........................................................ 15 Table 4: Results of analysis by Autore et al (2008) on operating financial performance (median operating income scaled by total assets) before and after a seasoned equity offering................................................................................................................................ 16 Table 5: Companies excluded due to a lack of data ............................................................ 27 Table 6: Companies excluded due to being an unrelated financial instrument .................... 29 Table 7: Companies excluded due to a prior rights issue in the same period ...................... 30 Table 8: Companies excluded due to a small issue size ..................................................... 31 Table 9: Summary of rights issues announced between 2002 and 2011 based on chosen sampling criteria.................................................................................................................. 45 Table 10: Descriptive Statistics for cumulative average abnormal returns based on three weightings across all samples for the full event window [-40, 220] days.............................. 46 Table 11: Analysis of Cumulative Average Abnormal Returns (CAARs) of the full Sample for selected event windows ...................................................................................................... 50 Table 12: Analysis of cumulative average abnormal returns of sub-samples for selected event windows .................................................................................................................... 54 Table 13: Industry-Adjusted Cash flow Return on Assets (IACFRA) before and after a rights issue ................................................................................................................................... 56 Table 14: Paired Industry-Adjusted Cash Flow Return on Assets (IACFRA) before and after a rights issue....................................................................................................................... 56
© 2014 University of Pretoria. All rights reserved. The copyright in this work vests in the University of Pretoria.

© 2014 University of Pretoria. All rights reserved. The copyright in this work vests in the University of Pretoria.

1
Research Title
The long run impact of rights issues on share price performance and operating
performance
1. Definition of the Problem
1.1 Research Problem and Purpose
Corporate finance studies continue to study the link between equity issuance and
performance. An equity issue occurs when companies sell new equity to investors to
raise capital. Rights offers are a form of equity issue and are prevalent in the South
African listed equity market. The foci around equity issues include funding, valuation
and subsequent performance. This study will focus on the impact of equity issues on
the subsequent long-run company performance. Further to that, this study will
continue to develop a theme more recently explored by Autore, Bray & Petersen
(2008) and Walker & Yost (2008) – the intended use of proceeds raised in an equity
issue, and the link between this intention and the long run performance of a
company.
Many studies, such as Bayless & Jay (2008), have been completed on the
developed equity markets in Europe and the United States (U.S.), while few studies
look at follow-on equity issuers in developing markets. In South Africa there were
studies by Bhana (1998) and Pascoe, Ward, & Mackenzie (2005), this paper will
seek to add value in that regard
This study also aims to add to the literature by assessing the stated use of rights
issue proceeds and its significance with regard to rights offers in a developing
market. Linking the stated use of funds to post-issue performance could potentially
allow for the discernment of whether a manager is issuing due to the company share
being overvalued, or for investment prospects (Walker & Yost, 2008). From an
investor perspective, the results of this study could be an additional indicator of
expected future company performance whenever an equity issue is announced. In
South Africa, most studies focus on share price activity after an Initial Public Offering
(IPO). This paper will further interrogate this by looking at later equity issues.
© 2014 University of Pretoria. All rights reserved. The copyright in this work vests in the University of Pretoria.

2
The study ventures into a contentious area of event studies by looking at price
performance and operating financial performance in the long run. Given that
investment horizons are often longer than 1 month, it would be justified to consider
the impact on performance for longer subsequent periods.
Another purpose of the study was to analyse the company’s stated use of issued
capital, while analysing performance to assess if ‘pro-active’ uses or the expressed
intention of capital use offer any form of premium over the companies that do not
clearly specify their reason for raising capital.
1.2 Research Context
The research was based on companies listed on the Johannesburg Stock Exchange
(JSE). The JSE is the largest and most developed stock market in Africa
(JSE, 2013). The total market capitalization of the JSE as at December 2012 was
USD903 billion, making it one of the largest stock exchanges in the world by market
value.
Two key features of the JSE are the Stock Exchange News Service (SENS) and
STRATE. SENS was launched in 1997 as a real-time news service which was used
to disseminate relevant company information to the market. SENS was developed to
increase market transparency and overall investor confidence in the market.
STRATE is the central securities depository that is used for electronic settlement of
all financial instruments in the market. This was developed to increase market
efficiency and mitigate settlement risk.
The JSE’s size and structural characteristics make it a suitable market, or sample,
on which the research can be conducted.
© 2014 University of Pretoria. All rights reserved. The copyright in this work vests in the University of Pretoria.

3
1.3 Research Objectives Research objectives for the study are as follows:
a) Assess the impact of a rights offer on the share price in the long run.
b) Investigate if the intended use of the proceeds from the rights issue has an
impact on the share price in the long run.
c) Assess the impact of a rights offer on the operating performance in the
long run.
© 2014 University of Pretoria. All rights reserved. The copyright in this work vests in the University of Pretoria.

4
2. Theory and Literature Review
The literature review provides a précis on the underlying finance theory that is
relevant to rights offers in terms of purpose. The study will then outline some of the
key factors that affect the performance outcomes of the rights issue. Before delving
into the heart of the topic, the study commences by briefly fitting equity issuance and
subsequent company performance into the corporate finance context.
Finance studies and theory exist in order to elucidate the interactions between
companies, its customers, its shareholders, and its environment. This study zones in
on the connection between shareholders and/or investors, and the company and/or
its management. The common language that is spoken between investors,
management and analysts is one of risk and reward. For a given level of perceived
risk, investors will have a commensurate level of expected return when deciding to
invest in an asset (Bodi, Kane, & Marcus, 2005). Simlilarly company management,
given expected returns from shareholders and borrowers, will require a certain
premium on any investment because it carries risk – this is defined as capital
budgeting (Firer, Ross, & Westerfield, 2012). Investments need to be supported by
funding, with a choice between debt or equity or both - this is defined as capital
structure (Firer, Ross, & Westerfield, 2012).
An equity issue falls within the management of ‘capital structure’ in corporate
finance. Capital structure is crucial because it answers the question of how projects
or investments will be funded. Capital structure also affects total company risk; which
has consequent expectations for reward for both the company and its investors
(Bodi, Kane, & Marcus, 2005). In essence, the relationship between equity issuance
and long run performanace provides the link between the core concepts of capital
structuring and budgeting, described above. Thus, there exist numerous studies,
such as Bayless & Jay, (2008), Loughran & Ritter (1997), and Pascoe, Ward, &
Mackenzie (2005), which have explored the relationship between an equity issue
and the subsequent long-run company performance from different perspectives. We
define this ‘long-run’ as any period longer than one trading year of 220 days
© 2014 University of Pretoria. All rights reserved. The copyright in this work vests in the University of Pretoria.

5
(approximately 1 calendar year). Operating performance is defined as the ability of a
company to use its assets efficiently, to generate income for a selected period of
time (Firer, Ross, & Westerfield, 2012). Share price performance is defined as price
return on a share for a selected period.
2.1 Purpose for Equity Issue
This section will concentrate on the potential motives behind company
management’s decision to conduct an equity issue. Understanding the motives for
issuing stock will provide the platform for analysing some of the influential factors
that play a role in the post-issue performance at a share price and operating level.
Management may sometimes have good intentions, but these may be affected by
the economic landscape, stock liquidity and information asymmetry.
Equity Issues: definitions and differences
Prior to examining the motives for issuing equity, clarity is provided on the different
types of equity issuance: initial public offering, rights offer, seasoned equity offerings
and cash issues.
An initial public offering (IPO) is the company’s first equity offer of ordinary shares to
the public (Firer, Ross, & Westerfield, 2012). A rights offer is an issue of ordinary
shares to existing shareholders , in this instance shareholders are given an
opportunity to exercise their pre-emptive right to participate in the new issue. This is
done in proportion to their share in the company. This pre-emptive right allows the
shareholder the opportunity to avoid having their ownership in the business diluted
by the increased number of outstanding shares. Rights offers are usually offered to
shareholders at a slight discount to the prevailing market price. Shareholders may
waive their pre-emptive rights, which may compel management to seek capital
beyond the current shareholder base (Firer, Ross, & Westerfield, 2012).
Seasoned equity offerings (SEOs) are different to rights offers because a SEO is an
offer of new shares to the public , specifically for a company that already has shares
trading in the secondary equity market. The shares are offered to the public at the
prevailing market price. Seasoned equity offers are prevalent in the financial markets
of the U.S. and the United Kingdom (U.K.). In South Africa, the closest occurrence of
© 2014 University of Pretoria. All rights reserved. The copyright in this work vests in the University of Pretoria.

6
a SEO is a cash offer – the offer is to the general public, the offer is not proportionate
to shareholder rights and shareholders will have waived their rights at a general
meeting (Firer, Ross, & Westerfield, 2012).
In South Africa, a total of R84.9 billion has been raised through 108 rights offers from
31 January 2005 to 28 January 2013 (JSE Bulletin, unknown). The equity issues
relevant to this study are rights offers, seasoned equity offers and cash offers.
Although it is acknowledged that there are differences between rights offers and
cash offers; the study will not distinguish between the two aforementioned
definitions, and considers both as relevant for the study of follow-on equity issues
and post issue performance.
Motives for raising equity capital
The notion of capital-raising has been well-documented in corporate finance
textbooks such as Bodi, Kane, & Marcus (2005) and Firer, Ross, & Westerfield
(2012), as the main reason for companies to issue equity. However, the underlying
question is, for what purpose was the capital raised?
Understanding the intended use of the proceeds of a rights offer or SEO is a useful
departure from other studies on SEO issues and performance (Autore, Bray, &
Petersen, 2008). Raising capital is normally considered a long-term funding exercise.
DeAngelo, DeAngelo, & Stulz (2010) showed that firms can conduct a SEO for short-
term financing needs. DeAngelo, DeAngelo, & Stulz (2010) state that other reasons,
such as the opportunity to sell the share price at a high price, were subordinate to
the need for cash.
Ideally, companies are expected to raise capital in instances where they have
positive Net Present Value (NPV) projects to invest in, and no other source of
finance. This is particularly true given that equity finance is typically associated with
more costs than debt finance (Firer, Ross, & Westerfield, 2012).
DeAngelo, DeAngelo, & Stulz (2010) contest this by asserting that if the motive to
raise capital was to invest in good prospects as detailed in the NPV argument, then
most equity issuing firms would have a stockpile of cash after an issue. The cash
would be stockpiled while management seeks high-yielding projects. However
© 2014 University of Pretoria. All rights reserved. The copyright in this work vests in the University of Pretoria.

7
DeAngelo, DeAngelo, & Stulz (2010) found that 62.5% of firms that conducted SEOs
would have run into cash problems had they not proceeded with an equity issue.
In keeping with choices on NPV projects, Jensen’s (1986) seminal paper on agency
theory showed how managers could potentially act as bad agents by spending
excess funds on negative NPV projects. The free-cash flow theory detailed by
Jensen (1986) predicts that SEO announcements will have a negative effect on
share prices, due to the extra money raised being invested in value-eroding projects.
The theory also posited that with a limited number of positive NPV projects available,
companies will experience a decline in operating performance subsequent to an
equity issue.
McLaughlin, Safieddine, Vasudevan, & Gopala (1996) found a statistically significant
decrease in company profitability following a SEO. Their research also established
that companies with higher free cash flows as defined in Jensen (1986), experience
greater declines in operational profitability after a rights issue. There is as much as a
20% decline in relative free-cash flows three years after an issue. The findings by
McLaughlin, Safieddine, Vasudevan, & Gopala (1996) are consistent with Jensen
(1986).
Autore, Bray, & Petersen’s (2008) work found that companies that were specific in
announcing potential investment prospects as the justification for a SEO, showed
little or no underperformance after three years. In contrast, a negative relationship
between growth opportunities and the post offering earnings performance was found
by Lee (1997).
Capital Structure
At the heart of the decision to have a rights issue lies a choice around capital
structure. In Modligiani & Miller’s (1958) definitive paper on capital structure, they
show that the market value of any firm is independent from its capital structure.
However, with more practical assumptions such as the inclusion of tax effects, firms
would be better off increasing their debt levels to an optimal level. However, further
developments highlighted the increased risk of financial distress that came with
increased debt levels (Stiglitz, 1974).
© 2014 University of Pretoria. All rights reserved. The copyright in this work vests in the University of Pretoria.

8
With a targeted debt-equity ratio, a firm can ‘optimise’ by maximising gains from its
interest tax shield while remaining clear of increased likelihood of financial distress or
bankruptcy (Stiglitz, 1974). The interest tax shield is a reduction in taxable income
for an individual or company achieved through claiming an allowable deduction from
interest on debt. A rights offer plays the role of reducing the gearing in the business,
allowing a firm to remain within its targeted debt-equity levels. Gearing is the amount
of financial leverage in a business (Bodi, Kane, & Marcus, 2005).
The alternate ‘Pecking Order’ theory asserts that firms will first finance internally,
then move to external financing with a preference for external debt and lastly
external equity (Myers, 1984). Myers (1984) also showed that firms will not
necessarily have a targeted capital structure, but will apply ‘pecking order’ financing
best when they are in conditions where there are high transaction, agency and tax
costs.
2.2 Factors affecting Long-Run Post-issue Performanc e
The following section will focus on the dynamics that affect the company earnings
and share price performance after an equity issue. This study will focus on a few key
factors which have significance – information asymmetry, liquidity, company life-
stage, corporate governance and economic factors.
Information Asymmetry
Frielinghaus, Mostert, & Firer (2005) state that Myers (1984) used information
asymmetries to argue that firm insiders are unlikely to issue equity, because they
know that it may signal that their share price is overvalued to the market. The
information model by Myers & Majluf (1984) has regularly appeared as an
explanation for the subsequent poor post-issue performance. The information model
was a decision-based model which identified situations when management would
prefer to issue equity.
Myers & Majluf (1984) and Jensen (1986) were two defining papers which most
influenced the debate on adverse share price reactions to SEO announcements. In
Myers & Majluf’s (1984) adverse selection model, managers are agents for
shareholders and have inside information about the company. Given this asymmetric
© 2014 University of Pretoria. All rights reserved. The copyright in this work vests in the University of Pretoria.

9
information, managers will prefer to issue equity when their company is overvalued.
Myers & Majluf (1984) also found that, given an undervalued company, managers
would rather let go of viable projects than issue at under-priced share levels. This
theory is supported by DeAngelo, DeAngelo, & Stulz (2010) who found that rights
issues are correlated with market timing. However, DeAngelo, DeAngelo, & Stulz
(2010) identify incompleteness in the market timing analysis, due to the theory not
taking into account companies that choose not to raise equity, regardless of
encouraging market timing conditions and having a need for cash.
Autore, Bray & Petersen (2008) following on from Loughran & Ritter (1997) show
that SEO issuers face a decline in operating performance subsequent to a SEO.
Autore, Bray & Petersen (2008) and Loughran & Ritter (1997) also show declining
post-issue share returns.
These findings are considered to be the result of the issued share being overvalued
at time of issue, with managers having more information about prospects at the time
of issue (Loughran & Ritter, 1997).
Liquidity
Liquidity risk has been shown to play an important role in asset pricing (Lin & Wu,
2013). Its role in asset pricing captures the responsiveness of a share’s return, to
sharp changes in market liquidity (Lin & Wu, 2013). Given this abovementioned role,
liquidity should be considered as factor when making a rights offer. Lin & Wu (2013)
argue that firms issue when their respective liquidity risks are at a low – thus
explaining the poor subsequent share performance. As liquidity risk declines,
investors will demand a smaller liquidity premium and expected returns would be
lower (Firer, Ross, & Westerfield, 2012). This dovetails with Eckbo, Masulis & Norli
(2006), who showed that issuing firms experienced higher post-issue liquidity, which
would result in lower premiums, that would in turn reduce expected post-issue
returns.
Crucially, Lin & Wu (2013) found that the issuing firms’ liquidity risk remained
relatively low for two to three years, compared to non-issuing firms, with investors
demanding less in price for firms that show larger liquidity risk declines. This links the
© 2014 University of Pretoria. All rights reserved. The copyright in this work vests in the University of Pretoria.

10
low liquidity risk to low post-issue price performance that is experienced by issuing
firms, due to lower expected returns.
Company Lifestage
Organisational lifestage theory can play a useful part in the equity issuance debate.
Different firms have differing characteristics and business needs, at different parts of
the corporate lifecycle (Frielinghaus, Mostert, & Firer, 2005). Business needs
include, but are not limited to, the method of financing that will be selected by the
company management. A pilot study conducted by Frielinghaus, Mostert, & Firer
(2005) supported the pecking order theory developed by Myers & Majluf (1984)
which postulates that firms will finance first with internal equity, then debt - if retained
earnings are insufficient, then external equity will be utilised as a last resort. Initially
when in an early stage, according to the pecking order theory, a firm will have a high
use of debt financing (Frielinghaus, Mostert, & Firer, 2005).
As the firm enters its prime and into the maturity lifestage, it is more likely to use its
own equity and external equity (Frielinghaus, Mostert, & Firer, 2005). Finally, in its
maturity stage, the firm will again select debt as its chief financing mechanism.
DeAngelo, DeAngelo & Stulz (2010) found evidence that the phase of lifecycle that a
firm finds itself in has a significant influence on the decision to undertake a seasoned
equity offering. Growth-stage firms were the most prevalent of issuers in the SEO
market – specifially growth-stage firms that have high market-to-book ratios and low
operating cash flows (DeAngelo, DeAngelo, & Stulz, 2010). Firms with low operating
cashflows exhibit increased operational risk which could impact the probability of
financial distress – this is seen as an underlying driver of the choice to have an
equity issue. These firm characteristics around the time of an SEO tie in with the
behavioral market timing theory, which argues that managers will sell their company
stock when their share price is high.
Corporate Governance
Corporate governance is defined as the system through which organisations are
directed and controlled. Corporate governance sets control mechanisms which guide
© 2014 University of Pretoria. All rights reserved. The copyright in this work vests in the University of Pretoria.

11
and observe managers’ actions, ensuring that their decisions are aligned with
shareholder interests (Dbouk & Ismail, 2010). Dbouk & Ismail (2010) found that
strong governance structures and systems are associated with positive abnormal
performance after an equity issue.
It is suggested that good corporate governance assists in mitigating the agency
problems identified by Jensen (1986) by impelling the manager to invest to better
serve shareholder interests and to invest equity issue proceeds in higher yielding
projects – corporate governance limits a managers ability to use capital
irresponsibly.
Macroeconomic Risk-Factors
The dearth of research on post-issue operating and share price performance has
explanations and methods which mostly support the information model by Myers &
Majluf (1984). Recent research has focussed on explaining the variance within the
negative share price responses (Pascoe, Ward, & Mackenzie, 2005). Pascoe, Ward,
& Mackenzie (2005) following from Korajczyk, Lucas, & McDonald (1991) state that
periods of high economic growth account for a larger portion of all equity issues. In
periods of high economic growth, asymmetric information is low. Low asymmetric
information is accompanied by low adverse selection costs because there is less
uncertainty in the market (Pascoe, Ward, & Mackenzie, 2005). Equity issues are
most prevalent in strong equity markets, with firms that have relatively well
performing stocks being more amenable to issuing equity (Korajczyk, Lucas, &
McDonald, 1991).
In South Africa, Pascoe, Ward, & Mackenzie (2005) examined the effects of
economic factors on the share price, after a rights issue announcement. The
economic factors examined included interest rates, stock maket performance,
business cycles, economic growth and business confidence. Economic factors have
been found to account for the changes in the share price with respect to rights issue
announcements (Pascoe, Ward, & Mackenzie, 2005).
Eckbo, Masulis, & Norli (2006) found firms are relatively less risky than matched
companies after an equity issue. Matched companies are those that company can
© 2014 University of Pretoria. All rights reserved. The copyright in this work vests in the University of Pretoria.

12
benchmark themselves against, based on similar company characteristics. These
matched characteristics include, but are not limited to, nature of business, size,
leverage and performance. Given a downward risk-adjustment based on some of the
factors mentioned above, the market makes a commensurate reduction in expected
returns – therefore explaining the poor long run post-issue performance. In their
study, Eckbo, Masulis, & Norli (2006) examine the influence of macroeconomic
factors on post-issue performance. The selected macroeconomic factors for their
analysis included unanticipated inflation, a value-weighted market index, real per
capita consumption, short-term and long-term soveriegn interest rates, and a
corporate spread between BAA and AAA Moody-rated bonds. Eckbo, Masulis, &
Norli (2006) argued that the matched-firm technique by Loughran & Ritter(1997)
does not adequately account for risk, and thus presented the additional six factor
model.
The six factor model showed that SEO firms have slightly higher sensitivity to market
risk than comparable non-issuer firms (Eckbo, Masulis, & Norli, 2000). The relatively
higher sensitivity to the market was negated by a higher reduction in post-issue risk
exposure. This was due to unanticipated inflation, and measures of interest rate risk
(Eckbo, Masulis, & Norli, 2000). This market sensitivity is simply understood by
recognising that as equity issuers decrease their leverage, their direct exposure to
interest rates and inflation also decreases. As a result, the market discounts the
issued stock, with low post-issue performance as a consequence.
Bayless & Jay’s (2008) findings were slightly different to those of Eckbo, Masulis, &
Norli (2000), despite using similar macroeconomic factor model. For Bayless & Jay
(2008), equity issuing firms have significantly lower systematic risk and risk-adjusted
returns, during the post-issue period.
2.3 Summary of findings in the related literature
2.3.1 Share Price Performance
Most studies such as Bayless & Jay (2008), Eckbo, Masulis, & Norli (2000) and
Loughran & Ritter(1995) assess share price reaction to rights issues using buy-and-
hold returns, which will be further explained later in this paper. This study employs
© 2014 University of Pretoria. All rights reserved. The copyright in this work vests in the University of Pretoria.

13
cumulative abnormal returns which are similar to those used in Spiess & Grave
(1995). The table below is an excerpt from their findings.
Table 1: Cumulative Abnormal Returns (CAR) following a seasoned equity offer from Spiess & Grave (1995) for the period 1975-1989
Month CAR Sample Size
1 2.55% 1247 2 2.17% 1246 3 1.23% 1246 4 0.93% 1246 5 -0.34% 1243 6 -0.65% 1243 7 -0.76% 1243 8 -1.07% 1242 9 -1.28% 1241 10 -2.25% 1237 11 -3.42% 1234 12 -4.30% 1229 . . . . . . . . . 60 -31.24% 900
The findings above indicate a negative abnormal return across the months for the
selected trading year. This corroborates the extensive literature with regard to the
expected poor performance after an equity issue, with a 60 month CAR of -31.24%.
However the results appear to have an element of downward bias, which brings in
the ‘bad model’ problem mentioned by Kothari & Warner (2007), in that long-run
event studies on share price are susceptible to bias. The ‘bad model’ problem also
premises that the testing of abnormal returns may lead to specious results due to the
choice of benchmark. This will be further discussed in Chapter 4 of this paper.
Buy-and-Hold returns are not to be confused with cumulative abnormal returns, thus
the paper distinctly sets the findings apart. The table (2) below is a synopsis of the
findings of both recent and past papers that studied the share price performance
after a rights issue.
© 2014 University of Pretoria. All rights reserved. The copyright in this work vests in the University of Pretoria.

14
Table 2: Summary of post-issue buy-and-hold returns from selected research papers over different holding and sampling periods
The studies above all employed the BHAR method, with similar matched firm bases
such as size and book-to-market ratios. All studies show the highly negative BHAR
at the end of the holding period. It is important to note that, for such long sample
periods, caution should be taken in deducing associations between the returns and
the rights issue. (Barber & Lyon, (1997) say that the most important matter when
calculating abnormal share returns is the selection of a benchmark.
Author Period Sample Size
Holding Period (years)
Equal-Weighted BHARs
Loughran & Ritter (1995) 1970-1990 3702 3 -59.40%
Spiess and Affleck-Graves (1995)
1975-1989 1247 3 -22.84%
Eckbo, Masulis & Norli (2007)
1980-2000 4971 5 -29.70%
Autore, Bray & Petersen (2008)
1997-2003 880 3 -11.15%
© 2014 University of Pretoria. All rights reserved. The copyright in this work vests in the University of Pretoria.

15
2.3.2 Operating Financial Performance There are various ways in which operating performance is measured in the literature.
McLaughlin, Safieddine, Vasudevan, & Gopala (1996) used similar measures to this
study. While studies such as Autore, Bray, & Petersen (2008) used operating
income, scaled by assets to measure performance; this study follows on from
McLaughlin, Safieddine, Vasudevan, & Gopala (1996) by using pre-tax operating
cash flow scaled by total assets and a similar matched-firm technique identified in
Barber & Lyon (1997). However this study also closely followed Smit & Ward (2007)
by matching according to industry and pre-issue size. The results for the Industry-
Adjusted Cash flow Return On Total Assets (IACFRA) from McLaughlin, Safieddine,
Vasudevan, & Gopala (1996) are shown below:
Table 3: Results of analysis by McLaughlin et al (1996) on operating financial performance (IACFRA) before and after a seasoned equity offering
IACFRA Year (-2) Year (-1) Year (1) Year (2) Median 0.020*** 0.034*** 0.021*** 0.013*** Mean 0.014 0.026 0.009 0.004 Standard Error 0.14 0.176 0.148 0.169 Sample Size 1044 1133 1147 1118 Change in IACFRA
Year (-2) to (-1)
Year (-1) to (1)
Year (-1) to (2) Year (-1) to (3)
Median 0.008*** -0.008*** -0.015*** -0.017*** Mean 0.012*** -0.018*** -0.030*** -0.032*** Standard Error 0.096 0.159 0.159 0.177 Sample Size 1037 1118 1982 872
The tests for the medians were conducted based on two-tail t-test, the key variables
representing operating financial performance being found to be significant. The study
points to the negative changes in industry-adjusted cash flow return on total assets
from year (-1) to year (1) with a median value of -1.8%. Similarly, the shift from year
(-1) to year (2) had a mean change of -3%. McLaughlin, et al (1996) mention that
these results should be interpreted with caution given that there could be industry-
wide impacts affecting the operating financial performance ratios. The findings of
© 2014 University of Pretoria. All rights reserved. The copyright in this work vests in the University of Pretoria.

16
McLaughlin et al (1996) show that pre-issue operating financial performance is
superior to subsequent operating financial performance.
Autore, Bray, & Petersen (2008) assessed operating financial performance using a
slightly different measurement. The measurement for operating financial
performance was similiar to that of Loughran & Ritter (1997) where both studies
looked at median operating income scaled by total assets, before and after a rights
issue. The table below provides a brief summary of Autore, Bray, & Petersen’s
(2008) findings.
Table 4: Results of analysis by Autore et al (2008) on operating financial performance (median operating income scaled by total assets) before and after a seasoned equity offering
Industry- Adjusted Operating Income Year (-1) Year (0)
Year (1)
Year (2)
Median 0.003 0.007 0.004 -0.011
Sample Size 843 796 711 633 Changes in Industry-Adjusted Operating Income Year (-1) to (2) Year (0) to (2)
Median -0.016*** -0.019***
*** - indicates statistical significance at the 1% level
Despite using slightly different measures for operating financial performance, the
findings exhibit a clear trend of inferior operating performance after a rights issue.
Autore et al (2008) also included performance at the category level, concluding that
companies that used the proceeds of a rights issue for investment purposes had a
smaller decline in subsequent operating financial performance. Whereas companies
that specified that the proceeds would be used to repay debt or general corporate
services, experienced large declines even up to three years after the issue.
2.4 Benchmarking for Abnormal Returns So far the study has provided a description of what rights issues are, and also
documented the various factors that may influence share price and operational
financial performance after a rights issue.
© 2014 University of Pretoria. All rights reserved. The copyright in this work vests in the University of Pretoria.
17
In examining performance at both the share price and operating levels, the
measurement thereof becomes of considerable importance. The research by Fama,
Fisher, Jensen, & Roll (1969) was groundbreaking, they described distinct share
price returns as what we commonly call ‘Abnormal Returns’ today. Abnormal returns
are the difference between expected returns and actual returns for a company stock
or portfolio (Fama, Fisher, Jensen, & Roll, 1969). Expected returns can be loosely
defined as the return expected by an investor on an asset or security in a given risk
environment. Abnormal returns can be applied to both share price returns and
operational financial performance.
These abnormal returns are due to a market reaction to new information about a
corporate event being announced (Fama, Fisher, Jensen, & Roll, 1969). For this
research report, the corporate event under study is a rights offer. Statistically, these
abnormal returns would then be tested to see if they were significantly different from
zero during the period of analysis, which is known as the event window.
Barber & Lyon (1997) showed how the choice of benchmark has a significant effect
on the outcomes of studies using abnormal return measures. The benchmark return
is the expected return which was briefly described above. Marquee papers by Fama
& French (1993,1996) have shown how firm characeristics, such as size and book-
to-market ratios, can account for a signficant amount of variation in stock returns.
These characteristics provide a basis for calculating benchmark or expected returns.
In their study, Barber & Lyon (1997) focused on how the use of certain methods to
calculate abnormal returns introduced or reduced bias which would influence results.
It is recommended that the benchmark be calculated by using control firms, first by
matching on size and then matching by book-to-market ratios. The caveat in the
control firm approach is that both firms must be listed on an exchange in the same
month (Barber & Lyon, 1997).
There are various models which have emerged as ways to calculate abnormal
returns for stocks. These models have their advantages and disadvantages, which
will be briefly discussed below:
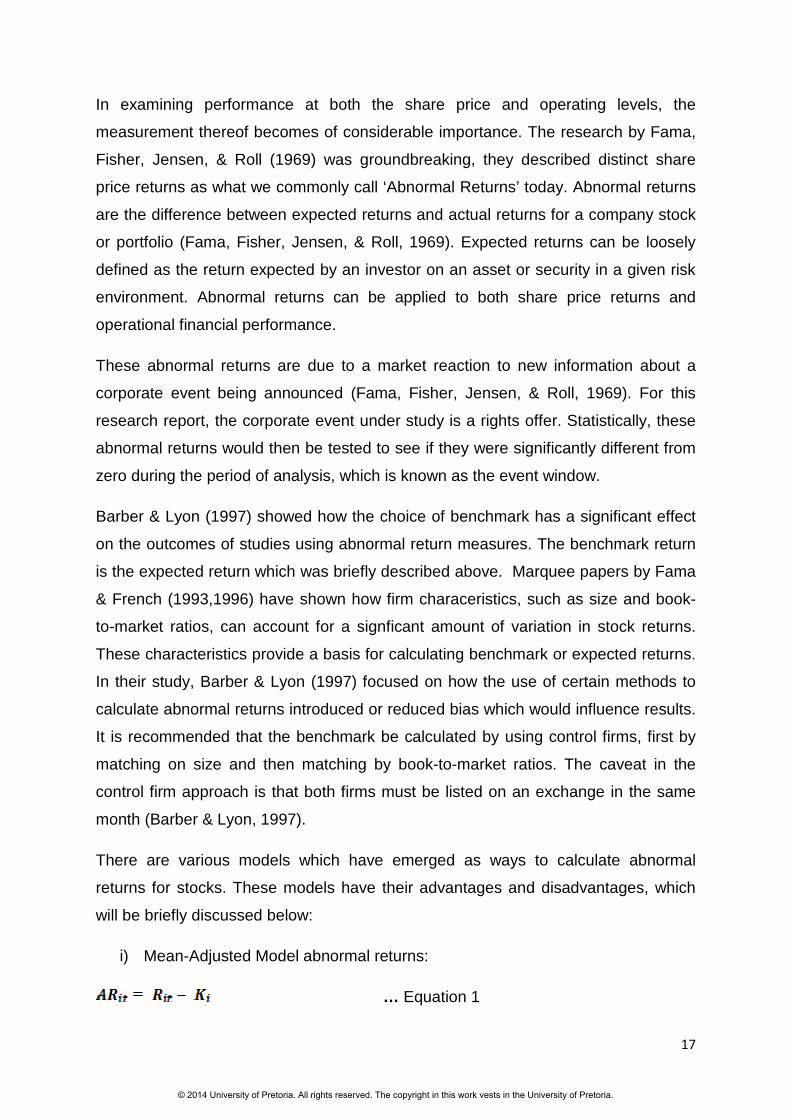
i) Mean-Adjusted Model abnormal returns:
… Equation 1
© 2014 University of Pretoria. All rights reserved. The copyright in this work vests in the University of Pretoria.

18
Where
is the abnormal return for security i for period t
is the actual return for security i for period t
is the average return earned by security i over a period not in the event window
ii) Market-Adjusted Model abnormal returns:
… Equation 2
Where
is the return on an equal-weighted market index for period t
iii) Market Model abnormal returns
… Equation 3
Where
and are parmeters which are found by linearly regressing share returns for
security i against equally-weighted market index returns
iv) Capital Asset Pricing Model(CAPM) abnormal return abnormal return:
…Equation 4
Where
is the slope found by regressing ) on for a period not in
the event window (estimation period) , the regression line is to have a y-intercept of
zero
is the risk-free rate during period t
v) Fama – French three factor abnormal return model:
…Equation 5
© 2014 University of Pretoria. All rights reserved. The copyright in this work vests in the University of Pretoria.

19
, and are found by regressing security i returns against excess returns on
market returns for the estimation period
is the high minus low book-to-market portfolio return for period t
is the small minus big size portfolio return for period t
Of all the models specified above, the Market Model was shown by Kothari & Warner
(2007) to be the worst model in predicting abnormal performance. The evidence
against the market model is based on share prices not being positively linear-related
to the market given a market beta. Similarly the mean-adjusted model is discarded
because share returns are not always in a linear pattern, and past performance is
not always a good predictor of future performance (Smit, 2005).
Fama & French (1996) found that the CAPM model failed to account for various
anomalies such as size, which explain security returns. Their model includes the
excess return earned over the risk-free rate, while also including other explanatory
factors in calculating abnormal share returns. However, the three-factor model by
Fama & French (1993) does have a few of its own disadvantages. For example, with
regard to long-horizon studies, the regression coefficients are assumed stable for the
estimation period, which is not likely in equity capital markets (Mushidzi & Ward,
2004).
The research will use a control portfolio model by Ward & Muller (2010) which
shares many characteristics with the model developed by Fama & French (1993).
The control portfolio approach is supported in the literature, by Barber & Lyon (1997)
and Kothari & Warner (2007) among others.
© 2014 University of Pretoria. All rights reserved. The copyright in this work vests in the University of Pretoria.
20
3. Research Objectives and Hypotheses Research objectives for the study are as follows:
d) Assess the impact of a rights offer on the share price in the long run.
e) Investigate if the intended use of the proceeds from the rights issue has an
impact on the share price in the long run.
f) Assess the impact of a rights offer on the operating performance in the
long run.
The literature has provided a platform upon which we can appropriately test the
relationship between rights offers and performance at the share price and
operational performance levels. The research was split into two dimensions; the
share price essentially represents the external form of the business, and the
operating performance represents the internal form. The share price is based actual
and expected performance, which can be subjective (Firer, Ross, & Westerfield,
2012). The share price is also subject to other externalities which one can refer to as
‘noise’. It is further acknowledged that this ‘noise’ makes it difficult to find a distinct
association between share price performance and a rights offer as the horizon
lengthens (Smit, 2005). The literature illustrates that the pre-eminent approach to
testing the impact of rights issues, is by looking at abnormal share price returns.
Asquith, Bruner, & Mullins (1983) advise that no set of hypotheses can account for
all the factors that affect abnormal returns. However, when looking at abnormal
share price returns, other important factors which have been shown to explain share
returns, such as size and industry can be controlled for (Spiess & Grave, 1995).
This study aimed to progress the literature on rights issues further, by looking at the
subsequent share price performance of different groups of rights issuers. These
© 2014 University of Pretoria. All rights reserved. The copyright in this work vests in the University of Pretoria.

21
groups include those that issue the funds raised in a rights issue to repay debt, those
that use the funds to invest in expansion and those that were not clear about what
they intended to do with issue proceeds (Autore, Bray, & Petersen, 2008).
The other dimension of this study examines operating financial performance. The
dynamics for benchmarking are similar to the benchmarking process for abnormal
share returns, as shown in McLaughlin, et al (1996). McLaughlin, et al (1996) found
a matching firm by looking at size, industry and pre-rights issue performance.
The chosen method to look at operating performance was industry-adjusted cash
flow return on total assets (IACFRA). The operating cash flow represents the net
cash flow which is generated from core operations (Firer, Ross, & Westerfield,
2012).
Given the research objectives above, the following research hypotheses were tested:
Hypothesis 1
Cumulative average abnormal returns (CAARs) represent share price performance. The
null hypothesis states that rights offers do not affect cumulative average abnormal
returns positively or negatively. Informed by the literature in Chapter 2, the alternative
hypothesis states that rights offers negatively affect cumulative average abnormal
returns.
H1,0:
HA,0:
Hypothesis 2
The null hypothesis states that rights issued to repay debt do not affect cumulative
average abnormal returns positively or negatively. The alternative hypothesis states that
rights issued to repay debts negatively affect cumulative average abnormal returns.
H2,0:
H2,A :
© 2014 University of Pretoria. All rights reserved. The copyright in this work vests in the University of Pretoria.

22
Hypothesis 3
The null hypothesis states that rights issued to invest do not affect cumulative average
abnormal returns positively or negatively. The alternative hypothesis states that rights
issued to invest negatively affect cumulative average abnormal returns.
H3,0:
H3,A :
Hypothesis 4
The null hypothesis states that rights issued without a clear purpose do not affect
cumulative average abnormal returns positively or negatively. The alternative hypothesis
states that rights issued without a clear purpose negatively affect cumulative average
abnormal returns.
H4,0:
H4,A :
Hypothesis 5
The industry-adjusted cash flow return on assets (IACFRA) was chosen to represent
operating financial performance. The null hypothesis states that industry adjusted cash
flow return on assets before the rights issue and the industry adjusted cash flow return
on assets after the rights issue are not statistically different. The alternative hypothesis
states that the industry adjusted cash flow return on assets before the rights issue and
the industry adjusted cash flow return on assets (IACFRA) after the rights issue are
statistically different.
H5,0:
H5,A:
© 2014 University of Pretoria. All rights reserved. The copyright in this work vests in the University of Pretoria.

23
4. Research Design and Methodology
This study conducted made use of secondary quantitative data and was causal in
nature. The selected research method was that of an event study. Mackinlay (1997)
says that “event studies are an established tool for measuring the impact of a
specific event on share price data”.
It should be noted that while the event study method is better suited to share price
data, it can also be used for financial statement data as in Smit & Ward (2007) , Bae,
Jeong, & Tang (2002) and McLaughlin, Safieddine, Vasudevan, & Gopala (1996).
4.1 Unit of Analysis
The unit of analysis for the study was any company listed on the Johannesburg
Stock Exchange (JSE) that announced a rights issue during the sample period. The
sample period is from January 2002 to December 2011.
4.2 Population of relevance
The population for this study included all companies that issued equity on the JSE.
This excluded initial public offerings (IPO). Listed companies are required to
announce any material and/or price sensitive information to the market (Firer, Ross,
& Westerfield, 2012). The population of relevance was collected from a JSE Archive
on all rights issues on the JSE for the selected sample period.
© 2014 University of Pretoria. All rights reserved. The copyright in this work vests in the University of Pretoria.

24
4.3 Event study method
The event study method has emerged as the pre-eminent method for analysing the
impact of corporate events on company performance when studying share price and
operating financial performance. Therefore, this method was chosen for this study.
The typical event study detailed in Mackinlay (1997) and Brown & Warner (1985) is
as follows:
1. Define the event and event window: This is the rights issue announcement,
specifically the date of declaration. The event window is the period in which it
is expected that the event will affect the share price, or the operating financial
performance of the company
2. Select companies for inclusion: Identify companies that will be included in the
dataset for the event study, this will be discussed later in 4.5.
3. Calculate normal and abnormal returns on the company share price: This will
be discussed in further detail later in 4.6.
4. Conduct statistical tests: The results of all statistical tests will be included in
chapter 5
5. Interpret Results and draw inference: the interpretation of statistical tests and
inferences made will be detailed in chapter 6 and 7
To accurately assess the excess or abnormal returns around a certain event, the
event study method is underpinned by these assumptions (Mushidzi & Ward, 2004):
• Market efficiency: share price includes all available public information
• Unanticipated events: the market only becomes aware of an event once it has
been announced
• Confounding effects: no other major event occur around the time of (one-two
before, and one to two days after) the announcement
With reference to (1) in 4.3. above, the declaration date was selected as the event
day because it is the first official announcement of the rights issue, through the
official Stock Exchange News Service. It can be argued that this date is more
© 2014 University of Pretoria. All rights reserved. The copyright in this work vests in the University of Pretoria.

25
important than the issue date/effective date for the rights issue, because it is at this
point that the assumption of market efficiency would be critical. Looking at the
effects of the rights issue on the issue date could potentially omit the immediate price
reaction to the rights issue announcement.
Furthermore considering the impact on issue date also has the complication of price
effects due to dilution, this is as a result of the increase in the total number of shares
in issue becoming effective (Firer, Ross, & Westerfield, 2012).
If markets were not efficient, it would be difficult to isolate the effect of the
announcement of a rights issue on the share price. Similarly, with unanticipated
events, if participants in the market became aware of a rights issue prior to the
announcement, then this would have a priori effect on the share price and it would
be difficult to capture the full effect of the announcement on the share price.
Confounding events that could potentially affect the share price around the time of
the announcement are also avoided to ensure that most of the price movement can
be attributed to the rights issue announcement. Other corporate events such as the
completion of an acquisition or financial restructuring fall within the scope of our
research objective and are to be included.
4.4 Data Collection
Data on rights issues on the JSE was sourced from the JSE and share data-portals.
The corporate events office at the JSE was generous enough to provide an archive
of rights issues going back as far as 2000. The JSE archive provided all relevant
information, such as the company name and share code, declaration date, issue
date and number of shares being issued.
All price-sensitive announcements are disseminated through the Stock Exchange
News Service (SENS). SENS is an electronic notice board which ensures that
information is available to investors, analysts and any other interested parties. All
SENS announcements from share data sites Sharenet and Sharedata were scanned
for specific information about rights issues for each issuing company during the
sample period. The SENS announcements were used to identify the intended
© 2014 University of Pretoria. All rights reserved. The copyright in this work vests in the University of Pretoria.
26
purpose for each rights issue. Sharenet and Sharedata were also used to verify the
date of declaration of the rights issue in the JSE Archive.
For purposes of analysing operating financial performance, data was collected
through a program provided by Mike Ward and Chris Muller from the Gordon
Institute of Business Science. This program sources data from the McGregorBFA
Database. Other company specific information such as the issuer’s market
capitalisation was sourced from a similar program which is sources data from the
monthly bulletin which is published by the JSE .
4.4.1 Share Price Performance – Event Window The period over which data collection and analysis was conducted, is known as the
event window. For this study, the selected event window was from 60 trading days
before the rights issue event day to 220 trading days after the event day.
4.4.2 Operating Financial Performance – Event Window To consider the long-run impact with regard to operating financial performance, the
event window was from two years before the event, to two years after the event. The
discrete nature of the operating financial performance data necessitates having a
relatively long event window when compared to the share price performance which
is based on continuous data.
4.5 Sampling Method and Size The sample for both share price performance and operating performance was JSE-
listed companies that announced seasoned equity offers or rights offers during the
selected period (Jan 2002 – Dec 2011).
© 2014 University of Pretoria. All rights reserved. The copyright in this work vests in the University of Pretoria.
27
Screening of the sample
As in Cotterell (2011), following on from Mackinlay (1997) and Pascoe, Ward, &
Mackenzie (2005), the criteria for inclusion of companies in the sample, when
conducting an event study, are found below:
• The sample is to be restricted to ordinary shares (Pascoe, Ward, &
Mackenzie, 2005)
• The sample is restricted to ZAR-denominated shares (Pascoe, Ward, &
Mackenzie, 2005)
• Rights issue announcements expected prior to the actual announcement on
SENS are to be excluded (Pascoe, Ward, & Mackenzie, 2005)
• Rights issuing companies that have shares which have no trading data during
the event window either because the company has been suspended or for
any other reason ,have no trading days during the event window will be
excluded (Pascoe, Ward, & Mackenzie, 2005)
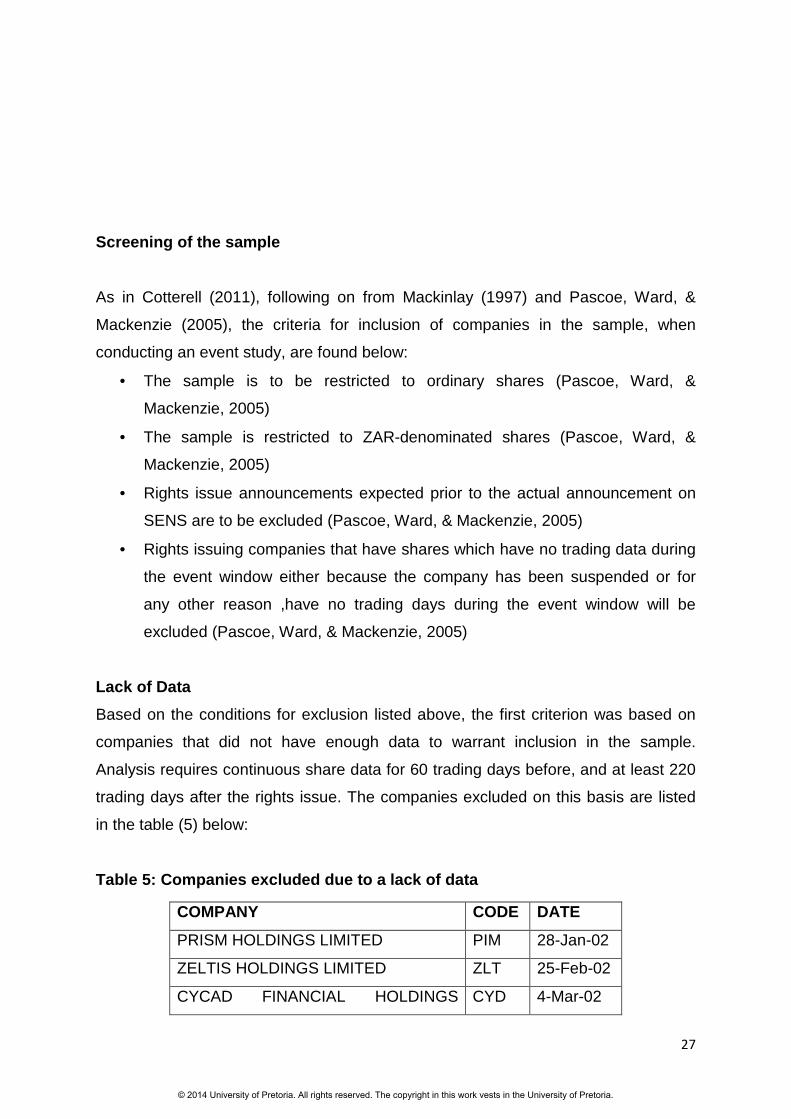
Lack of Data
Based on the conditions for exclusion listed above, the first criterion was based on
companies that did not have enough data to warrant inclusion in the sample.
Analysis requires continuous share data for 60 trading days before, and at least 220
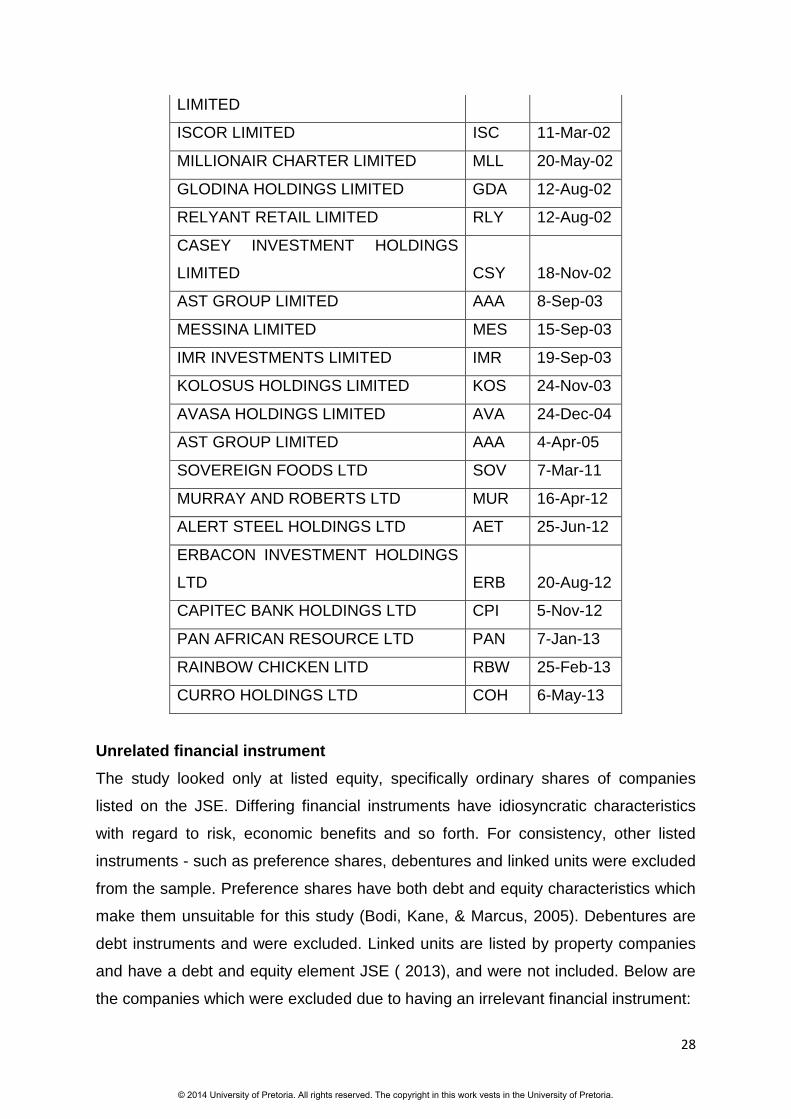
trading days after the rights issue. The companies excluded on this basis are listed
in the table (5) below:
Table 5: Companies excluded due to a lack of data
COMPANY CODE DATE
PRISM HOLDINGS LIMITED PIM 28-Jan-02
ZELTIS HOLDINGS LIMITED ZLT 25-Feb-02
CYCAD FINANCIAL HOLDINGS CYD 4-Mar-02
© 2014 University of Pretoria. All rights reserved. The copyright in this work vests in the University of Pretoria.
28
LIMITED
ISCOR LIMITED ISC 11-Mar-02
MILLIONAIR CHARTER LIMITED MLL 20-May-02
GLODINA HOLDINGS LIMITED GDA 12-Aug-02
RELYANT RETAIL LIMITED RLY 12-Aug-02
CASEY INVESTMENT HOLDINGS
LIMITED CSY 18-Nov-02
AST GROUP LIMITED AAA 8-Sep-03
MESSINA LIMITED MES 15-Sep-03
IMR INVESTMENTS LIMITED IMR 19-Sep-03
KOLOSUS HOLDINGS LIMITED KOS 24-Nov-03
AVASA HOLDINGS LIMITED AVA 24-Dec-04
AST GROUP LIMITED AAA 4-Apr-05
SOVEREIGN FOODS LTD SOV 7-Mar-11
MURRAY AND ROBERTS LTD MUR 16-Apr-12
ALERT STEEL HOLDINGS LTD AET 25-Jun-12
ERBACON INVESTMENT HOLDINGS
LTD ERB 20-Aug-12
CAPITEC BANK HOLDINGS LTD CPI 5-Nov-12
PAN AFRICAN RESOURCE LTD PAN 7-Jan-13
RAINBOW CHICKEN LITD RBW 25-Feb-13
CURRO HOLDINGS LTD COH 6-May-13
Unrelated financial instrument
The study looked only at listed equity, specifically ordinary shares of companies
listed on the JSE. Differing financial instruments have idiosyncratic characteristics
with regard to risk, economic benefits and so forth. For consistency, other listed
instruments - such as preference shares, debentures and linked units were excluded
from the sample. Preference shares have both debt and equity characteristics which
make them unsuitable for this study (Bodi, Kane, & Marcus, 2005). Debentures are
debt instruments and were excluded. Linked units are listed by property companies
and have a debt and equity element JSE ( 2013), and were not included. Below are
the companies which were excluded due to having an irrelevant financial instrument:
© 2014 University of Pretoria. All rights reserved. The copyright in this work vests in the University of Pretoria.

29
Table 6: Companies excluded due to being an unrelated financial instrument
FULL COMPANY NAME COD
E
DECLARATIO
N INSTRUMENT
DECILLION LIMITED DEC 12-Aug-02 DEBENTURE
EXCELLERATE HOLDINGS LIMITED EXL 19-Dec-02 DEBENTURE
PALABORA MINING COMPANY
LIMITED PAM 18-Aug-03 DEBENTURE
GLOBAL TECHNOLOGY LIMITED GLT 8-Mar-04 CONVERTIBLE
ARNOLD PROPERTY FUND ARP 19-Mar-04 LinkedUnits
ANGLO AMERICAN PLATINUM
CORP LD AMS 3-May-04 PREF SHARES
HYPROP INVESTMENTS LIMITED HYP 19-Jul-04 LinkedUnits
SIYATHENGA PROPERTY FUND
LIMITED SYA 31-Aug-05 LinkedUnits
PSG FINANCIAL SERVICES
LIMITED PSG 31-Oct-05 PrefShare
REDEFINE INCOME FUND LIMITED RDF 31-May-06 LinkedUnits
MONYETLA PROPERTY FUND LTD MYT 25-Jun-07 LinkedUnits
HOSPITALITY PROP FUND B HPB 22-Oct-07 LinkedUnits
HOSPITALITY PROP FUND A HPA 22-Oct-07 LinkedUnits
GROWTHPOINT PROPERTIES
LIMITED GRT 3-Dec-07 LinkedUnits
GROWTHPOINT PROP LTD GRT 26-Jan-09 LinkedUnits
ALEX FORBES PF SHARES INV AFP 23-Nov-09 PrefShare
HOSPITALITY PROP FUND A HPA 8-Nov-10 LinkedUnits
HOSPITALITY PROP FUND B HPB 8-Nov-10 LinkedUnits
PREMIUM PROPERTIES LTD PMM 21-Feb-11 LinkedUnits
FOUNTAINHEAD PROPERTY FPT 4-Apr-11 LinkedUnits
© 2014 University of Pretoria. All rights reserved. The copyright in this work vests in the University of Pretoria.

30
TRUST
HOSPITALITY PROP FUND A HPA 11-Jun-12 LinkedUnits
HOSPITALITY PROP FUND B HPB 11-Jun-12 LinkedUnits
CURRO HOLDINGS LIMITED COH 25-Jun-12 LinkedUnits
PALLINGHURST RES LTD PGL 16-Jul-12 LinkedUnits
OCTODEC INVEST LTD OCT 13-Aug-12 LinkedUnits
NEW EUROPE PROP INV PLC NEP 12-Nov-12 LinkedUnits
REBOSIS PROPERTY FUND LTD REB 28-Jan-13 LinkedUnits
DELTA PROPERTY FUND LTD DLT 26-Apr-13 LinkedUnits
SYCOM PROPERTY FUND SYC 20-May-13 LinkedUnits
VIVIDEND INCOME FUND LTD VIF 27-May-13 LinkedUnits
Second Rights Issue
For companies that had had more than one rights issue in the sample period, it was
decided to include the relatively larger rights issue by nominal value. The following
rights issues were excluded on this basis:
Table 7: Companies excluded due to a prior rights issue in the same period
COMPANY NAME CODE
DECLARATION
DATE
NEDCOR LIMITED NED 4-Jul-02
PSG GROUP LIMITED PSG 31-Oct-06
YORK TIMBER ORG YRK 20-Aug-07
METOREX LTD MTX 19-Jan-09
MEDI-CLINIC CORP LTD ORD MDC 2-Aug-10
Issue Size
The sample included rights issues that were greater than R100mm. R100mm was
selected as the minimum issue size to avoid some of the data issues that are
experienced for the ‘smallcaps’ on the JSE e.g. lack of liquidity, missing data. The
© 2014 University of Pretoria. All rights reserved. The copyright in this work vests in the University of Pretoria.

31
‘smallcaps’ are those companies that have a relatively small market capitalisation.
The following rights issues were excluded on this basis:
Table 8: Companies excluded due to a small issue size
COMPANY CODE DATE CAPITAL RAISED
AFRICAN BRICK CENTRE LTD ABK 13-Sep-10 20,139,348
ABSOLUTE HOLDINGS LTD ABO 6-Oct-08 12,840,485
AFROCENTRIC CORP INVESTMENTS LTD ACT 31-Aug-06
84,600,000
AFRICAN DAWN CAPITAL LTD ADW 24-Oct-11 25,000,000
ALERT STEEL HOLDINGS LTD AET 3-Oct-11 50,000,000
ALL JOY FOODS LTD ALJ 4-Aug-08 15,000,000
AVASA HOLDINGS LTD AVA 31-Jan-05 4,400,000
BEIGE HOLDINGS LTD BEG 12-Aug-02 37,480
BEIGE HODINGS LTD BEG 31-Dec-05 11,415,292
BEIGE HOLDINGS LTD BEG 9-May-11 25,000,000
BIOSCIENCE LTD BIO 19-Jan-09 31,822,101
DIGICORE HOLDINGS LTD DGC 14-Feb-11 90,000,000
DRDGOLD LTD DRD 31-Jul-05 86,922,638
FINBOND GROUP LTD FGL 5-Mar-12 20,000,000
FARITEC HOLDINGS LTD FRT 6-Jul-09 20,000,000
GLOBAL TECHNOLOGY LTD GLT 15-Apr-02 37,361
JOHN DANIEL HOLDINGS LTD JDH 10-Oct-11 15,000,000
LIBERTY INTERNATIONAL PLC LBT 15-May-09 951,616
MILKWORX LTD MKX 25-May-09 4,674,662
MATHOMO GROUP LTD MTO 11-Mar-02 37,326
ONELOGIX GROUP LTD OLG 17-Apr-03 37,728
PURPLE CAPITAL LTD PPE 25-Jun-07
© 2014 University of Pretoria. All rights reserved. The copyright in this work vests in the University of Pretoria.

32
44,555,892
RACEC GROUP LTD RAC 5-Jul-10 10,000,003
ROCKWELL DIAMONDS INC RDI 15-Mar-10 32,448,768
SALLIES LTD SAL 24-Dec-03 37,979
SALLIES LTD SAL 30-Jun-06 65,023,252
SALLIES LTD SAL 25-Jun-07 74,950,195
SALLIED LTD CD SAL 31-May-08 75,741,679
SABLE HOLDINGS LTD SBL 4-May-09 34,995,378
SECURE DATA HOLDINGS LTD SDH 14-Jul-08 15,770,001
SA FRENCH LTD SFH 27-Jun-11 20,000,000
SEKUNJALO INVESTMENT HOLDINGS LTD SKJ 24-Dec-03
37,979
SKINWELL HOLDINGS LTD SKW 26-Oct-09 6,888,373
STRATCORP LTD STA 18-Nov-02 37,578
SIZAFIKA INVESMENT HOLDINGS LTD SZA 31-Aug-06 6,887,500
TAWANA RESOURCES LTD TAW 20-Mar-08 13,166,641
TOP FIX HOLDINGS TFX 11-Feb-08 40,000,000
4.6 Data Analysis Approach In line with the different hypotheses detailed in chapter three, the approach to data
analysis was split into two sections. The first approach of data analysis was relevant
to hypotheses numbered one to four, which were related to the investigation of the
impact of rights issues at a share price performance level. The second approach was
relevant to hypothesis five which was based on the investigation of the impact of
rights issues at an operating financial performance level.
The first approach adopted the step process which was outlined in section 4.3. With
the test sample now selected, the next parts in sub-section 4.6.1.will explain the
measurement of abnormal returns. Sub-section 4.6.3. is an explanation of the
© 2014 University of Pretoria. All rights reserved. The copyright in this work vests in the University of Pretoria.

33
bootstrapped method which was used for testing statistical significance and
inference.
Similarly the analysis in 4.6.4 is related to the last hypothesis and provides the
method utilised for the measurement of abnormal operating financial performance.
This will be followed by an explanation of the paired sample t-test for statistical
significance and inference in 4.6.5. All tests will be performed at the 5% significance
level.
4.6.1. Measuring Abnormal Returns In measuring long run returns, it was prudent to be aware of the inherent biases that
some tests may have. These biases will be explained later in the chapter, as part of
the research limitations.
The two most prevalent methods of calculating abnormal returns in the long run were
cumulated abnormal returns (CAR) and buy-and-hold abnormal returns (BHAR).
With CAR, the monthly excess returns are cumulated for the selected period of
analysis (Mushidzi & Ward, 2004). The difference between these two returns is
compounding, CARs are simple while BHARs include compounding. The BHAR
method is able to provide a clearer distinction between portfolios (Mushidzi & Ward,
2004). However, if in calculating CARs we use log price returns and add them then
those, then CARs and BHARs will give a similar result. The log price return is shown
in (6) below:
Rit = log [Pit/Pit-1 ] …Equation 6
Rit is the log return for company i on day t
Pit is the share price for company i on day t.
The formula for the simple abnormal return is below (7):
…Equation 7
Where:
© 2014 University of Pretoria. All rights reserved. The copyright in this work vests in the University of Pretoria.

34
ARit is the abnormal return for company i on day t
Rit is the daily log-return for company i on day t from (6)
E(Rit) is the expected return on day t for company i,:
For measurement across time, during a selected event window, the accumulated
abnormal returns form cumulative abnormal returns is shown below in (8):
…Equation 8
Where:
is the cumulative abnormal return for company i from day 1 to day
is the simple abnormal return for company i on day t shown in (7) above
For purposes of this study, the abnormal returns were weighted using three different
methods. The first weighting is the equal weighting which gives the same weighting
to each cumulative average abnormal return . The second weighting is the log-issue
weighting which applies a log function to each cumulative average abnormal
weighted by issue size, the larger the rights issue the higher the weighting. The
relative issue weighting applies a weighting by taking the issue size relative to the
market capitalisation. Those rights issues which were relatively large issue size were
given a larger weighting.
The other instance of the CARs was to give equal weighting to each rights issue in
(9):
…Equation 9
Where:
is the cumulative average abnormal return for portfolio k from day 1 to day
is the cumulative abnormal return for company i from day 1 to day , from (8)
© 2014 University of Pretoria. All rights reserved. The copyright in this work vests in the University of Pretoria.

35
The effect of compounding, which is the point of difference between CARs and
BHARs, can be seen in the formula (10) below:
…Equation 10
Where:
is the buy-and-hold return for company i from day 1 to day
is the expected return for company I from day 1 to day γ
Rit is the daily simple return for company i on day t
As mentioned earlier in chapter three, there are a few ways in which the normal
expected, or benchmark return can be calculated. These benchmarked returns were
used to find the abnormal return as seen above in equation (7).
A stylised version of the three-factor model by Fama & French, (1993) was used to
construct control portfolios to calculate the benchmark return. The stylised version
appears in Ward & Muller (2010), Smit & Ward (2007) and Mordant & Muller (2003).
The benchmark return was the critical element in the calculation of abnormal returns.
It is important to consider the choice of benchmark in event studies that investigate
abnormal returns (Ward & Muller, 2010). This study used the control portfolio
approach by Ward & Muller (2010) because it effectively removed biases associated
with rebalancing and skewness (Barber & Lyon, 1996).
Eckbo, Masulis, & Norli (2000) proposed that the matched-firm technique, that was
found in previous studies such as Loughran & Ritter (1995), did not adequately
account for risk. Further to this, using an alternative such as a market index as a
benchmark, produced test statistics with significant biases (Barber & Lyon, 1997).
© 2014 University of Pretoria. All rights reserved. The copyright in this work vests in the University of Pretoria.

36
Similar to Ward & Muller (2010), a twelve parameter ‘style’ model was used to
estimate benchmark returns. The twelve ‘control’ portfolios of shares, representing
factors such as size, growth/value and resources/non-resources, were created. The
factors of ‘size’ and ‘value/growth’ used in the ‘style’ engine model from Ward &
Muller (2010) have been a mainstay in stock return factor-analysis going back to
Fama & French (1993, 1996). This was due to their reliability in predicting stock
returns.
The ‘resource/nonresource’ factor is particularly relevant to the JSE given the large
number of resource companies listed on the main board; with many stocks on the
JSE being particularly sensitive to resource prices (Gilbertson & Goldberg, 1981).
Each company’s size was measured by market capitalisation. All companies listed
on the JSE were ranked in descending order of market capitalisation. Three ‘size’
portfolios were constructed – small, medium and large (Ward & Muller, 2010).
Companies were then classified as either ‘growth’ or ‘value’ by looking at the price-
earnings ratio. The price-earnings (PE) ratio for the benchmark companies was
calculated and ranked. Companies with PE ratios above the median were included in
the ‘growth’ portfolio, while those with PE ratios below the median were included in
the ‘value’ portfolio (Ward & Muller, 2010).
All resource companies were included in the ‘resource’ control portfolio, with all other
companies being included in the ‘non-resource’ portfolio. The control portfolios were
rebalanced every quarter so that any relevant changes in share characteristics such
as price-earnings, market capitalisation and new listings/de-listings were taken into
account.
Daily equal-weighted indices were calculated using log returns:
Ṙit = log [P it/Pit-1 ] ...Equation 11
Ṙit is the equal weighted share return for portfolio i and day t; Pit is the equal
weighted share value of portfolio i and at the end of day t.
As per Ward & Muller (2010), the beta coefficients were calculated for each share in
the sample by regressing each share’s log-function share price return for 36 months
against the monthly returns of each control portfolio for the matching period. Alphas
© 2014 University of Pretoria. All rights reserved. The copyright in this work vests in the University of Pretoria.

37
and Betas were updated on a rolling monthly basis. It was assumed that each month
has 20 trading days.
This control portfolio model measured the expected return of share i in period t. This
will be the sum of sensitivity to the returns on the twelve portfolios and a calculated
alpha estimate in period t (Ward & Muller, 2010).
…Equation 12
Where:
is the expected return on security i, on day t
is the alpha intercept term of security i on day t
are the beta coefficients on each control portfolio return
SGNt …SGRt is the log function share price returns on each of the twelve control
portfolios
4.6.2 Classifying Intended Use of Proceeds The second part of the study (which covers hypotheses two to four) aimed to
investigate the performance of companies that were specific about how they
intended to use the proceeds of the rights issue. This required the sample to be split
up into sub-samples based on specified categories. The same procedure which
applied to the initial sample was repeated at a category level. Three classifications or
categories were identified in the sample. Similar to Autore, Bray, & Petersen (2008),
the categories were: investment, debt-repayment and general corporate purposes.
In line with the literature, it was posited that any rights issuer fell into one of these
categories above. The investment category included those issuers that explicitly
mentioned that the purpose of the rights issue was for investment. Investment in that
regard included a number of scenarios. The ‘investment’ scenarios were any
activities which could potentially generate economic benefits which were directly
related to operations or the expansion thereof. These scenarios included
acquisitions, capital expenditures and working capital. For example, Omnia Holdings
Ltd. (FTSE/JSE ShareCode: OMN) were specific in their SENS announcement dated
© 2014 University of Pretoria. All rights reserved. The copyright in this work vests in the University of Pretoria.

38
21 June 2013, clearly stating that the capital raised in the rights issue would be used
for investment in the construction of a new facility.
The ‘debt-repayment’ category included any rights issuing companies that intended
to recapitalize their business. The debt repayment scenarios included instances
where the company makes a straight cash payment to reduce outstanding liabilities,
but also any conversion of debt to equity. This is because the conversion would have
the same effect of reducing the debt book.
The ‘general’ category included those companies that had not been specific about
the purpose for the rights offer in their announcement. Some companies were
ambiguous in that they stated that the rights issue would be used for repaying debt
and for investment purposes, without giving an indication of which was more
important. In such a case, that company was included in the general category.
The categories were also subjected to the same bootstrapping statistical analysis,
similar to that done for hypothesis one.
4.6.3 Bootstrapping Analysis With the data now modelled appropriately in terms of measurement of abnormal
returns and calculation of CAARs, the penultimate stage in the study was to
statistically analyse the data. This was done in order to make inferences about the
broader population based on the selected sample. Bootstrapping was used for
hypotheses one to four in this study.
The bootstrapping method is a computer-intensive statistical procedure which can be
used to estimate the sampling distribution of an estimator - which is the CAAR or
average abnormal return (AAR) in this study. The bootstrap method can be used in
both parametric and nonparametric instances (Rochowicz, 2011). The bootstrapping
method is particularly useful when looking at nonparametric distributions where no
assumption has been made about the data or its parameters (Rochowicz, 2011).
The bootstrap method uses the sample as the population; randomly drawing a large
number of ‘resamples’ of size n from this original sample (of size n also) with
replacement. Also, the process compels a practitioner to use many observations
which means that any inferences made are based on large sample sizes
(Rochowicz, 2011).
© 2014 University of Pretoria. All rights reserved. The copyright in this work vests in the University of Pretoria.
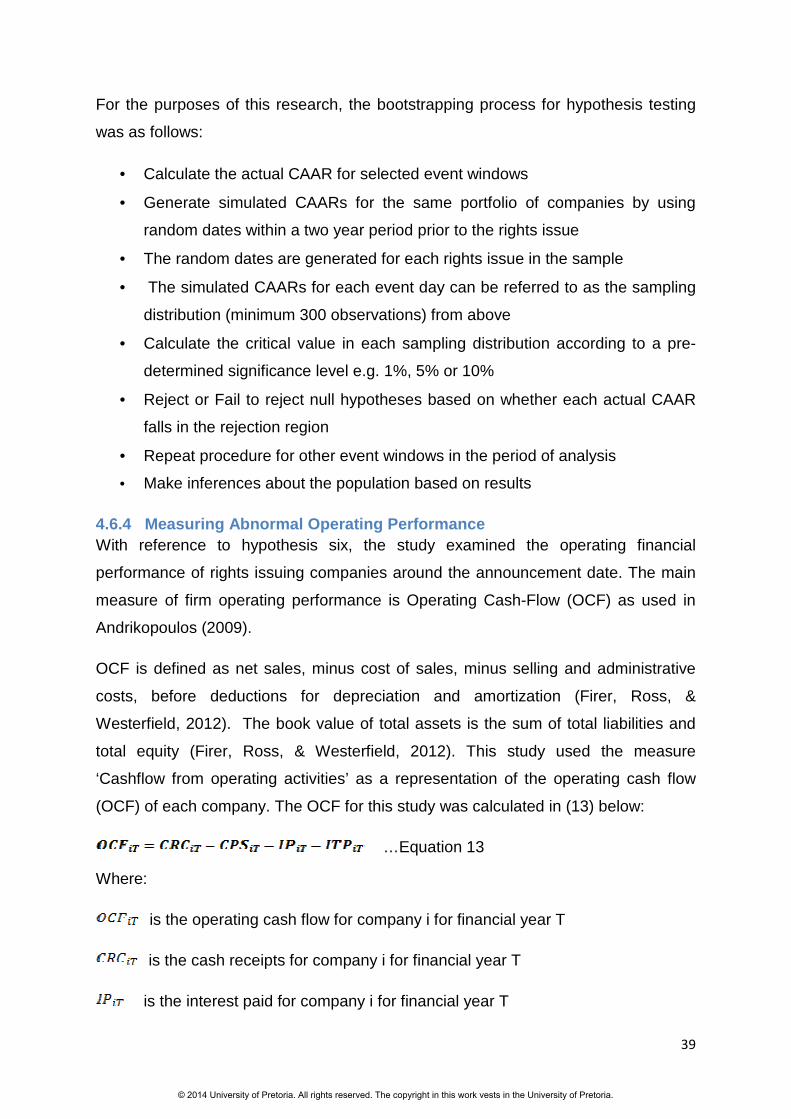
39
For the purposes of this research, the bootstrapping process for hypothesis testing
was as follows:
• Calculate the actual CAAR for selected event windows
• Generate simulated CAARs for the same portfolio of companies by using
random dates within a two year period prior to the rights issue
• The random dates are generated for each rights issue in the sample
• The simulated CAARs for each event day can be referred to as the sampling
distribution (minimum 300 observations) from above
• Calculate the critical value in each sampling distribution according to a pre-
determined significance level e.g. 1%, 5% or 10%
• Reject or Fail to reject null hypotheses based on whether each actual CAAR
falls in the rejection region
• Repeat procedure for other event windows in the period of analysis
• Make inferences about the population based on results
4.6.4 Measuring Abnormal Operating Performance With reference to hypothesis six, the study examined the operating financial
performance of rights issuing companies around the announcement date. The main
measure of firm operating performance is Operating Cash-Flow (OCF) as used in
Andrikopoulos (2009).
OCF is defined as net sales, minus cost of sales, minus selling and administrative
costs, before deductions for depreciation and amortization (Firer, Ross, &
Westerfield, 2012). The book value of total assets is the sum of total liabilities and
total equity (Firer, Ross, & Westerfield, 2012). This study used the measure
‘Cashflow from operating activities’ as a representation of the operating cash flow
(OCF) of each company. The OCF for this study was calculated in (13) below:
…Equation 13
Where:
is the operating cash flow for company i for financial year T
is the cash receipts for company i for financial year T
is the interest paid for company i for financial year T
© 2014 University of Pretoria. All rights reserved. The copyright in this work vests in the University of Pretoria.

40
is the income tax paid for company i for financial year T
The benefit of using this measure is that it is considered by McLaughlin, et al (1996)
to be a ‘clean’ measure of operating performance because:
• Earnings can include elements like interest expense, and special items which
can equivocate operating financial performance
• Operating cash flows represent the economic benefits to the firm
• OCF is not affected by changes in tax status and/or tax structure
To be able to compare different companies, we will scale the OCF in (9) by assets,
shown in (14) below:
...Equation 14
Where:
is the cash flow return on assets of company i for financial year T
is the operating cash flow of company i for financial year T from (9) above
is the book value of total assets of company i for financial year T
The operating cash flow was scaled by the book value of total assets to allow for
comparison across companies and industries, similar to Smit & Ward (2007),
Loughran & Ritter (1997) and Spiess & Grave (1995). Total assets was calculated as
the sum of total equity and total liabilities (Firer, Ross, & Westerfield, 2012).
However, it is acknowledged that this CFRA measure is susceptible to downward
bias, given that asset values would be expected to increase after a seasoned equity
offer (Andrikopoulos, 2009) and (McLaughlin, Safieddine, Vasudevan, & Gopala,
1996). However, by looking at performance up to 24 months after the event – it was
expected that those assets would have enough time to be productive
(Andrikopoulos, 2009).
© 2014 University of Pretoria. All rights reserved. The copyright in this work vests in the University of Pretoria.

41
Similar to the method for calculating abnormal returns, each issuer’s abnormal
operating financial performance was measured before and after the rights issue
announcement for selected event windows.
The abnormal operating financial performance was calculated using the matched-
company principle, based on size (market capitalisation) and sector (nature of
business), which is similar to Spiess & Grave’s (1995) approach. It was important to
note that this size and nature of business was based on the period in which the
declaration announcement was made, to make for a more accurate and up-to-date
comparison. The formula for this industry-adjusted cash flow return is shown below:
…Equation 15
Where:
is the industry-adjusted cash flow return on assets for company i for
financial year T
is the cash flow return on assets for company i for the financial year T
is the cash flow for matching company j for financial year T
4.6.5 T-test Analysis A two-sample paired t-test was used to compare the industry-adjusted cash flow
return on assets for the years before and after the rights issue. The research design
was similar to that of Smit & Ward (2007) and Healy & Palepu (1992). This t-test was
relevant to hypothesis five, and provided the opportunity to explore the effects of a
rights issue at the operating financial performance level.
The t-test statistic was based on both median and average industry-adjusted cash
flow returns on assets. The use of the median was to control for the effect of outliers.
This was important given that there was the potential for high variability in the
industry-adjusted cash flow returns at a company level. The aim was to determine if
the pre-event mean IACFRA t-statistic, and the post-event IACFRA t-statistic were
significantly different from each other, following Smit & Ward (2007) and Healy &
© 2014 University of Pretoria. All rights reserved. The copyright in this work vests in the University of Pretoria.

42
Palepu (1992). The t-statistics for the average IACFRA before and after the rights
issue event was calculated as the mean IACFRA divided by the cross-sectional
standard error (Healy & Palepu, 1992). Similarly, the median IACFRA was calculated
as the median IACFRA divided by the cross-sectional standard error (Healy &
Palepu, 1992).
4.7 Research Limitations The study only considered companies listed on the JSE, which is subject to its own
idiosyncrisies as a market (Cotterell, 2011) and (Smit, 2005). This means that the
findings of this study cannot be generalized to rights issues on other stock
exchanges.
The sampling method purposely excluded smaller rights issue to focus on the larger
rights issues. Thus the findings of this study cannot be applied to small rights issues
that are less than R100mm in nominal size. The avoidance of smaller rights issues
was to minimize the data integrity problems that arise in analysing small companies
listed on the JSE.
While the chosen event study methodology is the most prevalent form of analysis in
the field of finance, the research does have its limitations. These limitations are due
to the different aspects in the research process. These aspects include the method
of statistical analysis, the time horizon, and biases found in the data and the
measurement thereof. Event studies can also be seen as a joint test, one test for the
CARs’ statistical significance, and the other test for the assumptions or approach for
constructing the abnormal returns (Kothari & Warner, 2007). This joint test has the
effect of reducing the power of the test.
Another issue related to event studies and calculating stock returns is that long-run
abnormal returns are positively skewed, the longer the horizon the larger the extent
of the bias (Barber & Lyon, 1997). The use of control firms assisted in mitigating the
‘skewness’ bias because both the sample and control firms are subject to the same
skewing factors. Barber & Lyon ( 1997) have also shown that CARs are biased
estimators of BHARs and are subject to measurment bias. Looking at long-run event
windows means that abnormal returns are likely to have other material transactions
© 2014 University of Pretoria. All rights reserved. The copyright in this work vests in the University of Pretoria.

43
or announcements priced in at some point during the period of analysis. This is
unavoidable, and to remove companies based on these confounding events would
mean the study would have no sample at all (Kothari & Warner, 2007).
The bootstrapping method has some disadvantages. These include the need for a
powerful computer and the need for large samples size in data generation. An
unavoidable limitation in calculating operating performance is the use of accounting-
measured data. Accounting measured data is subject to varying accounting
assumptions, this is mitigated by using operating cash flows when looking at
operating performance.
© 2014 University of Pretoria. All rights reserved. The copyright in this work vests in the University of Pretoria.

44
5. Results
The chapter commences by providing a brief description of the sample. This is
followed by graphical plots of the abnormal returns for the selected periods. The key
section in this chapter is the statistical analysis used to test hypotheses one to five.
5.1 Description of Sample The sample consists of rights issues from a population of 175 rights issues from
January 2002 to December 2011. The rights issues were selected based on the
criteria described in 4.5 above, to form the full sample of 50 rights issues. The key
criterion for consideration was the availability of data concerning both the rights
issues and the purpose of the rights issue. Other criteria are further described in 4.5
above. These criteria became relevant with respect to the sampling for the operating
performance group. The initial sample of 50 rights issues was reduced to 33 for the
operating performance sample due to issues with data collection.
For the purposes of further analysing share price performance, the sampling process
included the selection of sub-samples based on specific details concerning each
rights issue as mentioned in 4.6.3 above. The three sub-samples created consist of
the debt-repayment sample of 27 rights issues, the investment sample of 15 rights
issues and the general sample of 8 rights issues. The bulk of the rights issues
selected were within the last 5 years, with the rights issue having a median issue
size of 500million rand, and average issue size of 100million rand. The size of the
issue was scaled by the average market capitalisation of the issuing company to give
a relative issue size. In terms of the relative issue size, the full sample had a median
value of 14.09% and a mean value of 46.13%.
© 2014 University of Pretoria. All rights reserved. The copyright in this work vests in the University of Pretoria.

45
Table 9: Summary of rights issues announced between 2002 and 2011 based on chosen sampling criteria
Population Size 175 Full Sample Size 50
Debt-Repayment Sample Size 27 Investment Sample Size 15 General Sample Size 8
Operating Financial Performance
Full Sample Size 33 Frequency of Year Occurrence (based on full sample)
2002 2 2003 1 2004 2 2005 5 2006 3 2007 1 2008 6 2009 12 2010 14 2011 5
Size of Rights Issue (nominal R' million)
Maximum 13,477
Minimum 100
Mean 1,449
Median 500
Relative Size of Rights Issue (relative to market capitalisation of issuing company)
Maximum 120.32% Minimum 1.83% Mean 46.13% Median 14.09%
© 2014 University of Pretoria. All rights reserved. The copyright in this work vests in the University of Pretoria.

46
Descriptive statistics were calculated for each sample according to the three
weightings. These statistics provide insight into the differences in the CAARs that are
due to the selected weighting. These statistics are shown in Table 10 below.
Table 10: Descriptive Statistics for cumulative average abnormal returns based on three weightings across all samples for the full event window [-40, 220] days
Full Sample ( n = 50) Mean Median Std. Deviation Minimum Maximum
Equal-weighted CAAR -6.97% -6.37% 3.73% -12.93% 0.37% (Ln) issue-weighted CAAR -3.66% -3.28% 2.88% -9.66% 1.67% Relative issue-weighted CAAR -5.25% -5.95% 3.11% -10.23% 1.55% Debt-Repayers Sample ( n = 27) Equal-weighted CAAR -5.82% -5.17% 4.34% -13.61% 3.35% (Ln) issue-weighted CAAR -0.80% -1.18% 3.66% -7.01% 6.45% Relative issue-weighted CAAR -9.24%
-10.41% 6.37% -19.10% 5.06%
Investment Sample ( n = 15) Equal-weighted CAAR -6.72% -6.48% 3.92% -16.89% 2.93% (Ln) issue-weighted CAAR -5.53% -5.18% 3.26% -13.73% 2.91% Relative issue-weighted CAAR
-23.00%
-25.71% 11.22% -46.54% 9.34%
General Sample ( n = 8)
Equal-weighted CAAR -11.22%
-11.52% 5.73% -26.48% 1.94%
(Ln) issue-weighted CAAR
-13.10%
-13.88% 4.29% -23.24% -0.55%
Relative issue-weighted CAAR
-10.15% -9.65% 7.32% -27.40% 7.38%
5.2 Performance of CAARs The aim of the study was to assess the impact of rights issues on share price
performance. Cumulative average abnormal returns (CAARs) were used as the
proxy variable for share price performance. The CAARs are based on cumulative
average abnormal returns for each event day over a chosen event window.
© 2014 University of Pretoria. All rights reserved. The copyright in this work vests in the University of Pretoria.

47
The average abnormal returns are calculated by finding a weighted average of the
abnormal returns according to the chosen weighting (equal, relative-issue, log-
issue).
The research objectives of this study are premised on statistical analysis of
cumulative average abnormal returns (CAARs). The average abnormal returns are
the accumulated to make CAARs, and looking at them may give some insight into
underlying patterns in the CAARs. Figure 1 below is a plot of the average abnormal
returns.
Figure 1: Equal-weighted average abnormal returns (AARs) for the full sample during the full event window
The graph in figure tw6 below depicts the different weighted average abnormal
returns that were accumulated during the event window. There were three
weightings that were calculated for analysis, namely the equal-weighting, logarithmic
issue-weighting and weighting by relative size of issue. The equal-weighting gives
the same level of importance to each rights issue.
© 2014 University of Pretoria. All rights reserved. The copyright in this work vests in the University of Pretoria.

48
The logarithmic issue-weighting attaches more importance to the larger the rights
issues, however this is scaled down by using a log-function. The relative issue-
weighting gave more importance to right issues that were larger when compared to
the market capitalisation of the rights issuer.
Figure 2: Full Sample Cumulative Average Abnormal Returns (CAARs) based on different weightings during the full event window [-40,220] in trading
days
The data was analysed using a bootstrapped distribution, which was also used for
hypothesis testing. With relevance to hypothesis one, the analysis was conducted on
the full sample of rights issues based on three weightings briefly described above in
5.1. The event windows selected for analysis were based on figure 2, within the
context of the research objective of assessing performance in the long run. At most,
3 event windows were selected across variable (CAAR), sample (full, invest, debt-
repaying, general) and weighting (issue or equal weighting. Each event window
began at day 0, to assess the subsequent impact of the rights issue on share price
© 2014 University of Pretoria. All rights reserved. The copyright in this work vests in the University of Pretoria.

49
performance. All hypothesis testing was undertaken at the 5% significance level.
Test results in the output Table 11 below are all one-sided.
© 2014 University of Pretoria. All rights reserved. The copyright in this work vests in the University of Pretoria.

50
Table 11: Analysis of Cumulative Average Abnormal Returns (CAARs) of the full Sample for selected event windows
Full Sample n = 50
(Ln) Issue-Weighted CAARs
Event Day Window Daily CAAR
Bootstrap Cutoff Value Significant
[0, 32] -6.51% -5.82% Y
[0, 82] -8.82% -7.89% Y
[0, 112] -9.17% -10.08% N *
Equal-Weighted CAARs
[0, 33] -12.79% -3.99% Y
[0, 73] -12.19% -4.58% Y
[0, 115] -12.74% -4.34% Y
Relative Issue-Weighted
[0, 26] -11.31% -6.57% Y
[0, 77] -11.25% -11.87% N *
[0, 108] -13.84% -14.39% N * * - this indicates statistical significance at the 10% level
The full sample was further categorised into the three groups (Debt-Repaying,
Investment and General) explained in 4.6.3. The three categories allowed for testing
related to hypotheses two to hypothesis five, which aimed to assess the impact of
the rights issue on the share price performance of the specific group. Figure 3 is a
graphical plot of the performance of the equal weighted CAARs for the sub-samples
for the full event window.
© 2014 University of Pretoria. All rights reserved. The copyright in this work vests in the University of Pretoria.

51
Figure 3: Equal-weighted cumulative average abnormal returns (CAARs) by sub- sample for the full event window [-40,220] in trading days
© 2014 University of Pretoria. All rights reserved. The copyright in this work vests in the University of Pretoria.

52
Figure 4 below is a plot of the log-issue-weighted CAARs for the sub-samples over the for the full event window.
Figure 4: (Ln) issue-weighted cumulative average abnormal returns (CAARs) by sub-sample for the full event window [-40,220] in trading days
© 2014 University of Pretoria. All rights reserved. The copyright in this work vests in the University of Pretoria.

53
Figure 5 below depicts the relative issue-weighted CAARs for the three sub-samples for the full event window.
Figure 5: Relative issue-weighted cumulative average abnormal returns (CAARs) by sub-sample for the full event window [-40,220] in trading days
Following from the graphical representation of the share price performance after the
rights issue, the study conducted bootstrapping and hypothesis testing at the
category level. This was completed in order to ensure a more rigorous analysis of
the subsequent impact of the issue on share price. Each category (Debt-Repaying,
Investment, General) was tested based on equally-weighted and issue-weighted
CAARs. Similar to Hypothesis 1, a few key event windows were identified and tested
for statistical significance at the 5% level. The issue-weighted ‘general’ sample was
not tested due to the small sample size. Table 13 below shows the category results
of the one-sided tests.
© 2014 University of Pretoria. All rights reserved. The copyright in this work vests in the University of Pretoria.

54
Table 12: Analysis of cumulative average abnormal returns of sub-samples for selected event windows
Debt-Repayment Sample n = 27
Event Day Window Daily CAAR
Bootstrap Cutoff Value Significant
(Ln) Issue-weighted CAARs [0, 33] -5.87% -9.92% N [0, 121] -7.01% -20.86% N Equal-weighted CAARs [0, 28] -10.17% -8.20% Y [0, 73] -12.11% -13.69% N * [0, 112] -13.52% -18.77% N Relative issue-weighted CAARs [0, 26] -17.30% -10.98% Y [0, 73] -16.99% -22.94% N [0, 108] -19.10% -25.94% N Investment Sample n = 15 (Ln) issue-weighted CAARs [0, 83] -13.56% -10.4% Y [0, 108] -13.09% -11.8% Y Equal-weighted CAARs [0, 68] -16.89% -16.20% Y [0, 93] -13.13% -20.40% N [0, 207] -11.05% -31.50% N Relative issue-weighted CAARs [0, 67] -32.31% -36.10% N * [0, 93] -30.27% -43.80% N [0, 126] -21.42% -50.00% N General Sample n = 8 (Ln) Issue-weighted CAARs [0, 28] -17.82% -13.32% N * [0, 131] -14.94% -39.04% N Equal-weighted CAARs [0, 31] -24.82% -22.24% Y [0, 67] -10.40% -19.30% N [0, 127] -16.05% -21.50% N Relative issue-weighted CAARs [0, 28] -39.16% -19.91% N
[0, 77] -23.50% -35.10% N [0, 127] -13.91% -40.98% N
* - indicates statistical significance at the 10% level
© 2014 University of Pretoria. All rights reserved. The copyright in this work vests in the University of Pretoria.

55
5.3 Operating Financial Performance The study measured operating financial performance by performing t-tests on
Industry-Adjusted Cash Flow Return on Total Assets (IACFRA). Both the operating
cash flow and asset values were taken from the financial statements of each rights
issuing company. In this study, the total assets were based on book value, which
was similar to McLaughlin et al (1996). The tests were conducted to test hypothesis
five. The approach included looking at one-sample t-tests for each financial year in
consideration. A two-sample paired t-test was conducted between paired financial
years to assess performance before and after the rights issue. The paired periods
were analysed starting from two years before the issue, ending at two years after the
issue. The tests looked at both the median and mean of the operating cash flow
return on assets, which had been adjusted by matched-firm cash flow returns on
assets (IACFRA).
The mean t-stat was calculated as the mean IACFRA for that year divided by the
standard error for the sample for the same period. Similarly, the median t-stat was
calculated as the median for that year divided by the standard error for the same
period. The standard deviation is also included below. All tests for statistical
significance were conducted at the 5% level.
© 2014 University of Pretoria. All rights reserved. The copyright in this work vests in the University of Pretoria.
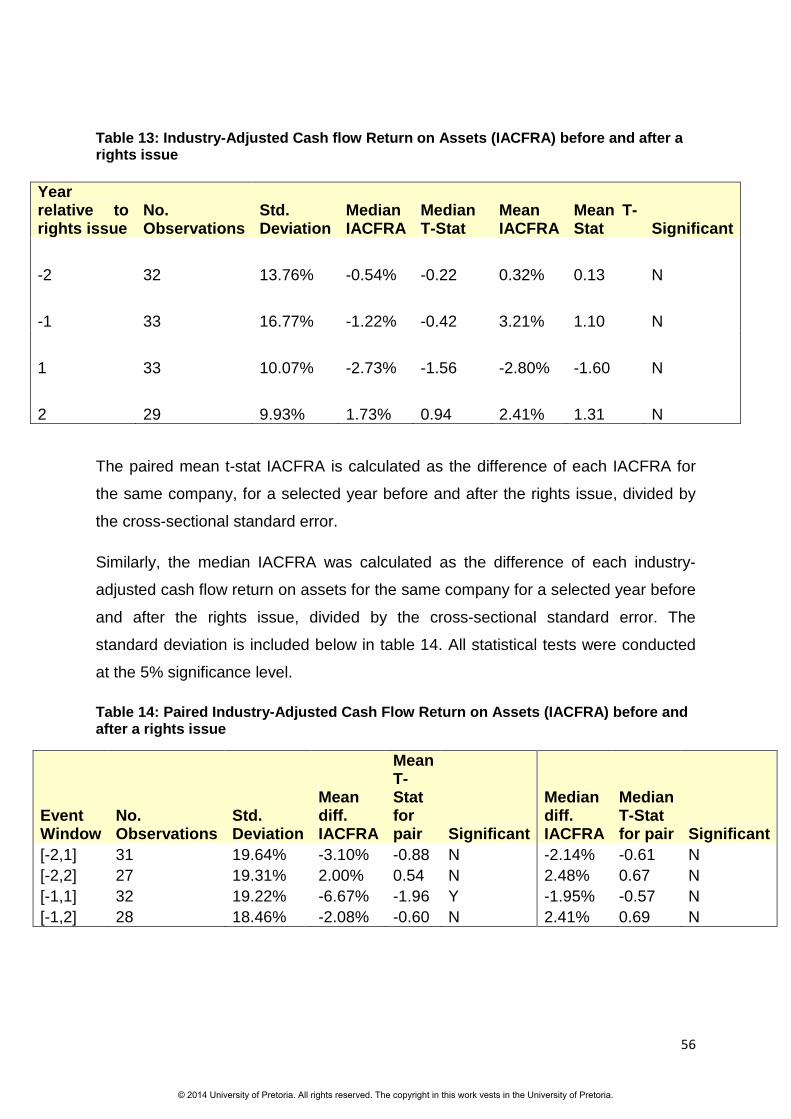
56
Table 13: Industry-Adjusted Cash flow Return on Assets (IACFRA) before and after a rights issue
The paired mean t-stat IACFRA is calculated as the difference of each IACFRA for
the same company, for a selected year before and after the rights issue, divided by
the cross-sectional standard error.
Similarly, the median IACFRA was calculated as the difference of each industry-
adjusted cash flow return on assets for the same company for a selected year before
and after the rights issue, divided by the cross-sectional standard error. The
standard deviation is included below in table 14. All statistical tests were conducted
at the 5% significance level.
Table 14: Paired Industry-Adjusted Cash Flow Return on Assets (IACFRA) before and after a rights issue
Event Window
No. Observations
Std. Deviation
Mean diff. IACFRA
Mean T-Stat for pair Significant
Median diff. IACFRA
Median T-Stat for pair Significant
[-2,1] 31 19.64% -3.10% -0.88 N -2.14% -0.61 N [-2,2] 27 19.31% 2.00% 0.54 N 2.48% 0.67 N [-1,1] 32 19.22% -6.67% -1.96 Y -1.95% -0.57 N [-1,2] 28 18.46% -2.08% -0.60 N 2.41% 0.69 N
Year relative to rights issue
No. Observations
Std. Deviation
Median IACFRA
Median T-Stat
Mean IACFRA
Mean T-Stat Significant
-2 32 13.76% -0.54% -0.22 0.32% 0.13 N
-1 33 16.77% -1.22% -0.42 3.21% 1.10 N
1 33 10.07% -2.73% -1.56 -2.80% -1.60 N
2 29 9.93% 1.73% 0.94 2.41% 1.31 N
© 2014 University of Pretoria. All rights reserved. The copyright in this work vests in the University of Pretoria.
57
6. Discussion of Results
This chapter will provide a synthesis of the results presented in chapter five. The
results will be broken down according to the research objectives and hypotheses set
out in chapter three, and interpret these results with the scope of the literature review
in mind. Hypotheses one to four cover the assessment of the long run impact of
rights issues with respect to share price performance. Hypothesis five is related to
same research objective with respect to operating performance. Given that the
research objectives are all within the time-context of the long run, only those results
that were statistically significant or close to statistical significance were included in
the analysis. In order to be more comprehensive, the study also analysed returns
based on different weightings after seeing the effects of different weightings on the
results.
6.1 Share price performance
The average abnormal returns in figure one do not exhibit any discernible pattern.
The 95% confidence interval is included. The mean equal weighted AAR of -0.01%
was tested using a normal distribution, and was not significant at the 5% error level.
6.1.1. Cumulative average abnormal returns for full sample The cumulative average abnormal returns (CAARs) were calculated for the full
sample and three sub-samples. Figure 2 from 5.2 shows the CAARs for the full event
window, according to three different weightings. The graph depicts the noticeable
effect that weighting can have on the results. The study therefore aimed to be
circumspective by performing tests for all three weightings of CAARs, those being
the log issue-weighted, equal-weighted and relative issue-weighted CAARs.
With particular reference to the full sample, the descriptive statistics detailed in Table
10 show that the weighting with the least volatility in abnormal returns was the log
issue-weighted CAAR, with a standard deviation of 2.88%. The mean CAAR for each
© 2014 University of Pretoria. All rights reserved. The copyright in this work vests in the University of Pretoria.

58
weighting for the full sample ranged from -3.66% for the log issue-weighted CAARs
to -6.97% for the equal-weighted CAARs.
The graph in figure 2 shows the full sample CAARs, which steeply fall over the first
50 trading days after the declaration of a rights issue, with the equal-weighted CAAR
dropping to -12.79% for day 33, and log issue-weighted CAARs at -7.02% for day 31
and relative issue-weighted CAAR at -8.33% at day 26. The equal-weighted CAARs
have an approximate range of 5% between -6.03% and -11.37% from day 19 to
around day 132. Similarly, the log issue-weighted CAARs are within a range of
approximately 4.1%, with returns between -4.84% and -8.95% from day 23 to day
116. The relative issue weighted CAARs are within a range of 2% between -7.01%
day 22 and -9.10% at day 121. All CAARs rapidly increase in the last 100 days of the
event window, with the log issue-weighted returns levelling out at levels closer to
zero in the last 60 days.
A number of event windows were tested for significance, with the event windows that
displayed the most observably negative CAARs garnering the most interest. All
selected event windows were identified and tested using simulated distributions for
hypothesis testing. The results for the full sample are detailed in table 10. The event
windows ending at day 32 and day 82 had log issue-weighted daily CAARs of -
6.51% and -8.82% respectively. Both of these CAARs were found to be significant at
the 5% level. The event window ending at day 112 had a log issue-weighted CAAR
of -9.17% which was not significant at the 5% level.
Remaining within the full sample, the equal-weighted CAARs were more pronounced
with CAARs of -12.79%, -12.19% and -12.74% for days 33, 73 and 115 respectively.
All three equal-weighted CAARs were found to be significant at the 5% error level.
The relative issue-weighted CAARs for the full sample were bootstrapped and tested
for event windows ending at day 26, day 77 and day 108. The day 26 CAAR was
found to be statistically significant at the 5% level. All three different weightings for
the CAARs have produced results which support the expectation of poor share price
performance after a rights issue.
© 2014 University of Pretoria. All rights reserved. The copyright in this work vests in the University of Pretoria.

59
There are a number of studies that have explored the relationship between rights
issues and share price performance.
Locally, the last published paper was that from Bhana (1998) which looked at the
cumulative abnormal returns (CARs) using regression analysis. This research report
looks at a –40 to 220 day event window, while Bhana (1998) examined a shorter
window of -40 day to 40 day event window. Due to different methods of analysis and
event windows, this paper is not directly comparable to Bhana (1998). However,
both studies have similar CARs between days 30 and 40, with the 31 day issue-
weighted CAR of -7.01% in this study, against a CAR of -5.22% at day 40 in Bhana
(1998).
The study’s findings are consisent with those of Spiess & Grave (1995) whose study
had a 24-month CAR of -12.83% which was significant at the 5% level. The long run
study by Autore, Bray, & Petersen (2008) looked at buy-and-hold returns (BHARs)
over three years and found a mean BHAR of -11.15% to be significant at the 5%
level. The findings from table 9 show the subsequent underperformance of JSE
listed companies up to a year after an equity issue, which is in line with the literature.
The findings appear to support market timing theories from Myers & Majluf (1984)
and Loughran & Ritter (1995). Where Myers & Majluf (1984) explained it through
their asymmetric information model and Loughran & Ritter (1995) explained it
through their ‘window of opportunity’ model. In both instances, management is of the
knowledge that the company’s share price is overvalued.
6.1.2. Hypothesis testing of CAARs for full sample
The first hypothesis was tested, where:
H1,0:
H1,A:
© 2014 University of Pretoria. All rights reserved. The copyright in this work vests in the University of Pretoria.

60
Based on the results found in table 11 and the discussion from 6.1.1., the null
hypothesis is rejected for six out of nine selected event windows.
6.1.3. Cumulative average abnormal returns of sub-sa mples
The cumulative average abnormal returns were also calculated at a category level.
Table 12 shows the sub-sample CAARs for the debt-repayment sample, investment
sample and general sample. Table 12 also shows the CAARs calculated and tested
for each different weighting namely the equal weighting, log issue weighting and
relative issue weighting. Hypothesis tests were conducted using bootstrapped
distributions at the five percent significance level.
Figures two to four illustrate the CAARs for the three samples, according to different
weightings that were used in the study. The equal-weighted CAARs in figure two are
positive for a few days after the announcement, before quickly falling for all three
sub-samples. This lagged response to the rights issue could be a follow-through of
the upward momentum that is seen in the days prior to the rights issue. The delayed
response may also suggest that there is some inefficiency in the JSE equity market.
In figure two, the ‘general’ sample clearly displays the largest negative reaction to
the rights issue announcement, falling as low as -26.48% around day 33, as seen in
Table 10. The study acknowledges that the small sample size of the ‘general’ group
may undermine the reliability of the results. This sampling bias is mitigated during
hypothesis testing through the use of simulated distributions explained in 4.6.3.
There is no discernible difference between the categories’ performance after day 60.
Figure three shows the log issue-weighted CAARs for the three samples. In this
instance, the ‘debt-repayment’ sample exhibits the least negative reaction to the
rights issue announcement for the full event window, with a mean CAAR of -0.80%
(see table 10) across the entire window. The plot in figure three shows that the
‘general’ sample is again the poorest performer during the full event window, with a
mean CAAR of -13.10% for the full event window.
Figure four is a plot of the relative issue-weighted CAARs for the three samples for
the full event window. The study points to the increased noise in the CAARs for all
© 2014 University of Pretoria. All rights reserved. The copyright in this work vests in the University of Pretoria.

61
three samples as seen in the larger standard deviations, when compared to the
standard deviations of the differently weighted CAARs previously discussed in
paragraph 6.1.4. It is noted that the remarkably lower mean and median CAARs (see
table 10) for the debt repayment and investment sample.
Due to these factors, the ‘general’ sample shows the least negative reaction to the
rights issue announcement for the full event window.
Debt Repayment Sample
The CAARs for the debt repayment sample for all three weightings are shown in
Table 12. For the log issue-weighted CAARs, the selected event windows ended at
days 33 and 121, with daily CAARs of -5.87% and -7.01% respectively – none of
these CAARs were found to be significant at the 5% error level.
The equal weighted CAARs for selected event windows ending at day 28, day 73
and day 112 are shown in table 12. The equal weighted daily CAARs for the event
windows mentioned above are -10.17%, -12.11% and -13.52% respectively. The
daily CAAR for the 28 day event window was found to be significant at the 5% error
level. The daily CAARs for the 73 day and 112 day windows were not statistically
significant at the 5% error level.
The relative issue-weighted CAARs for event windows ending at day 26, day 73 and
day 108 were tested at the 5% error level and are shown in table 12. The 26 day
window had a daily CAAR of -17.30% which was found to be significant at the 5%
level. The 73 day and 108 day windows were tested, and neither was found to be
statistically significant at the 5% error level.
The findings with regard to the debt repayment sample did not show a statistically
significant share price reaction to the rights issue announcement. However, the
plots found in figures two to four show an observably poor share price performance
subsequent to a rights issue for the full event window. These findings are in contrast
to those of Autore, Bray, & Petersen (2008) who found that share price
underperformance is stronger when debt repayment is the intended purpose for the
rights issue. Further to this, the plot in figure three suggests that companies that use
the rights issues to repay debt, have less negative post-issue performance when
compared to companies that issue equity for investment or general purposes.
© 2014 University of Pretoria. All rights reserved. The copyright in this work vests in the University of Pretoria.

62
The poor performance observed for the debt-repaying companies after the rights
issues can be explained by the signaling hypothesis from Myers (1984), where
investors consider an equity issue as a signal from company insiders that the share
is overvalued. Eckbo, Masulis, & Norli (2000) also showed that companies that
reduce their leverage will have the market adjust its share returns in line with the
lower risk exposure to interest rates and inflation. This qualifies the observed
underperformance of the CAARs of the debt-repayment sample after the equity
issue.
6.1.4. Hypothesis testing of CAARs for debt-repaymen t sample
The second hypothesis to be tested is as follows:
H2,0:
H2,A :
Based on the results in table 12, figures two to four, and the discussion in paragraph
6.1.3., the research rejected the null hypothesis for two out of eight selected event
windows at the 5% level
Investment sample
The daily log issue-weighted CAARs were tested for the 83 and 108 day event
windows and are found in table 12. The 83 day event window had a CAAR of -
13.56% which was found to be statistically significant at the 5% level. The 108 day
event window had a CAAR of -13.09% which was found to be statistically significant
at the 5% level.
The equal weighted CAARs with respect to the investment sample, for three selected
event windows were tested at the 5% significance level. The CAAR of -16.89% for
the 68 day event window was found to be significant. The other selected event
windows ended at 93 days and 107 days, and had CAARs of -13.13% and -11.05%
© 2014 University of Pretoria. All rights reserved. The copyright in this work vests in the University of Pretoria.

63
respectively. The 93 day and 107 day event windows were not found to be significant
at the 5% level.
The third type of weighting with regard to the investment sample CAARs was the
relative issue-weighting.
Hypothesis testing was conducted for the 67 day, 93 day and 126 day event
windows. None of the relative issue-weighted CAARs were found to be significant at
the 5% signficance level.
The findings displayed in table 12 and figures two to four show that there is a
negative share price response in the CAARs for the investment group. This negative
response is evident in the first eight to ten days after the rights issue, and continues
throughout the event window. The results from this study are compared to those of
of Autore, Bray, & Petersen (2008). Autore, Bray, & Petersen( 2008) found that the
investment group delivered superior share price performance to the general group
after an equity issue – this study exhibits the same result or premium earned by the
investment group over the general group . The difference is that unlike Autore, Bray,
& Petersen (2008), this study did not find any evidence that the investment group
showed superior post-issue performance to the debt-repayment group.
The findings from this study and Autore, Bray, & Petersen (2008) are in line with
Jensen’s (1986) agency theory, which states that management act as bad agents
and use excess cash to invest in value-eroding projects. In this context, the excess
cash would come from the proceeds raised in the rights issue, and would result in
management investing in negative net present value projects. There also remains a
case for the the poor post-issue performance to also be explained by the information
model of Myers & Majluf (1984). Management are most likely to have inside
information about the business that is not known to the market, and thus the market
‘corrects’ the share price after a rights issue based on the expectation of poor
performance.
© 2014 University of Pretoria. All rights reserved. The copyright in this work vests in the University of Pretoria.
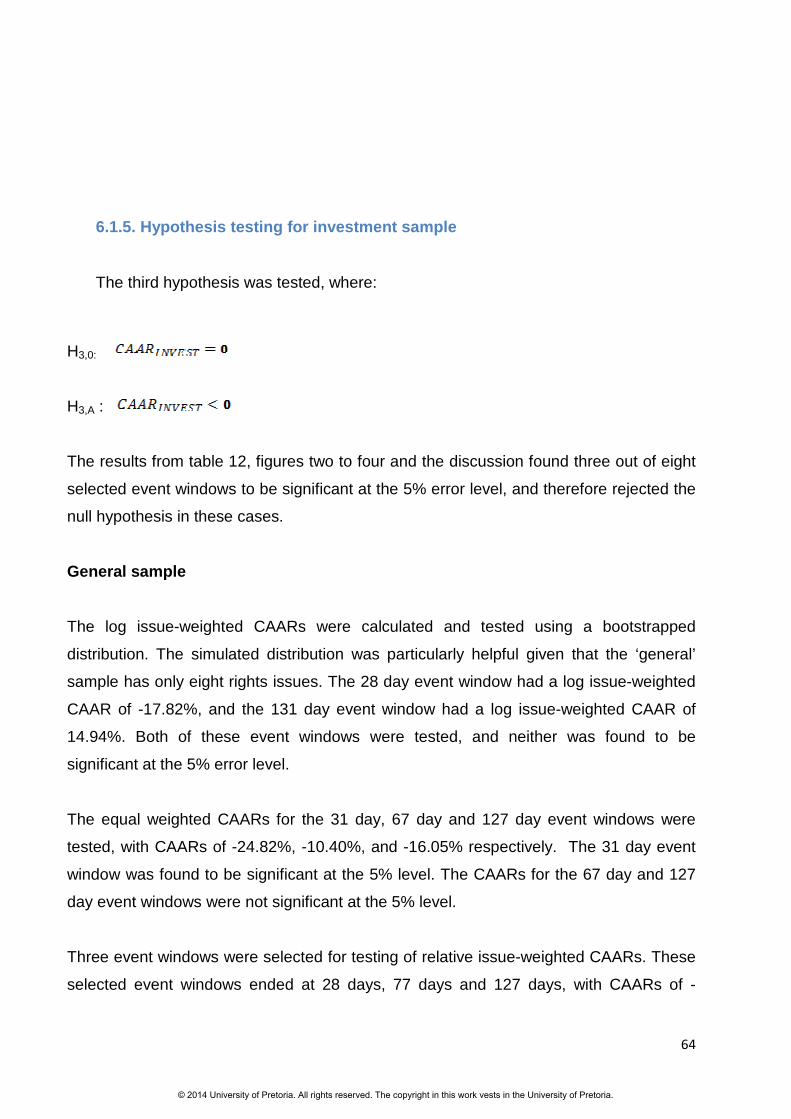
64
6.1.5. Hypothesis testing for investment sample
The third hypothesis was tested, where:
H3,0:
H3,A :
The results from table 12, figures two to four and the discussion found three out of eight
selected event windows to be significant at the 5% error level, and therefore rejected the
null hypothesis in these cases.
General sample
The log issue-weighted CAARs were calculated and tested using a bootstrapped
distribution. The simulated distribution was particularly helpful given that the ‘general’
sample has only eight rights issues. The 28 day event window had a log issue-weighted
CAAR of -17.82%, and the 131 day event window had a log issue-weighted CAAR of
14.94%. Both of these event windows were tested, and neither was found to be
significant at the 5% error level.
The equal weighted CAARs for the 31 day, 67 day and 127 day event windows were
tested, with CAARs of -24.82%, -10.40%, and -16.05% respectively. The 31 day event
window was found to be significant at the 5% level. The CAARs for the 67 day and 127
day event windows were not significant at the 5% level.
Three event windows were selected for testing of relative issue-weighted CAARs. These
selected event windows ended at 28 days, 77 days and 127 days, with CAARs of -
© 2014 University of Pretoria. All rights reserved. The copyright in this work vests in the University of Pretoria.

65
39.16%, -23.50% and -13.91% respectively. None of the three selected event windows
for the relative issue-weighted CAARs were found to be significant at the 5% error level.
The plots in figures two to four give a perceptible view of the poor post-issue
performance for the general sample.
The paper has indicated concerns with the small sample size of the general sample.
However, all three weightings of CAARs have resulted in the general sample having
greater underperformance - when compared to the other categories. This is in line with
the findings of Autore, Bray, & Petersen (2008) who found that companies that issue
equity without being specific about what motivated the decision to raise capital through
an equity issue, experienced poor performance after the equity issue.
While other purposes for rights issue include having to pay back debt, or looking to
invest in projects, some rights issues do not seem to have a clearly defined purpose from
management. This could be explained in part by Jensen’s (1986) theory which said that
management sitting with the excess capital may end up investing in negative NPV
projects. The lack of purpose for the rights issue could mean that management was
purely motivated by opportunity to issue equity at a relatively high price; which brings
back the perennial information model of Myers & Majluf (1984).
6.1.6. Hypothesis testing for general sample
Hypothesis four is shown below:
H4,0:
H4,A :
Based on the results in Ttble 12, figures two to four, and the discussion the paragraph
6.1.5. above, only in one out of eight hypotheses did the study reject the null hypothesis
at the 5% error level.
© 2014 University of Pretoria. All rights reserved. The copyright in this work vests in the University of Pretoria.

66
6.2. Operating financial performance
The study sets out the analysis operating financial performance in tables 13 and 14.
Table 13 shows results of the one-sample t-tests that were performed on the industry-
adjusted cash flow return on assets (IACFRA). These were from two years before the
rights issue to two years after the rights issue.
The IACFRA tests the abnormal operating performance for rights issuing companies, and
follows a similar methodology to Smit & Ward (2007) and Healy & Palepu (1992). Both
studies considered the operating cash flow return on assets, however, Healy & Palepu
(1992) looked at the market value of assets, while this study and Smit & Ward (2007)
looked at the book value of assets in calculating the IACFRA.
In table 13, the mean and median IACFRA were tested for each year using the student’s
t-test. The study included the median IACFRA to mitigate the effects of outliers on the
sample and subsequent statistical inferences. The standard deviation shows that the
variation within each sample decreases from -13.76% two years before the rights issue
to 9.93% two years after the rights issue.
The median IACFRA deteriorates from -0.54% two years before the rights issue, to -
2.73% the first year after the rights issue. Thereafter, the median IACFRA improves to
1.73% in the second year after the rights issue. Similarly, the mean IACFRA deteriorates
from 0.32% two years before the rights issue to -2.80% one year after the rights issue.
The mean IACFRA then improves to 2.41% in the second year after the rights issue.
The t-stats were calculated for each year under consideration. The median t-stat for year
(-2) of -0.22 was not significant at the 5% error level. Similarly for year (-1), the median t-
stat of -0.42 was not found to be significant at the 5% error level. The median t-stats for
the first year and second year after the rights issue of -2.73% and 1.73% respectively,
were not significant at the 5% error level.
The mean t-stats for each year under consideration are shown in table 13. All of the
mean t-stats for each year, starting from two years before to two years after the rights
issue, were not significant at the 5% level. Thus, it appears that there is negative
© 2014 University of Pretoria. All rights reserved. The copyright in this work vests in the University of Pretoria.

67
operating financial performance soon after the rights issue. This will be further analysed
later in this paragraph.
The paired test for IACFRA looked at the difference of the mean and median IACFRAs
across periods. This was to see if the IACFRAs were statistically different from each
before and after the rights issue.
It should be noted that the cross-sectional standard deviation is larger than the single
year variance. The large variation across sample periods highlights the need to consider
both mean and median IACFRAs.
The study points to the subsequent drop in the mean IACFRA from the second year
before, to the first year after, the rights issue to -3.10% in Table 15. The mean t-stat for
the paired period [-2,1] of 0.88 was not significant at the 5% error level. Similarly, the
median IACFRA for the same paired period [-2, 1] at -2.14% was not significant at the
5% level.However, the paired period [-2, 2], saw a positive mean IACFRA of 2%; the
related t-stat was not significant at the 5% error level. By comparison, the median
IACFRA of 2.48% for the paired period [-2, 2] was also positive and not significant at the
5% error level.
Therefore, the results suggest that operating performance is negative for the initial
financial period after the rights issue, and then starts to improve thereafter. With
reference to table 14, the mean IACFRA for the first year before and first year after the
rights issue was -6.67%, this is compared to a median IACFRA of -1.95%. The mean
IACFRA was significant at the 5% error level, while the median IACFRA was not
significant. The study considers the significant result for the paired period [-1,1] to
potentially be a false positive given the large difference between the mean and median
IACFRA for the same period.
The final paired period under consideration was from the first year before the rights issue
to the second year after the rights issue. The mean IACFRA for the [-1,2] paired period
of -2.08% was not significant at the 5% error level. Interestingly, the median IACFRA for
the same period was positive at 2.41%, and not significant at the 5% error level.
© 2014 University of Pretoria. All rights reserved. The copyright in this work vests in the University of Pretoria.
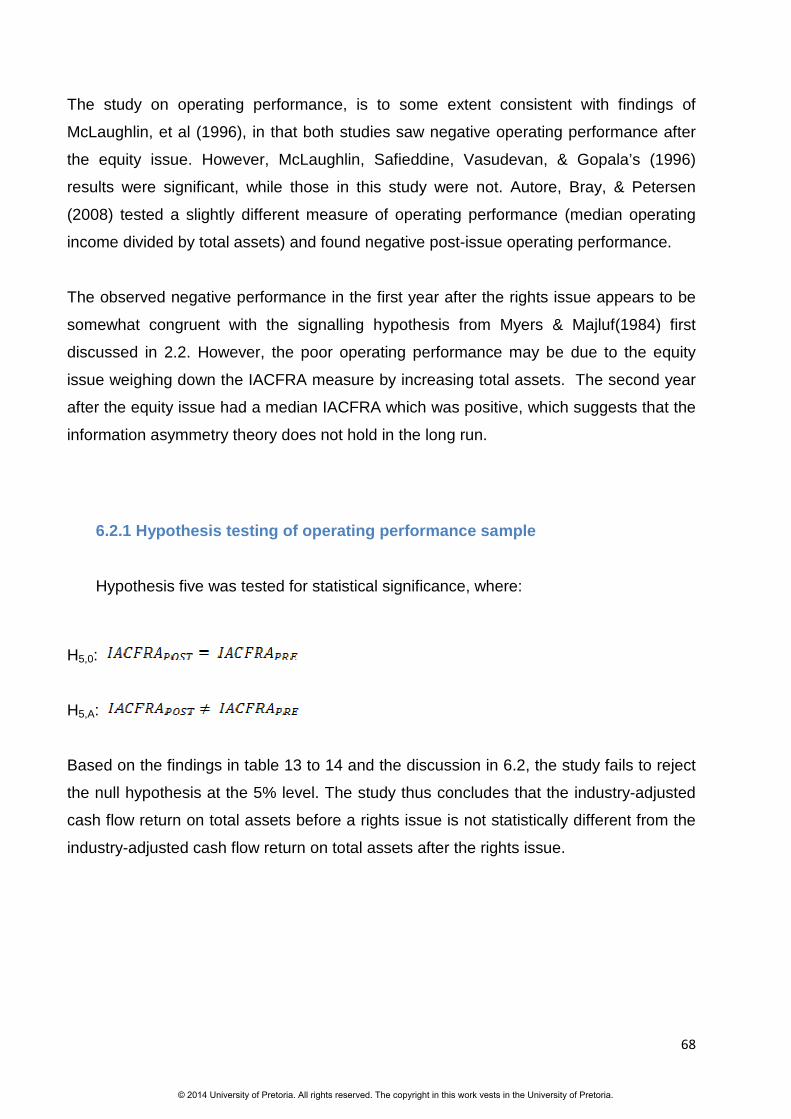
68
The study on operating performance, is to some extent consistent with findings of
McLaughlin, et al (1996), in that both studies saw negative operating performance after
the equity issue. However, McLaughlin, Safieddine, Vasudevan, & Gopala’s (1996)
results were significant, while those in this study were not. Autore, Bray, & Petersen
(2008) tested a slightly different measure of operating performance (median operating
income divided by total assets) and found negative post-issue operating performance.
The observed negative performance in the first year after the rights issue appears to be
somewhat congruent with the signalling hypothesis from Myers & Majluf(1984) first
discussed in 2.2. However, the poor operating performance may be due to the equity
issue weighing down the IACFRA measure by increasing total assets. The second year
after the equity issue had a median IACFRA which was positive, which suggests that the
information asymmetry theory does not hold in the long run.
6.2.1 Hypothesis testing of operating performance sa mple
Hypothesis five was tested for statistical significance, where:
H5,0:
H5,A:
Based on the findings in table 13 to 14 and the discussion in 6.2, the study fails to reject
the null hypothesis at the 5% level. The study thus concludes that the industry-adjusted
cash flow return on total assets before a rights issue is not statistically different from the
industry-adjusted cash flow return on total assets after the rights issue.
© 2014 University of Pretoria. All rights reserved. The copyright in this work vests in the University of Pretoria.

69
7. Conclusion
The study set out by outlining research objectives in chapter two. The first objective
was to assess the impact of a rights issue on share price performance in the long
run. This study was conducted in the context of the South African listed equity
market, known as the Johannesburg Stock Exchange. With regard to the first
objective, the study found conclusive evidence of a negative share price reaction to a
rights issue announcement. The study acknowledges the inherent bias that comes
with long run analysis; however, it found poor share price performance within the first
trading year of the rights issue announcement. Other local studies such as
Cotterell (2011) and Bhana (1998) had looked at the immediate post-issue
performance for JSE listed companies. This study adds to the literature by looking at
a longer horizon. The long run analysis has important implications for investors and
business. This implication is justified by the long-term nature of some investment and
business decisions; therefore this study can assist long run decision making
concerning rights issues and share price performance.
The study found a negative share price reaction to a rights issue announcement.
These findings show support for the model by Myers & Majluf (1984). Myers &
Majluf’s (1984) information model which is based on the signaling hypothesis, found
that corporate actions such as the issuance of equity convey information about the
company to the market. In this case, the rights issue was the corporate action which
appeared to signal that the share was overvalued to the market.
The findings of this paper with regard to the first research objective are consistent
with those of Spiess & Grave (1995), Loughran & Ritter (1995) and more recently
Mathew (2002), Bayless & Jay (2008) and Autore, Bray, & Petersen (2008).
© 2014 University of Pretoria. All rights reserved. The copyright in this work vests in the University of Pretoria.

70
The second objective was to look at the rights issue and share price performance at
a category level, specifically whether specifying the purpose of the rights issue in a
SENS announcement had any significant effect on subsequent share price
performance. This study found that all three categories tested in this study exhibited
poor share price performance after the rights issue. The general category showed
more underperformance than the investment and debt-repayment groups.
In contrast to the findings of Autore, Bray, & Petersen (2008), this study found
significantly negative CAARs for selected event windows for companies which
announced that the rights issue proceeds would be used to invest in operations. This
underperformance could mean that company management invested in projects that
didn’t yield the expected benefit to the company. These findings are consistent with
the free cash flow agency theory of Jensen (1986), who posited that management
act as bad agents on behalf of shareholders by investing in value-eroding projects.
The study recommendeds that further research is conducted on a larger investment
sample.
The study found evidence that companies which state that the rights issue was
intended for recapitalization purposes, exhibited share price underperformance after
the rights issue. This was in line with a similar study undertaken by Autore, Bray, &
Petersen (2008). The last category included those that were vague about what the
purpose of the rights issue was in their rights issue announcement. This category
was the smallest by sample size, and had the worst share price performance of all
groups. This brings into question the idea of focus, and whether a lack of focus leads
company management to make sub-optimal decisions, particularly when
considering a corporate action like an equity issue. This part of the study links with
Jensen (1986); are managers without focus wasting capital raised in an equity issue
on sub-optimal projects? An alternative conjecture is that managers see a relatively
high share price as the window of opportunity, as mentioned by Loughran & Ritter
(1995). In such a case, management would not have an acceptable motivation to
include in their rights issue announcement; and their announcement would thus
appear vague.
The last objective for the study was to analyze prior and subsequent operating
performance around a rights issue. The study did not find any statistically significant
© 2014 University of Pretoria. All rights reserved. The copyright in this work vests in the University of Pretoria.

71
evidence of poor operating performance after a rights issue. However, there was a
noticeable decrease in the industry adjusted cash flow return on total assets in the
first year after the rights issue. This suggests that the lower relative cash flow could
be due to the increased asset base from the equity issue, or due to invesment
decisions that have yet to yield economic benefits for the company or a combination
of both.
The industry adjusted cash flow return on assets improved in the second year after
the rights issue, possibly due to increased returns from projects which received
capital from the rights issue. However, there is no clear indication of the direction of
the subsequent operating financial performance. While inconclusive, the cash flow
returns suggest that the information asymmetry model Myers & Majluf ( 1984) only
holds for the first year after the rights issue.
The study assessed both share price performance and operating performance after
a rights issue. Both instances showed an immediate drop in performance after the
rights issue, which gives support to the idea that management , as insiders, have
knowledge about the negative future performance of the business. As a result,
management see a rights issue as an opportunity to maximise gain from a relatively
high share price.
Seasoned investors already seem to have developed an understanding of the
expected post-event share price performance. This expectation of poor performance
would explain the significant drop in the price the moment the rights issue is
announced. However for long term contrarian investors, the rights issue
announcement could be used as an opportunity to purchase shares of companies
that they have long coveted.
This study has found that management needs to be circumspect when deciding on
whether to issue equity. The findings of this study also may assist in decision making
around capital structure in deciding on whether to finance through debt or equity.
Often the decisions around capital structure tend to be based largely on cost of
capital, but this study also brings in the timing dimension which would also need to
be considered when deciding on whether to fund through debt or equity.
© 2014 University of Pretoria. All rights reserved. The copyright in this work vests in the University of Pretoria.

72
It is crucial that management is aware what message is being conveyed by their
rights issue announcement, and more specifically how the contents of the
announcement itself may affect the share price in the long run. Those managers who
genuinely need capital, and can no longer look at debt financing should anticipate
negative reaction to the equity issuance decision.
Suggestions for future research
The findings on share price performance were useful in seeing how rights issues
affect performance at a category level. To assess this, the study used various
weightings to calculate the cumulative average abnormal returns which gave visibly
different results. This visible difference could be investigated as part of a wider study
on buy-and-hold returns and cumulative abnormal returns. It is also recommended
by that the benchmarking problem which is mentioned by Barber & Lyon (1996) is
studied further. Many studies have looked at share price price reactions to rights
issues, but not many have considered the ‘bad model’ issues highlighted by Barber
& Lyon (1996) and Kothari & Warner( 1997) in different contexts.
By comparison, the samples which have been used in the international studies of
rights issues have far larger samples which give depth and breadth to any statistical
results gleaned from them. It is recommended that this is applied to local studies.
When analysing the long run operating performance before and after a rights issue, it
is recommended that other metrics around leverage, and return on capital, are
considered in addition to the return on assets measure used in this study. A study of
that nature would assist in developing further insight into other factors that affect
operating performance before and after the rights issue.
The study also recommends looking at a longer subsequent period when analyzing
operating performance. Operating performance is specifically related to assets, with
fixed assets being predominantly long term in terms of production, thus to lengthen
the period of analysis would be justified.
© 2014 University of Pretoria. All rights reserved. The copyright in this work vests in the University of Pretoria.

73
Reference List
Andrikopoulos, P. (2009). Seasoned Equity Offerings, operating performance and overconfidence:
Evidence from the UK. Journal of Economics and Business 61, 189-215.
Asquith, P., Bruner, R., & Mullins, D. (1983). The gains to bidding firms from merger. Journal of
Financial Economics (11), 121-129.
Autore, D., Bray, D., & Petersen, D. (2008). Intended use of proceeds and the long run performance
of seasoned equity issuers. Journal of Corporate Finance 15, 358-367.
Bae, G., Jeong, J., & Tang, A. (2002). Stock Returns and Operating Performance of securities issuers.
Journal of Financial Research 25(3), 337-352.
Barber, B., & Lyon, J. (1996). Detecting abnormal operating performance: The empirical power and
specification of test statistics. Journal of Financial Economics (41), 359-399.
Barber, B., & Lyon, J. (1997). Detecting long-run abnormal stock returns: The empirical power and
specification of test statistics. Journal of Financial Economics (43), 341-372.
Bayless, M., & Jay, N. (2008). A multiperiod evaluation of returns following seasoned equity
offerings. Journal of economics and Business 60(2008), 291-311.
Bhana, N. (1998). Share price reaction to announcements of equity financing by companies listed on
the Johannesburg stock exhange. Investments Analysts Journal No 48, 33-42.
Bodi, Z., Kane, A., & Marcus, A. (2005). Investments. Boston: Mcgraw Hill.
Brown, S., & Warner, J. (1985). Using Daily Stock Returns: The Case of Event Studies. Journal of
Financial Economics (14), 3-31.
Cotterell, P. (2011). The impact of rights issue announcements on share price performance in South
Africa. Johannesburg: University of Pretoria.
Dbouk, W., & Ismail, A. (2010). Corporate Governance and long run performance of seasoned equity
issuers. Journal of Multinational Financial Management Vol. 20, 159-177.
DeAngelo, H., DeAngelo, L., & Stulz, R. (2010). Seasoned Equity Offerings, market timing and the
corporate lifecycle. Journal of Financial Economics 95, 275-295.
Eckbo, E., Masulis, R., & Norli, O. (2000). Seasoned public offerings: a resolution of the 'new issues
puzzle'. Journal of Financial Economics 56, 251-291.
Exchange, T. J. (2013). Rights Issues. Johannesburg, Gauteng, South Africa.
© 2014 University of Pretoria. All rights reserved. The copyright in this work vests in the University of Pretoria.

74
Fama, E., & French, K. (1993). Common risk factors in the returns of stocks. Journal of Financial
Economics 33, 3-56.
Fama, E., & French, K. (1996). Multifactor Explanations of Asset Pricing Anomalies. The Journal of
Finance Vol. 51 (1), 55-84.
Fama, E., Fisher, L., Jensen, M., & Roll, R. (1969). The adjustment of stock prices to new information.
International Economic Review 10 (1), 1-21.
Firer, C., Ross, S., & Westerfield, R. (2012). Fundamentals of Corporate Finance. Berkshire: McGraw-
Hill.
Frielinghaus, A., Mostert, B., & Firer, C. (2005). Capital Structure and the firm's lifestage. South
African Journal of Business Management 36(4), 9-17.
Gilbertson, B., & Goldberg, M. (1981). The market model and the Johannesburg Stock Exchange.
Investment Analyts Journal 17, 40-42.
Healy, P., & Palepu, K. a. (1992). Does corporate improve after mergers? Journal of Financial
Economics (31), 135-175.
Jegadeesh, N. (2000). Long-Term Performance of Seasoned Equity Offerings: Benchmark Errors and
Biases in Expectations. Journal of Financial Management (29) No. 3, 5-30.
Jensen, M. (1986). Agency Costs of Free Cash Flow, Corporate Finance and Takeovers. The American
Economic Review 76(2), 323-329.
JSE. (2013, October 1). Johannesburg Stock Exchange Equity Market. Retrieved from www.jse.co.za:
https://www.jse.co.za/products/Equity-Market-Products/Equity-Market-Product-
Detail/Linked_Units.aspx
Kabir, R., & Roosenboom, P. (2003). Can the stock market anticipate future operating performance?
Evidence from equity rights issues. Journal of Corporate Finance (9) , 93-113.
Korajczyk, R., Lucas, D., & McDonald, R. (1991). The effect of information releases on the pricing and
timing of equity issues. Review of Financial Studies (4), 685-708.
Kothari, S., & Warner, J. (1997). Measuring long-horizon security price performance. Journal of
Financial Economics 43, 301-339.
Kothari, S., & Warner, J. (2007). Handbook of Corporate Finance Vol. 1. Boston: Elserivier.
Lee, H. W. (1997). Post Offering Earnings Performance of Firms that issue seasoned equity: The role
of Growth Opportunities. The Quarterly Review of Economics and Finance 37(1), 97-114.
Lin, J.-C., & Wu, Y. (2013). SEO Timing and liquidity risk. Journal of Corporate Finance 19(2013), 95-
118.
Loughran, T., & Ritter, J. (1995). The New Issues Puzzle. Journal of Finance (50) No. 1, 23-51.
© 2014 University of Pretoria. All rights reserved. The copyright in this work vests in the University of Pretoria.

75
Loughran, T., & Ritter, J. (1997). The operating performance of firms conducting seasoned equity
offerings. Journal of Finance 52(5), 1823-1850.
Mackinlay, C. (1997). Event Studies in Economics and Finance. Journal of Economic Literature XXXV,
13039.
Mathew, P. (2002). Long-horizon seasoned equity offerings performance in Pacific Rim markets.
Journal of Financial Economics 11, 317-333.
McLaughlin, R., Safieddine, A., Vasudevan, & Gopala. (1996). The Operating Performance of
Seasoned Equity Issuers: Free Cash Flow and Post Issue Performance. Journal of Financial
Management 25(4), 41-53.
Modligiani, F., & Miller, F. (1958). The cost of capital, corporation finance and the theory of
investment. The American Economic Review 48(3), 261-281.
Mordant, N., & Muller, C. (2003). Profitability of directors' share dealings on the JSE. Investment
Analysts Journal (57), 17-21.
Muller, C., & Ward, M. (n.d.). Style-based effects on the Johannesburg Stock Exchange: a graphical
time-series approach.
Mushidzi, T., & Ward, M. (2004). Abnormal returns for cash vs share funded acquisitions. Investment
Analysts Journal No. 60, 17-31.
Myers, S. (1984). The capital structure puzzle. Journal of Finance 39(3), 575-583.
Myers, S., & Majluf, N. (1984). Corporate Financing and Investment Decisions When firms have
information that investors do not have. Journal of Financial Economics 13(2), 187-221.
Pascoe, G., Ward, M., & Mackenzie, D. (2005). The influence of economic factors on rights issue
announcements. Investment Analysts Journal No 61, 17-28.
Powell, R., & Stark, A. (2005). Does operating performance increase post-takeover for UK takeovers?
A comparison of performance measures and benchmarks. Journal of Corporate Finance 11,
293-317.
Rochowicz, J. (2011). Bootstrapping Analysis, Inferential Statistics and EXCEL. Spreadsheets in
Education Vol. (4) No. 3, 1-22.
Smit, C. (2005). The Impact of large acquisitions on the share price performance and operating
performance of companies on the JSE. Johannesburg: University of Pretoria: GIBS.
Smit, C., & Ward, M. (2007). The impact of large acquisitions on the share price and operating
financial performance of acquiring companies on the JSE. Investment Analysts Journal, 5-14.
Spiess, K., & Grave, J. (1995). Underperformance in long-run stock returns following. Journal of
Financial Economics (38), 243-267.
© 2014 University of Pretoria. All rights reserved. The copyright in this work vests in the University of Pretoria.

76
Stiglitz, J. (1974). On the irrelevance of corporate financial policy. The American Economic Review
64(6), 851-867.
Walker, M., & Yost, K. (2008). Seasoned Equity Offerings: What firms say, do, and how the market
reacts. Journal of Corporate Finance 14, 376-386.
Ward, M., & Muller, C. (2010). The long term share price reaction to Black Economic Empowerment
announcements on the JSE. Investment Analysts Journal 71, 27-36.
© 2014 University of Pretoria. All rights reserved. The copyright in this work vests in the University of Pretoria.


