The location determinants of foreign direct …...Group3-9 Kinoshita - 2 - 1. Introduction Foreign...
28
Group3-9 Kinoshita - 1 - The location determinants of foreign direct investment in transition economies Yuko Kinoshita* Department of Economics, Hunter College, City University of New York, University of Michigan William Davidson Institute and CEPR and Nauro F.Campos Department of Economics, University of Newcastle, University of Michigan William Davidson Institute and CEPR July 2002 Abstract The objective of this paper is to investigate the determinants of foreign direct investment inflows in the transition economies between 1990 and 1998. The paper brings two innovations. One is the attention to the effect of agglomeration, an issue that has been highlighted recently in the works of Economic Geography. The second innovation is that we look at all transition countries instead of focusing on, for instance, EU candidates. We find that the main determinants of FDI in transition are agglomeration, the degree of external liberalization, and the quality of the bureaucracy. We also find an important difference between CEE and CIS countries. The agglomeration effect is greater for CIS countries than in non-CIS countries. For non-CIS countries, the more liberalized the trade regime is, the more FDI they attract. For CIS countries, availability of skilled labor and the rule of law are the main factors influencing FDI flows. *Correspondence: [email protected] and [email protected] Many thanks to Aurelijus Dabušinskas, Anna Ratcheva, Evis Sinani and Dana Zlabkova for excellent research assistance. The authors acknowledge financial support from William Davidson Institute University of Michigan Business School. The usual disclaimer applies.
Transcript of The location determinants of foreign direct …...Group3-9 Kinoshita - 2 - 1. Introduction Foreign...
Group3-9 Kinoshita
- 1 -
The location determinants of foreign direct investment in
transition economies
Yuko Kinoshita* Department of Economics, Hunter College, City University of New York,
University of Michigan William Davidson Institute and CEPR
and
Nauro F.Campos Department of Economics, University of Newcastle, University of Michigan William Davidson Institute
and CEPR
July 2002
Abstract
The objective of this paper is to investigate the determinants of foreign direct investment inflows in the transition economies between 1990 and 1998. The paper brings two innovations. One is the attention to the effect of agglomeration, an issue that has been highlighted recently in the works of Economic Geography. The second innovation is that we look at all transition countries instead of focusing on, for instance, EU candidates. We find that the main determinants of FDI in transition are agglomeration, the degree of external liberalization, and the quality of the bureaucracy. We also find an important difference between CEE and CIS countries. The agglomeration effect is greater for CIS countries than in non-CIS countries. For non-CIS countries, the more liberalized the trade regime is, the more FDI they attract. For CIS countries, availability of skilled labor and the rule of law are the main factors influencing FDI flows. *Correspondence: [email protected] and [email protected] Many thanks to Aurelijus Dabušinskas, Anna Ratcheva, Evis Sinani and Dana Zlabkova for excellent research assistance. The authors acknowledge financial support from William Davidson Institute University of Michigan Business School. The usual disclaimer applies.

Group3-9 Kinoshita
- 2 -
1. Introduction
Foreign direct investment (FDI) is one of the most effective ways by which transition economies
become integrated to the global economy as FDI provides not only capital but also technology and
management know-how necessary for restructuring firms in the host economies. [Estrin, Hughes,
and Todd(1997); Lankes and Venables(1996)] There is also evidence that there is a positive
correlation between FDI inflows and economic growth of the host country via the spillover effects
of advanced technology. [Borenzstein, De Gregorio, and Lee (1998), Campos and Kinoshita(2002)]
An important question for policy makers is what the host government can do to attract FDI.
Trade theory argues that the location choices by investing firms are influenced by the classical
factors of comparative advantages specific to the country: market size, low wages, skilled labor
force, and infrastructure1. Others suggest that the investment location choices be explained by
agglomeration economies (e.g. positive externalities by co-locating to others).2
In this paper, we examine the location determinants of FDI into 25 transition economies3
by utilizing the panel data between 1990 and 1998. In the empirical analyses, we take into account
both host country characteristics and agglomeration economies as determinants of FDI location. In
order to incorporate the past stock of FDI as a proxy for agglomeration economies, we use the
standard GMM (Generalized Method of Moments) in explaining a spatial distribution of FDI
across these countries.
Many policy makers in the transition countries are aware that FDI plays a key role in
encouraging successful transition and many countries in the region offered various incentives to
attract FDI in the country.4 There has been a steady increase in the global share of inward FDI in
the region. Yet, the geographical distribution of FDI inflow among these countries remains uneven5
1 Kravis and Lipsey(1982) find market size and openness as important determinants for the location choices of US multinationals. Lucas(1993) finds FDI inflows into seven Southeast Asian countries are sensitive to relative wage differentials. 2 See Wheeler and Mody(1992) and Kinoshita and Mody(2001). 3 25 transition countries we analyze in the paper are Albania, Armenia, Azerbaijan, Belarus, Bulgaria, Croatia, Czech Republic, Estonia, Macedonia, Georgia, Hungary, Kazakhstan, Kyrgyzstan, Latvia, Lithuania, Moldova, Poland, Romania, Russia, Slovakia, Slovenia, Tajikistan, Turkmenistan, Ukraine, and Uzbekistan. 4 The evidence on the benefits of FDI promotion in the form of subsidies and tax holidays is rather mixed. See Hanson(2000) for further discussions. 5 A standard neoclassical model of economic growth predicts that capital always flows from rich to poor countries, which is contradicted by empirical evidence. One way to reconcile them is to introduce the role of human capital in an input of production as in Lucas(1990).
Group3-9 Kinoshita
- 3 -
with high concentration on three CEE countries (Hungary, Poland, and the Czech Republic) and
Russia.6 The other countries are struggling to encourage the first wave of large investment to arrive.
The concentration of FDI in these three countries may be explained by initial differences
prior to the start of economic transition in 1989. Three countries differ from the rest in were
different in some respects such as privatization strategies, inflation rate and international debts.
However, all three are relatively open to trade compared to other transition economies. This
favorable condition drew a large bulk of investment at the time of disintegration of the CMEA in
1991 and the cascading effect of FDI had followed via signaling of good local conditions to other
investors, which magnified the differences in FDI flows even further.
Once agglomeration economies set in, there will be a snow balling effect of FDI inflows in
successful countries. On the other hand, if classical factors of comparative advantages are more
dominant than agglomeration economies as locational determinants, it is still possible for the
remaining countries to reverse the trend.
In light of the above framework, a closer look at the role of agglomeration economies in
relation to classical factors of comparative advantages is all the more important in understanding
the drivers of FDI flows into these countries. Despite its importance, the empirical analyses on FDI
in transition economies7 is limited to a set of CEEC countries due to paucity of data. This study
attempts to fill this gap by utilizing data on a full sample of 25 transition economies.
This paper is organized as follows. In the next section, we review the theoretical
framework on the location determinants of FDI. In section 3, we discuss the variables to be tested
as the determinants of FDI in our empirical setting. In section 4 and 5, estimation methods and data
are described, respectively. Section 6 reports regression results and section 7 concludes the paper
and outlines the direction of our future research.
2. Factors driving FDI inflow
A firm becomes multinational mainly for three reasons. The so-called OLI paradigm proposed by
Dunning summarizes them as Ownership advantages, Location-specific advantages and
Internalization. Firms endowed with ownership advantages or intangible assets expand operations
6 The ranking of major recipients of FDI is based on cumulative FDI inflows between 1989-1999. [Source: Transition Report 2000, P. 74 (EBRD, 2000)] 7 Resmini(2000) and Bevan and Estrin(2000) study the determinants of FDI flows into 10 and 11 transition economies, respectively.

Group3-9 Kinoshita
- 4 -
abroad to internalize the benefits arising from ownership advantages and to match their strengths
with location-specific comparative advantages.
In this study, we focus on the location-specific advantages of the host country as
determinants of FDI in order to account for the geographical distribution of FDI inflows across
transition economies. Large market size, proximity to home market, low-cost labor and favorable
tax treatment in the host country are all considered as location advantages. At the same time, we
also address to transition specific issues such as changes in macroeconomic and institutional
environments.
Location-specific advantages are further classified by three types of motives of FDI. First,
market-seeking investment is undertaken to sustain existing markets or to exploit new markets. For
example, due to tariffs and other forms of barriers, the firm has to relocate production to the host
country where it had previously served by exporting. Because the reason for this type of investment
is to better serve a local market by local production, market size and market growth of the host
economy are the main factors that encourage market-seeking FDI. The impediments in serving the
market such as tariffs and transport costs also encourage this type of FDI.8 Japanese FDI in
automobiles in the US in late 80’s is an example of this type of FDI.
Second, when firms invest abroad to acquire resources not available in the home country,
the investment is called resource- or asset-seeking. Resources may be natural resources, raw
materials, or low-cost inputs such as labor. An example is investment made by the US and Japan in
export assembly in electronics in Asia in search for cheap labor.9 Unlike market-seeking FDI, this
type of FDI is intended to serve not only the local market but also the home and third country
markets. Availability of resources, cheap and skilled labor, and physical infrastructure are the main
attractors of resource-seeking FDI.
Third, the investment is rationalized or efficiency-seeking when the firm can gain from the
common governance of geographically dispersed activities in the presence of economies of scale
and scope. In this respect, prospective membership of the European Union conductive to the
establishment of regional corporate networks and the presence of high transport and
communication costs will encourage more of efficiency-seeking FDI.
There are also other factors that could influence the choice of investment locations in the
region. Favorable macroeconomic conditions of the host country such as stable prices, low national
8 This is also called ‘horizontal FDI’ as a firm duplicates the production process in foreign locations. See Markusen and Venables (1998), for example. 9 This is ‘vertical FDI’ as a firm relocates part of the vertical chain of production in a low-cost location.
Group3-9 Kinoshita
- 5 -
debt, and sustainable budget deficit are attractive to foreign investors. Social and political stability
also encourage FDI inflows. The progress of economic reform is particularly important in the
transition economy context. Other non-economic factors are the degree of corruption, legal
enforcement, and administrative efficiency, all of which facilitate business operating conditions.
The above framework of FDI gives guidance in identifying the set of economic, political
and institutional variables to be tested as determinants of investment locations, which is discussed
in detail in the next section.
There is much empirical evidence that FDI is spatially clustered. Agglomeration of FDI
may be explained by differences in classical comparative advantages such as factor endowment and
market size. Also, agglomeration is induced by the investors’ tendency to herd. Especially when
investors have insufficient information about the host country conditions, the existing stock of
foreign investment made by others may work as a signal of favorable investment environments.10
Alternatively, agglomeration economies emerge when there are positive externalities by co-
locating near others due to the presence of knowledge spillovers, specialized labor markets and
supplier network11 . In our analysis, we include the agglomeration effect as a determinant of
location choice together with the above economic and policy variables.
3. The variables to be tested
Classical sources of comparative advantages
Investors choose a location of investment according to the expected profitability associated
with each location. Profitability of investment is in turn affected by various country specific factors
as well as a type of investment motives. For example, market-seeking investors will be attracted to
a country with large local market and fast growing market. Resource-seeking investors will look
for a country with abundant natural resources. Efficiency-seeking investors will weigh more of
geographical proximity to the home country to minimize the transportation cost.
Thus, the location of FDI is closely tied with comparative advantages of the country, which
in turns affect the expected profitability of investment. The classical sources of comparative
10 See Kinoshita and Mody(2002). 11 The sources of externalities are identified differently in different models. Lucas(1988) argues that the accumulation of human capital generates positive spillovers while, in the Krugman's(1991) model, transportation costs and fixed costs in production lead to the demand linkages of firms, which increases the incentives to agglomerate. See Fujita, Krugman, and Venables (1999) for recent surveys of theories on agglomeration.

Group3-9 Kinoshita
- 6 -
advantages are input prices, market size, growth of the market, and relative abundance of natural
resources.
For market-seeking FDI, the determining factor is the size of the host country market. We
use GDP per capita as a measure of market size (YPC). 12
Availability of cheap labor is crucial for vertical FDI. To exploit low cost of labor input,
firms can justify relocating a part of production process in foreign countries. We use nominal wage
rate WAGEN as a proxy for labor cost. If vertical FDI is dominant, we expect a negative sign on
the coefficient. (e.g. the host country with lower labor cost attracts more FDI.)
Investing firms should be concerned not only with the cost of labor but also the quality of
labor. More educated labor force can learn and adopt new technology faster and the cost training
local workers is less for investing firms. Labor quality is introduced as general secondary school
enrollment rate (SS3).
Some CIS countries such as Azerbaijan and Kazakhstan and Russia have been receiving
FDI mostly in resource-based industries as they are rich in oil and natural gas. This is considered to
be an example of resource-seeking FDI. Natural resource rich countries may attract foreign
investment in those industries while they may divert investment from the manufacturing sector.13
The variable we use is NATRES that indicates if the host country is ‘poor’(=0), ‘moderate’(=1),
and ‘rich’(=2) in natural resources. 14
Proximity to the home country is empirically an important factor for explaining the volume
of trade flows between countries. The gravity model predicts that the closer the country is to the
home country, the more trade flows between the two countries will be observed. The analogous
argument may apply for FDI as FDI flows are closely related to trade flows. The sign of proximity
to the home country can go either way depending on the type of FDI undertaken. In the case of
market-seeking FDI, the further distance between the home and host country markets implies the
higher transportation cost. A fixed cost of transporting goods would encourage production in a
foreign market to exploit economies of scale. On the other hand, if goods produced abroad are
shipped back to the home or the third country markets, then the closer the production site is to the
home or the third country, the more efficient it is for MNCs.
12 Another variable to measure market potential is annual GDP growth. 13 Gyfason and Zoega(2001) find that abundant natural resources may crowd out physical capital and inhibit economic growth. See also Robinson, Torvik, and Verdier(2002). 14 This variable is constructed by De Melo et al. (1997).
Group3-9 Kinoshita
- 7 -
It is best if we could measure the distance between the home and host country for this
purpose. However, the data we use only contains the information on the host country of FDI flows
and we use a proxy for geographical distance to the major investor in the region, say, Germany.
The variable we use is DIST that measures the distance between Dusseldorf and the capital city of
each country in kilometers. Also, Germany has historically close ties with transition economies in
the region.15 In particular, efficiency-seeking FDI in light of EU enlargement to the region will be
encouraged if the country is closer to the major Western markets as proximity reduces
communication and coordination costs.
Availability of good infrastructure is a necessary and sufficient condition for foreign
investors to operate business locally regardless of the type of FDI. There are several candidates for
the infrastructure variable. One is a percentage of paved roads in the country and the other is a
number of main telephone lines. The first figure may be misleading. For instance, if there is one
main road in the country and it is paved, then it is reported as 100. This is indeed the case in many
countries in the sample. Thus, we use the number of main telephone lines (TELEPHON) as the
infrastructure variable.
Other things being equal, we expect that the more FDI be made in the countries with larger
market size, lower labor cost, better educated labor force, abundant natural resources, and better
infrastructure.
Policy variables
Investment decisions in emerging markets are also influenced by economic and political
risks. Successful implementation of economic reform by the host government is a good signal to
investors as stable macroeconomic performance implies less investment risk.
A record of price stability is a good indicator for sound macroeconomic management by
the host government. For example, a history of low inflation and manageable fiscal deficits signals
to investors how committed and credible the government is. For this, we use the average inflation
rate (INFAV). At the onset of transition, as the countries liberalized prices and underwent
structural changes in economic activities, all countries experienced the increase in the price level.
As the countries proceeded with structural reforms and stabilization policies, the price level also
subsided. The sustainability of moderate or low inflation tells investors how successful the host
15 We experimented with other distance variables such as distance from Brussels. But the results obtained are very similar.
Group3-9 Kinoshita
- 8 -
government is and thus the prospect of further growth. Thus, the lower the average inflation rate is
in the host country, the more foreign investment will be attracted to the country.
Another indicator of economic reform is external liberalization index. We use the variable
CLIE as a removal of trade controls and quotas, moderation of tariff rates and foreign exchange
rate restrictions.16 The more liberalized regime means the more successful reform and the more
foreign investment flows.17 In other cases, the more restrictive external regime may also induce
FDI. If FDI is done for tariff-jumping purpose, FDI flows may negatively correlated with the
external liberalization index.
Business operating conditions
Non-economic factors also influence returns to investment. The cost of investment consists
of not only the actual costs of inputs but also non-economic costs such as bribery and time lost in
dealing with local authorities.
To assess business operation conditions of the host country for investing firms, we use two
institutional variables, 'rule of laws' (RULELAW) and 'quality of bureaucracy' (BUROQUAL).18
The rule of law is a composite of three indicators: (i) sound political institutions and a strong court
system19 (ii) the fairness of the judicial system over property right, and (iii) substance of the law
itself20. The higher score in the rule of law implies the more sound and the better enforced the legal
system is in the host country.
The quality of the bureaucracy is based on two indicators: (i) the extent to which the
national bureaucracy enjoys autonomy from political pressure in a stable manner and whether or
not it has an effective mechanism for recruiting and training, and (ii) the ease of regulations
concerning licensing requirements and labor, environmental, consumer safety, and worker health.
If this score is high, then the investors perceive less cost in dealing with the local bureaucracy.
16 The index is constructed by De Melo et al. (1997). 17 See Caves(1996) and Sigh and Jun(1995), for example. 18 The variables are taken from Campos(2000). 19 It reflects the degree to which citizens are willing to accept the established institutions for making and implementing laws and adjudicating disputes. 20 This measures whether a post-communist constitution has been adopted, whether the constitution provides for property and human rights, whether the criminal code has been subject to reform, whether judges rule fairly and impartially, and whether they were appointed during the communist era, whether the courts are free of political control, whether the state provides public defenders, and whether ethnic minority rights are protected.
Group3-9 Kinoshita
- 9 -
Agglomeration economies
Agglomeration economies emerge when there are some positive externalities by co-
locating near other economic units due to the presence of knowledge spillovers, specialized labor
markets and supplier network21.
Various empirical studies present evidence on the presence and importance of such a self-
reinforcing effect of foreign investment. Interestingly, FDI is found to agglomerate more often than
mere financial investment partly because FDI is a long-term capital investment that is irreversible
in a short run. For instance, Head, Ries, and Swenson (1995) find industry-level agglomeration
benefits play an important role in the location choice of Japanese manufacturing plants in the US.
Wheeler and Mody (1992) confirms the importance of agglomeration for investors' location
decisions using qualitative data on US firms. More recently, Chen and Kwang(2000) in the study of
the determinants of FDI in Chinese regions also report the positive feedback effect of FDI. If there
is a positive feedback effect, once the initial flow of FDI sets in, it should perpetuate itself and
attract further FDI.
In this study, we use one-year lagged stock of FDI in the country as an independent
variable to capture these agglomeration effects. A positive and significant coefficient of lagged
stock of FDI means the presence of agglomeration economies. The inclusion of the lagged
dependent variable on the right hand side of the OLS regression introduces the endogeneity
problem. We address this issue in detail in the next section.
4. Estimation method
In order to test the presence of agglomeration effects, we have to relate current FDI to past
FDI along with other explanatory variables. We follow the model proposed by Cheng and Kwan
(2000) in which they formulate the role of past FDI values as the process of partial stock
adjustment. They assume that it takes time for FDI to adjust to equilibrium or desired level.
Our empirical specification is based on the assumption of the presence of such an
adjustment cost. We postulate a reduced form of the following equation:
21 The sources of externalities are identified differently in different models. Lucas(1988) argues that the accumulation of human capital generates positive spillovers while, in the Krugman's(1991) model, transportation costs and fixed costs in production lead to the demand linkages of firms, which increases the incentives to agglomerate. See Fujita, Krugman, and Venables (1999) for recent surveys of theories on agglomeration.

Group3-9 Kinoshita
- 10 -
itiit
itititit
uvvXYY
+=++= −
ηβα 1
where itY is the stock of FDI in country i in year t , itX is a vector of other explanatory
variables such as market size, labor cost, labor quality, resource abundance, distance from
Dusserdolf, infrastructure, policy variables, and business operating conditions, and itv is an error
term that includes the unobservable country-specific attribute, iη . If there is any agglomeration
effect or a positive feedback effect, then α is expected to be positive. When there is a country-
specific effect that is time invariant and unobservable as in the above specification, then the lagged
dependent variable will be correlated with the error term and OLS will lead to asymptotically
biased estimates. To get consistent estimates, we choose to use the generalized method of
moments (GMM) technique proposed by Arellano and Bond (1991). In this approach, we first
remove the country-specific effect by first-differencing equation (1) and estimate the following
equation by using instrumental variables:
itititit uXYY ∆+∆+∆=∆ − βα 1
where 1−−=∆ ititit YYY . In the above equation, 1−∆ itY is correlated with itu∆ . Valid
instruments in this case are lagged levels of dependent variables, sitY − where 2≥s and
.,...,4,3 Tt = As the length of panel progresses, the number of valid instruments increases. If itX
is predetermined [check as opposed to 'strictly exogenous'], then sitX −∆ (for all s) can be used as
additional instruments to increase the efficiency of the estimates. The validity of instruments is
checked by the Sargan test. The second-order correlation of the error term in the first-differenced
equation is checked by Arellano-Bond statistics for autocorrelation, which is distributed as N(0,1)
asymptotically.
For a small number of samples relative to a number of parameter estimates, however, we
are concerned with a possible bias introduced in the GMM estimation. Because the data set we
employ may suffer from such a bias, we also estimate in fixed-effects model and compare with
those obtained from GMM where appropriate.
Group3-9 Kinoshita
- 11 -
The dependent variable itY is per capita FDI stock in constant million USD in year t. We
constructed the series by using figures on FDI inflows taken from World Development Indicators
(WDI).
5. Data
There are typically two approaches to analyze the location determinants of FDI. The first
class of studies22 is to explain the location choice made by investing firms by investors' perceptions
or ratings of location-specific factors such as labor cost, corporate tax rates, and market size.
Namely, they regress the probability of locating in a certain location on various location-specific
factors. In other studies23, the dependent variable is the actual amount of FDI flow or stock. The
choice of two approaches depends on what type of data is available for the analysis. If firm-level
data is available, then the first approach will be employed. If investment data is available only at
the aggregate level, then the second approach is viable.
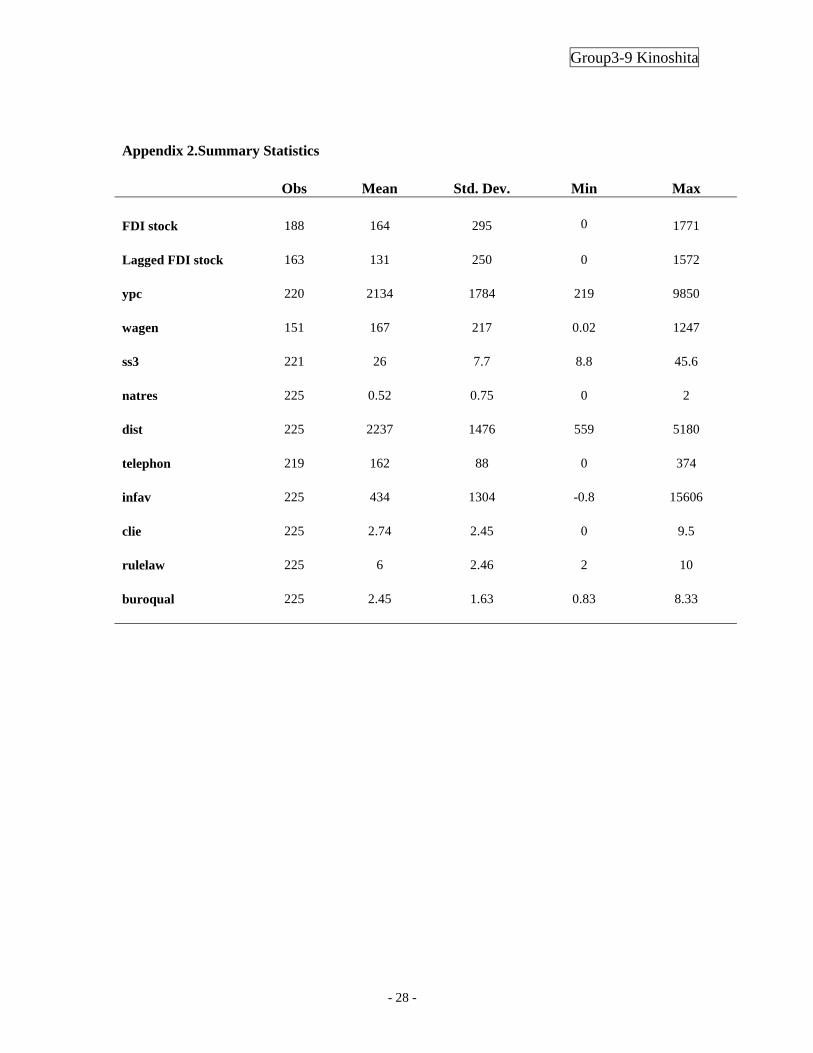
The data we use in this study covers the period of 1990-1998 for 25 transition countries.
The number of observations in the panel is 225 (=25x9). The definitions and summary statistics of
the variables are found in appendices.
The panel data is meaningful for our study for several reasons. First, the agglomeration or
self-reinforcing effects of FDI in the aggregate level can be addressed only if there is a time-series
of FDI. Due to positive externalities by localization of industry, FDI in the past will lead to more
FDI today. Second, during the time period covered in our data, transition economies had
undertaken and completed economic reforms. Cross-sectional data would not allow us to assess
changes of the reform variables.
Transition from planned to market economy started in early 1990s in many of these
countries but foreign investors were cautious in the beginning with a few exceptions of Hungary
and Poland. Due to difficulty of obtaining FDI data sufficiently long enough, the past studies on
FDI in transition economies are confined to the set of CEEC countries that are the major recipients
of substantial FDI in the region. A recent study by Resimini(2000) examines the location
determinants of FDI into 10 CEEC countries. Bevan and Estrin(2000) use the data on FDI flows
from 18 investing countries to 11 transition economies in explaining the determinants of FDI from
both home and host country viewpoints.
22 Coughlin, Terza, and Arromdee(1991), Wheeler and Mody(1992), and Head, Ries, and Swenson(1995). 23 Lucas(1993), Singh and Jun(1996), Cheng and Kwan(2000), Resmini(2000), and Bevan and Estrin(2001).
Group3-9 Kinoshita
- 12 -
In this study, we expand to the set of 25 transition economies. With additional countries in
the data, we are hoping to introduce more heterogeneity as well as to incorporate different motives
of investment in order to provide a more complete and detailed picture of the reasons for locating
FDI in transition countries. The countries excluded in the past studies are CIS countries. These are
the countries that receive FDI mainly in non-manufacturing such as service sectors and oil
industries. A picture for the complete set of countries may differ from the ones obtained for the
subset of the countries in the past studies because of differences in the areas in which they receive
FDI.
6. Results
Host country characteristics as FDI determinants
Table 1 reports OLS regressions with fixed effects.24 First, we look at the roles of host
country characteristics without agglomeration effects. How much of variations of FDI inflows
across transition economies are explained by classical factors? Column 1 in table 1 answers this
question. With no policy and risk variables and agglomeration economies being taken into account,
most classical sources of comparative advantage bear statistical significance. Column I indicates
that FDI into transition economies are mainly driven by the host country's market size, availability
of skilled workers (or the level of human capital), and sufficient infrastructure. All regressions
include time dummies.
Since natural resources and distance from Dusseldorf are both invariant over time in the
data set, after taking first-differences, they both drop out. In order to recover the estimates of these
variables, we transform them by multiplying by a time trend.
The positive and significant coefficient of DIST indicates that the further away the country
is from Germany the more FDI it attracts. In other words, FDI is not gravitated towards Germany.
There are a few possible explanations for this result. Horizontal FDI or intra-industry FDI is
induced by the presence of transportation cost. If the motive for FDI is to serve the export (local)
market, then the greater distance from the home country justifies more FDI flows. The other
possibility is a bias in a coefficient due to omitted variables such as the agglomeration effect.
Labor cost is found to have a negative but insignificant effect on FDI inflows. Note that,
without adjusting for labor productivity, low wage rate alone is not a good indicator for labor cost
24 The Hausman test rejects random effects model.

Group3-9 Kinoshita
- 13 -
advantage. In fact, investors are attracted to the site with more educated workers than low cost
labor as SS3 shows.
Abundance of natural resources is another rejected variable as a determinant of FDI.
Richness in natural resources is not a main reason for FDI flows. Total cumulative FDI stock in
CIS countries is greatest in resource-based industries. (e.g. Russia is in the third place in total FDI
stock in the region.) However, once we take into account a scale effect by using per capita FDI
stock, natural resources become no longer important.
In sum, column I indicates that FDI in these transition economies is seeking to sell in the
local market rather than exploiting cheap inputs and factor endowments. Availability of skilled
workers and sufficient infrastructure are a plus while abundance of natural resources and cheap
labor do not help attract more FDI. In particular, the increasing importance of human capital as an
attractor of FDI is also confirmed in a broader set of developing countries in Noorbakhsh and
Youssef(2001) as more FDI is tilted towards manufacturing sector than in the primary sector.
In column II, we add two policy variables. One is the average inflation rate to control for
the success of macroeconomic reform. The other is external liberalization index to measure how
open the country is. The results are quantitatively very similar to column I. Explanatory power of
the model is strengthened somewhat by the inclusion of external liberalization index (CLIE). A
positive and large coefficient of CLIE says that the progress of external liberalization is valued
much by foreign investors. Inflation rate is negatively related to FDI flows but not statistically
significant. This should not undermine the importance of price stabilization in the transition period.
Rather, as the price stabilization is typically introduced in the initial stage of transition and external
liberalization in the latter stage, investors may distinguish the winner of economic reform by
looking at the outcome of external liberalization.
Similar results are found in column III after adding the institutional factors that facilitate
business operations. Both the rule of law and quality of bureaucracy are positive and significant:
the better perceived the judicial system is and the less corrupted is the local bureaucracy, the more
FDI the country can attract. In Russia and CIS countries, corruptions and redtapes are often quoted
as impediments to new foreign investment. The result here is consistent with this anecdotal
evidence.
The results in columns I-III without the agglomeration effect consistently show that FDI in
the region is driven by access to local market rather than by cheap labor. This observation is more
relevant for the earlier comers of investment in the region when there is no prior investment made.
Group3-9 Kinoshita
- 14 -
Once a volume of investment reaches a critical mass, potential investors may simply follow the
herd of other investors: more FDI today leads to more FDI tomorrow. Investors pondering to invest
will flock to the countries that already received much FDI because they believe that past FDI stock
reflects favorable local conditions that are perceived by existing investors but not yet known to
them.25 Such agglomeration effects are proxied as a one-year lagged FDI stock per capita in this
study.
Once we include the agglomeration effect (Column IV), there is a large increase in R
square. Interestingly, the importance of the lagged dependent variable replaces the significance of
other variables. One exception is the quality of bureaucracy. This implies that there is a strong
tendency for foreign investors to agglomerate in certain locations. Attributes of other location-
specific factors such as market size, labor cost, and even policy variables become relatively less
important for the choice of investment locations once the agglomeration effect sets in. The quality
of bureaucracy yet remains.
However, it is well know that OLS often yields biased estimates in the presence of a lagged
dependent variable on the right-hand side of the regression since the lagged dependent variable is
endogenous by construction. This endogeneity problem has to be dealt with in the next subsection.
Agglomeration of foreign investors
Lagged dependent variable is not only non-random but also endogenous in the presence of
an unobservable fixed effect and OLS estimates will be biased and inconsistent. Following
Anderson and Hsiao(1981), we use the Generalized Method of Moments (GMM) Instrumental
Variable estimator for dynamic panels that yields consistent estimates.26
Table 2 compares the result from OLS and that of GMM. All regressions include year
dummies to control for time variation due to changes in external economic environment common
across countries. The sizes of coefficients are similar in both regressions. The agglomeration effect
and quality of bureaucracy remain significant in GMM. The main difference is observed in the
external liberalization index. It becomes significant in GMM.
The p-value of the Sargan test is very small. Thus, we reject the null hypothesis at 1% level
that there is no misspecification with a set of instruments we use in GMM. Second-order serial
25 See Kinoshita and Mody(2001) for further discussion. 26The efficiency of estimates can be improved by adding more moment conditions. For the system GMM estimation, see Arellano and Bond(1991), Ahn and Schmidt(1995, 1997), Arellano and Bover(1995), and Blundell and Bond(1998) .
Group3-9 Kinoshita
- 15 -
correlation is not detected according to the SOC test. However, as the Sargan test shows, the
validity of instruments is questionable. Overall, a comparison between OLS and GMM results
shows a bias in estimates in most variables is not great as seen in similar sizes of coefficients in
both specifications. But the reform policy variable CLIE may have been biased in OLS.
Both results confirm the presence of agglomeration of FDI that overrides other location-
specific factors such as market size and labor cost. The fact that both infrastructure and human
capital variables are affected by an inclusion of agglomeration suggests that the agglomeration
effect tend to be triggered by ‘created’ comparative advantages (e.g. skilled labor force, availability
of telephone lines) rather than indigenous ones (e.g. oil, gas, and cheap labor).
After correcting for possible bias in OLS, we still see that the agglomeration effect plays
an dominant role in guiding investors in choosing the investment location.
Is FDI into CIS countries driven by different factors?
We argue that different types of FDI are motivated by different factors. Market-seeking
FDI goes to countries with large local market while resource-seeking FDI goes to countries with
abundant natural resources. As Resmini(2000) reports, the locational determinants of FDI in
transition economies vary greately across different sectors. However, a sectoral breakdown of FDI
is not available in the data we compiled. Generally, the sectors in which CIS countries27 receive
FDI are mainly in light manufacturing industries (e.g. food, tobacco) and recource-based industries
by way of privatization whereas the sectoral distribution of FDI in other transition economies is
more evenly spread with a slight skewness towards heavy manufacturing industries (e.g.
automobile and machinery in the CEECs) and finance.
To introduce sectoral differences with the paucity of sectoral data, we divide the sample
into non-CIS and CIS countries. As discussed before, sectoral differences in FDI inflows in non-
CIS and CIS countries are large and we expect to see different factors driving FDI in these two
groups.
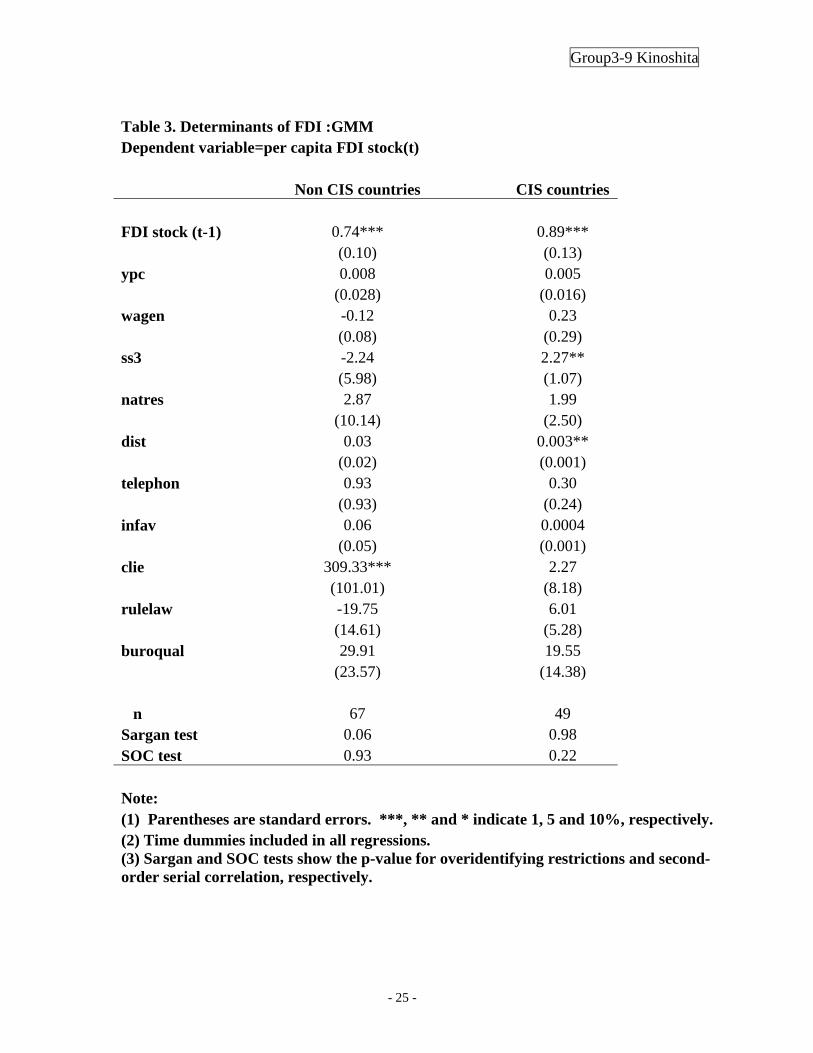
Table 3 shows the estimates from GMM for these two groups. Some differences are
observed in the results. First, the agglomeration effect is present in both but more pronounced in
CIS countries. Second, another important determinant of FDI flows is availability of skilled labor
for CIS countries and the external liberalization index for non-CIS countries.
27 Commonwealth of Independent States (CIS) are Armenia, Azerbaijan, Belarus, Georgia, Kazakhstan, Kyrgystan, Moldova, Russia, Tajikistan, Turkmenistan, Ukraine, and Uzbekistan.
Group3-9 Kinoshita
- 16 -
Somewhat puzzling is the positive coefficient on distance from Germany. CIS countries are
located far from the West than non-CIS countries. The main market they serve is Russia instead of
the Western Europe for historical and geographical reasons. In fact, when we replace DIST with
distance from Moscow instead of Dusserdorf, the sign of the distance variable becomes negative
and significant for CIS countries. This evidence shows that CIS countries are gravitated towards
Russia than the West.
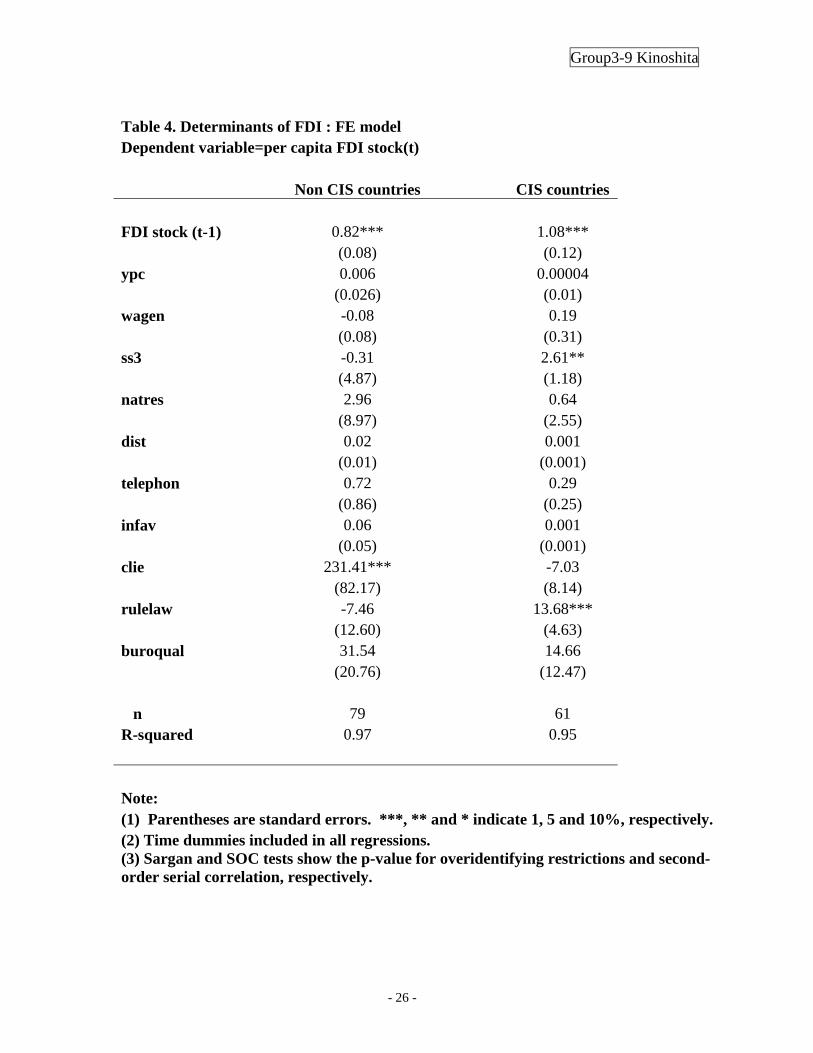
For non-CIS countries, however, Sargan test indicates the invalidity of the instruments.
Due to small samples, GMM estimates may be asymtotically biased. In table 4, we run fixed-
effects model instead to compare with the results from table 3.
In column I in table 4, non-CIS countries yield the results similar to those obtained from
GMM in table 3. This implies that a bias in GMM for non-CIS countries is not so severe. For non-
CIS countries, the agglomeration effect and human capital remain main drivers of FDI inflows.
Note that DIST is no longer significant in OLS and that the rule of law becomes more crucial in
explaining FDI inflows. In these variables, GMM in table 3 might have introduced bias in table 3.
Summarizing the results from tables 3 and 4, we find that the agglomeration effect seems
to be the most important variable in explaining FDI inflows. This is particularly so for CIS
countries because there is less direct information about business operating conditions than in non-
CIS countries. For investors, the signaling effect of other investors weigh more than classical
economic factors of comparative advantages.
For non-CIS countries, the degree of external liberalization is a key factor for promoting
FDI. For CIS countries, favorable business operating conditions such as well-enforced rules and
reasonable judicial systems encourage more FDI inflows. Availability of skilled labor force is
another important determinant.
These differences stem from the fact that two groups are in a different stage of economic
development and that they attract FDI in different sectors. Non-CIS countries had a head-start in
industrialization as they swiftly privatized nationally-owned enterprises and they are more
successful in accessing to global knowledge base via relatively open trade regime. CIS countries
are still lagging behind non-CIS countries in the level of industrial production and they are still shy
of attracting substantial FDI flows. Our results suggest that main impediments to FDI flows in CIS
countries are a lack of skilled labor force and a sound legal infrastructure.
5. Conclusions

Group3-9 Kinoshita
- 17 -
In this paper, we study the factors explaining the geographical distribution of FDI inflow
across 25 transition economies by utilizing panel data between 1990 and 1998. The location
determinants we test consist of three categories: the first are country-specific advantages such as
low-cost labor, large local market, skilled labor force, sufficient infrastructure, and proximity to the
West. The second group of variables to be tested is macroeconomic policy and policy that
facilitates business-operating conditions. The third is the agglomeration effect of foreign
investment. We explain FDI stock per capita in each country as a function of the above variables in
the GMM estimation.
In regression results, we find the role of agglomeration economies the most significant
determinant of foreign investment inflows in the transition economies. This result is robust
throughout alternative specifications. The model without the agglomeration effect seems to show
that FDI in the region is sought for by market-seeking investors rather than resource-seeking
investors. Once we introduce the agglomeration effect, however, market size becomes no longer an
important location determinant.
Nevertheless, poor quality of the bureaucracy in the host country is found to be a deterrent
to foreign investment decisions even after controlling for the agglomeration effect. This suggests
an interesting policy implication. Improving institutional governance such as bureaucratic quality is
a strong signal of favorable investment environment for many foreign investors. Economic and
political stability is a necessary condition in order for a host country to attract foreign investment.
Once it secures macroeconomic stability in the earlier stage of transition from centrally-planned to
a market economy, institutional dimension of the transition process becomes more important
particularly when a country tries to promote FDI.
The other determinant of FDI inflow is ‘openness’ to trade measured as external
liberalization index. Our results show that the more liberalized the country is towards external trade,
the more FDI it will attract. This confirms the findings in earlier studies that trade and FDI are
complementary to each other.
CIS and non-CIS countries (e.g. CEECs and the Baltic states) differ in the sector in which
they attract FDI. The location determinants reflect such differences when we divide the samples
into two groups. For CIS countries, there is a greater effect of agglomeration at work perhaps due
to insufficient information about local conditions as a destination of investment. For these countries,
securing the first wave of foreign investment flows is all the more important because this will lead
to a cascading effect of investment in subsequent periods. Other factors that contribute to FDI
Group3-9 Kinoshita
- 18 -
inflows in CIS countries are availability of human capital and good rule of law, or a sound judicial
system. For non-CIS countries, the agglomeration effect is present but to a lesser extent than in CIS
countries. One determining factor in attracting FDI in these countries is the more liberalized trade
regime.
Using a broader set of transition countries and a longer time span than in existing studies,
we hope to introduce heterogeneity both in time and country in analyzing the location determinants
of FDI. We confirm the presence of agglomeration economies as a dominant factor in explaining
the pattern of geographical FDI distribution across these countries. Also important are the extent of
trade liberalization and the quality of bureaucracy. Educated workforce is particularly important
for CIS countries as it might reflect a change of direction in the areas of FDI they receive.

Group3-9 Kinoshita
- 19 -
References
Anderson and Hsiao(1981) “Estimation of dynamic models with error components”, Journal of
American Statistical Association 76, 598-606.
Arellano, M. and S. Bond (1991) "Some tests of specification for panel data: Monte Carlo evidence
and an application to employment equation", Review of Economic Studies 58, 277-297.
Arellano and Bover (1995) “Another look at instrumental variable estimation of error-components
models”, Journal of Econometrics 68, 29-51.
Berg, A., E. Borensztein, R.Sahay and J. Zettelmeyer(1999) “The evolution of output in transition
economies: explaining the difference”, IMF Working Paper WP/99/73.
Bevan, A. and S. Estrin (2000) “The determinants of foreign direct investment in transition
economies” , University of Michigan William Davidson Institute Working Paper No. 342.
Blundell and Bond (1998) "Initial conditions and moment restrictions in dynamic panel data
models", Journal of Econometrics 87, 115-143.
Borensztein, E., J. DeGregorio, and J-W. Lee(1998) “How does foreign direct investment affect
economic growth?”, Journal of International Economics 45, 115-135.
Campos, N.F. (2000) “Context is everything: Measuring institutional change in transition economies,” Washington, D.C., World Bank Policy Research Paper No. 2269.
Campos, N.F. and Y. Kinoshita (2002) “FDI as technology transferred: some panel evidence from
transition economies, ” The Manchester School.
Caves, R. (1996) Multinational enterprise and economic analysis , 2nd ed. Cambridge University
Press.

Group3-9 Kinoshita
- 20 -
Chen, L. and Y. Kwan (2000) “What are the determinants of the location of foreign direct
investment? The Chinese experience”, Journal of International Economics 51, 379-400.
Coughlin, C., J. Terza, and V. Arromdee (1991) “State characteristics and the location of foreign
direct investment within the United States”, Review of Economics and Statistics Vol. 73 (4), 675-
683.
De Melo, M., C. Denizer, A. Gelb, and S. Tenev (1997) “Circumstance and choice: The role of
initial conditions policies in transition economies”, World Bank Policy Research Working Paper
1866, The World Bank, Washington D.C.
Dunning, J. (1993) Multinational Enterprises and the Global Economy, Pearson Education.
European Bank for Reconstruction and Development (2000) Transition Report 2000, EBRD,
London.
Estrin, S., K. Hughes, and S. Todd (1997) Foreign Direct Investment in Central and Eastern
Europe, Royal Institute of International Affairs.
Fujita, M., P. Krugman and A. Venables (1999) The Spatial Economy: Cities, Regions, and
International Trade. Cambridge, MIT Press.
Gylfason, T. and G. Zoega (2001) “Natural resources and economic growth: the role of
investment”, CEPR discussion paper No. 2743.
Hanson, G. (2000) “Should countries promote foreign direct investment?”, Mimeo, Department of
Economics, University of Michigan.
Head, K., J.Ries, and D. Swenson (1995) “Agglomeration benefits and location choice: Evidence
from Japanese manufacturing investments in the United States”, Journal of International
Economics 38, 223-248.

Group3-9 Kinoshita
- 21 -
Kinoshita and Mody (2001) “Private information for foreign investment decisions in emerging
markets”, Canadian Journal of Economics 34, 448-464.
Kravis and Lipsey(1982) “Location of overseas production and production for exports by US
manufacturing firms”, Journal of International Economics 12, 201-223.
Krugman(1991) “Increasing returns and economic geography”, Journal of Political Economy 99,
483-499.
Lankes and Venables(1996) “Foreign direct investment in economic transition: The changing
pattern of investments”, Economics of Transition vol.4, 331-347.
Lucas, R.E. Jr.(1988) “The mechanics of economic development”, Journal of Monetary Economics
22, 3-42.
Lucas, R.E. Jr. (1990) “Why doesn’t capital flow from rich to poor countries?”, American
Economic Review Paper and Proceedings Vol. 80, 92-96.
Lucas, R.(1993) “On the determinants of direct foreign investment: Evidence from East and
Southeast Asia”, World Development 21(3), 391-406.
Markusen, J. and A. Venables (1998) “Multinational firms and the new trade theory”, Journal of
International Economics Vol. 46, No.2, 183-203.
Noorbakhsh, F. and A. Youssef (2001) “Human capital and FDI inflows to developing countries:
New empirical evidence”, World Development 29(9), 1593-1610.
Robinson, J., R. Torvik, and T. Verdier (2002) “Political foundations of the resource curse”, CEPR
discussion paper No. 3422.
Remini, L. (2000) “The determinants of foreign direct investment in the CEECs ”, Economics of
Transition, Vol.8 (3), 665-689.

Group3-9 Kinoshita
- 22 -
Singh, H. and K. Jun (1996) “The determinants of foreign direct investment in developing
countries”, Transnational Corporations vol.5 no. 2, August, 67-105..
Wheeler, D. and A. Mody (1992) “International investment location decisions: The case of U.S.
firms”, Journal of International Economics 33, 57-76.

Group3-9 Kinoshita
- 23 -
Table 1. Determinants of FDI: Fixed effects Dependent variable=per capita FDI stock(t) I II III IV FDI stock (t-1) ___ ___ ___ 0.93*** (0.04) ypc 0.08*** 0.05** 0.04 0.01 (0.02) (0.02) (0.02) (0.01) wagen -0.05 -0.08 -0.03 -0.05 (0.15) (0.14) (0.14) (0.06) ss3 20.33*** 15.02*** 18.33*** 2.84 (4.43) (4.43) (4.52) (2.16) natres -8.30 -2.78 -2.55 -0.44 (7.13) (6.88) (6.71) (3.25) dist 0.02*** 0.02*** 0.02*** 0.002 (0.006) (0.006) (0.006) (0.003) telephon 5.25*** 5.09*** 5.57*** 0.36 (0.59) (0.56) (0.59) (0.37) infav ___ -0.006 -0.003 0.001 (0.007) (0.007) (0.003) clie ___ 123.34*** 102.44*** 21.77 (31.71) (31.88) (15.73) rulelaw ___ ___ 26.27* 1.74 (13.91) (6.56) buroqual ___ ___ 49.47* 28.29** (25.42) (13.33) n 148 148 148 140 R square 0.82 0.84 0.85 0.96 Note: (1) Parentheses are standard errors. ***, ** and * indicate 1, 5, and 10% significance level, respectively. (2) Time dummies included in all regressions.

Group3-9 Kinoshita
- 24 -
Table 2. Determinants of FDI Dependent variable=per capita FDI stock(t) OLS GMM FDI stock (t-1) 0.93*** 0.89*** (0.04) (0.06) ypc 0.01 0.009 (0.01) (0.01) wagen -0.05 -0.08 (0.06) (0.06) ss3 2.84 0.81 (2.16) (2.61) natres -0.44 -0.20 (3.25) (3.75) dist 0.002 0.003 (0.003) (0.003) telephon 0.36 0.32 (0.37) (0.42) infav 0.001 0.002 (0.003) (0.003) clie 21.77 38.18** (15.73) (18.91) rulelaw 1.74 -9.77 (6.56) (8.62) buroqual 28.29** 33.96** (13.33) (15.71) n 140 116 Sargan test 0.000 SOC test 0.58 ` Note: (1) Parentheses are standard errors. ***, ** and * indicate 1, 5, and 10% significance level, respectively. (2) Time dummies included in all regressions. (3) Sargan and SOC tests show the p-value for overidentifying restrictions and second-order serial correlation, respectively.
Group3-9 Kinoshita
- 25 -
Table 3. Determinants of FDI :GMM Dependent variable=per capita FDI stock(t) Non CIS countries CIS countries FDI stock (t-1) 0.74*** 0.89*** (0.10) (0.13) ypc 0.008 0.005 (0.028) (0.016) wagen -0.12 0.23 (0.08) (0.29) ss3 -2.24 2.27** (5.98) (1.07) natres 2.87 1.99 (10.14) (2.50) dist 0.03 0.003** (0.02) (0.001) telephon 0.93 0.30 (0.93) (0.24) infav 0.06 0.0004 (0.05) (0.001) clie 309.33*** 2.27 (101.01) (8.18) rulelaw -19.75 6.01 (14.61) (5.28) buroqual 29.91 19.55 (23.57) (14.38) n 67 49 Sargan test 0.06 0.98 SOC test 0.93 0.22 Note: (1) Parentheses are standard errors. ***, ** and * indicate 1, 5 and 10%, respectively. (2) Time dummies included in all regressions. (3) Sargan and SOC tests show the p-value for overidentifying restrictions and second-order serial correlation, respectively.
Group3-9 Kinoshita
- 26 -
Table 4. Determinants of FDI : FE model Dependent variable=per capita FDI stock(t) Non CIS countries CIS countries FDI stock (t-1) 0.82*** 1.08*** (0.08) (0.12) ypc 0.006 0.00004 (0.026) (0.01) wagen -0.08 0.19 (0.08) (0.31) ss3 -0.31 2.61** (4.87) (1.18) natres 2.96 0.64 (8.97) (2.55) dist 0.02 0.001 (0.01) (0.001) telephon 0.72 0.29 (0.86) (0.25) infav 0.06 0.001 (0.05) (0.001) clie 231.41*** -7.03 (82.17) (8.14) rulelaw -7.46 13.68*** (12.60) (4.63) buroqual 31.54 14.66 (20.76) (12.47) n 79 61 R-squared 0.97 0.95 Note: (1) Parentheses are standard errors. ***, ** and * indicate 1, 5 and 10%, respectively. (2) Time dummies included in all regressions. (3) Sargan and SOC tests show the p-value for overidentifying restrictions and second- order serial correlation, respectively.

Group3-9 Kinoshita
- 27 -
Appendix 1. Definitions of variables per capita FDI stock Per capita cumulative FDI stock (constant million USD) [source: World Development Indicator] lagged FDI stock One-year lagged per capita FDI stock ypc GDP per capita (USD) wagen Gross nominal wage (USD) [source: UNECE 'Economic Survey of Europe'] ss3 General secondary school enrollment (%) natres Natural resource endowment: =0 if poor, =1 if moderate, and =2 if rich.[source: DDGT] dist Distance from Dusseldorf (km) telephon # of telephone mainlines per 1000 people infav Average inflation rate (%) clie Cumulative external liberalization index, i.e. trade liberalization rulelaw Extent of law enforcement [source: Campos(2000)] buroqual Quality of bureaucracy [source: Campos(2000)]
Group3-9 Kinoshita
- 28 -
Appendix 2.Summary Statistics Obs Mean Std. Dev. Min Max FDI stock 188 164 295 0 1771 Lagged FDI stock 163 131 250 0 1572 ypc 220 2134 1784 219 9850 wagen 151 167 217 0.02 1247 ss3 221 26 7.7 8.8 45.6 natres 225 0.52 0.75 0 2 dist 225 2237 1476 559 5180 telephon 219 162 88 0 374 infav 225 434 1304 -0.8 15606 clie 225 2.74 2.45 0 9.5 rulelaw 225 6 2.46 2 10 buroqual 225 2.45 1.63 0.83 8.33