“The Local Missouri Context: Economic Trends for Missouri Legislative Districts” Changing...
23
“The Local Missouri Context: Economic Trends for Missouri Legislative Districts” Changing Missouri Demographics: Local Population Trends July 9 th , 2009 Columbia, Missouri Bill Elder PhD, Director John Blodgett, Program Coordinator Office of Social & Economic Data Analysis (OSEDA) University of Missouri
-
date post
21-Dec-2015 -
Category
Documents
-
view
219 -
download
0
Transcript of “The Local Missouri Context: Economic Trends for Missouri Legislative Districts” Changing...
“The Local Missouri Context: Economic Trends for Missouri Legislative Districts”
Changing Missouri Demographics: Local Population Trends
July 9th, 2009
Columbia, Missouri
Bill Elder PhD, Director John Blodgett, Program Coordinator
Office of Social & Economic Data Analysis (OSEDA)University of Missouri
Overview…
• A few words about OSEDA• Demographic Trends & Missouri• The 2010 Census• The American Community Survey (ACS) • Understanding Local Missouri
Communities Using ACS Applications
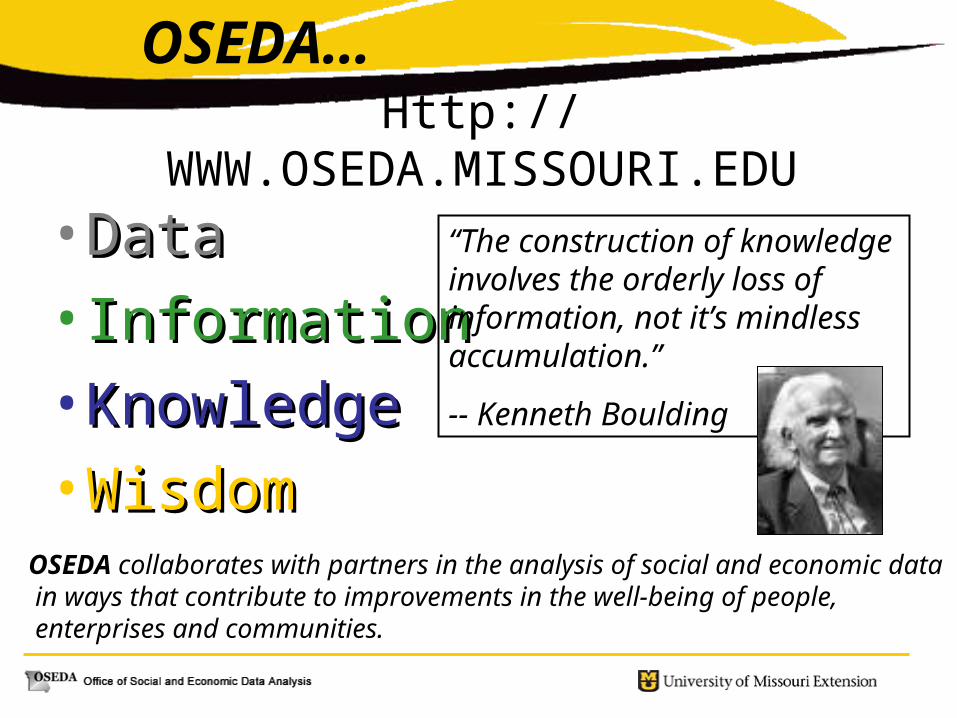
• Data Data
• Information Information
• Knowledge Knowledge
• WisdomWisdom
“The construction of knowledge involves the orderly loss of information, not it’s mindless accumulation.”
-- Kenneth Boulding
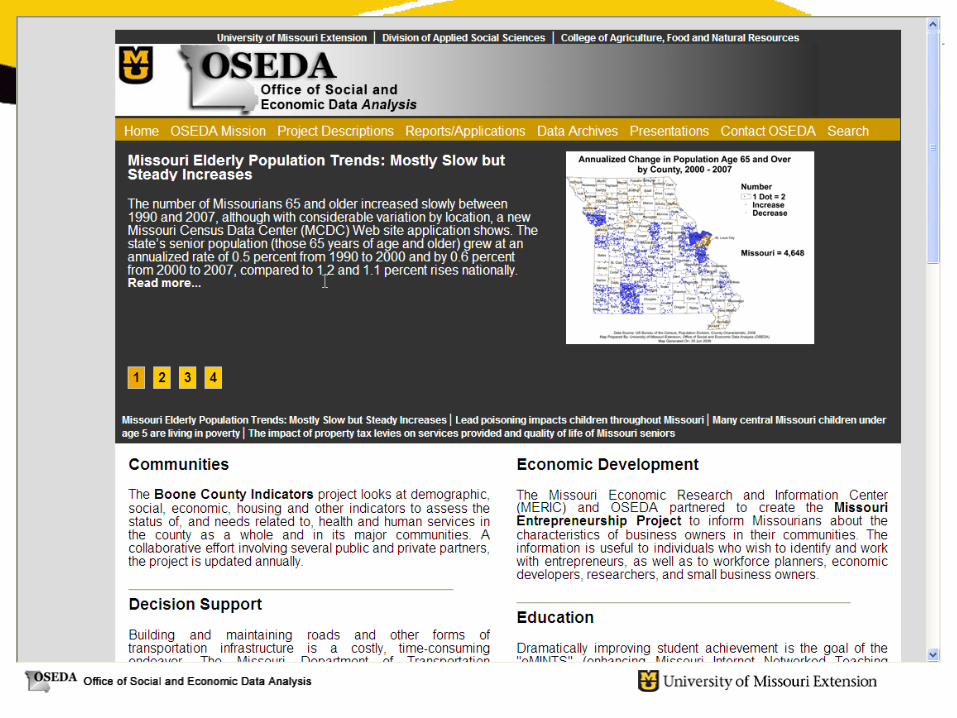
Http://WWW.OSEDA.MISSOURI.EDU
OSEDA collaborates with partners in the analysis of social and economic data in ways that contribute to improvements in the well-being of people, enterprises and communities.
OSEDA…
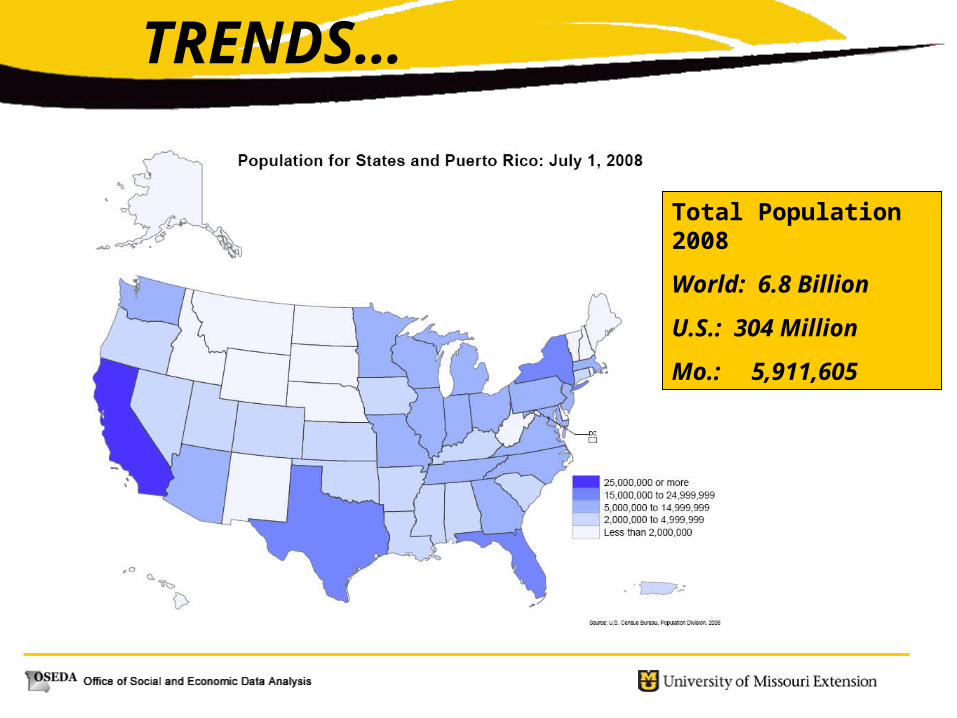
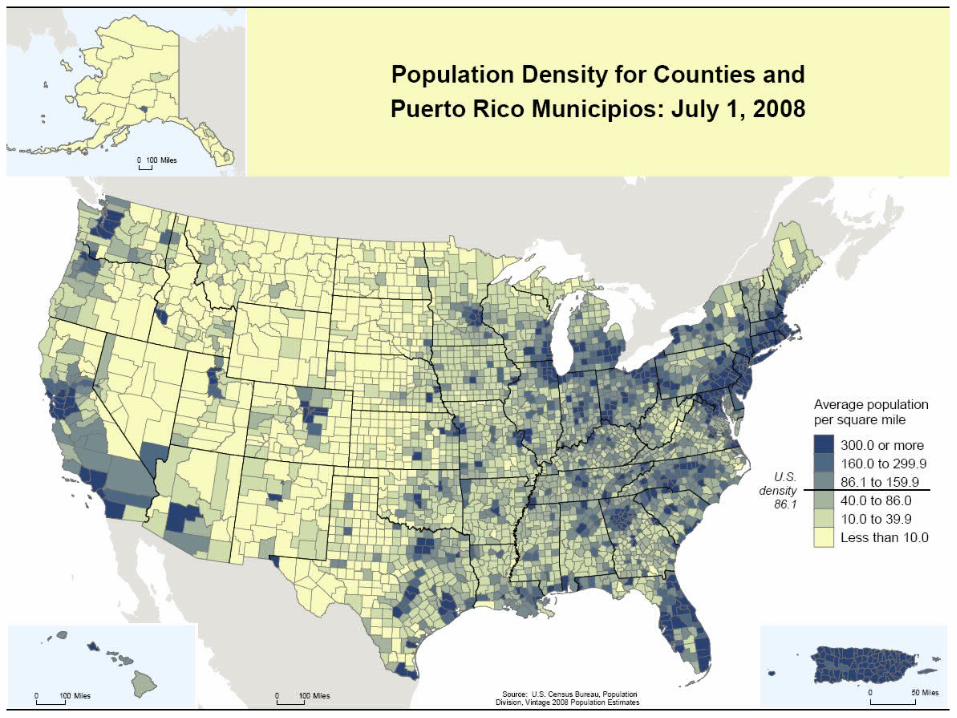
Total Population 2008
World: 6.8 Billion
U.S.: 304 Million
Mo.: 5,911,605
TRENDS…
Total Population 2008
World: 6.8 Billion
U.S.: 304 Million
Mo.: 5,911,605
Change in Population By State2000 – 2008
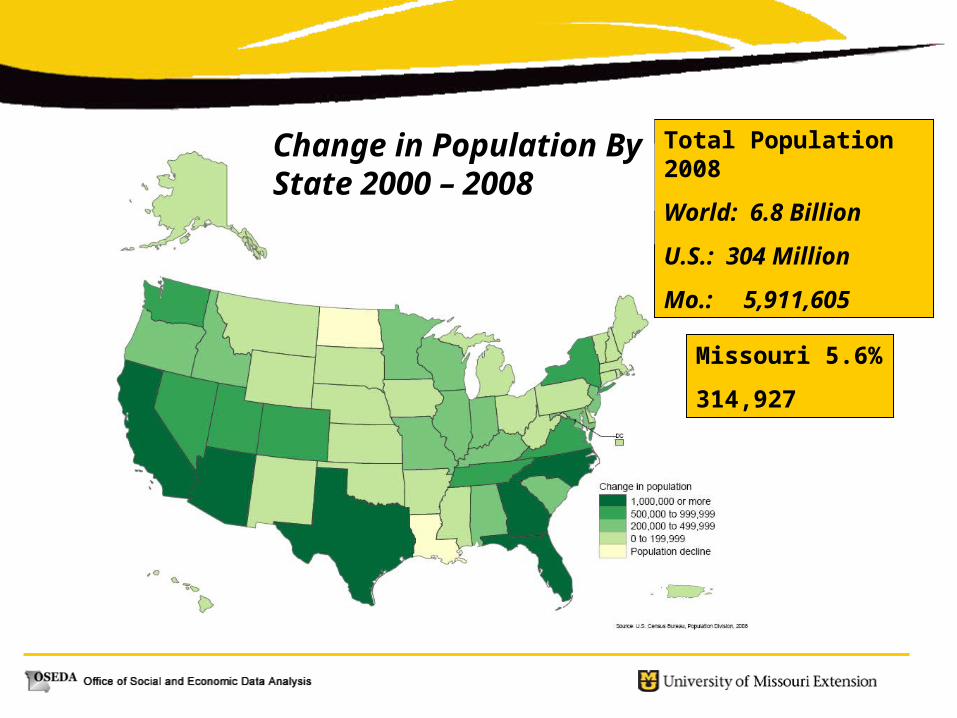
Change in Population By State 2000 – 2008
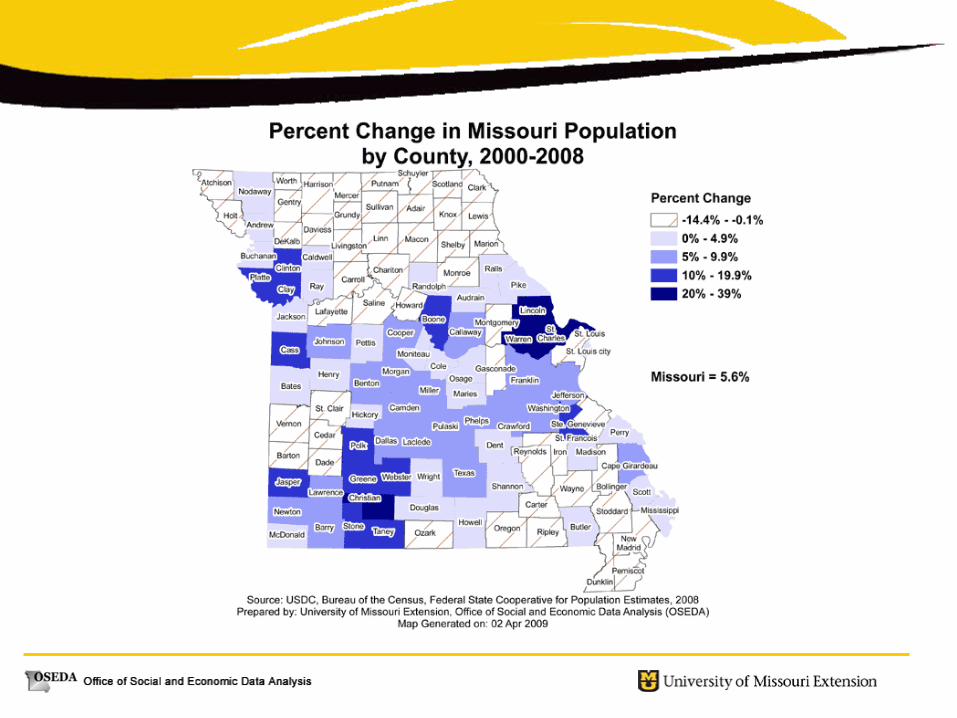
Missouri 5.6%
314,927
Total Population 2008
World: 6.8 Billion
U.S.: 304 Million
Mo.: 5,911,605
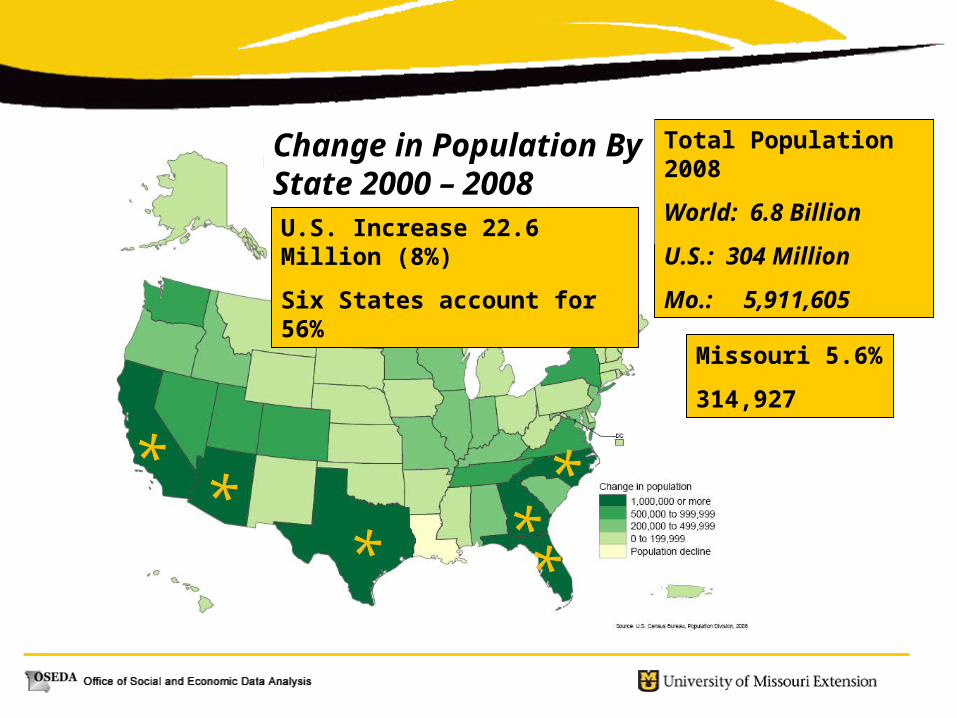
Change in Population By State 2000 – 2008
** *
***
U.S. Increase 22.6 Million (8%)
Six States account for 56%
Missouri 5.6%
314,927
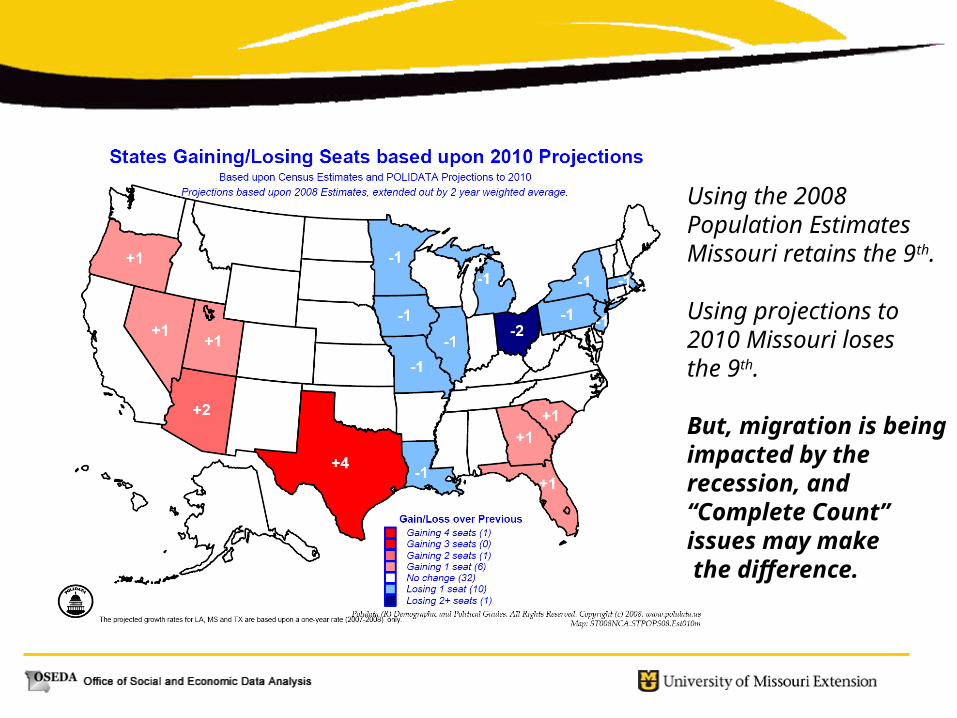
Using the 2008Population EstimatesMissouri retains the 9th.
Using projections to2010 Missouri losesthe 9th.
But, migration is beingimpacted by the recession, and “Complete Count” issues may make the difference.
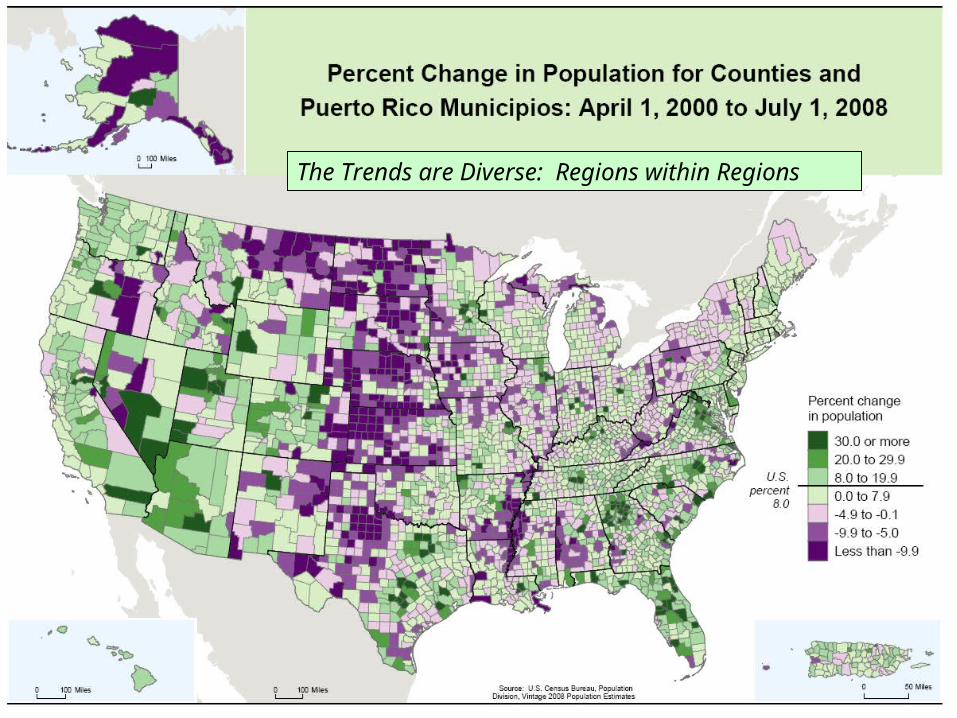
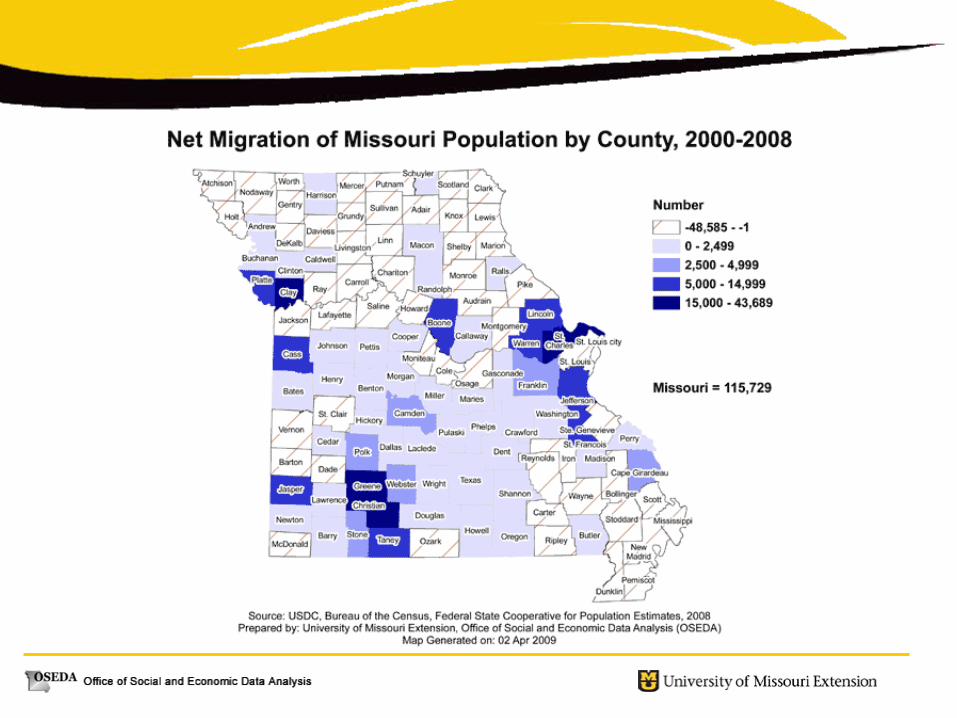
The Trends are Diverse: Regions within Regions
Population Estimates
• More Population Estimates via OSEDA at
MCDC.missouri.edu• Sub-County Estimates for 2008 just
released….Columbi0a officially over 100,000.
• OSEDA County Profiles
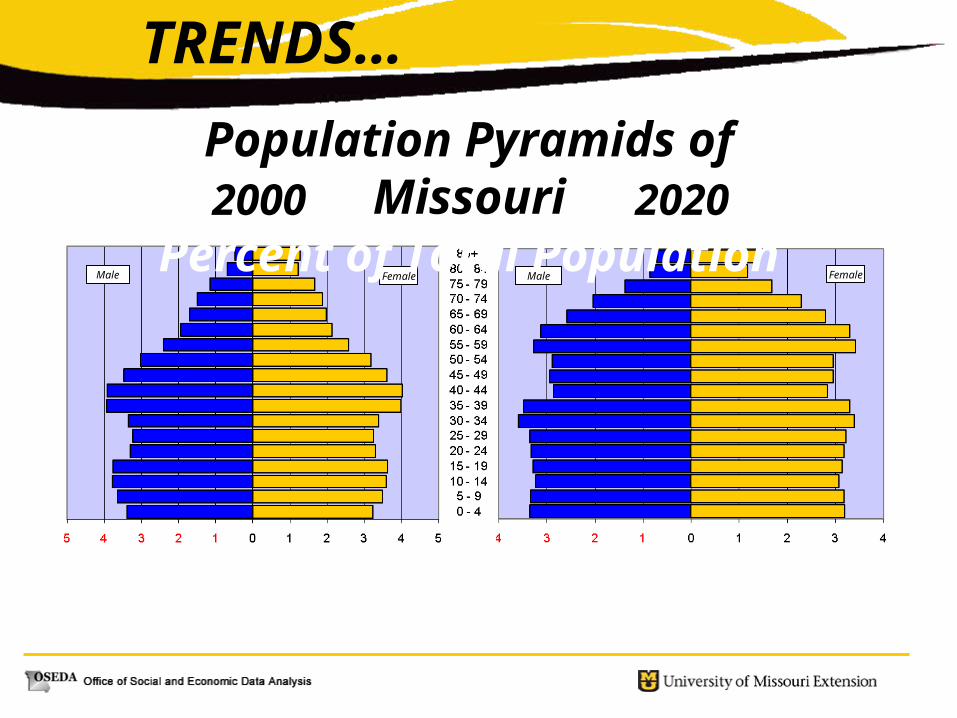
Male FemaleMale Female
Population Pyramids of MissouriPercent of Total Population2000 2020
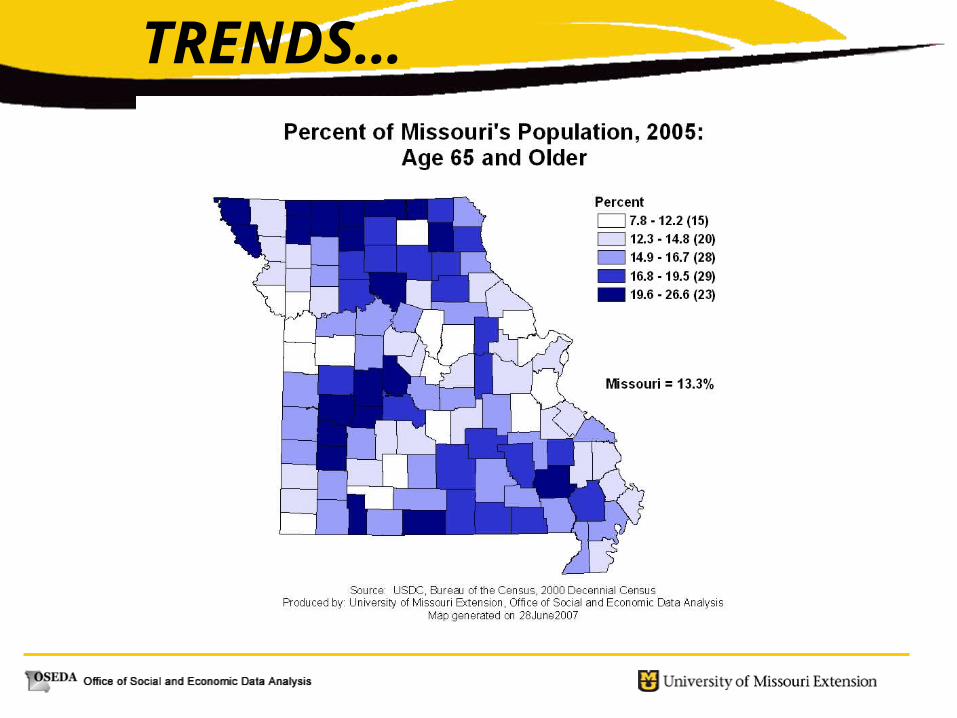
TRENDS…
TRENDS…
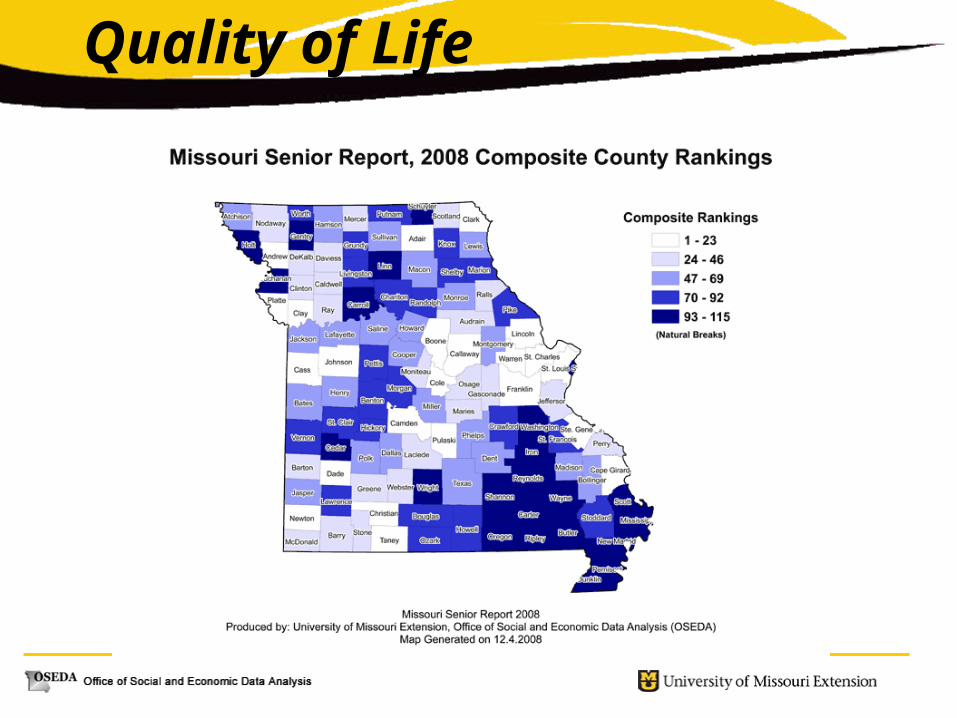
Quality of Life
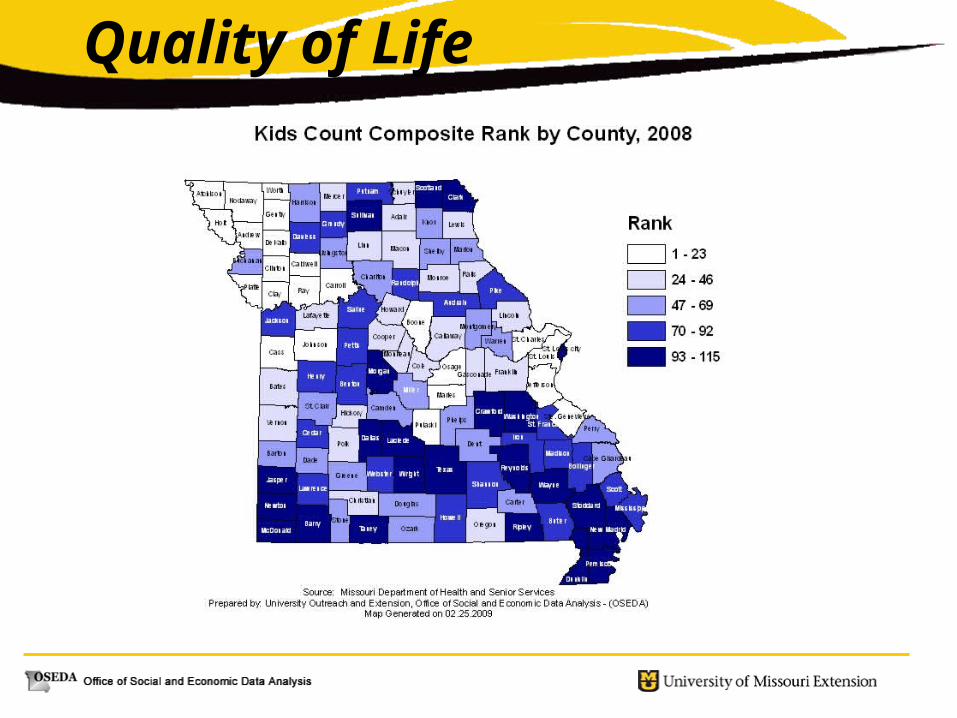
Quality of Life
2010 Census
• Mother of all address lists (enumeration)• Only “Short Form” in 2010 (the count)• Reapportionment and redistricting file by
the end of 2010.• Representation and Resource Allocation• “Complete Count” Programs• Instead of “Long Form” we have the
– “The American Community Survey”
American Community Survey
• Nationwide, continuous annual survey collecting the information on the 2000 Census “long form”– Demographic, Economic, Social and Housing– From 1 in 6 households in 2000 to 1 in 8 now.– Three Million households a year.
• Most definitive source of such data (allocations)• Involves Margins of Error --- ( +/- )• Three types of estimates
– 1-Year 65,000 population or more– 3-Year 20,000 population or more– 5-year Less than 20,000 population (coming next year)
American Community Survey
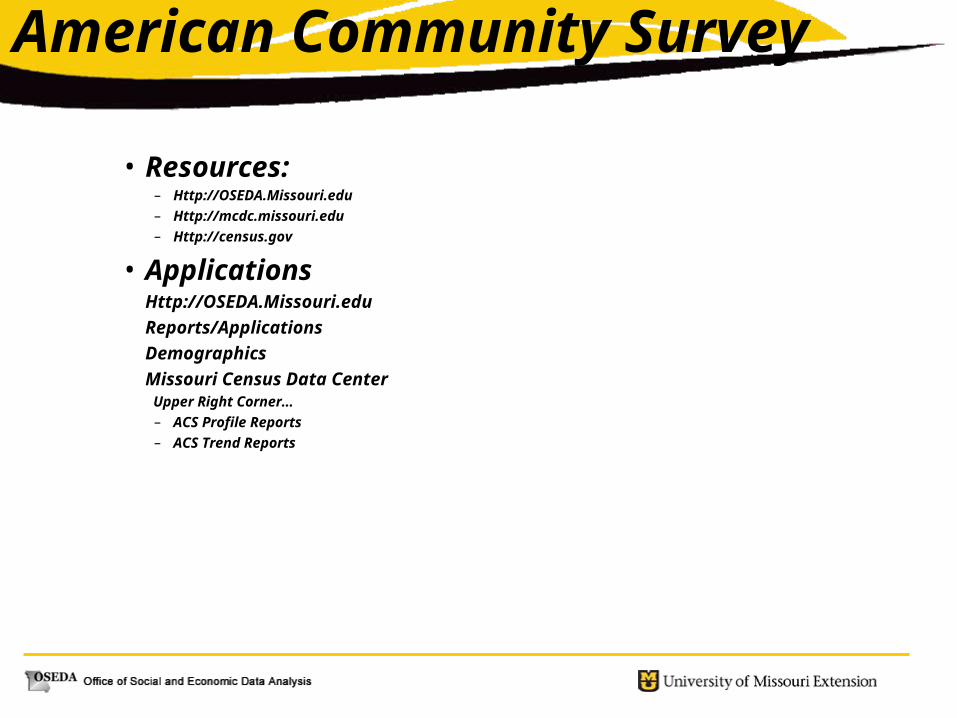
• Resources:– Http://OSEDA.Missouri.edu– Http://mcdc.missouri.edu – Http://census.gov
• ApplicationsHttp://OSEDA.Missouri.edu
Reports/Applications
Demographics
Missouri Census Data CenterUpper Right Corner…– ACS Profile Reports– ACS Trend Reports
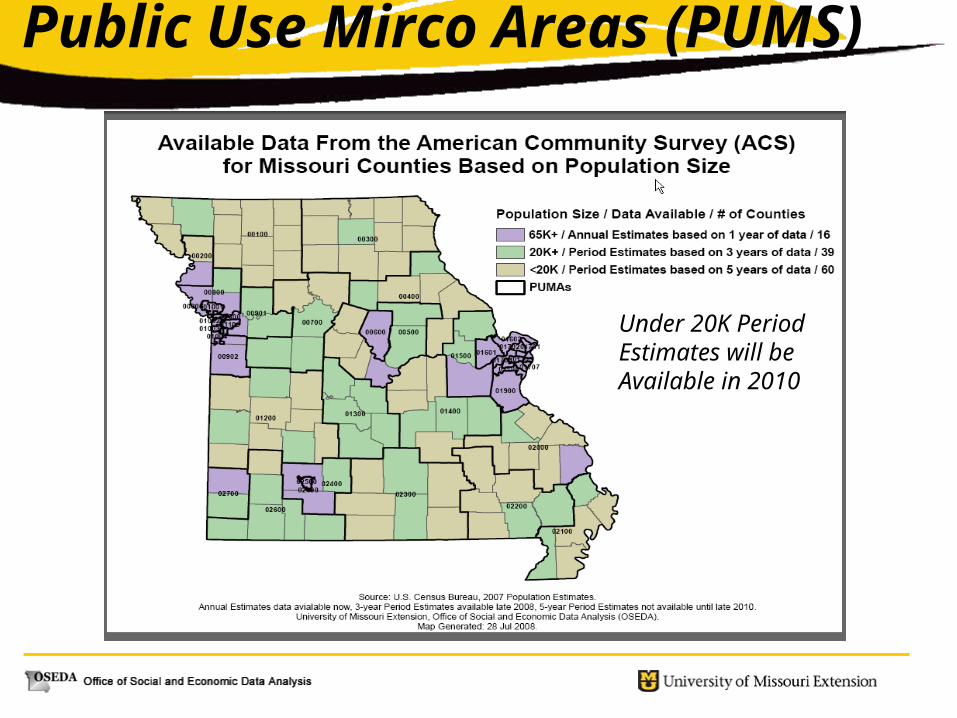
Under 20K PeriodEstimates will beAvailable in 2010
Public Use Mirco Areas (PUMS)
“The Local Missouri Context: Economic Trends for Missouri Legislative Districts”
Changing Missouri Demographics: Local Population Trends
July 9th, 2009
Columbia, Missouri
Bill Elder PhD, Director John Blodgett, Program Coordinator
Office of Social & Economic Data Analysis (OSEDA)University of Missouri