The LNG industry GIIGNL Annual Report · 2020-04-08 · In 2019, the LNG market grew at a vigorous...
64
The LNG industry GIIGNL Annual Report
Transcript of The LNG industry GIIGNL Annual Report · 2020-04-08 · In 2019, the LNG market grew at a vigorous...
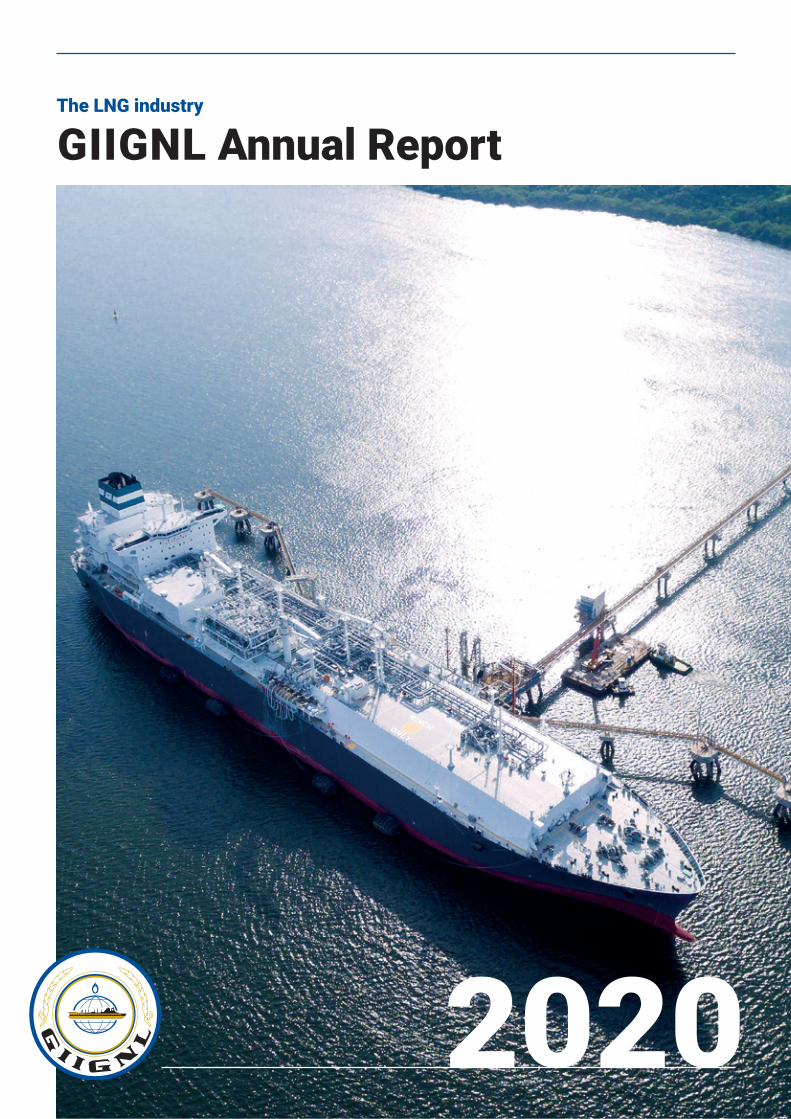
The LNG industry
GIIGNL Annual Report

ProfileGIIGNL is a non-profit organisation whose objective is to promote the development of activities related to LNG: purchasing, importing, processing, transportation, handling, regasification and its various uses.
The Group constitutes a forum for exchange of information and experience among its 88 members in order to enhance the safety, reliability, efficiency and sustainability of LNG import activities and in particular the operation of LNG import terminals.
Acknowledgements
We wish to thank all member companies for their contribution to the report and the following international experts for their comments and suggestions:• Cybele Henriquez – Cheniere Energy• Najla Jamoussi – Cheniere Energy• Callum Bennett – Clarksons• Laurent Hamou – Elengy• Jacques Rottenberg – Elengy• María Ángeles de Vicente – Enagás• Paul-Emmanuel Decroës – Engie• Oliver Simpson – Excelerate Energy• Andy Flower – Flower LNG• Magnus Koren – Höegh LNG• Mariana Ortiz – Naturgy Energy Group• Birthe van Vliet – Shell• Mika Iseki – Tokyo Gas• Yohei Hukins – Tokyo Gas• Donna DeWick – Total• Emmanuelle Viton – Total• Xinyi Zhang – Total
© GIIGNL - International Group of Liquefied Natural Gas ImportersAll data and maps provided in this publication are for information purposes and shall be treated as indicative only. Under no circumstances shall they be regarded as data or maps intended for commercial use. Reproduction of the contents of this publication in any manner whatsoever is prohibited without prior consent of the copyright owners.
Profile
In 2019, the LNG market grew at a vigorous 13.0% rate, reaching 354.7 MT, an expansion followed by mounting uncertainties since the start of 2020.
In the near term, the disruptive impact of the Covid-19 outbreak on the economies of importing countries will exert downward pressure on LNG demand in an already oversupplied market.
2019 marked an all-time record increase in annual LNG production, driven by new liquefaction trains and ramp-ups in the United States, Russia and Australia. Over the last three years, the industry has added more than 80 MTPA of new capacity and significant volumes are due to come online by 2025. Besides, 2019 was a re-cord year for new investment decisions, which reached 71 MTPA worldwide by the end of the year.
Global LNG flows experienced a shift in patterns: Northeast Asian demand growth moderated due to economic slowdown, milder weather and competi-tion from nuclear and coal-fired power generation, while most of additional LNG volumes were absorbed into Europe which played a balancing role thanks to its abundant infrastructure and well-connected gas market.
On the demand side, no new country joined the ranks of importers in 2019 but several countries made sound progress on infrastructure development and are set to begin importing in the coming years. In Asia, demand was characterized by two diverging trends: on the
one hand, it continued to be boosted by China despite the US-China trade frictions and the slowdown of the coal-to-gas switch in the industrial sector. On the other hand LNG demand declined in Japan and South Korea, where increasing levels of nuclear power generation and the pace of renewables deployment influenced the role of LNG in the power mix. In Europe, the absorption of surplus volumes was enabled by a combination of lower pipeline imports, declining domestic production, increased storage use and additional gas-fired power generation. Imports dwindled in the Middle East as Egypt increased its exports. The same dynamic occur-red in South America as Argentina started LNG produc-tion and exports.
For LNG sellers and buyers, business models and contractual arrangements are becoming increasingly diversified. Traders continue to take advantage of sea-sonal and local supply tensions and integrated portfolio players are displaying impressive growth, aiming to bridge the disconnect between LNG seller and buyer in-terests. We see competing interests, a world in which sellers require long-term commitments to support their investments, whereas buyers need shorter contract durations, diversified pricing structures, increased des-tination flexibility and greater volume flexibility in order to manage demand uncertainty.
Looking further ahead, LNG will continue to be a flexible, safe, reliable and cleaner energy source to meet ever more flexible and climate-conscious demand. To allow natural gas to penetrate new markets, prices
need to remain at levels that make gas competitive with alternative fuels in downstream power and gas markets but, at the same time, support the significant investments needed in production, liquefaction, trans-portation, transmission and downstream infrastructure. A balance will have to be found, and in the end, the scale of new developments will depend on the industry’s competitiveness, as well as on its ability to demonstrate its environmental benefits, in particular by increasing ef-forts to detect, measure and reduce methane emissions. Natural gas’s effective contribution in quickly improving air quality and curbing carbon emissions should be key in positioning LNG as an enduring part of the energy mix and as a pragmatic and lower-carbon solution for the future, while new gases will begin to take advantage of the versatility of LNG infrastructure.
In 2019, LNG commercial operations passed the mark of 100,000 delivered cargoes without major incident, showing an incredible track-record of safety. As we en-ter a new decade and as GIIGNL is approaching its 50th anniversary, our association remains committed to pro-moting cooperation between LNG players and to sup-porting the development of safe, efficient and sustai-nable LNG imports for a responsible energy transition.
Yours sincerely,
Jean-Marie DaugerPresident
Dear Colleagues,
Jean-Marie DaugerPresident
The LNG industry in 2019“LNG will continue to be a flexible, safe,
reliable and cleaner energy source”
GIIGNL Annual Report 2020 Edition - 3
Editorial
Key figures2019
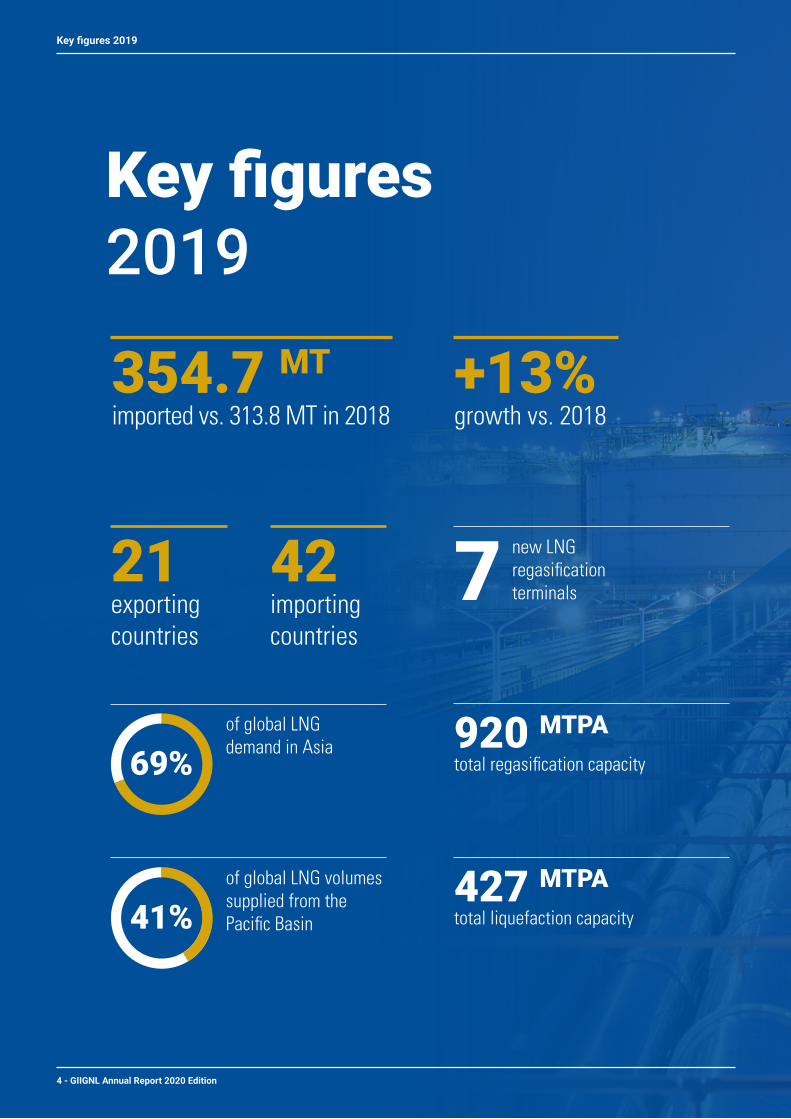
354.7 MTimported vs. 313.8 MT in 2018
+13%growth vs. 2018
42 importing countries
21 exporting countries
920 MTPA
total regasification capacity
new LNG regasification terminals7
427 MTPA
total liquefaction capacity
of global LNG demand in Asia
of global LNG volumes supplied from the Pacific Basin
69%
41%
4 - GIIGNL Annual Report 2020 Edition
Key figures 2019

ContentsKey Figures 4LNG trade in 2019 6Contracts concluded in 2019 8Medium-term and long-term contracts in force in 2019 10LNG shipping 18LNG imports in 2019 30Liquefaction plants 38Regasification terminals 44World LNG Maps 54Retail LNG in 2019 58About GIIGNL 59
119 MTimported on a spot or short-term basis or 34% of total trade
34%
GIIGNL Annual Report 2020 Edition - 5
Key figures 2019

LNG trade in 2019In 2019, global LNG imports reached 354.7 million tons (MT), increasing by 40.9 MT or 13.0% compared to the previous year, the strongest growth rate since 2010.
Argentina exported its first LNG cargo from the Tango FLNG small-scale facility in June 2019, increasing the number of exporting coun-tries to 21*.
The number of importing coun-tries remained unchanged, at 42**.
Strongest LNG supply growth since 2010 thanks to the Atlantic Basin
As in 2018, new LNG supply volumes were mostly driven by new production from the United States (+13.1 MT), Russia (+11 MT) and Australia (+8.7 MT). Most exporting countries experienced an increase in their supply exports, except for three countries: Indonesia (-2.7 MT), Equatorial Guinea (-0.7 MT) due to feed gas issues and Norway (-0.5 MT) due to maintenance requirements. 5 new large-scale liquefaction projects started com-mercial operations in 2019: 4 onshore in the United States (Cameron LNG Train 1, Corpus Christi LNG, Freeport LNG Train 1 and Elba Island) and 1 FLNG in Australia (Prelude FLNG). In addition, 2 small-scale liquefaction plants started-up exports: 1 onshore in Russia (Vysotsk LNG) and 1 floating unit in Argentina (Tango FLNG).The Pacific Basin remains the largest source of LNG supplies to the global market with 146.7 MT or 41.3% of the total global market, followed by the Atlantic Basin (32.2%) and the Middle East (26.5%). Due to the increase in production from Australia, the gap between supply from the Pacific Basin and the Middle East has widened, from 45 MT in 2018 to almost 53 MT in 2019.The Atlantic Basin was the region contributing the most to incremental volumes (+30 MT or almost three quarters of new volumes). With 114.2 MT, the Atlantic Basin is now the second largest source of LNG supply ahead of the Middle East (93.9 MT).
Europe absorbs most of the LNG oversupply
In 2019, Asia continued to be the leading importing region with a 69% share of global LNG imports, down from 76% in 2018. Asian LNG imports grew
by 3.2% in 2019 to 246.2 MT, rising in all countries except in the established importing countries of Japan, South Korea and Taiwan. Even though Japanese LNG imports declined by 6.8% in 2019 compared to 2018, Japan remains the leading impor-ting country with 76.9 MT or a 21.7% market share. The main reasons for declining LNG imports in Japan were a slowdown of economic growth, the restart of several nuclear power units and mild temperatures. Like Japan, South Korea also experienced a decline in LNG imports, from 44 MT in 2019 to 40.1 MT, remaining the third largest LNG importer in the world and accounting for 11.3% of global market share. The main reasons for the decline were better nuclear generation performance, mild weather and high inventories at the beginning of the year.In 2019, China experienced continued growth of LNG imports, although at a slower pace (+14% compared with +38% in 2018) but the country remains the second largest LNG importer globally, with 61.7 MT or a 17.4% market share (similar to the market share of 2018). In China, the main reasons for the slowdown of year-on-year growth of LNG imports were the moderating economic growth rate, general easing of coal-to-gas switching efforts, acceleration of domestic production, as well as the rising share of renewables. In other Asian countries, LNG consumption conti-nued to grow strongly: in Bangladesh, imports grew by more than 500% thanks to the start-up of a second FSRU, from 0.7 MT in 2018 to 4.1 MT in 2019. Imports also increased by 1.3 MT in Malaysia (+93.8%), +1.2 MT in Pakistan (+18.1%), + 0.7 MT in Singapore (+28.7%). In India, where the lack of downstream infrastructure remained a constraint, a 7% year-on-year growth of LNG imports was never-theless recorded.2019 was a record year for Europe, which expe-rienced a growth in net LNG imports of 75.6% com-
+ 14% increase in Chinese LNG imports, compared with + 38% in 2018.
34% of volumes imported on a spot or short-term basis.
of US volumes delivered to Europe, 37% to Asia, 21% to Americas.
38%
6 - GIIGNL Annual Report 2020 Edition
LNG trade in 2019
* including Yemen whose exports have been halted since 2015 due to the political unrest. ** Gibraltar started receiving LNG in 2019 but the territory was not added to the number of importing countries due to its specific status. Russia inaugurated a FSRU in Kaliningrad but it had not been importing yet at the time of this writing.
pared to 2018, reaching 85.9 MT or an increase of 37.0 MT. All LNG importing countries in Europe increased their LNG imports, the three largest im-porters being Spain (15.7 MT), followed by France (15.6 MT) and the United Kingdom (13.6 MT). The increase of volumes imported into Europe repre-sented over 90% (37 MT) of the global increase in LNG imports, with the region acting as a balancing market for the oversupplied global market. Europe was able to absorb these new additional volumes thanks to its ability to inject gas in underground gas storages and as a result of continued coal-to-gas switch in power generation.Imports into the American region decreased by 8.6% (1.5 MT), the total of LNG imports in 2019 reaching 15.7 MT, down from 17.2 MT in 2018. With 4.9 MT imported, Mexico remained the largest LNG importer in the American region, accounting for a total market share of 31%, followed by Chile (2.5 MT or 15.6%). Argentina experienced the largest decline in the region (-1.4 MT) because of the increase in domestic gas production. LNG imports into the Middle East decreased again in 2019, with deliveries falling by 23.9% (-2.2 MT). Jordan experienced a decline by almost half (-1.1 MT). In Egypt, the ramp-up of new production has allowed for a complete reduction of LNG imports.
Spot and Short-term share stable in a fast growing market
In 2019, LNG continued to commoditize but the share of spot and short-term volumes increased at a slower rate than in 2018 due to the start of seve-ral long-term contracts from the United States and Australia. Spot and short-term volumes increased by 19.7 MT (+19.8%), reaching 119 MT or 34% of total trade compared with 32% (99.3 MT) in 2018. Simi-larly to 2018, this expansion was mainly supported by the ramp-up of flexible volumes from the United States and from Australia and by the rise of LNG volumes handled by traders and portfolio players, who are seeking to optimize their portfolios and to manage volume risk by purchasing and selling LNG under more flexible conditions. The United States has become the number one ex-porter of flexible LNG, accounting for 20% of the spot and short-term volumes, followed by Austra-lia with a 16.7% market share. Despite supplying 77.8 MT to the global market, Qatar’s share of the spot and short-term market has declined to 5% from 11.7% in 2018 and 19.7% in 2017.“True” spot volumes (i.e, volumes delivered within three months from the transaction date) reached 27% of total imports in 2019 or 95 MT, compared with 25% of total imports in 2018.
Due to the convergence of European and Asian prices, arbitrage opportunities were more scarce in 2019. As a result re-exports have sharply decreased to 1.6 MT in 2019 compared to 3.8 MT in 2018. In 2019, 12 countries re-exported LNG and 20 countries received re-exported volumes. Europe accounted for 58% of the re-exported volumes (0.91 MT). As in 2017 and 2018, France retained the largest market share (39% or 0.61 MT) followed by Singapore (26% or 0.41 MT).
51%
27% of volumes imported on a spot basis.
of Russian volumes delivered to Europe, 46% to Asia, 2% to the Middle East.
GIIGNL Annual Report 2020 Edition - 7
LNG trade in 2019LNG trade in 2019

8 - GIIGNL Annual Report 2020 Edition
Contracts concluded in 2019
Contracts concluded in 2019Type Buyer Import country Seller Source
ACQ(MTPA)
Duration (years)
Start
Delivery Format
Long & Medium Term Contracts(> 4 years)
Bharat Petroleum Corporation India Mozambique LNG1 Co. Mozambique / Mozambique LNG 1.0 15 Expected
in 2024/2025
BP Gas Marketing Multiple Pacific Oil & Gas Canada / Woodfibre LNG 0.75 15 Expected in 2023 FOB
CAPCO and HK Electric Hong Kong Shell Eastern Trading Portfolio 2022 DES
Centrica / Tokyo Gas Multiple Mozambique LNG1 Co. Mozambique / Mozambique LNG 2.6 15+ Expected in 2024/2025 DES
CMA CGM Marine fuel Total Portfolio 0.27 10 2021
CNOOC Gas and Power Singapore Trading & Marketing
China Mozambique LNG1 Co. Mozambique / Mozambique LNG 1.5 13 Expected in 2024/2025
ExxonMobil, Eni, CNPC, ENH, Galp and KOGAS Multiple Mozambique Rovuma
Venture Mozambique / Rovuma LNG 15.2
GS Caltex South Korea Chevron Portfolio Oct. 2019
Guanghui Energy China Total Portfolio 0.7 10 Jun. 2020 DES
JERA / CPC Japan / Taiwan Mozambique LNG1 Co. Mozambique / Mozambique LNG 1.6 17 Expected in 2024/2025 DES
KOGAS South Korea BP US / Freeport LNG or Calcasieu Pass 1.58 15(+3) 2025
KOMIPO South Korea Petronas Portfolio 0.24 5 2020 DES
Ørsted NWE + Iberia BP Portfolio 0.39 5 Late 2020 DES
PGNiG Poland Venture Global US / Plaquemines LNG 1.5 20 Expected in 2023
Posco Multiple PT. Pertamina (Persero) Portfolio 5 Dec. 2019 FOB/DES
PT. Pertamina (Persero) Multiple Mozambique LNG1 Co. Mozambique / Mozambique LNG 1 20 Feb. 2019 DES
Republic of Benin Benin Total Portfolio 0.5 15 Jan. 2021 DES
Shell International Trading Middle East Multiple Mozambique LNG1 Co. Mozambique / Mozambique LNG 2.0 13 2024
Shell NA LNG Multiple NextDecade US / Rio Grande LNG 2.0 20 2024 FOB
Tohoku Electric JapanDiamond Gas Interna-tional, a subsidiary of Mitsubishi Corporation
US / Cameron LNG 0.2 18 Jan. 2022 DES
Tokyo Gas Japan Shell Eastern Trading Portfolio Approx. 0.5 10 Apr. 2020 DES
Total Multiple Driftwood LNG US / Driftwood LNG 1 30 Jan. 2025 FOB
Total Multiple Tellurian Marketing US / Driftwood LNG 1.5 15 Jan. 2025 FOB
Uniper Global Commodities Multiple Woodside Energy Trading Singapore Portfolio
0.5
(2021-2024) 1(2025-2034)
13 2021
Vitol Multiple Nigeria LNG Nigeria 0.5 10 2021 DES
Zhejiang Provincial Energy Group China ExxonMobil Portfolio 1.0 20
Short Term Contracts (≤ 4 yrs)
BP Multiple ADNOC LNG UAE 0.5 2 2020 FOB
Clean Energy China Shizuoka Gas Japan / Shimizu LNG Terminal in the form of ISO tank containers
1,600 tonnes 3
Top Speed Energy Corp. China FortisBC Canada / Tilbury LNG facility 53,000 tonnes 2 2020
Total Multiple ADNOC LNG UAE 0.5 2 Apr. 2020 DES
Unipec Singapore (Sinopec) PNG LNG Project co-venturers 0.45 4 2019
Type Buyer Import country Seller SourceACQ(MTPA)
Duration (years)
Start
Delivery Format
Contract Modification
DEPA SA Greece Sonatrach Algeria 0.44 1 Jan. 2019 CIF
PPT ET Singapore Pte. Ltd. Multiple PT. Pertamina (Persero) United States 0.38-0.76 3 Aug. 2019 FOB
Heads of Agreement
Aramco Services Company Multiple Port Arthur LNG USA 5.0 20 TBD FOB
Delta Offshore Energy Vietnam Magnolia LNG US / Magnolia LNG 2.0 20 FOB
ENN Group China Woodside Portfolio 1.0 10 Jan. 2025 FOB/DES
Gunvor Multiple Commonwealth LNG US / Commonwealth LNG 1.5 15
JERA MultipleDiamond Gas Interna-tional, a subsidiary of Mitsubishi Corporation
Canada / LNG Canada 1.2 15 2024 DES
Korea East-West Power South Korea Petronas Portfolio 0.6 10 2024 DES
Repsol Spain Novatek Gas & Power Asia Russia / Arctic LNG 2 & Portfolio 1.0 15 DES
Sumitomo Joint Electric Power Japan Tokyo Gas Portfolio Approx.
0.17 5 Apr. 2021 DES
Total Multiple Arctic LNG-2 Russia 1.98 20 Jul. 2023 FOB
Vitol Multiple Novatek Gas & Power Asia Russia / Arctic LNG 2 & Portfolio 1.0 15 FOB
Memorandums of Understanding Petronet LNG India Tellurian US / Driftwood 5.0
Terminal Capacity Total Freeport LNG US / Freeport LNG train 3 2.2 20 Expected in 2020
GIIGNL Annual Report 2020 Edition - 9
Contracts concluded in 2019
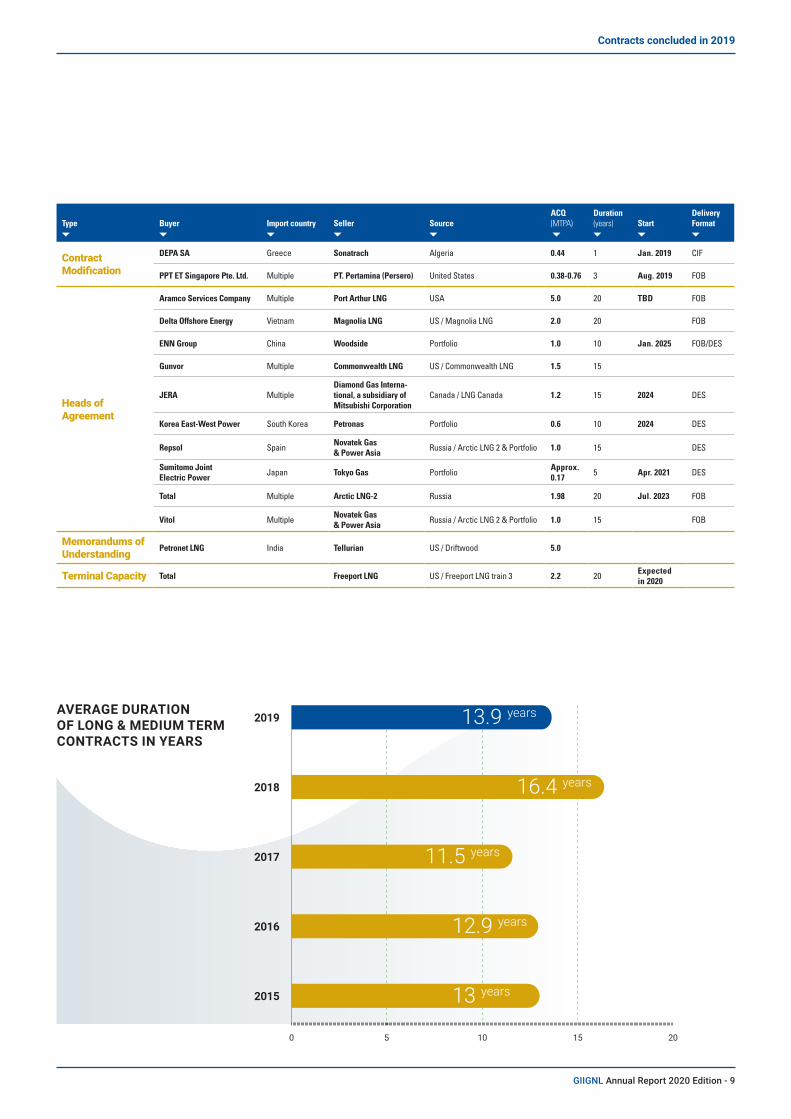
AVERAGE DURATION OF LONG & MEDIUM TERM CONTRACTS IN YEARS
0 5 10 15 20
13 years2015
12.9 years2016
11.5 years2017
16.4 years
13.9 years
2018
2019

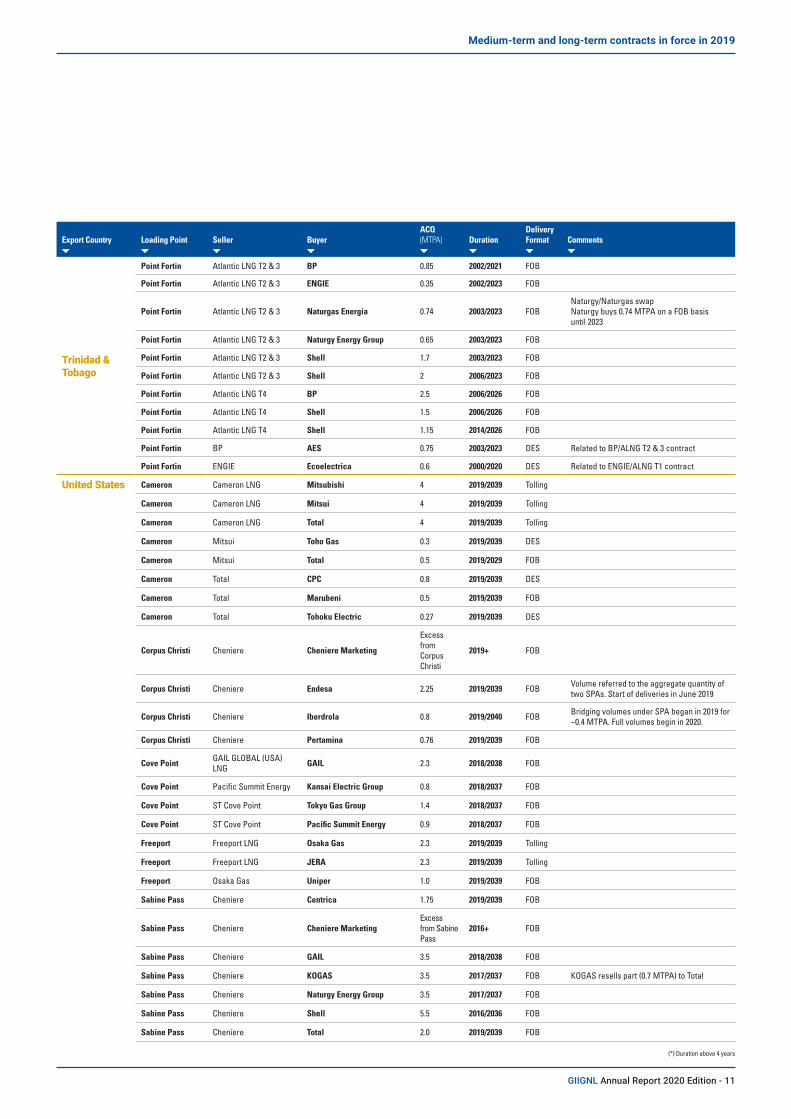
Medium-term and long-term contracts in force in 2019*
10 - GIIGNL Annual Report 2020 Edition
Medium-term and long-term contracts in force in 2019
Export Country Loading Point Seller BuyerACQ (MTPA)
Duration
Delivery Format Comments
ATLANTIC BASIN
Algeria
Skikda-Bethioua Sonatrach Botas 4 1994/2024 DES ACQ 1994 - 2014: 3.2 MTPA; 2015 - 2024: 4 MTPA
Skikda-Bethioua Sonatrach Cepsa Gas 0.77 2002/2022 DES
Skikda-Bethioua Sonatrach DEPA 0.72 2000/2021 CIF ACQ reduced to 0.44 only for 2019
Skikda-Bethioua Sonatrach Enel 0.15 1999/2022 DES Delivery under the «GDF SUEZ / Enel» swap agreement
Skikda-Bethioua Sonatrach Endesa 0.3 2000/2019 DES
Skikda-Bethioua Sonatrach Total 1.5 1972/2020 DES
Skikda-Bethioua Sonatrach Total 2.5 1972/2020 DES
Cameroon Kribi SNH Gazprom 1.2 2018/2026 FOB
Egypt
Damietta SEGAS BP 1 2005/2025 FOB
Damietta SEGAS Union Fenosa Gas 3 2005/2030 FOB
Idku ELNG T1 Total 3.6 2005/2025 FOB
Idku ELNG T2 Shell 3.6 2006/2026 FOB
Equatorial Guinea Punta Europa EGLNG Shell 3.4 2007/2024 FOB
Nigeria
Bonny Island Nigeria LNG T1 & 2 Botas 0.91 1999/2021 DES
Bonny Island Nigeria LNG T1 & 2 Enel 2.65 1999/2021 DES
Bonny Island Nigeria LNG T1 & 2 Galp Energia 0.26 2000/2020 DES
Bonny Island Nigeria LNG T1 & 2 Naturgy Energy Group 1.17 1999/2021 DES
Bonny Island Nigeria LNG T1 & 2 Total 0.33 1999/2021 DES
Bonny Island Nigeria LNG T3 Galp Energia 0.73 2003/2023 DES
Bonny Island Nigeria LNG T3 Naturgy Energy Group 1.99 2002/2024 DES
Bonny Island Nigeria LNG T4 & 5 Endesa 0.75 2006/2026 DES
Bonny Island Nigeria LNG T4 & 5 ENI 1.15 2006/2026 DES
Bonny Island Nigeria LNG T4 & 5 Galp Energia 1.42 2006/2026 DES
Bonny Island Nigeria LNG T4 & 5 Pavilion Energy 0.38 2006/2026 DES
Bonny Island Nigeria LNG T4 & 5 Shell 2.3 2006/2026 DES
Bonny Island Nigeria LNG T4 & 5 Shell 1.13 2006/2026 DES
Bonny Island Nigeria LNG T4 & 5 Total 0.23 2006/2029 DES
Bonny Island Nigeria LNG T6 Shell 3.1 2008/2027 DES
Bonny Island Nigeria LNG T6 Total 0.9 2008/2029 DES
Norway
Hammerfest Equinor Equinor 1.75 2007/2021 DES
Hammerfest Equinor Iberdrola 1.13 2006/2025 DES From 2020 under Pavilion Energy Portfolio
Hammerfest Neptune Energy Total 0.5 2007/ depletion FOB
Hammerfest Total Total 0.7 2007/ depletion FOB
Hammerfest - RWE Supply & Trading 0.06-0.12 2010 depletion FOB
Russia Sabetta Yamal LNG CNPC 3 2018/2038 DES
Sabetta Yamal LNG Gazprom Marketing & Trading 2.9 2018/2038 FOB
Sabetta Yamal LNG Naturgy Energy Group 2.5 2018/2038 DES
Sabetta Yamal LNG Novatek 2.5 2018/2038 FOB
Sabetta Yamal LNG Total 4 2018/2032 FOB
(*) Duration above 4 years
Medium-term and long-term contracts in force in 2019*
GIIGNL Annual Report 2020 Edition - 11
Medium-term and long-term contracts in force in 2019
Export Country Loading Point Seller BuyerACQ (MTPA)
Duration
Delivery Format Comments
Trinidad & Tobago
Point Fortin Atlantic LNG T2 & 3 BP 0.85 2002/2021 FOB
Point Fortin Atlantic LNG T2 & 3 ENGIE 0.35 2002/2023 FOB
Point Fortin Atlantic LNG T2 & 3 Naturgas Energia 0.74 2003/2023 FOBNaturgy/Naturgas swap Naturgy buys 0.74 MTPA on a FOB basis until 2023
Point Fortin Atlantic LNG T2 & 3 Naturgy Energy Group 0.65 2003/2023 FOB
Point Fortin Atlantic LNG T2 & 3 Shell 1.7 2003/2023 FOB
Point Fortin Atlantic LNG T2 & 3 Shell 2 2006/2023 FOB
Point Fortin Atlantic LNG T4 BP 2.5 2006/2026 FOB
Point Fortin Atlantic LNG T4 Shell 1.5 2006/2026 FOB
Point Fortin Atlantic LNG T4 Shell 1.15 2014/2026 FOB
Point Fortin BP AES 0.75 2003/2023 DES Related to BP/ALNG T2 & 3 contract
Point Fortin ENGIE Ecoelectrica 0.6 2000/2020 DES Related to ENGIE/ALNG T1 contract
United States Cameron Cameron LNG Mitsubishi 4 2019/2039 Tolling
Cameron Cameron LNG Mitsui 4 2019/2039 Tolling
Cameron Cameron LNG Total 4 2019/2039 Tolling
Cameron Mitsui Toho Gas 0.3 2019/2039 DES
Cameron Mitsui Total 0.5 2019/2029 FOB
Cameron Total CPC 0.8 2019/2039 DES
Cameron Total Marubeni 0.5 2019/2039 FOB
Cameron Total Tohoku Electric 0.27 2019/2039 DES
Corpus Christi Cheniere Cheniere Marketing
Excess from Corpus Christi
2019+ FOB
Corpus Christi Cheniere Endesa 2.25 2019/2039 FOB Volume referred to the aggregate quantity of two SPAs. Start of deliveries in June 2019
Corpus Christi Cheniere Iberdrola 0.8 2019/2040 FOB Bridging volumes under SPA began in 2019 for ~0.4 MTPA. Full volumes begin in 2020.
Corpus Christi Cheniere Pertamina 0.76 2019/2039 FOB
Cove Point GAIL GLOBAL (USA) LNG GAIL 2.3 2018/2038 FOB
Cove Point Pacific Summit Energy Kansai Electric Group 0.8 2018/2037 FOB
Cove Point ST Cove Point Tokyo Gas Group 1.4 2018/2037 FOB
Cove Point ST Cove Point Pacific Summit Energy 0.9 2018/2037 FOB
Freeport Freeport LNG Osaka Gas 2.3 2019/2039 Tolling
Freeport Freeport LNG JERA 2.3 2019/2039 Tolling
Freeport Osaka Gas Uniper 1.0 2019/2039 FOB
Sabine Pass Cheniere Centrica 1.75 2019/2039 FOB
Sabine Pass Cheniere Cheniere MarketingExcess from Sabine Pass
2016+ FOB
Sabine Pass Cheniere GAIL 3.5 2018/2038 FOB
Sabine Pass Cheniere KOGAS 3.5 2017/2037 FOB KOGAS resells part (0.7 MTPA) to Total
Sabine Pass Cheniere Naturgy Energy Group 3.5 2017/2037 FOB
Sabine Pass Cheniere Shell 5.5 2016/2036 FOB
Sabine Pass Cheniere Total 2.0 2019/2039 FOB
(*) Duration above 4 years

Medium-term and long-term contracts in force in 2019*
12 - GIIGNL Annual Report 2020 Edition
Medium-term and long-term contracts in force in 2019
Export Country Loading Point Seller BuyerACQ (MTPA)
Duration
Delivery Format Comments
MIDDLE EAST
Oman
Qalhat Oman LNG BP 1.13 2018/2024 FOB
Qalhat Oman LNG Itochu 0.7 2006/2025 FOB
Qalhat Oman LNG KOGAS 4.06 2000/2024 FOB
Qalhat Oman LNG Osaka Gas 0.66 2000/2024 FOB
Qalhat Qalhat LNG Mitsubishi 0.8 2006/2020 FOB
Qalhat Qalhat LNG Osaka Gas 0.8 2009/2026 FOB
Qalhat Qalhat LNG Union Fenosa Gas 1.65 2006/2025 DES
Qatar
Ras Laffan Qatargas I
Chugoku Electric, JERA, Kansai Electric, Osaka Gas, Toho Gas, Tohoku Electric, Tokyo Gas
2 1998/2021 DES
Ras Laffan Qatargas I JERA 4 1997/2021 DES
Ras Laffan Qatargas I JERA 1 2012/2021 DES
Ras Laffan Qatargas I Naturgy Energy Group 0.75 2005/2024 DES
Ras Laffan Qatargas I Naturgy Energy Group 0.75 2006/2025 FOB
Ras Laffan Qatargas I Shizuoka Gas 0.2 2016/2021 DES Tripartite SPA (Qatar Liquefied Gas, JERA and Shizuoka Gas)
Ras Laffan Qatargas II T1 Pakistan State Oil 3.75 2016/2031 DES
Ras Laffan Qatargas II T1/T2 Petrochina 3.4 2018/2040 DES
Ras Laffan Qatargas II T2 Total 1.85 2009/2034 DES
Ras Laffan Qatargas II T2 Total 1.5 2009/2034 DES
Ras Laffan Qatargas II T2 Total 1.85 2009/2034 DES
Ras Laffan Qatargas III CNOOC 2 2011/2035 DES
Ras Laffan Qatargas III JERA 0.7 2013/2028 DES
Ras Laffan Qatargas III Kansai Electric 0.5 2013/2027 DES
Ras Laffan Qatargas III PGNiG 1.1 2015/2034 DES
Ras Laffan Qatargas III PGNiG 0.9 2018/2034 DES
Ras Laffan Qatargas III PTT 2 2015/2029 DES
Ras Laffan Qatargas III RWE Supply & Trading 1.1 2016/2023 DES
Ras Laffan Qatargas III Tohoku Electric 0.06-0.09 2016/2030 DES
Ras Laffan Qatargas IV Centrica 3 2014/2023 DES
Extension of the previous 4 and a half years contract Nominal quantity (ACQ) 2014/2018: 3 MTPA; 2019/2023: 2 MTPA
Ras Laffan Qatargas IV Marubeni 1 2011/2031 DES
Ras Laffan Qatargas IV Petrochina 3 2011/2036 DES
Ras Laffan Qatargas IV Petronas 1.14 2014/2023 DESExtension of the previous 5 years contract Nominal quantity (ACQ) 2014/2018: 1.14 MTPA; 2019/2023: 1.1 MTPA
Ras Laffan Qatargas IV Shell Up to 1.1 2019/2023 DES
Ras Laffan RasGas I Endesa 0.75 2005/2025 DES
Ras Laffan RasGas I KOGAS 4.92 1999/2024 FOB
Ras Laffan RasGas II T1 Petronet LNG 5 2004/2028 FOB
Ras Laffan RasGas II T2 Edison 4.6 2009/2034 DES
Ras Laffan RasGas II T3 CPC 3 2008/2032 FOB
Ras Laffan RasGas II T3 EDF Trading 3.4 2007/2027 DES Extended to 2027
Ras Laffan RasGas II T3 ENI 2.05 2007/2027 DES/FOB Former Distrigas contract
Ras Laffan RasGas III T1 EDF Trading Up to 2 2017/2021 DES
Ras Laffan RasGas III T1 KOGAS 2.1 2007/2026 DES
Ras Laffan RasGas III T1 Petronet LNG 2.5 2009/2028 FOB
(*) Duration above 4 years
GIIGNL Annual Report 2020 Edition - 13
Medium-term and long-term contracts in force in 2019
Export Country Loading Point Seller BuyerACQ (MTPA)
Duration
Delivery Format Comments
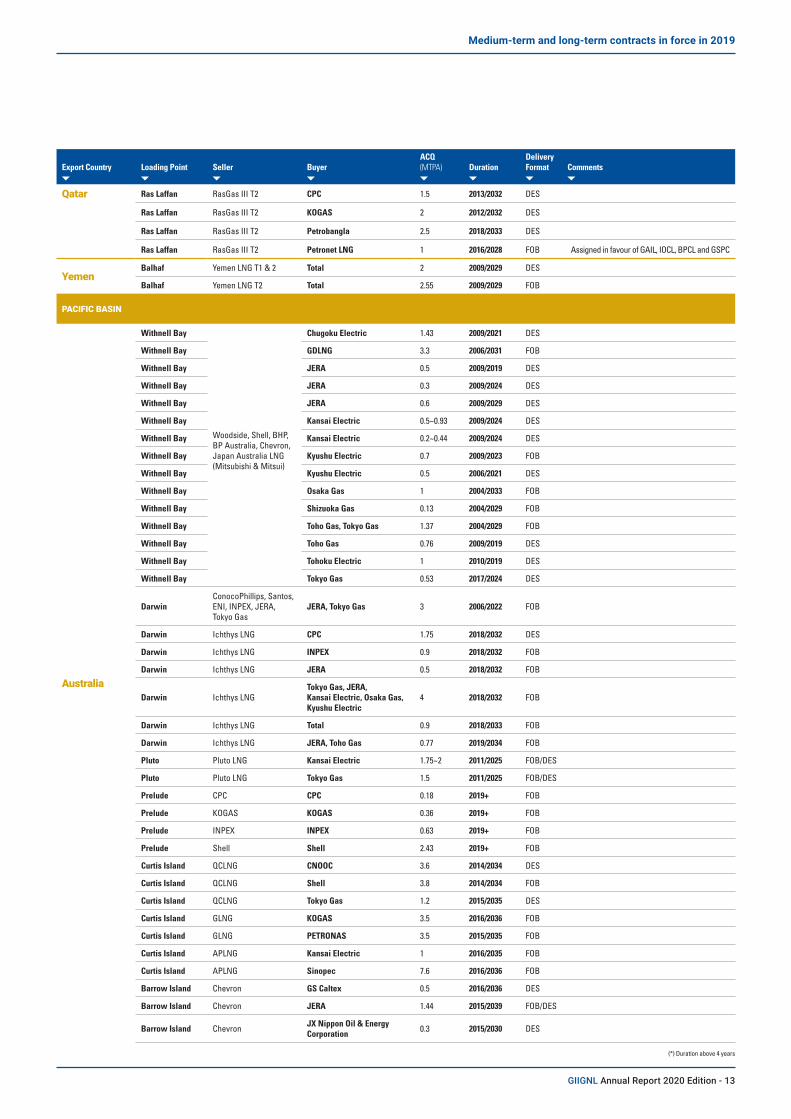
Qatar Ras Laffan RasGas III T2 CPC 1.5 2013/2032 DES
Ras Laffan RasGas III T2 KOGAS 2 2012/2032 DES
Ras Laffan RasGas III T2 Petrobangla 2.5 2018/2033 DES
Ras Laffan RasGas III T2 Petronet LNG 1 2016/2028 FOB Assigned in favour of GAIL, IOCL, BPCL and GSPC
YemenBalhaf Yemen LNG T1 & 2 Total 2 2009/2029 DES
Balhaf Yemen LNG T2 Total 2.55 2009/2029 FOB
PACIFIC BASIN
Australia
Withnell Bay
Woodside, Shell, BHP, BP Australia, Chevron, Japan Australia LNG (Mitsubishi & Mitsui)
Chugoku Electric 1.43 2009/2021 DES
Withnell Bay GDLNG 3.3 2006/2031 FOB
Withnell Bay JERA 0.5 2009/2019 DES
Withnell Bay JERA 0.3 2009/2024 DES
Withnell Bay JERA 0.6 2009/2029 DES
Withnell Bay Kansai Electric 0.5~0.93 2009/2024 DES
Withnell Bay Kansai Electric 0.2~0.44 2009/2024 DES
Withnell Bay Kyushu Electric 0.7 2009/2023 FOB
Withnell Bay Kyushu Electric 0.5 2006/2021 DES
Withnell Bay Osaka Gas 1 2004/2033 FOB
Withnell Bay Shizuoka Gas 0.13 2004/2029 FOB
Withnell Bay Toho Gas, Tokyo Gas 1.37 2004/2029 FOB
Withnell Bay Toho Gas 0.76 2009/2019 DES
Withnell Bay Tohoku Electric 1 2010/2019 DES
Withnell Bay Tokyo Gas 0.53 2017/2024 DES
DarwinConocoPhillips, Santos, ENI, INPEX, JERA, Tokyo Gas
JERA, Tokyo Gas 3 2006/2022 FOB
Darwin Ichthys LNG CPC 1.75 2018/2032 DES
Darwin Ichthys LNG INPEX 0.9 2018/2032 FOB
Darwin Ichthys LNG JERA 0.5 2018/2032 FOB
Darwin Ichthys LNGTokyo Gas, JERA, Kansai Electric, Osaka Gas, Kyushu Electric
4 2018/2032 FOB
Darwin Ichthys LNG Total 0.9 2018/2033 FOB
Darwin Ichthys LNG JERA, Toho Gas 0.77 2019/2034 FOB
Pluto Pluto LNG Kansai Electric 1.75~2 2011/2025 FOB/DES
Pluto Pluto LNG Tokyo Gas 1.5 2011/2025 FOB/DES
Prelude CPC CPC 0.18 2019+ FOB
Prelude KOGAS KOGAS 0.36 2019+ FOB
Prelude INPEX INPEX 0.63 2019+ FOB
Prelude Shell Shell 2.43 2019+ FOB
Curtis Island QCLNG CNOOC 3.6 2014/2034 DES
Curtis Island QCLNG Shell 3.8 2014/2034 FOB
Curtis Island QCLNG Tokyo Gas 1.2 2015/2035 DES
Curtis Island GLNG KOGAS 3.5 2016/2036 FOB
Curtis Island GLNG PETRONAS 3.5 2015/2035 FOB
Curtis Island APLNG Kansai Electric 1 2016/2035 FOB
Curtis Island APLNG Sinopec 7.6 2016/2036 FOB
Barrow Island Chevron GS Caltex 0.5 2016/2036 DES
Barrow Island Chevron JERA 1.44 2015/2039 FOB/DES
Barrow Island Chevron JX Nippon Oil & Energy Corporation 0.3 2015/2030 DES
(*) Duration above 4 years

Medium-term and long-term contracts in force in 2019*
14 - GIIGNL Annual Report 2020 Edition
Medium-term and long-term contracts in force in 2019
Export Country Loading Point Seller BuyerACQ (MTPA)
Duration
Delivery Format Comments
Australia
Barrow Island Chevron Kyushu Electric 0.3 2015/2029 DES
Barrow Island Chevron Osaka Gas 1.375 + 0.1875 2014/2039 FOB
Barrow Island Chevron SK Group 0.83 2017/2021 FOB SK will receive 4.15 MTPA of LNG over a five-year period starting in 2017
Barrow Island Chevron Tokyo Gas 1.1 + 0.15 2014/2039 FOB
Barrow Island ExxonMobil Petrochina 2.25 2016/2036 DES
Barrow Island ExxonMobil Petronet LNG 1.4 2016/2036 DES
Barrow Island Shell BP 0.5 2016/2036 FOB
Ashburton North Chevron, Kufpec, Woodside JERA 2.2 2017/2036 DES
Total ACQ (DES) 2017~2018: 1.7 MTPA 2018~2027: 3.3 MTPA
Ashburton North Chevron, Kufpec, Woodside JERA 0.9 2017/2036 FOB
Ashburton North Chevron, Kufpec, Woodside JERA 0.4 2017/2036 DES
(Equity+Inc.)
Ashburton North Chevron, Kufpec, Woodside JERA 0.7 2017/2036 FOB
Nominal quantity (ACQ) 2018: 0.4 MTPA; 2019: 0.7 MTPA; 2020: 0.8 MTPA; 2021~: 1 MTPA
Ashburton North Chevron, Kufpec, Woodside Kyushu Electric 0.70 + 0.13 2017/2036 FOB
Ashburton North Chevron, Kufpec, Woodside Tohoku Electric 0.92 2017/2036 DES
Ashburton North PE Wheatstone JERA 0.7 2017/2036 DESNominal quantity (ACQ) 2017~2018: 0.5 MTPA 2018~2027: 0.7 MTPA
Brunei
Lumut Brunei LNG JERA, Osaka Gas, Tokyo Gas 3.4 2013/2023 DES
Lumut Brunei LNG Petronas 0.9 2013/2023 DES
Lumut Brunei LNG Shell 0.8 2013/2023 FOB
Indonesia
Bontang Pertamina, ENI Muara bakau ENI 1 2017/2027 FOB Nominal quantity (ACQ)
2011-2015: 3 MTPA; 2016-2020: 2 MTPA
Bontang Pertamina, ENI Muara bakau Pertamina 1.4 2017/2024 FOB
Bontang Pertamina, IDD Bangka Pertamina Various 2016/2021 FOB 2019: 0.29 MTPA;
2020: 0.06 MTPA; 2021: 0.06 MTPA
Bontang Pertamina
JERA, Kansai Electric, Kyushu Electric, Nippon Steel Corporation, Osaka Gas, Toho Gas
2 2011/2020 DES/FOB
Bontang Pertamina Nusantara Regas Various 2012/2022 FOB 2016-2020: 1 MTPA; 2021-2022: 0.8 MTPA
Bontang Pertamina PPT ETS 0.8 2019/2025 FOB
Donggi-Senoro PT Donggi-Senoro LNG JERA 1 2015/2027 DES
Donggi-Senoro PT Donggi-Senoro LNG KOGAS 0.7 2015/2027 FOB
Donggi-Senoro PT Donggi-Senoro LNG Kyushu Electric 0.3 2015/2028 DES
Tangguh Tangguh PSC Contractor Parties CNOOC 2.6 2009/2033 FOB
Tangguh Tangguh PSC Contractor Parties Kansai Electric 1 2014/2035 DES
Tangguh Tangguh PSC Contractor Parties PLN 1.5 2015/2033 DES
Tangguh Tangguh PSC Contractor Parties Posco 0.55 2005/2024 DES
Tangguh Tangguh PSC Contractor Parties Sempra LNG 3.7 2008/2029 DES 3.4 MTPA divertible
Tangguh Tangguh PSC Contractor Parties SK E&S 0.6 2006/2026 DES
Tangguh Tangguh PSC Contractor Parties Tohoku Electric 0.12 2010/2024 DES
(*) Duration above 4 years

GIIGNL Annual Report 2020 Edition - 15
Medium-term and long-term contracts in force in 2019
Export Country Loading Point Seller BuyerACQ (MTPA)
Duration
Delivery Format Comments
Malaysia
Bintulu Malaysia LNG Satu Hiroshima Gas 0.1 2016/2026 FOB
Bintulu Malaysia LNG Satu Saibu Gas 0.45 2014/2028 DES/FOB
Bintulu Malaysia LNG Satu Shikoku Electric 0.36 2010/2025 DES
Bintulu Malaysia LNG Dua CPC 2 2015/2020 DES
Bintulu Malaysia LNG Dua Gas Bureau, City of Sendai 0.16 2018/2027 DES
Bintulu Malaysia LNG Dua JERA 0.4 2011/2031 DES
Bintulu Malaysia LNG Dua JX Nippon Oil & Energy Corporation 0.38 2015/2025 DES
Bintulu Malaysia LNG Dua Shizuoka Gas 0.33 2016/2025 DES
Bintulu Malaysia LNG Dua Tohoku Electric 0.37 2016/2026 DES
Bintulu Malaysia LNG Dua Tokyo Gas 0.9 2015/2025 DES
Bintulu Malaysia LNG Tiga CNOOC 3 2009/2029 DES
Bintulu Malaysia LNG Tiga Japan Petroleum Exploration Co. 0.48 2002/2021 DES
Bintulu Malaysia LNG Tiga KOGAS 2 2008/2028 DES
Bintulu Malaysia LNG Tiga Osaka Gas, Toho Gas, Tokyo Gas 0.8 2004/2024 DES/FOB Up to 1.6 MTPA
Bintulu Malaysia LNG Tiga Toho Gas 0.52 2007/2027 DES
Bintulu Malaysia LNG Tiga Tohoku Electric 0.5 2005/2025 DES
Bintulu Malaysia LNG Osaka Gas 0.8 2009/2023 DES
Bintulu Malaysia LNG Tokyo Gas 0.5 2018/2031 FOB/DESNominal quantity (ACQ) 2018-2023: up to 0.5 MTPA; 2024-2031: up to 0.9 MTPA
Bintulu Malaysia LNG Hokuriku Electric 0.4 2018/2028 DES
Papua New Guinea
Port Moresby PNG LNG CPC 1.2 2014/2033 DES
Port Moresby PNG LNG JERA 1.8 2014/2034 DES/FOB
Port Moresby PNG LNG Osaka Gas 1.5 2014/2034 DES/FOB
Port Moresby PNG LNG Sinopec 2 2014/2034 DES
Peru Pamba Melchorita Peru LNG Shell 4.2 2014/2028 FOB
Russia
Prigorodnoye Sakhalin Energy Investment CPC 0.75 2017/2022 DES
Prigorodnoye Sakhalin Energy Investment Gazprom Global LNG 1 2009/2028 DES
Prigorodnoye Sakhalin Energy Investment Hiroshima Gas 0.21 2008/2028 FOB
Prigorodnoye Sakhalin Energy Investment JERA 1.5 2009/2029 FOB
Prigorodnoye Sakhalin Energy Investment JERA 0.5 2011/2026 DES
Prigorodnoye Sakhalin Energy Investment KOGAS 1.5 2008/2028 FOB
Prigorodnoye Sakhalin Energy Investment Kyushu Electric 0.5 2009/2031 DES
Prigorodnoye Sakhalin Energy Investment Osaka Gas 0.2 2008/2031 FOB
Prigorodnoye Sakhalin Energy Investment Saibu Gas 0.065 2014/2027 DES
Prigorodnoye Sakhalin Energy Investment Shell 1 2009/2028 DES
Prigorodnoye Sakhalin Energy Investment Toho Gas 0.5 2009/2033 DES
Prigorodnoye Sakhalin Energy Investment Tohoku Electric 0.42 2010/2030 FOB
Prigorodnoye Sakhalin Energy Investment Tokyo Gas 1.1 2007/2031 FOB
(*) Duration above 4 years

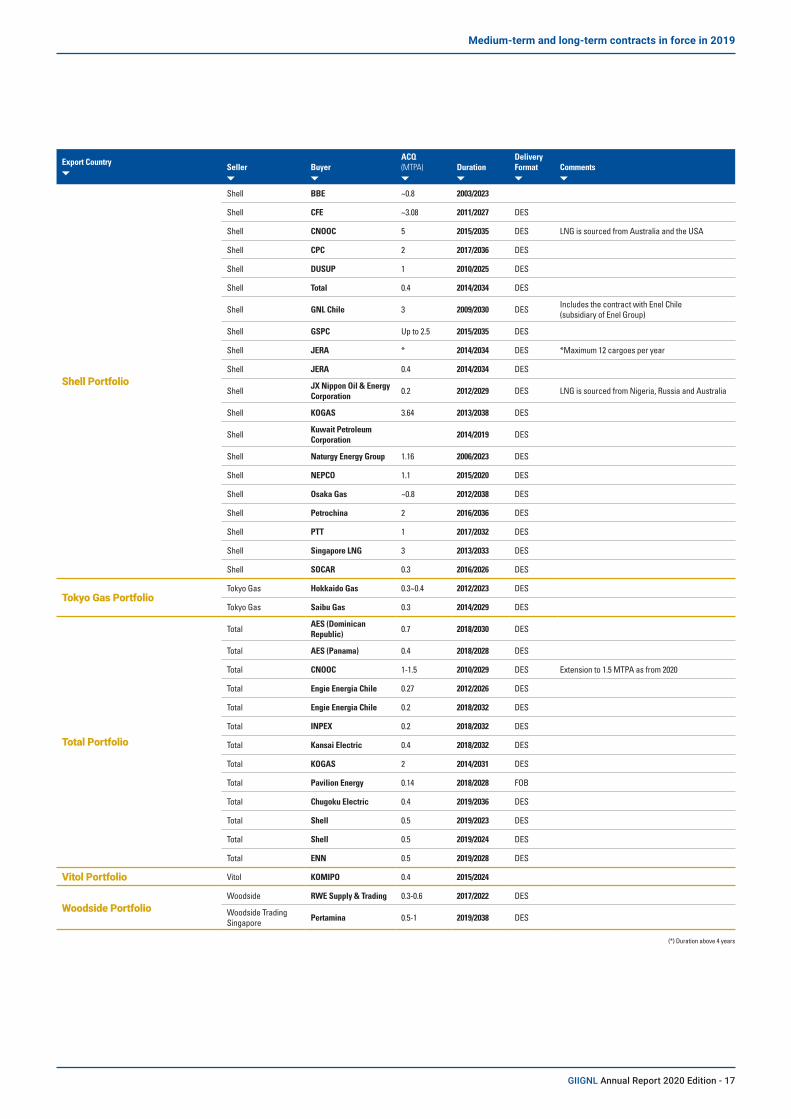
Portfolio contracts
16 - GIIGNL Annual Report 2020 Edition
Medium-term and long-term contracts in force in 2019
Export Country Seller BuyerACQ (MTPA) Duration
Delivery Format Comments
BP Portfolio
BP CPC 0.7 2017/2021 DES
BP JERA 8 2014/2028 DES
BP Kansai Electric 0.5 2017/2031 DES
BP Kansai Electric ※* 2015/2038 DES * Total maximum quantity of LNG during contract duration: approx 13 MT
BP Kuwait Petroleum Corporation 0.5 2014/2020 DES
BP PTT 1 2017/2037 DES
BP Pavilion Energy 0.4 2020-2040 DES/FOB
Centrica Portfolio Centrica PGNiG Up to 9 cargoes 2018/2023 DES
Cheniere Portfolio
Cheniere PetroChina 1.2 2018/2043 N/ATwo SPAs with an aggregate volume of ~1.2 MTPA. A portion began in 2018. The balance will begin in 2023. Both continue through to 2043.
Cheniere PGNiG 1.45 2019/2043 DES
Cheniere Trafigura 1 2019/2034 FOB
Cheniere Vitol 0.7 2018/2033 FOB
Chevron Portfolio
Chevron CPC 1.12 2017/2022 DES
Chevron JOVO 0.5 2018/2023 DES
Chevron Pertamina 0.2 2016/2022 FOB
ENI Portfolio
ENI Pavilion Energy 0.5 2012/2025 DES Pavilion Energy novation of Iberdrola contract
ENI Pakistan LNG Limited 0.75 2017/2032 DES
ENI Uniper 0.58 2007/2022 DES
Equinor Portfolio Equinor Litgas 0.256 2015/2025 DES
GAIL Portfolio GAIL Shell 0.5 2018/2022 FOB LNG is sourced from Sabine Pass
Gazprom PortfolioGazprom EGAS
35 cargoes during 5 years
2015/2020
Gazprom GAIL 2.5 2018/2041
Gunvor Portfolio Gunvor Pakistan LNG Limited 12 cargoes per year 2017/2022 DES 60 cargoes in total - New MT contract
Iberdrola PortfolioIberdrola BP 0.38 2012/2021 From 2020 under Pavilion Energy
Iberdrola Ørsted 0.72 2011/2021 DES From 2020 under Pavilion Energy
JERA PortfolioJERA INPEX * 2013/2024 DES * Total quantity of LNG during contract duration:
17 cargoes
JERA Shizuoka Gas 0.26 2014/2032 DES
Kansai Electric Portfolio Kansai Electric Total 0.4 2018/2023 FOB LNG is sourced from Cove Point
Kyushu Electric Portfolio Kyushu Electric Nippon Gas 0.05 2016/2031 DES
Mitsui Portfolio Mitsui Hokkaido Gas 3 cargoes per year 2019/2028 DES
Naturgy Portfolio
Naturgy Energy Group BHP Billiton 0.5 2016/2021 DES
Naturgy Energy Group Endesa 0.75 2016/2036 DES
Naturgy Energy Group Repsol 0.7 2016/2036 FOB
Novatek Portfolio
Novatek Gunvor 2018/2038 FOB
Novatek Shell 0.9 2018/2038 FOB
Novatek Total 1 2018/2040 DES
Osaka Gas Portfolio
Osaka Gas Hiroshima Gas 0.05※0.13 2016/2031 DES
Osaka Gas Nippon Gas 0.08 2006/2026 DES
Osaka Gas Shizuoka Gas 0.3 2015/2034 DES
Petronas LNG JOVO 0.5 2016/2023 DES
Petronas Portfolio Petronas LNG PTT 1.2 2017/2031 DES
Petronas LNG Toho Gas 0.42~0.54 2017/2027 DES
(*) Duration above 4 years
GIIGNL Annual Report 2020 Edition - 17
Medium-term and long-term contracts in force in 2019
Export Country Seller BuyerACQ (MTPA) Duration
Delivery Format Comments
Shell Portfolio
Shell BBE ~0.8 2003/2023
Shell CFE ~3.08 2011/2027 DES
Shell CNOOC 5 2015/2035 DES LNG is sourced from Australia and the USA
Shell CPC 2 2017/2036 DES
Shell DUSUP 1 2010/2025 DES
Shell Total 0.4 2014/2034 DES
Shell GNL Chile 3 2009/2030 DES Includes the contract with Enel Chile (subsidiary of Enel Group)
Shell GSPC Up to 2.5 2015/2035 DES
Shell JERA * 2014/2034 DES *Maximum 12 cargoes per year
Shell JERA 0.4 2014/2034 DES
Shell JX Nippon Oil & Energy Corporation 0.2 2012/2029 DES LNG is sourced from Nigeria, Russia and Australia
Shell KOGAS 3.64 2013/2038 DES
Shell Kuwait Petroleum Corporation 2014/2019 DES
Shell Naturgy Energy Group 1.16 2006/2023 DES
Shell NEPCO 1.1 2015/2020 DES
Shell Osaka Gas ~0.8 2012/2038 DES
Shell Petrochina 2 2016/2036 DES
Shell PTT 1 2017/2032 DES
Shell Singapore LNG 3 2013/2033 DES
Shell SOCAR 0.3 2016/2026 DES
Tokyo Gas PortfolioTokyo Gas Hokkaido Gas 0.3~0.4 2012/2023 DES
Tokyo Gas Saibu Gas 0.3 2014/2029 DES
Total Portfolio
Total AES (Dominican Republic) 0.7 2018/2030 DES
Total AES (Panama) 0.4 2018/2028 DES
Total CNOOC 1-1.5 2010/2029 DES Extension to 1.5 MTPA as from 2020
Total Engie Energia Chile 0.27 2012/2026 DES
Total Engie Energia Chile 0.2 2018/2032 DES
Total INPEX 0.2 2018/2032 DES
Total Kansai Electric 0.4 2018/2032 DES
Total KOGAS 2 2014/2031 DES
Total Pavilion Energy 0.14 2018/2028 FOB
Total Chugoku Electric 0.4 2019/2036 DES
Total Shell 0.5 2019/2023 DES
Total Shell 0.5 2019/2024 DES
Total ENN 0.5 2019/2028 DES
Vitol Portfolio Vitol KOMIPO 0.4 2015/2024
Woodside PortfolioWoodside RWE Supply & Trading 0.3-0.6 2017/2022 DES
Woodside Trading Singapore Pertamina 0.5-1 2019/2038 DES
(*) Duration above 4 years
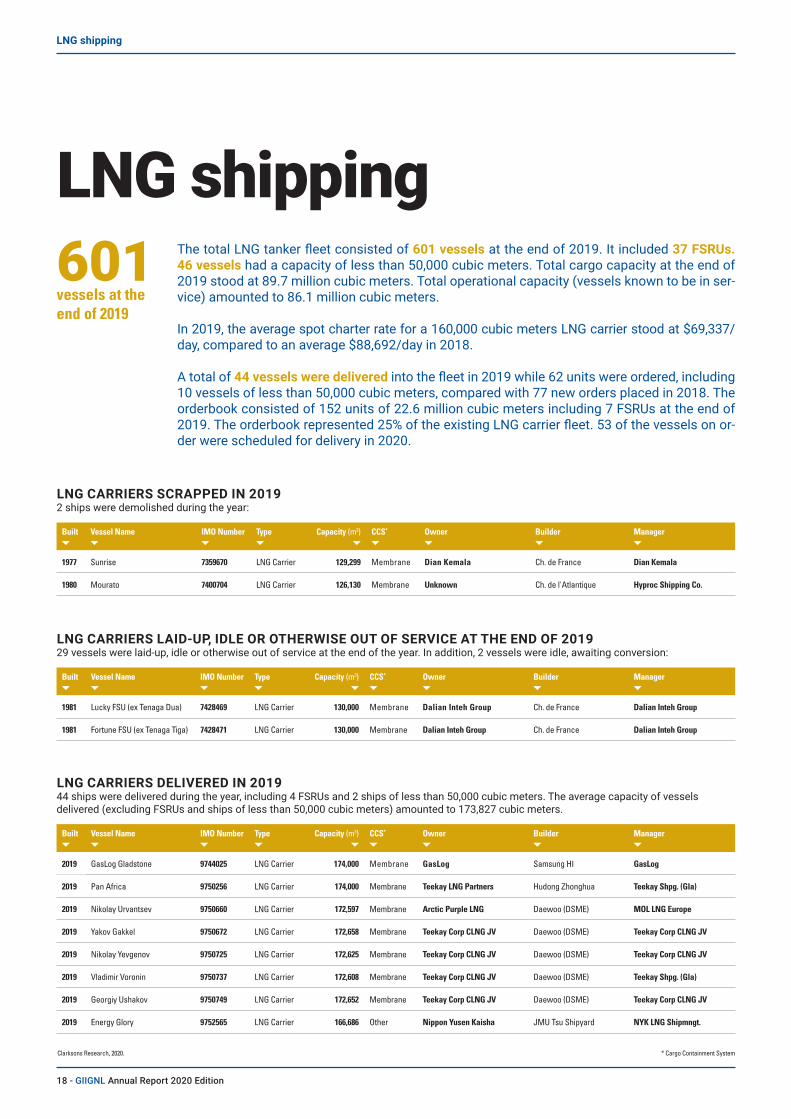
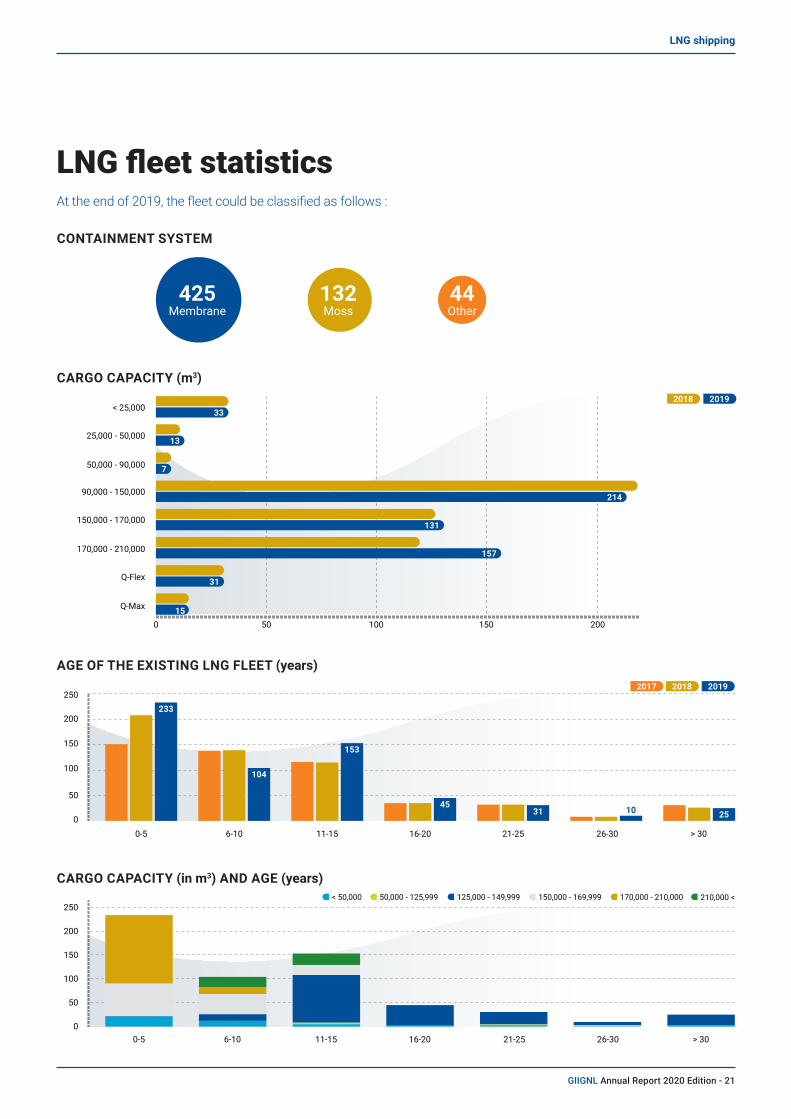
LNG shippingThe total LNG tanker fleet consisted of 601 vessels at the end of 2019. It included 37 FSRUs. 46 vessels had a capacity of less than 50,000 cubic meters. Total cargo capacity at the end of 2019 stood at 89.7 million cubic meters. Total operational capacity (vessels known to be in ser-vice) amounted to 86.1 million cubic meters.
In 2019, the average spot charter rate for a 160,000 cubic meters LNG carrier stood at $69,337/day, compared to an average $88,692/day in 2018.
A total of 44 vessels were delivered into the fleet in 2019 while 62 units were ordered, including 10 vessels of less than 50,000 cubic meters, compared with 77 new orders placed in 2018. The orderbook consisted of 152 units of 22.6 million cubic meters including 7 FSRUs at the end of 2019. The orderbook represented 25% of the existing LNG carrier fleet. 53 of the vessels on or-der were scheduled for delivery in 2020.
601 vessels at the end of 2019
Built Vessel Name IMO Number Type Capacity (m3) CCS* Owner Builder Manager
1977 Sunrise 7359670 LNG Carrier 129,299 Membrane Dian Kemala Ch. de France Dian Kemala
1980 Mourato 7400704 LNG Carrier 126,130 Membrane Unknown Ch. de l'Atlantique Hyproc Shipping Co.
Built Vessel Name IMO Number Type Capacity (m3) CCS* Owner Builder Manager
1981 Lucky FSU (ex Tenaga Dua) 7428469 LNG Carrier 130,000 Membrane Dalian Inteh Group Ch. de France Dalian Inteh Group
1981 Fortune FSU (ex Tenaga Tiga) 7428471 LNG Carrier 130,000 Membrane Dalian Inteh Group Ch. de France Dalian Inteh Group
Built Vessel Name IMO Number Type Capacity (m3) CCS* Owner Builder Manager
2019 GasLog Gladstone 9744025 LNG Carrier 174,000 Membrane GasLog Samsung HI GasLog
2019 Pan Africa 9750256 LNG Carrier 174,000 Membrane Teekay LNG Partners Hudong Zhonghua Teekay Shpg. (Gla)
2019 Nikolay Urvantsev 9750660 LNG Carrier 172,597 Membrane Arctic Purple LNG Daewoo (DSME) MOL LNG Europe
2019 Yakov Gakkel 9750672 LNG Carrier 172,658 Membrane Teekay Corp CLNG JV Daewoo (DSME) Teekay Corp CLNG JV
2019 Nikolay Yevgenov 9750725 LNG Carrier 172,625 Membrane Teekay Corp CLNG JV Daewoo (DSME) Teekay Corp CLNG JV
2019 Vladimir Voronin 9750737 LNG Carrier 172,608 Membrane Teekay Corp CLNG JV Daewoo (DSME) Teekay Shpg. (Gla)
2019 Georgiy Ushakov 9750749 LNG Carrier 172,652 Membrane Teekay Corp CLNG JV Daewoo (DSME) Teekay Corp CLNG JV
2019 Energy Glory 9752565 LNG Carrier 166,686 Other Nippon Yusen Kaisha JMU Tsu Shipyard NYK LNG Shipmngt.
LNG CARRIERS SCRAPPED IN 2019 2 ships were demolished during the year:
LNG CARRIERS LAID-UP, IDLE OR OTHERWISE OUT OF SERVICE AT THE END OF 2019 29 vessels were laid-up, idle or otherwise out of service at the end of the year. In addition, 2 vessels were idle, awaiting conversion:
LNG CARRIERS DELIVERED IN 2019 44 ships were delivered during the year, including 4 FSRUs and 2 ships of less than 50,000 cubic meters. The average capacity of vessels delivered (excluding FSRUs and ships of less than 50,000 cubic meters) amounted to 173,827 cubic meters.
Clarksons Research, 2020. * Cargo Containment System
18 - GIIGNL Annual Report 2020 Edition
LNG shipping

Built Vessel Name IMO Number Type Capacity (m3) CCS* Owner Builder Manager
2019 Maran Gas Chios 9753014 LNG Carrier 173,548 Membrane Maran Gas Maritime Daewoo (DSME) Maran Gas Maritime
2019 Woodside Chaney 9753026 LNG Carrier 173,579 Membrane Maran Gas Maritime Daewoo (DSME) Maran Gas Maritime
2019 Energy Innovator 9758832 LNG Carrier 166,571 Other Mitsui OSK Lines JMU Tsu Shipyard MOL LNG Transport
2019 Energy Universe 9758844 LNG Carrier 166,637 Other Mitsui OSK Lines JMU Tsu Shipyard MOL LNG Transport
2019 Marvel Pelican 9759252 LNG Carrier 156,265 Moss Mitsui OSK Lines Kawasaki HI Sakaide Mitsui OSK Lines
2019 Marvel Kite 9760782 LNG Carrier 174,000 Membrane Nippon Yusen Kaisha Samsung HI MMS Co Ltd
2019 British Listener 9766566 LNG Carrier 173,644 Membrane BP Shipping Daewoo (DSME) BP Shipping
2019 British Mentor 9766578 LNG Carrier 173,644 Membrane BP Shipping Daewoo (DSME) BP Shipping
2019 British Sponsor 9766580 LNG Carrier 173,644 Membrane BP Shipping Daewoo (DSME) BP Shipping
2019 Maran Gas Hydra 9767962 LNG Carrier 173,617 Membrane Maran Gas Maritime Daewoo (DSME) Maran Gas Maritime
2019 Nikolay Zubov 9768526 LNG Carrier 172,636 Membrane Dynagas LNG Daewoo (DSME) Dynagas LNG
2019 Saga Dawn 9769855 LNG Carrier 45,000 Membrane Saga LNG Shpg Pte. CMHI (Jiangsu) Saga LNG Shpg Pte.
2019 Marvel Crane 9770438 LNG Carrier 177,627 Moss Nippon Yusen Kaisha MHI Nagasaki NYK Shipmngt. Pte.
2019 Marvel Heron 9770440 LNG Carrier 177,000 Moss Mitsui OSK Lines MHI Nagasaki Mitsui OSK Lines
2019 Yamal Spirit 9781920 LNG Carrier 174,174 Membrane Teekay LNG Partners Hyundai Samho HI Teekay Bermuda
2019 Shinshu Maru 9791200 LNG Carrier 177,481 Moss Nippon Yusen Kaisha Kawasaki HI Sakaide NYK LNG Shipmngt.
2019 Sohshu Maru 9791212 LNG Carrier 177,474 Moss Mitsui OSK Lines Kawasaki HI Sakaide MOL LNG Transport
2019 BW Pavilion Aranda 9792606 LNG Carrier 173,400 Membrane BW Gas Daewoo (DSME) BW Fleet Mngt
2019 Nohshu Maru 9796781 LNG Carrier 180,000 Moss Mitsui OSK Lines MHI Nagasaki Mitsui OSK Lines
2019 Bushu Maru 9796793 LNG Carrier 180,000 Moss Nippon Yusen Kaisha MHI Nagasaki NYK LNG Shipmngt.
2019 Diamond Gas Sakura 9810020 LNG Carrier 165,000 Moss Nippon Yusen Kaisha MHI Nagasaki NYK LNG Shipmngt.
2019 Woodside Rees Withers 9810367 LNG Carrier 173,400 Membrane Maran Gas Maritime Daewoo (DSME) Maran Gas Maritime
2019 Maran Gas Andros 9810379 LNG Carrier 173,400 Membrane Maran Gas Maritime Daewoo (DSME) Maran Gas Maritime
2019 Prism Agility 9810549 LNG Carrier 180,024 Membrane SK Shipping Hyundai HI (Ulsan) SK Shipping
2019 Prism Brilliance 9810551 LNG Carrier 180,016 Membrane SK Shipping Hyundai HI (Ulsan) SK Shipping
2019 GasLog Warsaw 9816763 LNG Carrier 180,000 Membrane GasLog Samsung HI GasLog
2019 Flex Constellation 9825427 LNG Carrier 173,400 Membrane FLEX LNG Daewoo (DSME) FLEX Fleet Mngt.
2019 Flex Courageous 9825439 LNG Carrier 173,400 Membrane FLEX LNG Daewoo (DSME) FLEX Fleet Mngt.
2019 Rias Baixas Knutsen 9825568 LNG Carrier 180,041 Membrane Knutsen OAS Shipping Hyundai HI (Ulsan) Knutsen OAS Shipping
2019 SM Jeju LNG1 9830745 LNG Carrier 7,654 Membrane Korea Line Samsung HI KLC SM
2019 Adriano Knutsen 9831220 LNG Carrier 179,981 Membrane Knutsen OAS Shipping Hyundai HI (Ulsan) Knutsen OAS Shipping
2019 LNG Dubhe 9834296 LNG Carrier 174,000 Membrane Mitsui OSK Lines SCS Shipbuilding Mitsui OSK Lines
2019 BW Paris 9368302 FSRU 171,793 Membrane BW Gas Keppel Shipyard BW Fleet Mngt
2019 BW Magna 9792591 FSRU 173,400 Membrane BW Gas Daewoo (DSME) BW Fleet Mngt
2019 Hoegh Galleon 9820013 FSRU 170,000 Membrane Hoegh LNG Samsung HI Hoegh LNG Fleet M.
2019 Turquoise 9823883 FSRU 170,000 Membrane Pardus Energy Hyundai HI (Ulsan) WSM Malaysia
Clarksons Research, 2020. * Cargo Containment System
GIIGNL Annual Report 2020 Edition - 19
LNG shipping

Built Vessel NameStorage
Capacity (m3) CCS*Nominal Send-out Capacity (MTPA) Owner Builder Location
1977/2010 Golar Freeze 125,000 Moss 3.6 Golar LNG Keppel Shipyard Old Harbour, Jamaica
1977/2012 Nusantara Regas Satu (ex Khannur) 125,000 Moss 3.0 Golar LNG Jurong Shipyard Nusantara, Indonesia
1981/2008 Golar Spirit 129,000 Moss 1.8 Golar LNG Keppel Shipyard Laid up
2003/2013 FSRU Toscana (ex Golar Frost) 137,500 Moss 2.8 OLT Offshore Drydocks World Dubai Toscana, Italy
2004/2009 Golar Winter 137,000 Membrane 3.8 Golar LNG Keppel Shipyard Bahia, Brazil
2005 Excellence 138,000 Membrane 3.8 Excelerate Energy DSME Moheshkhali, Bangladesh
2005 Excelsior 138,000 Membrane 3.5 Excelerate Energy DSME Hadera, Israel
2006 Summit LNG (ex Excelerate) 138,000 Membrane 3.8 Excelerate Energy DSME Summit LNG, Bangladesh
2008 Explorer 150,900 Membrane 6.0 Excelerate Energy DSME Jebel Ali, Dubai, UAE
2009 Express 151,000 Membrane 3.8 Excelerate Energy DSME Ruwais, Abu Dhabi, UAE
2009 Exquisite 150,900 Membrane 4.8 Nakilat-Excelerate Energy DSME Port Qasim Karachi, Pakistan
2009 Neptune (ex GDF Suez Neptune) 145,130 Membrane 3.7 Höegh LNG SHI LNGC
2010 Cape Ann (ex GDF Suez Cape Ann) 145,130 Membrane 3.7 Höegh LNG SHI LNGC
2010 Exemplar 150,900 Membrane 4.8 Excelerate Energy DSME LNGC
2010 Expedient 150,900 Membrane 5.2 Excelerate Energy DSME GNL Escobar, Argentina
2014 Experience 173,400 Membrane 6.0 Excelerate Energy DSME Pecem, Brazil
2014 Golar Eskimo 160,000 Membrane 3.8 Golar LNG SHI Aqaba, Jordan
2014 Golar Igloo 170,000 Membrane 5.8 Golar LNG SHI Mina Al Ahmadi, Kuwait
2014 Höegh Gallant 170,000 Membrane 2.8 Höegh LNG HHI LNGC
2014 Independence 170,000 Membrane 4.0 Höegh LNG HHI Klaipeda, Lithuania
2014 PGN FSRU Lampung 170,000 Membrane 2.9 Höegh LNG HHI Lampung LNG, Indonesia
2015 BW Singapore 170,000 Membrane 5.7 BW Gas SHI Sumed, Egypt
2015 Golar Tundra 170,000 Membrane 5.5 Golar LNG SHI LNGC
2016 Höegh Grace 170,000 Membrane 4.0 Höegh LNG HHI Cartagena, Colombia
2017 BW Integrity 170,000 Membrane 5.0 BW Gas SHI Port Qasim GasPort, Pakistan
2017 Höegh Giant 170,000 Membrane 3.7 Höegh LNG HHI LNGC
2017 MOL FSRU Challenger 263,000 Membrane 4.1 MOL DSME Dörtyol, Turkey
2017 S188 (ex Exmar FSRU) 25,000 Other 4.6 Exmar Offshore Wison Zhoushan Laid up
2018 Golar Nanook 170,000 Membrane 5.5 Golar LNG SHI Sergipe, Brazil
2018 Höegh Esperanza 170,000 Membrane 6.0 Höegh LNG HHI Tianjin, China
2018 Höegh Gannet 170,000 Membrane 5.5 Höegh LNG HHI LNGC
2018 Karunia Dewata 26,000 Other 0.3 JSK Group PaxOcean Zhoushan Benoa, Indonesia
2018 Marshal Vasilevskiy 174,000 Membrane 2.0 Gazprom HHI LNGC
2009/2019 BW Paris (ex BW GDF Suez Paris) 171,793 Membrane 4.2 BW Gas Keppel Shipyard LNGC
2019 BW Magna 173,400 Membrane 5.7 BW Gas DSME Port Açu, Brazil
2019 Höegh Galleon 170,000 Membrane 3.7 Höegh LNG SHI LNGC
2019 Turquoise (ex Turkey FSRU) 170,000 Membrane 5.7 Kolin Construction HHI Etki, Turkey
Built Vessel NameStorage
Capacity (m3) CCS*Nominal Send-out Capacity (MTPA) Owner Builder Location
2020 Torman 28,000 Other Gasfin Development Jiangnan SY Group Tema LNG, Ghana
2020 Vasant 1 180,000 Membrane 5.0 Swan Energy HHI Jafrabad , India
2020 N/B Daewoo (DSME) Geoje 2477 173,400 Membrane Maran Gas Maritime DSME
2020 N/B Hyundai H.I. Ulsan 170,000 Membrane BOTAS HHI Dörtyol, Turkey
2021 N/B Hudong Zhonghua 174,000 Membrane Dynagas LNG Hudong Zhonghua
2021 N/B Hudong Zhonghua 174,000 Membrane Dynagas LNG Hudong Zhonghua
2021 N/B Samsung HI Koje 170,000 Membrane PT Jawa Satu Regas SHI Java, Indonesia
FSRU FLEET AT THE END OF 2019
FSRU ORDERBOOK AT THE END OF 2019
The total FSRU fleet consisted of 37 units at the end of 2019. Total FSRU cargo capacity at the end of 2019 stood at around 5.7 million cubic meters. The orderbook comprised 7 FSRUs and 4 of these vessels were scheduled for 2020 delivery.
FSRU fleet
Clarksons Research, 2020.
Clarksons Research, 2020.
* Cargo Containment System
* Cargo Containment System
20 - GIIGNL Annual Report 2020 Edition
LNG shipping
CONTAINMENT SYSTEM
CARGO CAPACITY (m3)
AGE OF THE EXISTING LNG FLEET (years)
CARGO CAPACITY (in m3) AND AGE (years)
At the end of 2019, the fleet could be classified as follows :
LNG fleet statistics
425Membrane
0
250
250
200
200
150
150
100
100
50
50
0
0
< 25,000
25,000 - 50,000
50,000 - 90,000
90,000 - 150,000
150,000 - 170,000
170,000 - 210,000
< 50,000 50,000 - 125,999 125,000 - 149,999 150,000 - 169,999 170,000 - 210,000 210,000 <
Q-Flex
Q-Max
50
0-5
0-5
6-10
6-10 11-15 16-20 21-25 26-30 > 30
11-15 16-20 21-25 26-30 > 30
100 150 200
44Other
132Moss
332018
20182017
2019
2019
13
7
214
131
157
31
15
233
104
153
4531 10 25
GIIGNL Annual Report 2020 Edition - 21
LNG shipping

LNG carrier fleetBuilt Vessel Name Capacity
(m3) CCS* Owner Builder Manager
1974 Seagas 167 Other Aga Gas AB Loland Verft Sirius Shipping
1977 LNG Aquarius 126,300 Moss Hanochem Shpg
General Dynamics
MOL LNG Europe
1978 Bering Energy 126,400 Moss Sinokor Merchant
General Dynamics
Sinokor Merchant
1978 Gulf Energy 126,300 Moss Sinokor Merchant
General Dynamics
Sinokor Merchant
1978 LNG Capricorn 126,300 Moss Nova Shpg & Log
General Dynamics
Nova Shpg & Log
1979 Coral Energy 126,400 Moss Sinokor Merchant
General Dynamics
Sinokor Merchant
1979 GCL 126,400 Moss Golden Concord Hldg.
General Dynamics
Thome Ship Mngt
1979 LNG Taurus 126,300 Moss Nova Shpg & Log
General Dynamics
Nova Shpg & Log
1979 Ocean Quest 126,540 Membrane Hong Kong LNG
Newport News SB
OSM Maritime
1980 Caribbean Energy 126,530 Moss Sinokor
MerchantGeneral Dynamics
Sinokor Merchant
1980 South Energy 126,530 Moss Sinokor Merchant
General Dynamics
Sinokor Ship Mngt
1981 Fortune FSU 130,000 Membrane Dalian Inteh Group
Ch. de France
Dalian Inteh Group
1981 Lucky FSU 130,000 Membrane Dalian Inteh Group
Ch. de France
Dalian Inteh Group
1981 Pacific Energy 135,293 Membrane Sinokor Merchant
Kockums M/V AB
Sinokor Merchant
1981 Ramdane Abane 126,130 Membrane Hyproc
Shipping Co.Ch. de l'Atlantique
Hyproc Shipping Co.
1983 Adriatic Energy 125,568 Moss Sinokor
Merchant MHI Sinokor Merchant
1983 Baltic Energy 125,660 Moss Sinokor Merchant KHI Sinokor
Merchant
1983 North Energy 125,542 Moss Sinokor Merchant MHI Sinokor Ship
Mngt
1984 Atlantic Energy 133,000 Membrane Sinokor Merchant
Kockums M/V AB
Sinokor Ship Mngt
1984 Mediterranean Energy 125,631 Moss Sinokor
Merchant MHI Sinokor Ship Mngt
1984 Senshu Maru 125,835 Moss Mitsui OSK Lines
Mitsui SB (Chiba)
MOL LNG Transport
1988 Kayoh Maru 1,517 Other Daiichi Tanker Imamura Zosen.
Daiichi Tanker
1989 Grace Energy 127,590 Moss Sinokor Merchant MHI WSM
Malaysia
1989 LNG Maleo 127,708 Moss Mitsui OSK Lines
Mitsui SB (Chiba)
MOL LNG Transport
1989 Northwest Sanderling 127,525 Moss Aust LNG
Ship Op MHI STASCO (Shell)
1990 Ekaputra 1 137,012 Moss Humpuss Intermoda MHI Humpuss
Transportasi
1990 Northwest Snipe 127,747 Moss Aust LNG
Ship OpMitsui SB (Chiba)
STASCO (Shell)
1992 Northwest Seaeagle 127,452 Moss Aust LNG
Ship OpMitsui SB (Chiba)
STASCO (Shell)
1993 Arctic Spirit 89,880 Other Teekay LNG Partners I.H.I. Teekay Shpg.
(Gla)
1993 Lucia Ambition 18,928 Membrane MISC NKK (Tsu) MISC
1993 Northwest Sandpiper 127,500 Moss Aust LNG
Ship OpMitsui SB (Chiba)
STASCO (Shell)
1993 Polar Spirit 89,880 Other Teekay LNG Partners I.H.I. Teekay Shpg.
(Gla)
1994 Al Khaznah 135,496 Moss National Gas Shpg.
Mitsui SB (Chiba)
ADNOC Log & Serv
Built Vessel Name Capacity (m3)
CCS* Owner Builder Manager
1994 Hyundai Utopia 125,182 Moss Hyundai LNG Shipping HHI Hyundai LNG
Shipping
1994 LNG Vesta 127,547 Moss Mitsui OSK Lines MHI MOL LNG
Transport
1994 Northwest Stormpetrel 127,606 Moss Aust LNG
Ship Op MHI STASCO (Shell)
1994 Puteri Intan 130,405 Membrane MISC Ch. de l'Atlantique
EagleStar Shipmgmt
1994 Shahamah 135,496 Moss National Gas Shpg. KHI ADNOC Log
& Serv
1994 YK Sovereign 127,125 Moss SK Shipping HHI SK Shipping
1995 Ghasha 137,514 Moss National Gas Shpg.
Mitsui SB (Chiba)
ADNOC Log & Serv
1995 HL Pyeong Taek 130,600 Membrane H-Line
Shipping HHIC H-Line Shipping
1995 Ish 137,540 Moss National Gas Shpg. MHI ADNOC Log
& Serv
1995 Puteri Delima 130,405 Membrane MISC Ch. de l'Atlantique
EagleStar Shipmgmt
1995 Puteri Nilam 130,405 Membrane MISC Ch. de l'Atlantique
EagleStar Shipmgmt
1996 Al Khor 137,354 Moss Nippon Yusen Kaisha MHI NYK LNG
Shipmngt.
1996 Al Zubarah 137,573 Moss Mitsui OSK Lines
Mitsui SB (Chiba)
MOL LNG Transport
1996 Hyundai Greenpia 125,000 Moss Hyundai LNG
Shipping HHI Hyundai LNG Shipping
1996 Mraweh 137,000 Moss National Gas Shpg.
Kvaerner Masa ADNOC
1996 Mubaraz 137,000 Moss National Gas Shpg.
Kvaerner Masa ADNOC
1996 Puteri Zamrud 130,405 Membrane MISC Ch. de l'Atlantique
EagleStar Shipmgmt
1996 Surya Aki 19,474 Moss Humpuss Intermoda KHI Mitsui OSK
Lines
1997 Al Hamra 137,000 Moss National Gas Shpg.
Kvaerner Masa ADNOC
1997 Al Rayyan 135,358 Moss K-Line KHI K-Line Energ Mgmt
1997 Al Wajbah 137,354 Moss Mitsui OSK Lines MHI MOL LNG
Transport
1997 Aman Sendai 18,928 Membrane MISC NKK (Tsu) MISC
1997 Portovenere 65,000 Membrane MISC Fincantieri Sestri
EagleStar Shipmgmt
1997 Puteri Firus 130,405 Membrane MISC Ch. de l'Atlantique
EagleStar Shipmgmt
1997 Umm Al Ashtan 137,000 Moss National Gas Shpg.
Kvaerner Masa ADNOC
1998 Al Wakrah 135,358 Moss Mitsui OSK Lines KHI MOL LNG
Transport
1998 Broog 135,466 Moss Nippon Yusen Kaisha
Mitsui SB (Chiba)
NYK LNG Shipmngt.
1998 Lerici 65,000 Membrane MISC Fincantieri Sestri
EagleStar Shipmgmt
1998 Pelita Energy 18,944 Membrane Jaya Samudra NKK (Tsu) Jaya Samudra
1998 Zekreet 135,420 Moss K-Line Mitsui SB (Chiba)
K-Line Energ Mgmt
1999 Al Bidda 135,279 Moss Mitsui OSK Lines KHI MOL LNG
Transport
1999 Doha 137,354 Moss Nippon Yusen Kaisha MHI NYK LNG
Shipmngt.
1999 HL Muscat 138,200 Membrane H-Line Shipping HHIC H-Line
Shipping
Clarksons Research, 2020. * Cargo Containment System
22 - GIIGNL Annual Report 2020 Edition
LNG shipping
Built Vessel Name Capacity (m3)
CCS* Owner Builder Manager
1999 Hyundai Technopia 135,000 Moss Hyundai LNG
Shipping HHI Hyundai LNG Shipping
1999 SK Summit 138,000 Membrane SK Shipping DSME SK Shipping
2000 Al Jasra 137,100 Moss Nippon Yusen Kaisha MHI NYK LNG
Shipmngt.
2000 Golar Mazo 136,867 Moss Golar LNG Partners MHI Golar
Management
2000 HL Ras Laffan 138,214 Membrane H-Line Shipping HHIC H-Line
Shipping
2000 HL Sur 138,333 Membrane H-Line Shipping HHIC H-Line
Shipping
2000 Hyundai Aquapia 135,000 Moss Hyundai LNG
Shipping HHI Hyundai LNG Shipping
2000 Hyundai Cosmopia 135,000 Moss Hyundai LNG
Shipping HHI Hyundai LNG Shipping
2000 Hyundai Oceanpia 135,000 Moss Hyundai LNG
Shipping HHI Hyundai LNG Shipping
2000 K. Acacia 138,017 Membrane Korea Line DSME KLC SM
2000 K. Freesia 135,256 Membrane Korea Line DSME KLC SM
2000 LNG Jamal 135,333 Moss Nippon Yusen Kaisha MHI NYK LNG
Shipmngt.
2000 SK Splendor 138,375 Membrane SK Shipping SHI SK Shipping
2000 SK Stellar 138,375 Membrane SK Shipping SHI SK Shipping
2000 SK Supreme 138,200 Membrane SK Shipping SHI SK Shipping
2000 Triputra 23,096 Membrane Humpuss Intermoda NKK (Tsu) Humolco
Trans Inc.
2001 Sohar LNG 137,248 Moss Oman Shipping Co MHI Oman Ship
Mngt
2002 Abadi 136,912 Moss Brunei Gas Carriers MHI Brunei Gas
Carriers
2002 Excalibur 138,034 Membrane Exmar DSME Exmar Shipmngt
2002 Galea 136,967 Moss Shell Tank Singapore MHI STASCO
(Shell)
2002 Gallina 137,001 Moss Shell Tank Singapore MHI STASCO
(Shell)
2002 Hispania Spirit 140,500 Membrane Teekay LNG Partners DSME Teekay Shpg.
(Gla)
2002 LNG Rivers 137,231 Moss Bonny Gas Transport HHI Nigeria LNG
Ltd.
2002 LNG Sokoto 137,231 Moss Bonny Gas Transport HHI Nigeria LNG
Ltd.
2002 Puteri Delima Satu 137,100 Membrane MISC Mitsui SB
(Chiba)EagleStar Shipmgmt
2002 Puteri Intan Satu 137,489 Membrane MISC MHI EagleStar
Shipmgmt
2002 Trader 138,000 Membrane Lloyds Ind. Leasing SHI K Line LNG
Shpg.
2003 BW Boston 138,059 Membrane BW Gas DSME BW Fleet Mngt
2003 BW Everett 138,028 Membrane BW Gas DSME BW Fleet Mngt
2003 Castillo de Villalba 138,183 Membrane Elcano IZAR (Puerto
Real) Elcano
2003 Catalunya Spirit 138,000 Membrane Teekay LNG
PartnersIZAR (Sestao)
Teekay Shpg. (Gla)
2003 Energy Frontier 147,599 Moss Tokyo LNG Tanker Co. KHI Mitsui OSK
Lines
2003 Golar Arctic 140,648 Membrane Golar LNG DSME Golar Management
2003 LNG Bayelsa 137,500 Moss Bonny Gas Transport HHI Nigeria LNG
Ltd.
2003 Merchant 138,283 Membrane Sinokor Merchant SHI WSM
Malaysia
2003 Methane Princess 138,000 Membrane Golar LNG
Partners DSME Golar Management
2003 Pacific Notus 137,006 Moss TEPCO MHI NYK LNG Shipmngt.
Built Vessel Name Capacity (m3)
CCS* Owner Builder Manager
2003 Puteri Nilam Satu 137,585 Membrane MISC MHI EagleStar
Shipmgmt
2003 Shinju Maru No. 1 2,513 Other NS United
Tanker Higaki Zosen NS United Tanker
2003 Singapore Energy 138,287 Membrane Sinokor
Merchant SHI WSM Malaysia
2003 SK Sunrise 138,306 Membrane I.S. Carriers SA SHI Iino Marine Service
2004 Berge Arzew 138,088 Membrane BW Gas DSME BW Fleet Mngt
2004 Bilbao Knutsen 138,000 Membrane Knutsen OAS Shipping
IZAR (Sestao)
Knutsen OAS Shipping
2004 Cadiz Knutsen 138,826 Membrane Knutsen OAS Shipping
IZAR (Puerto Real)
Knutsen OAS Shipping
2004 Disha 136,026 Membrane India LNG Transport DSME Shpg Corp of
India
2004 Dukhan 137,661 Moss Mitsui OSK Lines
Mitsui SB (Chiba)
MOL LNG Europe
2004 Fuji LNG 149,172 Moss TMS Cardiff Gas KHI TMS Cardiff
Gas
2004 Fuwairit 138,000 Membrane Mitsui OSK Lines SHI MOL LNG
Europe
2004 Galicia Spirit 140,624 Membrane Teekay LNG Partners DSME Teekay Shpg.
(Gla)
2004 Gemmata 136,985 Moss STASCO (Shell) MHI STASCO (Shell)
2004 Hongkong Energy 138,000 Membrane Sinokor
Merchant DSME WSM Malaysia
2004 Lalla Fatma N'Soumer 147,845 Moss Algeria Nippon
Gas KHI Hyproc Shipping Co.
2004 LNG Akwa Ibom 141,038 Moss Bonny Gas
Transport HHI Nigeria LNG Ltd.
2004 LNG River Orashi 145,914 Membrane BW Gas DSME BW Fleet
Mngt
2004 Madrid Spirit 138,000 Membrane Teekay LNG Partners
IZAR (Puerto Real)
Teekay Shpg. (Gla)
2004 Methane Kari Elin 138,209 Membrane STASCO (Shell) SHI STASCO
(Shell)
2004 Milaha Ras Laffan 138,270 Membrane Qatar Shipping SHI Pronav Ship
Mngt
2004 Pioneer Knutsen 1,100 Other Knutsen OAS
ShippingVeka SY Lemmer
Knutsen OAS Shipping
2004 Puteri Firus Satu 137,617 Membrane MISC MHI EagleStar
Shipmgmt
2004 Puteri Zamrud Satu 137,100 Membrane MISC Mitsui SB
(Chiba)EagleStar Shipmgmt
2004 Raahi 136,026 Membrane India LNG Transport DSME Shpg Corp of
India
2005 Al Deebel 145,130 Membrane Mitsui OSK Lines SHI MOL LNG
Europe
2005 Al Thakhira 145,130 Membrane K-Line SHI K Line LNG Shpg.
2005 Energy Advance 147,624 Moss Tokyo LNG
Tanker Co. KHI Mitsui OSK Lines
2005 Golar Viking 140,208 Membrane Golar LNG HHI Golar Management
2005 LNG Adamawa 142,656 Moss Bonny Gas Transport HHI Nigeria LNG
Ltd.
2005 LNG Cross River 141,000 Moss Bonny Gas
Transport HHI Nigeria LNG Ltd.
2005 LNG Enugu 145,914 Membrane BW Gas DSME BW Fleet Mngt
2005 LNG Oyo 145,842 Membrane BW Gas DSME BW Fleet Mngt
2005 LNG Pioneer 138,000 Membrane Mitsui OSK Lines DSME MOL LNG
Europe
2005 Lusail 145,000 Membrane Nippon Yusen Kaisha SHI NYK LNG
Shipmngt.
2005 Maran Gas Asclepius 145,822 Membrane Maran Nakilat DSME Maran Gas
Maritime
Clarksons Research, 2020. * Cargo Containment System
GIIGNL Annual Report 2020 Edition - 23
LNG shipping
Built Vessel Name Capacity (m3)
CCS* Owner Builder Manager
2005 Nizwa LNG 147,684 Moss Oman Shipping Co KHI Oman Ship
Mngt
2005 North Pioneer 2,512 Other Japan Liquid Gas
Shin Kurushima
Iino Kaiun Kaisha
2005 Puteri Mutiara Satu 137,100 Membrane MISC Mitsui SB
(Chiba)EagleStar Shipmgmt
2005 Salalah LNG 145,951 Membrane Oman Shipping Co SHI Oman Ship
Mngt
2005 Seri Alam 145,572 Membrane MISC SHI MISC
2005 Umm Bab 145,000 Membrane Maran Nakilat DSME Maran Gas Maritime
2006 Al Marrouna 149,539 Membrane Teekay LNG Partners DSME Teekay Shpg.
(Gla)
2006 Arctic Discoverer 142,612 Moss K-Line Mitsui SB
(Chiba)K Line LNG Shpg.
2006 Arctic Lady 147,208 Moss Hoegh LNG MHI Hoegh LNG Fleet M.
2006 Arctic Princess 147,835 Moss Hoegh LNG MHI Hoegh LNG
Fleet M.
2006 Arctic Voyager 142,929 Moss K-Line KHI K Line LNG Shpg.
2006 Energy Progress 147,558 Moss Mitsui OSK
Lines KHI MOL LNG Transport
2006 Global Energy 74,130 Membrane Total Aker Yards Gazocean S.A.
2006 Golar Grand 145,879 Membrane Golar LNG Partners DSME Golar
Management
2006 Golar Maria 145,700 Membrane Golar LNG Partners DSME Golar
Management
2006 Iberica Knutsen 138,120 Membrane Knutsen OAS
Shipping DSME Knutsen OAS Shipping
2006 Ibra LNG 147,100 Membrane Oman Shipping Co SHI Oman Ship
Mngt
2006 Ibri LNG 147,384 Moss Oman Shipping Co MHI Oman Ship
Mngt
2006 LNG Benue 145,842 Membrane BW Gas DSME BW Fleet Mngt
2006 LNG Dream 145,000 Moss Osaka Gas KHI NYK LNG Shipmngt.
2006 LNG Lokoja 149,600 Membrane BW Gas DSME BW Fleet Mngt
2006 LNG River Niger 141,000 Moss Bonny Gas
Transport HHI Nigeria LNG Ltd.
2006 LNG Unity 154,472 Membrane Total Aker Yards Gazocean S.A.
2006 Methane Jane Elizabeth 145,000 Membrane GasLog
Partners SHI GasLog LNG Services
2006 Methane Lydon Volney 145,000 Membrane GasLog SHI GasLog LNG
Services
2006 Methane Rita Andrea 145,000 Membrane GasLog
Partners SHI GasLog LNG Services
2006 Milaha Qatar 145,130 Membrane Qatar Shipping SHI Pronav Ship Mngt
2006 Pacific Eurus 136,942 Moss TEPCO MHI NYK LNG Shipmngt.
2006 Seri Amanah 145,000 Membrane MISC SHI EagleStar Shipmgmt
2006 Seri Anggun 145,731 Membrane MISC SHI MISC
2006 Seri Angkasa 145,000 Membrane MISC SHI MISC
2006 Simaisma 145,700 Membrane Maran Nakilat DSME Maran Gas Maritime
2006 Stena Blue Sky 145,819 Membrane Stena Bulk DSME Northern Marine Mngt
2007 Al Areesh 148,786 Membrane Teekay LNG Partners DSME Teekay Shpg.
(Gla)
2007 Al Daayen 148,853 Membrane Teekay LNG Partners DSME Teekay Shpg.
(Gla)
2007 Al Gattara 216,224 Membrane Qatar Gas (Nakilat) HHI Nakilat
Shipping
Built Vessel Name Capacity (m3)
CCS* Owner Builder Manager
2007 Al Jassasiya 145,700 Membrane Maran Nakilat DSME Maran Gas Maritime
2007 Al Ruwais 210,100 Membrane Schulte Group DSME Pronav Ship Mngt
2007 Al Safliya 210,134 Membrane Schulte Group DSME Pronav Ship Mngt
2007 British Emerald 154,983 Membrane BP Shipping HHI BP Shipping
2007 Cheikh El Mokrani 74,365 Membrane Hyproc
Shipping Co.Universal SB (Tsu)
Hyproc Shipping Co.
2007 Clean Energy 149,700 Membrane Dynagas LNG HHI Dynagas LNG
2007 Ejnan 145,000 Membrane Nippon Yusen Kaisha SHI NYK LNG
Shipmngt.
2007 Grace Acacia 149,786 Membrane Nippon Yusen Kaisha HHI Gazocean
S.A.
2007 Grace Barleria 149,700 Membrane Nippon Yusen Kaisha HHI NYK LNG
Shipmngt.
2007 Grand Elena 145,580 Moss Sovcomflot JSC MHI NYK LNG
Shipmngt.
2007 LNG Alliance 154,472 Membrane Total Aker Yards Gazocean S.A.
2007 LNG Borno 149,600 Membrane Nippon Yusen Kaisha SHI NYK LNG
Shipmngt.
2007 LNG Kano 149,600 Membrane BW Gas DSME BW Fleet Mngt
2007 LNG Ogun 149,600 Membrane Nippon Yusen Kaisha SHI NYK LNG
Shipmngt.
2007 LNG Ondo 148,300 Membrane BW Gas DSME BW Fleet Mngt
2007 Maran Gas Coronis 145,700 Membrane Maran Nakilat DSME Maran Gas
Maritime
2007 Methane Alison Victoria 145,127 Membrane GasLog
Partners SHI GasLog LNG Services
2007 Methane Heather Sally 145,127 Membrane GasLog
Partners SHI GasLog LNG Services
2007 Methane Nile Eagle 145,144 Membrane STASCO (Shell) SHI GasLog LNG
Services
2007Methane Shirley Elisabeth
145,127 Membrane GasLog Partners SHI GasLog LNG
Services
2007 Neo Energy 149,700 Membrane Tsakos Energy Nav HHI Hyundai
Ocean
2007 Ob River 149,700 Membrane Dynagas LNG HHI Dynagas LNG
2007 Seri Ayu 145,894 Membrane MISC SHI MISC
2007 Seri Bakti 152,300 Membrane MISC MHI EagleStar Shipmgmt
2007 Seri Begawan 152,300 Membrane MISC MHI EagleStar Shipmgmt
2007 Sestao Knutsen 138,114 Membrane Knutsen OAS
ShippingCNN - La Naval
Knutsen OAS Shipping
2007 Sun Arrows 19,100 Moss Maple LNG Transport KHI Mitsui OSK
Lines
2007 Symphonic Breeze 147,608 Moss K-Line KHI K Line LNG
Shpg.
2007 Tembek 216,000 Membrane Qatar Gas (Nakilat) SHI Nakilat
Shipping
2008 Al Aamriya 210,168 Membrane Nakilat, JC DSME MOL LNG Europe
2008 Al Ghariya 210,100 Membrane Schulte Group DSME Pronav Ship Mngt
2008 Al Gharrafa 216,224 Membrane Qatar Gas (Nakilat) HHI Nakilat
Shipping
2008 Al Ghuwairiya 263,249 Membrane Qatar Gas (Nakilat) DSME Nakilat
Shipping
2008 Al Hamla 216,000 Membrane Qatar Gas (Nakilat) SHI Nakilat
Shipping
2008 Al Huwaila 217,000 Membrane Teekay LNG Partners SHI Teekay Shpg.
(Gla)
2008 Al Kharsaah 217,000 Membrane Teekay LNG Partners SHI Teekay Shpg.
(Gla)Clarksons Research, 2020.
* Cargo Containment System
LNG carrier fleet
24 - GIIGNL Annual Report 2020 Edition
LNG shipping

Built Vessel Name Capacity (m3)
CCS* Owner Builder Manager
2008 Al Khuwair 217,000 Membrane Teekay LNG Partners SHI Teekay Shpg.
(Gla)
2008 Al Oraiq 210,100 Membrane Nakilat, JC DSME K Line LNG Shpg.
2008 Al Sahla 216,200 Membrane Nakilat, JC HHI NYK LNG Shipmngt.
2008 Al Shamal 217,000 Membrane Teekay LNG Partners SHI Teekay Shpg.
(Gla)
2008 Al Thumama 216,200 Membrane Nakilat, JC HHI NYK LNG Shipmngt.
2008 Al Utouriya 215,000 Membrane Nakilat, JC HHI NYK LNG Shipmngt.
2008 Alto Acrux 147,798 Moss TEPCO MHI NYK LNG Shipmngt.
2008 Amur River 149,743 Membrane Dynagas LNG HHI Dynagas LNG
2008 Arwa Spirit 165,500 Membrane Malt LNG SHI Teekay Shpg. (Gla)
2008 British Diamond 155,046 Membrane BP Shipping HSHI BP Shipping
2008 British Sapphire 155,000 Membrane BP Shipping HHI BP Shipping
2008 Bu Samra 267,335 Membrane Qatar Gas (Nakilat) SHI STASCO
(Shell)
2008 Cheikh Bouamama 75,558 Membrane Hyproc
Shipping Co.Universal SB (Tsu)
Hyproc Shipping Co.
2008 Dapeng Moon 147,210 Membrane CLNG HZ CLNG
2008 Dapeng Sun 147,236 Membrane CLNG HZ CLNG
2008 Duhail 210,100 Membrane Schulte Group DSME Pronav Ship Mngt
2008 Energy Navigator 147,558 Moss Tokyo LNG
Tanker Co. KHI Mitsui OSK Lines
2008 Fraiha 210,100 Membrane Nakilat, JC DSME MOL LNG Europe
2008 Grace Cosmos 149,700 Membrane Nippon Yusen Kaisha HHI Gazocean
S.A.
2008 Grand Aniva 145,580 Moss Sovcomflot JSC MHI SCF Mngt
Dubai
2008 Grand Mereya 145,964 Moss Mitsui OSK Lines
Mitsui SB (Chiba)
MOL LNG Transport
2008 Hyundai Ecopia 149,700 Membrane Hyundai LNG
Shipping HHI Hyundai Ocean
2008 K. Jasmine 145,877 Membrane Korea Line DSME KLC SM
2008 K. Mugungwha 151,812 Membrane Korea Line DSME KLC SM
2008 Kakurei Maru 2,536 Other Tsurumi Sunmarine Higaki Zosen Tsurumi
Sunmarine
2008 LNG Barka 155,982 Moss Oman Shipping Co KHI Nippon
Yusen Kaisha
2008 LNG Ebisu 147,546 Moss KEPCO KHI MOL LNG Transport
2008 LNG Imo 148,300 Membrane BW Gas DSME BW Fleet Mngt
2008 LNG Kolt 153,595 Membrane Pan Ocean HHIC POS SM Co Ltd
2008 Marib Spirit 165,500 Membrane Malt LNG SHI Teekay Shpg. (Gla)
2008 Methane Spirit 165,500 Membrane Malt LNG SHI Teekay Shpg. (Gla)
2008 Mozah 267,335 Membrane Qatar Gas (Nakilat) SHI Nakilat
Shipping
2008 Murwab 210,100 Membrane Nakilat, JC DSME MOL LNG Europe
2008 Seri Balhaf 157,721 Membrane MISC MHI MISC
2008 Seri Bijaksana 152,888 Membrane MISC MHI MISC
2008 Shinju Maru No. 2 2,536 Other NS United
Tanker Higaki Zosen NS United Tanker
2008 Tangguh Batur 145,700 Membrane Sovcomflot JSC DSME
NYK Shipmngt. Pte.
Built Vessel Name Capacity (m3)
CCS* Owner Builder Manager
2008 Tangguh Foja 155,641 Membrane K-Line SHI K-Line Energ Mgmt
2008 Tangguh Hiri 154,971 Membrane Teekay LNG Partners HHI Teekay Shpg.
(Gla)
2008 Tangguh Jaya 155,641 Membrane K-Line SHI K-Line Energ Mgmt
2008 Tangguh Towuti 145,700 Membrane Sovcomflot
JSC DSME NYK Shipmngt. Pte.
2008 Trinity Arrow 154,982 Membrane K-Line Koyo Dock K Line LNG Shpg.
2008 Tristar Ruby 155,000 Membrane Tristar Energy HHI Wilh. Ship Mngt
2008 Umm Al Amad 210,100 Membrane Nakilat, JC DSME K Line LNG Shpg.
2008 Umm Slal 267,335 Membrane Qatar Gas (Nakilat) SHI Nakilat
Shipping
2009 Al Dafna 267,335 Membrane Qatar Gas (Nakilat) SHI STASCO
(Shell)
2009 Al Ghashamiya 217,000 Membrane Qatar Gas (Nakilat) SHI STASCO
(Shell)
2009 Al Karaana 210,191 Membrane Qatar Gas (Nakilat) DSME STASCO
(Shell)
2009 Al Kharaitiyat 216,200 Membrane Qatar Gas (Nakilat) HHI STASCO
(Shell)
2009 Al Khattiya 210,196 Membrane Qatar Gas (Nakilat) DSME STASCO
(Shell)
2009 Al Mafyar 267,335 Membrane Qatar Gas (Nakilat) SHI Nakilat
Shipping
2009 Al Mayeda 267,335 Membrane Qatar Gas (Nakilat) SHI STASCO
(Shell)
2009 Al Nuaman 210,184 Membrane Qatar Gas (Nakilat) DSME STASCO
(Shell)
2009 Al Rekayyat 216,200 Membrane Qatar Gas (Nakilat) HHI STASCO
(Shell)
2009 Al Sadd 210,100 Membrane Qatar Gas (Nakilat) DSME STASCO
(Shell)
2009 Al Samriya 261,700 Membrane Qatar Gas (Nakilat) DSME STASCO
(Shell)
2009 Al Sheehaniya 210,166 Membrane Qatar Gas (Nakilat) DSME STASCO
(Shell)
2009 Aseem 155,000 Membrane India LNG Transport SHI Shpg Corp
of India
2009 BW Brussels 162,400 Membrane BW Gas DSME BW Fleet Mngt
2009 Coral Methane 7,500 Other Anthony Veder Remontowa Repair
Anthony Veder
2009 Cygnus Passage 147,200 Moss Cygnus LNG
Shipping MHI NYK LNG Shipmngt.
2009 Dapeng Star 147,210 Membrane CLNG HZ CLNG
2009 Energy Confidence 153,000 Moss Tokyo LNG
Tanker Co. KHI Nippon Yusen Kaisha
2009 Lijmiliya 261,700 Membrane Qatar Gas (Nakilat) DSME STASCO
(Shell)
2009 LNG Jupiter 155,999 Moss Nippon Yusen Kaisha KHI NYK LNG
Shipmngt.
2009 Magellan Spirit 165,500 Membrane Malt LNG SHI Teekay Shpg.
(Gla)
2009 Mekaines 267,335 Membrane Qatar Gas (Nakilat) SHI Nakilat
Shipping
2009 Mesaimeer 216,200 Membrane Qatar Gas (Nakilat) HHI Nakilat
Shipping
2009 Min Lu 147,210 Membrane CLNG HZ CLNG
2009 Min Rong 147,000 Membrane CLNG HZ CLNG
2009 Oizmendi 600 Other ITSAS Gas Bunker
Francisco Cardama
ITSAS Gas Bunker
2009 Onaiza 210,100 Membrane Qatar Gas (Nakilat) DSME STASCO
(Shell)
2009 Pacific Enlighten 147,200 Moss TEPCO MHI NYK LNG
Shipmngt.
Clarksons Research, 2020. * Cargo Containment System
GIIGNL Annual Report 2020 Edition - 25
LNG shipping

Built Vessel Name Capacity (m3)
CCS* Owner Builder Manager
2009 Seri Balqis 157,611 Membrane MISC MHI MISC
2009 Shagra 267,335 Membrane Qatar Gas (Nakilat) SHI STASCO
(Shell)
2009 Taitar No. 1 147,362 Moss Nimic Ship Mgmt MHI Nimic Ship
Mgmt
2009 Taitar No. 2 147,500 Moss Nimic Ship Mgmt KHI Nimic Ship
Mgmt
2009 Tangguh Palung 155,642 Membrane K-Line SHI K-Line Energ
Mgmt
2009 Tangguh Sago 154,971 Membrane Teekay LNG Partners HSHI Teekay Shpg.
(Gla)
2009 Trinity Glory 154,999 Membrane K-Line Koyo Dock K Line LNG Shpg.
2009 Woodside Donaldson 165,936 Membrane Malt LNG SHI Teekay Shpg.
(Gla)
2010 Aamira 267,335 Membrane Qatar Gas (Nakilat) SHI STASCO
(Shell)
2010 Al Bahiya 210,185 Membrane Qatar Gas (Nakilat) DSME STASCO
(Shell)
2010 Barcelona Knutsen 173,400 Membrane Knutsen OAS
Shipping DSME Knutsen OAS Shipping
2010 Castillo de Santisteban 173,673 Membrane Elcano STX SB
(Jinhae) Elcano
2010 Coral Favia 10,030 Other Anthony Veder Taizhou Skaugen
Anthony Veder
2010 Coral Fraseri 10,030 Other Anthony Veder Taizhou Skaugen
B. Schulte (Hellas)
2010 GasLog Chelsea 153,000 Membrane GasLog HHIC GasLog LNG
Services
2010 GasLog Savannah 155,000 Membrane GasLog SHI GasLog LNG
Services
2010 GasLog Singapore 155,000 Membrane GasLog SHI GasLog LNG
Services
2010 Gigira Laitebo 155,000 Membrane Mitsui OSK Lines HHI MOL LNG
Europe
2010 Meridian Spirit 165,772 Membrane Malt LNG SHI Teekay Shpg. (Gla)
2010 Methane Becki Anne 170,678 Membrane GasLog
Partners SHI GasLog LNG Services
2010 Methane Julia Louise 170,000 Membrane Lepta Shipping
Co SHI GasLog LNG Services
2010 Methane Mickie Harper 170,000 Membrane STASCO (Shell) SHI STASCO
(Shell)
2010Methane Patricia Camila
170,000 Membrane STASCO (Shell) SHI STASCO (Shell)
2010 Point Fortin 154,914 Membrane Trinity LNG Carrier Koyo Dock MOL LNG
Europe
2010 Rasheeda 267,335 Membrane Qatar Gas (Nakilat) SHI STASCO
(Shell)
2010 Ribera Del Duero Knutsen 173,400 Membrane Knutsen OAS
Shipping DSME Knutsen OAS Shipping
2010 Sevilla Knutsen 173,400 Membrane Knutsen OAS
Shipping DSME Knutsen OAS Shipping
2010 Spirit of Hela 173,010 Membrane Mitsui OSK Lines HSHI MOL LNG
Europe
2010 Taitar No. 3 147,366 Moss Nimic Ship Mgmt MHI Nimic Ship
Mgmt
2010 Taitar No. 4 147,546 Moss Nimic Ship Mgmt KHI Nimic Ship
Mgmt
2010 Valencia Knutsen 173,400 Membrane Knutsen OAS
Shipping DSME Knutsen OAS Shipping
2010 Zarga 267,335 Membrane Qatar Gas (Nakilat) SHI STASCO
(Shell)
2011 Akebono Maru 3,556 Other NS United Tanker Higaki Zosen NS United
Tanker
2011 Amali 148,000 Membrane Brunei Shell Tankers DSME STASCO
(Shell)
2011 Arkat 147,228 Membrane Brunei Gas Carriers DSME STASCO
(Shell)
Built Vessel Name Capacity (m3)
CCS* Owner Builder Manager
2011 Coral Fungia 10,030 Other Taizhou Skaugen
Anthony Veder
2011 Coral Furcata 10,030 Other Anthony Veder Taizhou Skaugen
B. Schulte (Hellas)
2011 Energy Horizon 177,441 Moss Tokyo LNG Tanker Co. KHI NYK LNG
Shipmngt.
2011 Lobito 160,276 Membrane MiNT LNG SHI Teekay Shpg. (Gla)
2011 Malanje 160,276 Membrane MiNT LNG SHI Mitsui & Co
2011 Sonangol Benguela 160,500 Membrane Sonangol DSME Chevron
Shpg Co
2011 Sonangol Etosha 160,786 Membrane Sonangol DSME Chevron
Shpg Co
2011 Sonangol Sambizanga 160,785 Membrane Sonangol DSME Chevron
Shpg Co
2011 Soyo 160,276 Membrane MiNT LNG SHI Teekay Shpg. (Gla)
2011 Stena Clear Sky 173,593 Membrane Stena Bulk DSME Northern
Marine Mngt
2011 Stena Crystal Sky 173,611 Membrane Stena Bulk DSME Northern
Marine Mngt
2011 Unikum Spirit 12,000 Other Teekay LNG Partners
AVIC Dingheng SB OSM Tanker
2011 Vision Spirit 12,022 Other Teekay LNG Partners
AVIC Dingheng SB OSM Tanker
2012 Coral Energy 15,600 Other Anthony Veder Neptun Werft
Anthony Veder
2012 Cubal 160,276 Membrane MiNT LNG SHI NYK LNG Shipmngt.
2012 Shen Hai 147,210 Membrane CLNG HZ CLNG
2013 Arctic Aurora 154,899 Membrane Dynagas LNG HHI Dynagas LNG
2013 Cool Voyager 160,372 Membrane Thenamaris SHI Thenamaris LNG
2013 Coral Anthelia 6,500 Other Anthony Veder AVIC Dingheng SB
Anthony Veder
2013 GasLog Santiago 155,000 Membrane GasLog
Partners SHI GasLog LNG Services
2013 GasLog Seattle 155,000 Membrane GasLog Partners SHI GasLog LNG
Services
2013 GasLog Shanghai 155,000 Membrane GasLog
Partners SHI GasLog LNG Services
2013 GasLog Skagen 155,000 Membrane GasLog SHI GasLog LNG
Services
2013 GasLog Sydney 155,000 Membrane GasLog Partners SHI GasLog LNG
Services
2013 Golar Celsius 160,000 Membrane Golar LNG SHI Golar Management
2013 Golar Seal 160,000 Membrane Golar LNG SHI Golar Management
2013 Grace Dahlia 177,630 Moss Nippon Yusen Kaisha KHI NYK LNG
Shipmngt.
2013 Kakuyu Maru 2,538 Other Tsurumi Sunmarine KHI Tsurumi
Sunmarine
2013 Lena River 155,165 Membrane Dynagas LNG HHI Dynagas
2013 Wilforce 156,007 Membrane Teekay LNG Partners DSME Awilco LNG
Technical
2013 Wilpride 156,007 Membrane Teekay LNG Partners DSME Awilco LNG
Technical
2013 Woodside Goode 159,662 Membrane Maran Gas
Maritime DSME Maran Gas Maritime
2013 Woodside Rogers 160,668 Membrane Maran Gas
Maritime DSME Maran Gas Maritime
2013 Yenisei River 155,000 Membrane Dynagas LNG HHI Dynagas LNG
2014 Adam LNG 161,870 Membrane Oman Shipping Co HHI Oman Ship
Mngt
2014 Amani 154,800 Membrane Brunei Gas Carriers HHI STASCO
(Shell)
2014 Asia Energy 160,000 Membrane Chevron Transport SHI Chevron
Transport
Clarksons Research, 2020. * Cargo Containment System
LNG carrier fleet
26 - GIIGNL Annual Report 2020 Edition
LNG shipping

Built Vessel Name Capacity (m3)
CCS* Owner Builder Manager
2014 Asia Vision 160,000 Membrane Chevron Transport SHI Chevron
Transport
2014 Clean Ocean 161,881 Membrane Dynagas HHI Dynagas LNG
2014 Clean Planet 161,814 Membrane Dynagas HHI Dynagas
2014 Cool Runner 160,000 Membrane Thenamaris SHI Thenamaris LNG
2014 Corcovado LNG 160,106 Membrane TMS Cardiff
Gas DSME TMS Cardiff Gas
2014 Esshu Maru 155,300 Moss Mitsubishi Corp MHI MOL LNG
Europe
2014 GasLog Saratoga 155,000 Membrane GasLog SHI GasLog LNG
Services
2014 Golar Bear 160,000 Membrane Golar LNG SHI Golar LNG
2014 Golar Crystal 160,000 Membrane Oriental Fleet Intl SHI Golar
Management
2014 Golar Frost 160,000 Membrane Golar LNG SHI Golar LNG
2014 Golar Glacier 162,000 Membrane Golar LNG HSHI Golar Management
2014 Golar Penguin 160,000 Membrane Golar LNG SHI Golar Management
2014 Kita LNG 160,118 Membrane TMS Cardiff Gas DSME TMS Cardiff
Gas
2014 LNG Venus 155,873 Moss Mitsui OSK Lines MHI MOL LNG
Transport
2014 Maran Gas Apollonia 161,870 Membrane Maran Nakilat HSHI Maran Gas
Maritime
2014 Maran Gas Delphi 159,800 Membrane Maran Nakilat DSME Maran
Nakilat
2014 Maran Gas Efessos 159,800 Membrane Maran Nakilat DSME Maran Gas
Maritime
2014 Maran Gas Posidonia 161,870 Membrane Maran Nakilat HSHI Maran
Nakilat
2014 Pacific Arcadia 147,200 Moss Nippon Yusen
Kaisha MHI NYK LNG Shipmngt.
2014 Palu LNG 160,000 Membrane TMS Cardiff Gas DSME TMS Cardiff
Gas
2014 Pskov 170,200 Membrane Sovcomflot JSC
STX SB (Jinhae)
SCF Mngt Dubai
2014 Seishu Maru 155,300 Moss Mitsubishi Corp MHI NYK LNG
Shipmngt.
2014 Solaris 155,000 Membrane GasLog Partners SHI GasLog LNG
Services
2014 Velikiy Novgorod 170,567 Membrane Sovcomflot
JSCSTX SB (Jinhae)
SCF Mngt Dubai
2014 Yari LNG 160,000 Membrane TMS Cardiff Gas DSME TMS Cardiff
Gas
2015 Amadi 154,800 Membrane Brunei Gas Carriers HHI STASCO
(Shell)
2015 Asia Endeavour 160,000 Membrane Chevron
Transport SHI Chevron Transport
2015 Asia Excellence 160,000 Membrane Chevron
Transport SHI Chevron Transport
2015 Beidou Star 172,000 Membrane Mitsui OSK Lines HZ Mitsui OSK
Lines
2015 BW Pavilion Leeara 161,870 Membrane BW Gas HHI BW Fleet
Mngt
2015 BW Pavilion Vanda 161,870 Membrane BW Gas HHI BW Fleet
Mngt
2015 Clean Horizon 161,870 Membrane Dynagas HHI Dynagas LNG
2015 Cool Explorer 161,352 Membrane Thenamaris SHI Thenamaris LNG
2015 Energy Atlantic 159,924 Membrane Alpha Tankers STX SB (Jinhae)
B. Schulte (Hellas)
2015 GasLog Salem 155,000 Membrane GasLog SHI GasLog LNG Services
2015 Golar Ice 160,000 Membrane Golar LNG SHI Golar Management
2015 Golar Kelvin 162,000 Membrane Golar LNG HSHI Golar Management
Built Vessel Name Capacity (m3)
CCS* Owner Builder Manager
2015 Golar Snow 160,000 Membrane Golar LNG SHI Golar Management
2015 Hai Yang Shi You 301 31,043 Other CNOOC
EnerTechJiangnan SY Group
CNOOC EnerTech
2015 JS Ineos Ingenuity 27,566 Other Evergas AS Sinopacific
OffshoreThome Ship Mngt
2015 JS Ineos Insight 27,566 Other Evergas AS Sinopacific
OffshoreThome Ship Mngt
2015 JS Ineos Intrepid 27,566 Other Evergas AS Sinopacific
DayangThome Ship Mngt
2015 LNG Bonny II 176,809 Membrane Bonny Gas Transport HHI Nigeria LNG
Ltd.
2015 LNG Finima II 174,900 Membrane Bonny Gas Transport SHI Bonny Gas
Transport
2015 LNG Jurojin 155,300 Moss Mitsui OSK Lines MHI Mitsui OSK
Lines
2015 LNG Port Harcourt II 174,900 Membrane Bonny Gas
Transport SHI Bonny Gas Transport
2015 Maran Gas Alexandria 161,870 Membrane Maran Gas
Maritime HSHI Maran Gas Maritime
2015 Maran Gas Lindos 159,800 Membrane Maran Gas
Maritime DSME Maran Gas Maritime
2015 Maran Gas Mystras 159,800 Membrane Maran Gas
Maritime DSME Maran Gas Maritime
2015 Maran Gas Sparta 161,870 Membrane Maran Gas
Maritime HSHI Maran Gas Maritime
2015 Maran Gas Troy 159,800 Membrane Maran Gas
Maritime DSME Maran Gas Maritime
2015 Papua 172,000 Membrane Mitsui OSK Lines HZ MOL LNG
Europe
2015 SCF Melampus 170,200 Membrane Sovcomflot JSC
STX SB (Jinhae)
SCF Mngt Dubai
2015 SCF Mitre 170,200 Membrane Sovcomflot JSC
STX SB (Jinhae)
SCF Mngt Dubai
2015 Southern Cross 172,000 Membrane Mitsui OSK Lines HZ MOL LNG
Europe
2016 CESI Gladstone 174,323 Membrane China Energy Shpg HZ China Energy
Mngt
2016 Christophe de Margerie 172,845 Membrane Sovcomflot
JSC DSME Sovcomflot JSC
2016 Clean Vision 162,000 Membrane Dynagas LNG HHIDynacom Tankers Mgmt
2016 Creole Spirit 173,545 Membrane Teekay LNG Partners DSME Teekay
Bermuda
2016 Gaslog Geneva 174,000 Membrane GasLog Partners SHI GasLog
Partners
2016 GasLog Gibraltar 174,000 Membrane GasLog
Partners SHI GasLog Partners
2016 GasLog Glasgow 174,000 Membrane GasLog
Partners SHI GasLog Partners
2016 GasLog Greece 174,000 Membrane GasLog Partners SHI GasLog
Partners
2016 Hua Xiang 8 14,000 Other Zhejiang Huaxiang
Fengshun Ship Hvy
Zhejiang Huaxiang
2016 JS Ineos Innovation 27,566 Other Evergas AS Sinopacific
Dayang Evergas AS
2016 JS Ineos Inspiration 27,566 Other Evergas AS Sinopacific
OffshoreThome Ship Mngt
2016 Kumul 172,000 Membrane Mitsui OSK Lines HZ Mitsui OSK
Lines
2016 La Mancha Knutsen 176,300 Membrane Knutsen OAS
Shipping HHI Knutsen OAS Shipping
2016 LNG Abalamabie 174,900 Membrane Bonny Gas
Transport SHI Bonny Gas Transport
2016 LNG Abuja II 174,900 Membrane Bonny Gas Transport SHI Bonny Gas
Transport
2016 LNG Fukurokuju 165,134 Moss Mitsui OSK
Lines KHI Mitsui OSK Lines
Clarksons Research, 2020. * Cargo Containment System
GIIGNL Annual Report 2020 Edition - 27
LNG shipping

Built Vessel Name Capacity (m3)
CCS* Owner Builder Manager
2016 LNG Lagos II 176,809 Membrane Bonny Gas Transport HHI Nigeria LNG
Ltd.
2016 LNG Mars 155,693 Moss Mitsui OSK Lines MHI MOL LNG
Transport
2016 LNG Saturn 155,300 Moss Mitsui OSK Lines MHI Mitsui OSK
Lines
2016 Maran Gas Achilles 174,000 Membrane Maran Gas
Maritime HSHI Maran Gas Maritime
2016 Maran Gas Agamemnon 174,000 Membrane Maran Gas
Maritime HSHI Maran Gas Maritime
2016 Maran Gas Amphipolis 173479 Membrane Maran Gas
Maritime DSME Maran Gas Maritime
2016 Maran Gas Hector 174,000 Membrane Maran Gas
Maritime HSHI Maran Gas Maritime
2016 Maran Gas Leto 174,000 Membrane Maran Gas
Maritime HSHI Maran Gas Maritime
2016 Maran Gas Pericles 175,069 Membrane Maran Gas
Maritime HSHI Maran Gas Maritime
2016 Maran Gas Vergina 174,364 Membrane Maran Gas
Maritime DSME Maran Gas Maritime
2016 Maria Energy 174,000 Membrane Tsakos Energy Nav HHI Tsakos
Energy Nav
2016 Oak Spirit 173,545 Membrane Teekay LNG Partners DSME Teekay
Bermuda
2016 Prachi 173,323 Membrane India LNG Transport HHI Shpg Corp of
India
2016 Rioja Knutsen 176,300 Membrane Knutsen OAS Shipping HHI Knutsen OAS
Shipping
2016 Seri Camellia 150,200 Moss MISC HHI EagleStar Shipmgmt
2016 Tessala 171,800 Membrane ITOCHU Corp HHI Hyproc Shipping Co.
2017 Asia Integrity 160,000 Membrane Chevron Transport SHI Chevron
Transport
2017 Asia Venture 160,000 Membrane Chevron Transport SHI Chevron
Transport
2017 Bishu Maru 165,287 Moss K-Line KHI K-Line
2017 Boris Vilkitsky 172,636 Membrane Dynagas LNG DSME Dynagas LNG
2017 Cardissa 6,469 Other Shell Western LNG
STX SB (Jinhae)
STASCO (Shell)
2017 CESI Beihai 174,323 Membrane China Energy Shpg HZ China Energy
Mngt
2017 CESI Qingdao 174,323 Membrane China Energy Shpg HZ China Energy
Mngt
2017 CESI Tianjin 174,323 Membrane China Energy Shpg HZ China Energy
Mngt
2017 Coralius 5,737 Other Anthony Veder Royal Bodewes SY
Anthony Veder
2017 Eduard Toll 172,652 Membrane Teekay Corp CLNG JV DSME Teekay Shpg.
(Gla)
2017 Engie Zeebrugge 5,100 Other Nippon Yusen
Kaisha HHIC NYK LNG Shipmngt.
2017 Fedor Litke 172,636 Membrane Dynagas LNG DSME Dynagas LNG
2017 Hyundai Peacepia 174,000 Membrane Hyundai LNG
Shipping DSME Hyundai Ocean
2017 Hyundai Princepia 174,000 Membrane Hyundai LNG
Shipping DSME Hyundai Ocean
2017 JS Ineos Independence 27,566 Other Evergas AS Sinopacific
Offshore Evergas
2017 JS Ineos Intuition 27,500 Other Evergas AS Jiangsu
New YZJ Evergas AS
2017 JS Ineos Invention 27,500 Other Evergas AS Jiangsu
New YZJ Evergas AS
2017 Macoma 173,545 Membrane Teekay LNG Partners DSME STASCO
(Shell)
2017 Maran Gas Olympias 173638 Membrane Maran Gas
Maritime DSME Maran Gas Maritime
2017 Maran Gas Roxana 173,615 Membrane Maran Gas
Maritime DSME Maran Gas Maritime
Built Vessel Name Capacity (m3)
CCS* Owner Builder Manager
2017 Maran Gas Ulysses 175,069 Membrane Maran Gas
Maritime HSHI Maran Gas Maritime
2017 Murex 173,545 Membrane Teekay LNG Partners DSME STASCO
(Shell)
2017 Ougarta 171,800 Membrane ITOCHU Corp HHI Hyproc Shipping Co.
2017 Pan Asia 174,000 Membrane Teekay LNG Partners HZ Teekay LNG
Partners
2017 Seri Cempaka 150,200 Moss MISC HHI MISC
2017 Seri Cenderawasih 150,200 Moss MISC HHI EagleStar
Shipmgmt
2017 SK Audace 180,000 Membrane SK & Marubeni JV SHI SK Shipmngt.
2017 SM Eagle 174,263 Membrane Korea Line DSME KLC SM
2017 SM Seahawk 174,263 Membrane Korea Line DSME KLC SM
2017 Torben Spirit 173,545 Membrane Teekay LNG Partners DSME Teekay
Bermuda
2018 Boris Davydov 172636 Membrane Dynagas LNG DSME Dynagas LNG
2018 British Achiever 173,644 Membrane BP Shipping DSME BP Shipping
2018 British Contributor 173,644 Membrane BP Shipping DSME BP Shipping
2018 British Partner 173,644 Membrane BP Shipping DSME BP Shipping
2018 Bunker Breeze 4,864 Other Grupo Suardiaz
Ast. Zamakona
Grupo Suardiaz
2018 BW Lilac 174,284 Membrane BW Gas DSME BW Fleet Mngt
2018 BW Tulip 174,284 Membrane BW Gas DSME BW Fleet Mngt
2018 Castillo de Caldelas 178,817 Membrane Elcano Imabari SB
Saijo Elcano
2018 Castillo de Merida 178,817 Membrane Elcano Imabari SB
Saijo Elcano
2018 CESI Lianyungang 174,323 Membrane China Energy
Shpg HZ China Energy Mngt
2018 CESI Wenzhou 174,323 Membrane China Energy Shpg HZ China Energy
Mngt
2018 Coral Encanto 30,133 Other Anthony Veder Ningbo Xinle SB
Anthony Veder
2018 Coral Energice 18,000 Other Anthony Veder Neptun Werft
Anthony Veder
2018 Diamond Gas Orchid 165,000 Moss Nippon Yusen
Kaisha MHI NYK LNG Shipmngt.
2018 Diamond Gas Rose 165,000 Moss Nippon Yusen
Kaisha MHI NYK LNG Shipmngt.
2018 Energy Liberty 166,571 Other Mitsui OSK Lines
JMU Tsu Shipyard
MOL LNG Transport
2018 Enshu Maru 165,257 Moss K-Line KHI K-Line
2018 Flex Endeavour 173,400 Membrane Hyundai Glovis DSME FLEX Fleet Mngt.
2018 Flex Enterprise 173,400 Membrane Hyundai Glovis DSME FLEX Fleet Mngt.
2018 Flex Rainbow 174,000 Membrane FLEX LNG SHI FLEX Fleet Mngt.
2018 Flex Ranger 174,101 Membrane FLEX LNG SHI FLEX Fleet Mngt.
2018 GasLog Genoa 174,000 Membrane GasLog SHI GasLog
2018 GasLog Hong Kong 174,000 Membrane GasLog HHI GasLog LNG
Services
2018 GasLog Houston 174,000 Membrane GasLog HHI GasLog LNG
Services
2018 Georgiy Brusilov 172,636 Membrane Dynagas LNG DSME Dynagas LNG
2018 Kairos 7,500 Other Schulte Group Hyundai Mipo
B. Schulte (Deutsch)
2018 Kinisis 174,000 Membrane Chandris (Hellas) DSME K Line LNG
Shpg.
Clarksons Research, 2020. * Cargo Containment System
LNG carrier fleet
28 - GIIGNL Annual Report 2020 Edition
LNG shipping
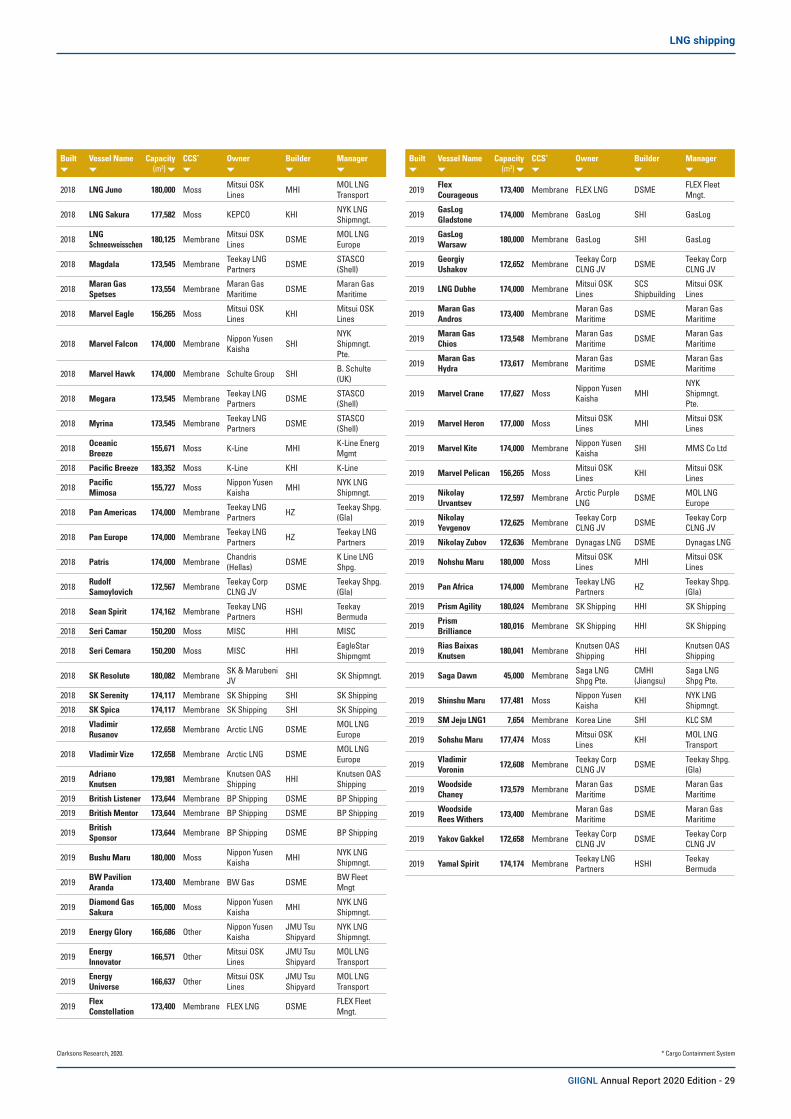
Built Vessel Name Capacity (m3)
CCS* Owner Builder Manager
2018 LNG Juno 180,000 Moss Mitsui OSK Lines MHI MOL LNG
Transport
2018 LNG Sakura 177,582 Moss KEPCO KHI NYK LNG Shipmngt.
2018 LNG Schneeweisschen 180,125 Membrane Mitsui OSK
Lines DSME MOL LNG Europe
2018 Magdala 173,545 Membrane Teekay LNG Partners DSME STASCO
(Shell)
2018 Maran Gas Spetses 173,554 Membrane Maran Gas
Maritime DSME Maran Gas Maritime
2018 Marvel Eagle 156,265 Moss Mitsui OSK Lines KHI Mitsui OSK
Lines
2018 Marvel Falcon 174,000 Membrane Nippon Yusen Kaisha SHI
NYK Shipmngt. Pte.
2018 Marvel Hawk 174,000 Membrane Schulte Group SHI B. Schulte (UK)
2018 Megara 173,545 Membrane Teekay LNG Partners DSME STASCO
(Shell)
2018 Myrina 173,545 Membrane Teekay LNG Partners DSME STASCO
(Shell)
2018 Oceanic Breeze 155,671 Moss K-Line MHI K-Line Energ
Mgmt
2018 Pacific Breeze 183,352 Moss K-Line KHI K-Line
2018 Pacific Mimosa 155,727 Moss Nippon Yusen
Kaisha MHI NYK LNG Shipmngt.
2018 Pan Americas 174,000 Membrane Teekay LNG Partners HZ Teekay Shpg.
(Gla)
2018 Pan Europe 174,000 Membrane Teekay LNG Partners HZ Teekay LNG
Partners
2018 Patris 174,000 Membrane Chandris (Hellas) DSME K Line LNG
Shpg.
2018 Rudolf Samoylovich 172,567 Membrane Teekay Corp
CLNG JV DSME Teekay Shpg. (Gla)
2018 Sean Spirit 174,162 Membrane Teekay LNG Partners HSHI Teekay
Bermuda
2018 Seri Camar 150,200 Moss MISC HHI MISC
2018 Seri Cemara 150,200 Moss MISC HHI EagleStar Shipmgmt
2018 SK Resolute 180,082 Membrane SK & Marubeni JV SHI SK Shipmngt.
2018 SK Serenity 174,117 Membrane SK Shipping SHI SK Shipping
2018 SK Spica 174,117 Membrane SK Shipping SHI SK Shipping
2018 Vladimir Rusanov 172,658 Membrane Arctic LNG DSME MOL LNG
Europe
2018 Vladimir Vize 172,658 Membrane Arctic LNG DSME MOL LNG Europe
2019 Adriano Knutsen 179,981 Membrane Knutsen OAS
Shipping HHI Knutsen OAS Shipping
2019 British Listener 173,644 Membrane BP Shipping DSME BP Shipping
2019 British Mentor 173,644 Membrane BP Shipping DSME BP Shipping
2019 British Sponsor 173,644 Membrane BP Shipping DSME BP Shipping
2019 Bushu Maru 180,000 Moss Nippon Yusen Kaisha MHI NYK LNG
Shipmngt.
2019 BW Pavilion Aranda 173,400 Membrane BW Gas DSME BW Fleet
Mngt
2019 Diamond Gas Sakura 165,000 Moss Nippon Yusen
Kaisha MHI NYK LNG Shipmngt.
2019 Energy Glory 166,686 Other Nippon Yusen Kaisha
JMU Tsu Shipyard
NYK LNG Shipmngt.
2019 Energy Innovator 166,571 Other Mitsui OSK
LinesJMU Tsu Shipyard
MOL LNG Transport
2019 Energy Universe 166,637 Other Mitsui OSK
LinesJMU Tsu Shipyard
MOL LNG Transport
2019 Flex Constellation 173,400 Membrane FLEX LNG DSME FLEX Fleet
Mngt.
Built Vessel Name Capacity (m3)
CCS* Owner Builder Manager
2019 Flex Courageous 173,400 Membrane FLEX LNG DSME FLEX Fleet
Mngt.
2019 GasLog Gladstone 174,000 Membrane GasLog SHI GasLog
2019 GasLog Warsaw 180,000 Membrane GasLog SHI GasLog
2019 Georgiy Ushakov 172,652 Membrane Teekay Corp
CLNG JV DSME Teekay Corp CLNG JV
2019 LNG Dubhe 174,000 Membrane Mitsui OSK Lines
SCS Shipbuilding
Mitsui OSK Lines
2019 Maran Gas Andros 173,400 Membrane Maran Gas
Maritime DSME Maran Gas Maritime
2019 Maran Gas Chios 173,548 Membrane Maran Gas
Maritime DSME Maran Gas Maritime
2019 Maran Gas Hydra 173,617 Membrane Maran Gas
Maritime DSME Maran Gas Maritime
2019 Marvel Crane 177,627 Moss Nippon Yusen Kaisha MHI
NYK Shipmngt. Pte.
2019 Marvel Heron 177,000 Moss Mitsui OSK Lines MHI Mitsui OSK
Lines
2019 Marvel Kite 174,000 Membrane Nippon Yusen Kaisha SHI MMS Co Ltd
2019 Marvel Pelican 156,265 Moss Mitsui OSK Lines KHI Mitsui OSK
Lines
2019 Nikolay Urvantsev 172,597 Membrane Arctic Purple
LNG DSME MOL LNG Europe
2019 Nikolay Yevgenov 172,625 Membrane Teekay Corp
CLNG JV DSME Teekay Corp CLNG JV
2019 Nikolay Zubov 172,636 Membrane Dynagas LNG DSME Dynagas LNG
2019 Nohshu Maru 180,000 Moss Mitsui OSK Lines MHI Mitsui OSK
Lines
2019 Pan Africa 174,000 Membrane Teekay LNG Partners HZ Teekay Shpg.
(Gla)
2019 Prism Agility 180,024 Membrane SK Shipping HHI SK Shipping
2019 Prism Brilliance 180,016 Membrane SK Shipping HHI SK Shipping
2019 Rias Baixas Knutsen 180,041 Membrane Knutsen OAS
Shipping HHI Knutsen OAS Shipping
2019 Saga Dawn 45,000 Membrane Saga LNG Shpg Pte.
CMHI (Jiangsu)
Saga LNG Shpg Pte.
2019 Shinshu Maru 177,481 Moss Nippon Yusen Kaisha KHI NYK LNG
Shipmngt.
2019 SM Jeju LNG1 7,654 Membrane Korea Line SHI KLC SM
2019 Sohshu Maru 177,474 Moss Mitsui OSK Lines KHI MOL LNG
Transport
2019 Vladimir Voronin 172,608 Membrane Teekay Corp
CLNG JV DSME Teekay Shpg. (Gla)
2019 Woodside Chaney 173,579 Membrane Maran Gas
Maritime DSME Maran Gas Maritime
2019 Woodside Rees Withers 173,400 Membrane Maran Gas
Maritime DSME Maran Gas Maritime
2019 Yakov Gakkel 172,658 Membrane Teekay Corp CLNG JV DSME Teekay Corp
CLNG JV
2019 Yamal Spirit 174,174 Membrane Teekay LNG Partners HSHI Teekay
Bermuda
Clarksons Research, 2020. * Cargo Containment System
GIIGNL Annual Report 2020 Edition - 29
LNG shipping
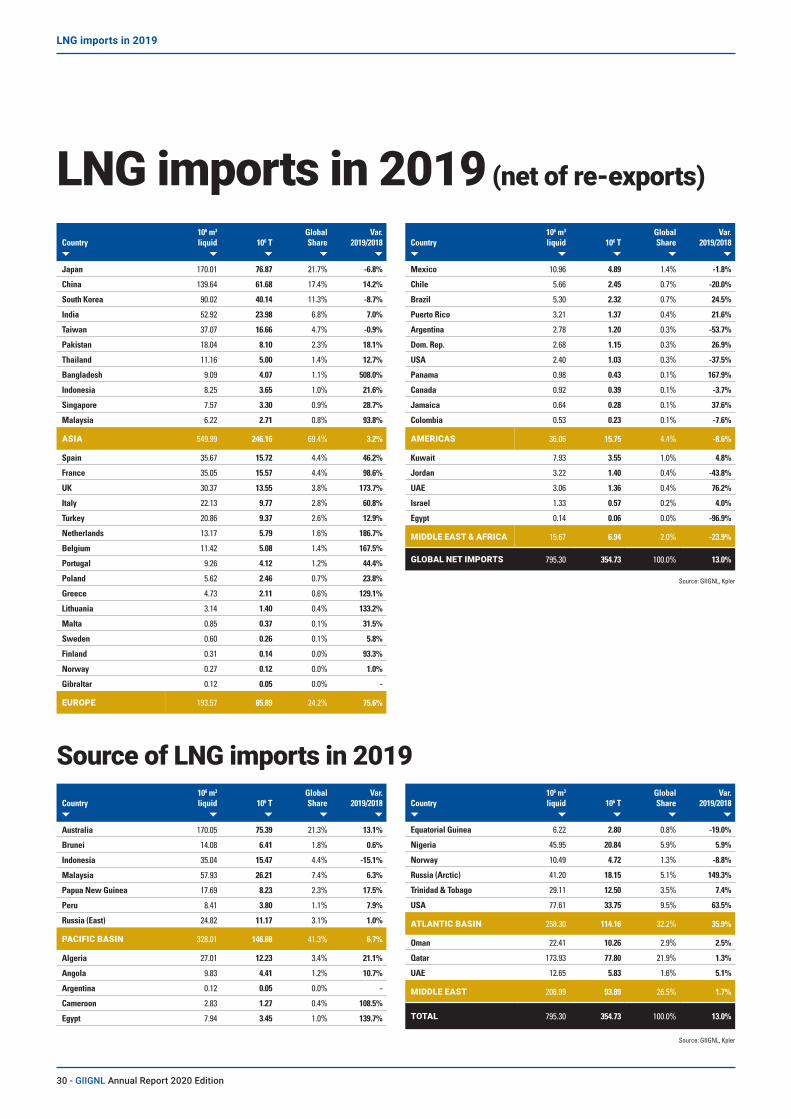
LNG imports in 2019 (net of re-exports)
Source of LNG imports in 2019
Country106 m3 liquid 106 T
Global Share
Var. 2019/2018
Japan 170.01 76.87 21.7% -6.8%
China 139.64 61.68 17.4% 14.2%
South Korea 90.02 40.14 11.3% -8.7%
India 52.92 23.98 6.8% 7.0%
Taiwan 37.07 16.66 4.7% -0.9%
Pakistan 18.04 8.10 2.3% 18.1%
Thailand 11.16 5.00 1.4% 12.7%
Bangladesh 9.09 4.07 1.1% 508.0%
Indonesia 8.25 3.65 1.0% 21.6%
Singapore 7.57 3.30 0.9% 28.7%
Malaysia 6.22 2.71 0.8% 93.8%
ASIA 549.99 246.16 69.4% 3.2%
Spain 35.67 15.72 4.4% 46.2%
France 35.05 15.57 4.4% 98.6%
UK 30.37 13.55 3.8% 173.7%
Italy 22.13 9.77 2.8% 60.8%
Turkey 20.86 9.37 2.6% 12.9%
Netherlands 13.17 5.79 1.6% 186.7%
Belgium 11.42 5.08 1.4% 167.5%
Portugal 9.26 4.12 1.2% 44.4%
Poland 5.62 2.46 0.7% 23.8%
Greece 4.73 2.11 0.6% 129.1%
Lithuania 3.14 1.40 0.4% 133.2%
Malta 0.85 0.37 0.1% 31.5%
Sweden 0.60 0.26 0.1% 5.8%
Finland 0.31 0.14 0.0% 93.3%
Norway 0.27 0.12 0.0% 1.0%
Gibraltar 0.12 0.05 0.0% -
EUROPE 193.57 85.89 24.2% 75.6%
Country106 m3 liquid 106 T
Global Share
Var. 2019/2018
Australia 170.05 75.39 21.3% 13.1%
Brunei 14.08 6.41 1.8% 0.6%
Indonesia 35.04 15.47 4.4% -15.1%
Malaysia 57.93 26.21 7.4% 6.3%
Papua New Guinea 17.69 8.23 2.3% 17.5%
Peru 8.41 3.80 1.1% 7.9%
Russia (East) 24.82 11.17 3.1% 1.0%
PACIFIC BASIN 328.01 146.68 41.3% 6.7%
Algeria 27.01 12.23 3.4% 21.1%
Angola 9.83 4.41 1.2% 10.7%
Argentina 0.12 0.05 0.0% -
Cameroon 2.83 1.27 0.4% 108.5%
Egypt 7.94 3.45 1.0% 139.7%
Country106 m3 liquid 106 T
Global Share
Var. 2019/2018
Mexico 10.96 4.89 1.4% -1.8%
Chile 5.66 2.45 0.7% -20.0%
Brazil 5.30 2.32 0.7% 24.5%
Puerto Rico 3.21 1.37 0.4% 21.6%
Argentina 2.78 1.20 0.3% -53.7%
Dom. Rep. 2.68 1.15 0.3% 26.9%
USA 2.40 1.03 0.3% -37.5%
Panama 0.98 0.43 0.1% 167.9%
Canada 0.92 0.39 0.1% -3.7%
Jamaica 0.64 0.28 0.1% 37.6%
Colombia 0.53 0.23 0.1% -7.6%
AMERICAS 36.06 15.75 4.4% -8.6%
Kuwait 7.93 3.55 1.0% 4.8%
Jordan 3.22 1.40 0.4% -43.8%
UAE 3.06 1.36 0.4% 76.2%
Israel 1.33 0.57 0.2% 4.0%
Egypt 0.14 0.06 0.0% -96.9%
MIDDLE EAST & AFRICA 15.67 6.94 2.0% -23.9%
GLOBAL NET IMPORTS 795.30 354.73 100.0% 13.0%
Source: GIIGNL, Kpler
Source: GIIGNL, Kpler
Country106 m3 liquid 106 T
Global Share
Var. 2019/2018
Equatorial Guinea 6.22 2.80 0.8% -19.0%
Nigeria 45.95 20.84 5.9% 5.9%
Norway 10.49 4.72 1.3% -8.8%
Russia (Arctic) 41.20 18.15 5.1% 149.3%
Trinidad & Tobago 29.11 12.50 3.5% 7.4%
USA 77.61 33.75 9.5% 63.5%
ATLANTIC BASIN 258.30 114.16 32.2% 35.9%
Oman 22.41 10.26 2.9% 2.5%
Qatar 173.93 77.80 21.9% 1.3%
UAE 12.65 5.83 1.6% 5.1%
MIDDLE EAST 208.99 93.89 26.5% 1.7%
TOTAL 795.30 354.73 100.0% 13.0%
30 - GIIGNL Annual Report 2020 Edition
LNG imports in 2019
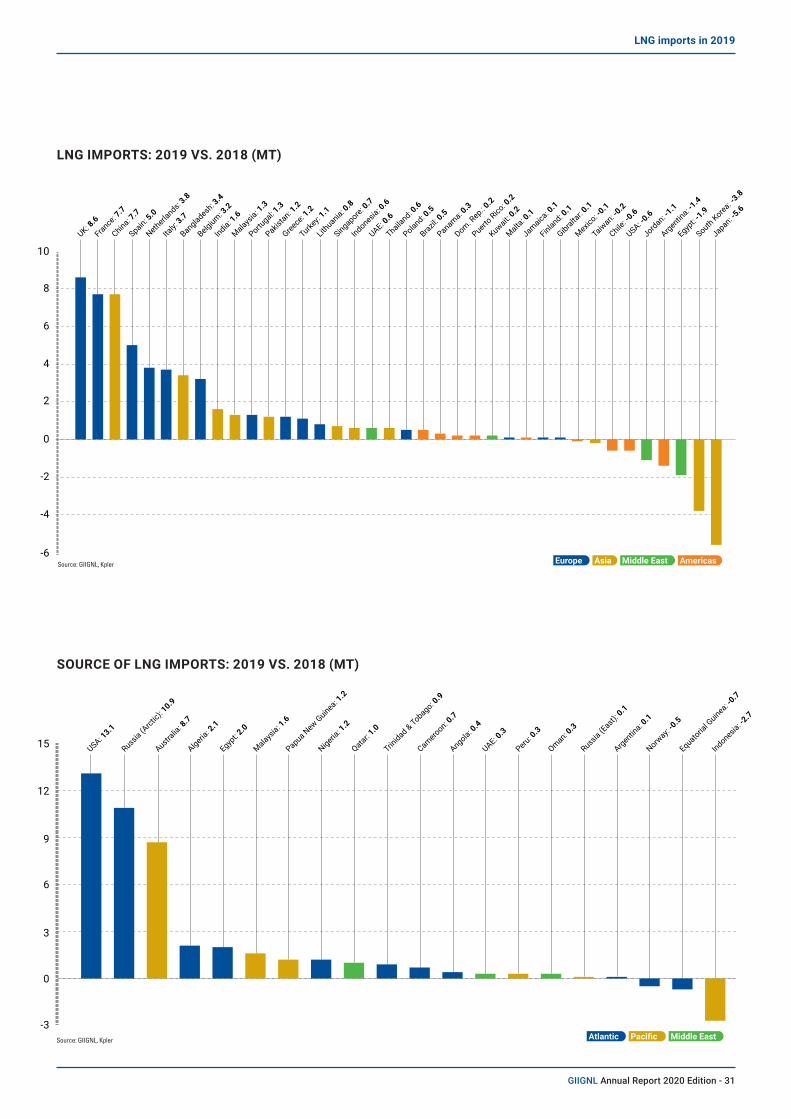
LNG IMPORTS: 2019 VS. 2018 (MT)
SOURCE OF LNG IMPORTS: 2019 VS. 2018 (MT)
Source: GIIGNL, Kpler
Source: GIIGNL, Kpler
10
8
6
4
2
0
-2
-4
-6
15
12
9
6
3
0
-3
USA: 13.1
Russia (A
rctic)
: 10.9
Australia
: 8.7
Algeria: 2
.1
Egypt: 2
.0
Malaysia: 1
.6
Papua New Guinea: 1
.2
Nigeria: 1
.2
Qatar: 1.0
Trinidad & Tobago: 0
.9
Cameroon: 0.7
Angola: 0.4
UAE: 0.3
Peru: 0.3
Oman: 0.3
Russia (E
ast): 0
.1
Argentina: 0
.1
Norway:
-0.5
Equatorial G
uinea: -0.7
Indonesia: -2
.7
UK: 8.6
France: 7
.7
China: 7.7
Spain: 5.0
Netherlands:
3.8
Italy:
3.7
Bangladesh: 3
.4
Belgium: 3.2
India: 1.6
Malaysia: 1
.3
Portugal: 1
.3
Pakistan: 1
.2
Greece: 1
.2
Turkey:
1.1
Lithuania: 0
.8
Singapore: 0.7
Indonesia: 0
.6
UAE: 0.6
Thailand: 0
.6
Poland: 0.5
Brazil: 0
.5
Panama: 0.3
Dom. Rep.: 0
.2
Puerto Rico
: 0.2
Kuwait: 0.2
Malta: 0
.1
Jamaica: 0
.1
Finland: 0.1
Gibraltar: 0
.1
Mexico: -0
.1
Taiwan: -0
.2
Chile: -0
.6
USA: -0.6
Jordan: -1.1
Argentina: -1
.4
Egypt: -
1.9
South Korea: -3.8
Japan: -5.6
Europe Asia Middle East Americas
Atlantic Pacific Middle East
GIIGNL Annual Report 2020 Edition - 31
LNG imports in 2019

Country Algeria Angola Argentina Australia Brunei Cameroon Egypt Equatorial Guinea
Indonesia Malaysia Nigeria Norway Oman Papua New Guinea
Peru Qatar Russia (Arctic)
Russia (East)
Trinidad & Tobago
UAE USA Re-exports Received
Re-exports Loaded
2019 Net imports
Japan 0.06 - - 29.84 4.32 - 0.06 0.07 4.04 9.35 0.83 - 2.90 3.68 0.68 8.74 - 6.34 - 2.17 3.64 0.14 - 76.87
China 0.06 0.13 - 28.16 0.60 0.55 0.19 0.42 4.54 7.48 1.98 0.07 1.10 2.80 0.66 8.49 1.81 1.04 0.79 0.12 0.27 0.50 -0.07 61.68
South Korea - - - 7.59 0.58 - 0.11 0.08 2.31 4.74 0.56 - 3.85 0.31 1.13 11.12 0.07 2.31 0.07 0.18 5.05 0.06 - 40.14
India 0.21 2.88 - 1.01 - 0.40 0.20 0.51 - 0.39 2.71 0.06 1.01 - - 9.74 0.21 - 0.14 2.64 1.79 0.15 -0.07 23.98
Taiwan - - - 4.39 0.25 0.06 0.11 0.14 0.35 2.48 0.20 - 0.13 1.45 0.11 4.67 - 1.48 0.19 0.06 0.50 0.07 - 16.66
Pakistan 0.27 - - - - - 0.64 0.22 - 0.06 0.96 - 0.28 - - 4.75 - - - 0.40 0.45 0.06 - 8.10
Thailand - 0.07 - 0.84 - - 0.13 - 0.27 1.29 - - 0.13 - 0.06 1.96 0.07 - 0.05 - 0.13 - - 5.00
Bangladesh 0.29 - - - - - 0.06 - 0.06 0.13 0.36 - 0.07 - - 2.79 0.25 - - - - 0.06 - 4.07
Indonesia - - - 0.07 - - - - 3.58 - - - - - - - - - - - - - - 3.65
Singapore 0.01 0.07 - 1.89 - - 0.44 0.25 0.13 0.01 0.06 - - - - 0.10 - - 0.12 - 0.64 - -0.41 3.30
Malaysia - - - 1.54 0.65 - - 0.08 - 0.26 0.06 - - - - - - - - - 0.08 0.07 -0.03 2.71
ASIA 0.89 3.15 - 75.33 6.41 1.01 1.94 1.76 15.28 26.21 7.74 0.13 9.47 8.23 2.65 52.36 2.41 11.17 1.36 5.57 12.54 1.11 -0.58 246.16
Spain 0.80 0.20 - - - 0.06 - 0.06 - - 3.14 0.49 - - 0.33 3.21 2.26 - 2.06 - 3.12 - -0.02 15.72
France 2.68 0.26 - - - - 0.32 - - - 2.96 1.08 - - 0.28 1.35 5.04 - 0.19 - 2.02 0.00 -0.61 15.57
UK 0.73 0.07 - - - 0.06 - 0.19 - - 0.25 0.25 - - 0.21 6.56 2.38 - 0.69 - 2.15 - - 13.55
Italy 2.19 - - - - - 0.31 0.06 - - 0.07 0.12 - - - 4.67 0.06 - 1.08 - 1.15 0.07 - 9.77
Turkey 4.27 - - - - - 0.32 0.06 - - 1.82 0.06 - - - 1.76 0.07 - 0.28 - 0.73 - - 9.37
Netherlands 0.14 0.20 - - - - - 0.04 - - 0.24 0.33 - - 0.34 0.09 3.07 - 0.05 - 1.42 - -0.14 5.79
Belgium - 0.07 - - - - 0.11 - - - - - - - - 3.32 1.44 - - - 0.25 - -0.12 5.08
Portugal 0.06 - - - - - - - - - 2.37 - - - - 0.49 0.14 - 0.11 - 0.95 - - 4.12
Poland - - - - - - - - - - - 0.12 - - - 1.67 - - - - 0.67 - - 2.46
Greece 0.41 0.07 - - - - 0.18 - - - 0.32 0.40 - - - 0.40 0.13 - 0.02 - 0.16 0.02 - 2.11
Lithuania - - - - - - - - - - - 0.99 - - - - 0.31 - - - 0.07 0.06 -0.02 1.40
Malta - - - - - - 0.05 - - - - 0.06 - - - - - - 0.25 - 0.01 - - 0.37
Sweden - - - - - - - - - - - 0.10 - - - - 0.08 - - - - 0.08 - 0.26
Finland - - - - - - - - - - - 0.03 - - - - 0.09 - - - - 0.02 - 0.14
Norway - - - - - - - - - - - 0.12 - - - - - - - - - 0.01 - 0.12
Gibraltar - - - - - - - - - - - - - - - - - - - - - 0.05 - 0.05
EUROPE 11.27 0.86 - - - 0.13 1.29 0.42 - - 11.18 4.16 - - 1.15 23.52 15.07 - 4.73 - 12.72 0.31 -0.91 85.89
Mexico - - - - - - - 0.35 0.18 - 1.03 - - - - - - - 0.44 - 2.89 - - 4.89
Chile - - - - - - - 0.14 - - - - - - - - - - 0.63 - 1.68 - - 2.45
Brazil - 0.07 0.05 - - 0.10 - 0.13 - - 0.20 0.25 - - - - - - 0.42 - 1.09 - - 2.32
Puerto Rico - - - - - - - - - - - - - - - - 0.06 - 1.33 - - 0.02 -0.04 1.37
Argentina - - - - - 0.03 - - - - - - - - - - - - 0.44 - 0.73 - - 1.20
Dom. Rep. - - - - - - - - - - 0.06 0.06 - - - - - - 0.85 - 0.22 - -0.03 1.15
USA - - - - - - - - - - 0.07 - - - - - - - 0.96 - - - - 1.03
Panama - - - - - - 0.03 - - - - 0.12 - - - - - - 0.05 - 0.21 0.02 - 0.43
Canada - 0.07 - - - - - - - - - - - - - - - - 0.33 - - - - 0.39
Jamaica - - - - - - - - - - - - - - - - - - 0.08 - 0.17 0.04 -0.01 0.28
Colombia - - - - - - - - - - 0.06 - - - - - - - 0.03 - 0.14 - - 0.23
AMERICAS - 0.14 0.05 - - 0.14 0.03 0.62 0.18 - 1.41 0.43 - - - - 0.06 - 5.56 - 7.13 0.07 -0.07 15.75
Kuwait 0.07 0.13 - - - - 0.06 - - - 0.37 - 0.73 - - 1.84 - - 0.14 - 0.21 - - 3.55
Jordan - - - - - - - - - - - - - - - 0.08 0.35 - 0.19 - 0.78 - - 1.40
UAE - 0.13 - 0.06 - - 0.06 - - - 0.13 - 0.06 - - - 0.13 - 0.07 0.26 0.39 0.06 - 1.36
Israel - - - - - - - - - - - - - - - - 0.12 - 0.45 - - - - 0.57
Egypt - - - - - - 0.06 - - - - - - - - - - - - - - - - 0.06
MIDDLE EAST & AFRICA 0.07 0.26 - 0.06 - - 0.18 - - - 0.50 - 0.79 - - 1.92 0.61 - 0.85 0.26 1.37 0.06 - 6.94
GLOBAL NET IMPORTS 12.23 4.41 0.05 75.39 6.41 1.27 3.45 2.80 15.47 26.21 20.84 4.72 10.26 8.23 3.80 77.80 18.15 11.17 12.50 5.83 33.75 1.56 -1.56 354.73
Quantities (in MT) received in 2019 by the importing countries from the exporting countries
32 - GIIGNL Annual Report 2020 Edition
LNG imports in 2019
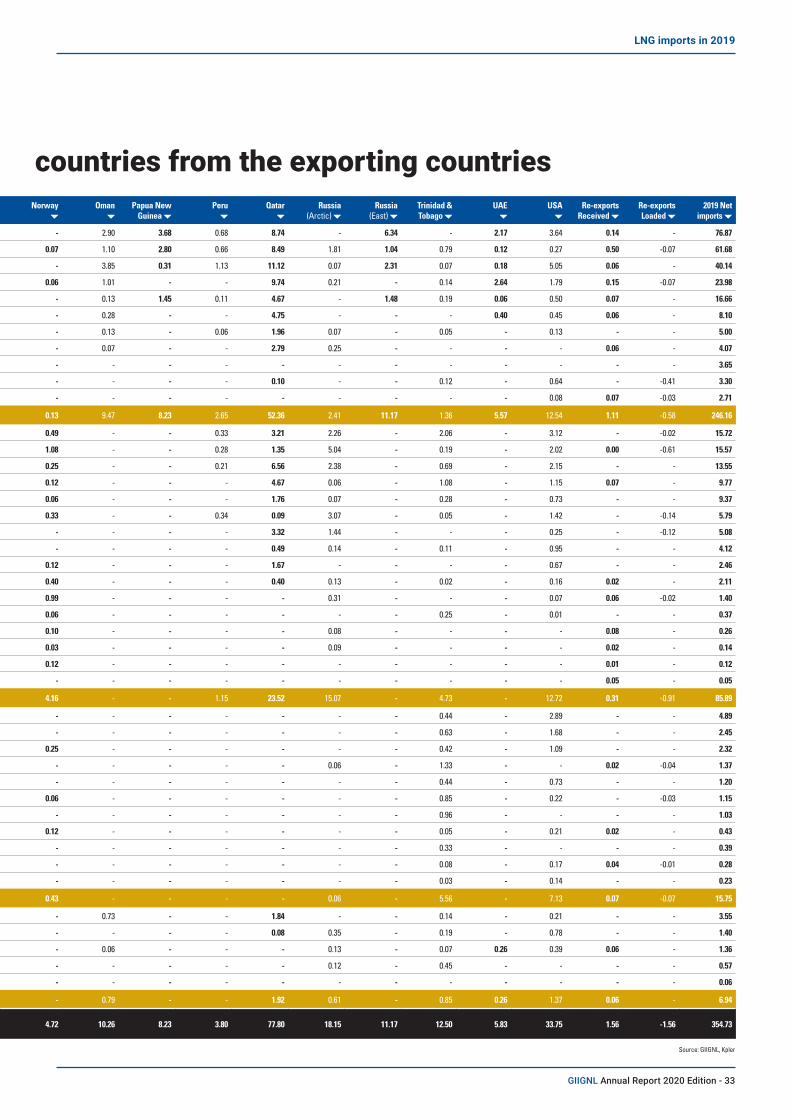
Country Algeria Angola Argentina Australia Brunei Cameroon Egypt Equatorial Guinea
Indonesia Malaysia Nigeria Norway Oman Papua New Guinea
Peru Qatar Russia (Arctic)
Russia (East)
Trinidad & Tobago
UAE USA Re-exports Received
Re-exports Loaded
2019 Net imports
Japan 0.06 - - 29.84 4.32 - 0.06 0.07 4.04 9.35 0.83 - 2.90 3.68 0.68 8.74 - 6.34 - 2.17 3.64 0.14 - 76.87
China 0.06 0.13 - 28.16 0.60 0.55 0.19 0.42 4.54 7.48 1.98 0.07 1.10 2.80 0.66 8.49 1.81 1.04 0.79 0.12 0.27 0.50 -0.07 61.68
South Korea - - - 7.59 0.58 - 0.11 0.08 2.31 4.74 0.56 - 3.85 0.31 1.13 11.12 0.07 2.31 0.07 0.18 5.05 0.06 - 40.14
India 0.21 2.88 - 1.01 - 0.40 0.20 0.51 - 0.39 2.71 0.06 1.01 - - 9.74 0.21 - 0.14 2.64 1.79 0.15 -0.07 23.98
Taiwan - - - 4.39 0.25 0.06 0.11 0.14 0.35 2.48 0.20 - 0.13 1.45 0.11 4.67 - 1.48 0.19 0.06 0.50 0.07 - 16.66
Pakistan 0.27 - - - - - 0.64 0.22 - 0.06 0.96 - 0.28 - - 4.75 - - - 0.40 0.45 0.06 - 8.10
Thailand - 0.07 - 0.84 - - 0.13 - 0.27 1.29 - - 0.13 - 0.06 1.96 0.07 - 0.05 - 0.13 - - 5.00
Bangladesh 0.29 - - - - - 0.06 - 0.06 0.13 0.36 - 0.07 - - 2.79 0.25 - - - - 0.06 - 4.07
Indonesia - - - 0.07 - - - - 3.58 - - - - - - - - - - - - - - 3.65
Singapore 0.01 0.07 - 1.89 - - 0.44 0.25 0.13 0.01 0.06 - - - - 0.10 - - 0.12 - 0.64 - -0.41 3.30
Malaysia - - - 1.54 0.65 - - 0.08 - 0.26 0.06 - - - - - - - - - 0.08 0.07 -0.03 2.71
ASIA 0.89 3.15 - 75.33 6.41 1.01 1.94 1.76 15.28 26.21 7.74 0.13 9.47 8.23 2.65 52.36 2.41 11.17 1.36 5.57 12.54 1.11 -0.58 246.16
Spain 0.80 0.20 - - - 0.06 - 0.06 - - 3.14 0.49 - - 0.33 3.21 2.26 - 2.06 - 3.12 - -0.02 15.72
France 2.68 0.26 - - - - 0.32 - - - 2.96 1.08 - - 0.28 1.35 5.04 - 0.19 - 2.02 0.00 -0.61 15.57
UK 0.73 0.07 - - - 0.06 - 0.19 - - 0.25 0.25 - - 0.21 6.56 2.38 - 0.69 - 2.15 - - 13.55
Italy 2.19 - - - - - 0.31 0.06 - - 0.07 0.12 - - - 4.67 0.06 - 1.08 - 1.15 0.07 - 9.77
Turkey 4.27 - - - - - 0.32 0.06 - - 1.82 0.06 - - - 1.76 0.07 - 0.28 - 0.73 - - 9.37
Netherlands 0.14 0.20 - - - - - 0.04 - - 0.24 0.33 - - 0.34 0.09 3.07 - 0.05 - 1.42 - -0.14 5.79
Belgium - 0.07 - - - - 0.11 - - - - - - - - 3.32 1.44 - - - 0.25 - -0.12 5.08
Portugal 0.06 - - - - - - - - - 2.37 - - - - 0.49 0.14 - 0.11 - 0.95 - - 4.12
Poland - - - - - - - - - - - 0.12 - - - 1.67 - - - - 0.67 - - 2.46
Greece 0.41 0.07 - - - - 0.18 - - - 0.32 0.40 - - - 0.40 0.13 - 0.02 - 0.16 0.02 - 2.11
Lithuania - - - - - - - - - - - 0.99 - - - - 0.31 - - - 0.07 0.06 -0.02 1.40
Malta - - - - - - 0.05 - - - - 0.06 - - - - - - 0.25 - 0.01 - - 0.37
Sweden - - - - - - - - - - - 0.10 - - - - 0.08 - - - - 0.08 - 0.26
Finland - - - - - - - - - - - 0.03 - - - - 0.09 - - - - 0.02 - 0.14
Norway - - - - - - - - - - - 0.12 - - - - - - - - - 0.01 - 0.12
Gibraltar - - - - - - - - - - - - - - - - - - - - - 0.05 - 0.05
EUROPE 11.27 0.86 - - - 0.13 1.29 0.42 - - 11.18 4.16 - - 1.15 23.52 15.07 - 4.73 - 12.72 0.31 -0.91 85.89
Mexico - - - - - - - 0.35 0.18 - 1.03 - - - - - - - 0.44 - 2.89 - - 4.89
Chile - - - - - - - 0.14 - - - - - - - - - - 0.63 - 1.68 - - 2.45
Brazil - 0.07 0.05 - - 0.10 - 0.13 - - 0.20 0.25 - - - - - - 0.42 - 1.09 - - 2.32
Puerto Rico - - - - - - - - - - - - - - - - 0.06 - 1.33 - - 0.02 -0.04 1.37
Argentina - - - - - 0.03 - - - - - - - - - - - - 0.44 - 0.73 - - 1.20
Dom. Rep. - - - - - - - - - - 0.06 0.06 - - - - - - 0.85 - 0.22 - -0.03 1.15
USA - - - - - - - - - - 0.07 - - - - - - - 0.96 - - - - 1.03
Panama - - - - - - 0.03 - - - - 0.12 - - - - - - 0.05 - 0.21 0.02 - 0.43
Canada - 0.07 - - - - - - - - - - - - - - - - 0.33 - - - - 0.39
Jamaica - - - - - - - - - - - - - - - - - - 0.08 - 0.17 0.04 -0.01 0.28
Colombia - - - - - - - - - - 0.06 - - - - - - - 0.03 - 0.14 - - 0.23
AMERICAS - 0.14 0.05 - - 0.14 0.03 0.62 0.18 - 1.41 0.43 - - - - 0.06 - 5.56 - 7.13 0.07 -0.07 15.75
Kuwait 0.07 0.13 - - - - 0.06 - - - 0.37 - 0.73 - - 1.84 - - 0.14 - 0.21 - - 3.55
Jordan - - - - - - - - - - - - - - - 0.08 0.35 - 0.19 - 0.78 - - 1.40
UAE - 0.13 - 0.06 - - 0.06 - - - 0.13 - 0.06 - - - 0.13 - 0.07 0.26 0.39 0.06 - 1.36
Israel - - - - - - - - - - - - - - - - 0.12 - 0.45 - - - - 0.57
Egypt - - - - - - 0.06 - - - - - - - - - - - - - - - - 0.06
MIDDLE EAST & AFRICA 0.07 0.26 - 0.06 - - 0.18 - - - 0.50 - 0.79 - - 1.92 0.61 - 0.85 0.26 1.37 0.06 - 6.94
GLOBAL NET IMPORTS 12.23 4.41 0.05 75.39 6.41 1.27 3.45 2.80 15.47 26.21 20.84 4.72 10.26 8.23 3.80 77.80 18.15 11.17 12.50 5.83 33.75 1.56 -1.56 354.73
Quantities (in MT) received in 2019 by the importing countries from the exporting countries
Source: GIIGNL, Kpler
GIIGNL Annual Report 2020 Edition - 33
LNG imports in 2019
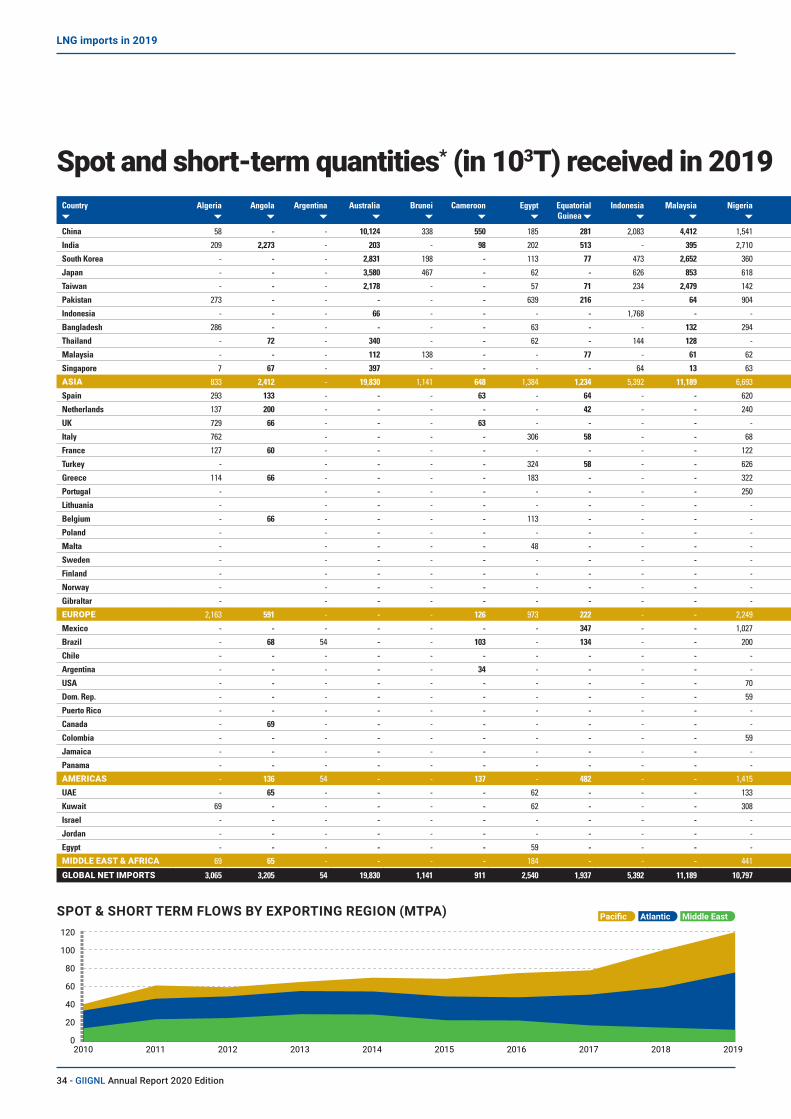
Country Algeria Angola Argentina Australia Brunei Cameroon Egypt Equatorial Guinea
Indonesia Malaysia Nigeria Norway Oman Papua New Guinea
Peru
Qatar
Russia (Arctic)
Russia (East)
Trinidad & Tobago
UAE
USA
Re-exports Received
Re-exports Loaded
2019 Net imports
China 58 - - 10,124 338 550 185 281 2,083 4,412 1,541 71 786 1,306 393 619 756 843 188 60 265 504 -71 25,294
India 209 2,273 - 203 - 98 202 513 - 395 2,710 63 820 - - 889 206 - 141 2,508 1,196 145 -68 12,503
South Korea - - - 2,831 198 - 113 77 473 2,652 360 - 128 231 459 1,033 - 446 - 182 2,426 61 - 11,670
Japan - - - 3,580 467 - 62 - 626 853 618 - 508 200 70 128 - 644 - 594 1,211 138 - 9,699
Taiwan - - - 2,178 - - 57 71 234 2,479 142 - 129 148 - 60 - 772 189 61 376 75 - 6,969
Pakistan 273 - - - - - 639 216 - 64 904 - 281 - - 745 - - - 400 453 61 - 4,036
Indonesia - - - 66 - - - - 1,768 - - - - - - - - - - - - - - 1,834
Bangladesh 286 - - - - - 63 - - 132 294 - 65 - - 321 252 - - - - 63 - 1,477
Thailand - 72 - 340 - - 62 - 144 128 - - - - - - 72 - - - 61 - - 880
Malaysia - - - 112 138 - - 77 - 61 62 - - - - - - - - - 78 66 -28 565
Singapore 7 67 - 397 - - - - 64 13 63 - - - - - - - - - 282 - -409 483
ASIA 833 2,412 - 19,830 1,141 648 1,384 1,234 5,392 11,189 6,693 135 2,718 1,885 922 3,795 1,286 2,704 518 3,805 6,349 1,113 -576 75,409
Spain 293 133 - - - 63 - 64 - - 620 - - - 200 363 725 - 647 - 2,417 - -18 5,507
Netherlands 137 200 - - - - - 42 - - 240 59 - - 280 - 2,517 - 55 - 1,237 - -139 4,629
UK 729 66 - - - 63 - - - - - 127 - - 128 95 904 - 79 - 1,985 - - 4,176
Italy 762 - - - - 306 58 - - 68 124 - - - 126 61 - 173 - 1,152 69 - 2,899
France 127 60 - - - - - - - - 122 123 - - 72 - 1,294 - 130 - 1,508 3 -611 2,826
Turkey - - - - - 324 58 - - 626 61 - - - 627 68 - 277 - 730 - - 2,772
Greece 114 66 - - - - 183 - - - 322 402 - - - 397 127 - 20 - 162 20 - 1,812
Portugal - - - - - - - - - 250 - - - - 243 72 - 109 - 503 - - 1,177
Lithuania - - - - - - - - - - 372 - - - - 240 - - - 66 57 -24 711
Belgium - 66 - - - - 113 - - - - - - - - 247 63 - - - 255 - -117 625
Poland - - - - - - - - - - 123 - - - 26 - - - - 267 - - 415
Malta - - - - - 48 - - - - 61 - - - - - - 253 - 6 - - 368
Sweden - - - - - - - - - - 104 - - - - 78 - - - - 83 - 264
Finland - - - - - - - - - - 31 - - - - 89 - - - - 16 - 135
Norway - - - - - - - - - - 113 - - - - - - - - - 5 - 118
Gibraltar - - - - - - - - - - - - - - - - - - - - 54 - 54
EUROPE 2,163 591 - - - 126 973 222 - - 2,249 1,699 - - 679 2,123 6,236 - 1,743 - 10,288 307 -908 28,489
Mexico - - - - - - - 347 - - 1,027 - - - - - - - 444 - 2,892 - - 4,709
Brazil - 68 54 - - 103 - 134 - - 200 247 - - - - - - 417 - 1,094 - - 2,316
Chile - - - - - - - - - - - - - - - - - - - - 1,267 - - 1,267
Argentina - - - - - 34 - - - - - - - - - - - - 441 - 725 - - 1,200
USA - - - - - - - - - - 70 - - - - - - - 844 - - - - 915
Dom. Rep. - - - - - - - - - - 59 - - - - - - - 250 - 215 - -31 493
Puerto Rico - - - - - - - - - - - - - - - - 58 - 344 - - 21 -35 388
Canada - 69 - - - - - - - - - - - - - - - - 210 - - - - 279
Colombia - - - - - - - - - - 59 - - - - - - - 30 - 141 - - 231
Jamaica - - - - - - - - - - - - - - - - - - 58 - 139 35 -6 226
Panama - - - - - - - - - - - - - - - - - - 19 - 89 16 - 125
AMERICAS - 136 54 - - 137 - 482 - - 1,415 247 - - - - 58 - 3,057 - 6,562 73 -73 12,148
UAE - 65 - - - - 62 - - - 133 - 62 - - - 132 - 66 133 385 64 - 1,104
Kuwait 69 - - - - - 62 - - - 308 - 527 - - - - - - - 134 - - 1,101
Israel - - - - - - - - - - - - - - - - 123 - 449 - - - - 572
Jordan - - - - - - - - - - - - - - - - - - - - 72 - - 72
Egypt - - - - - - 59 - - - - - - - - - - - - - - - - 59
MIDDLE EAST & AFRICA 69 65 - - - - 184 - - - 441 - 590 - - - 255 - 515 133 591 64 - 2,908
GLOBAL NET IMPORTS 3,065 3,205 54 19,830 1,141 911 2,540 1,937 5,392 11,189 10,797 2,080 3,308 1,885 1,602 5,917 7,835 2,704 5,833 3,938 23,790 1,557 -1,557 118,954
Spot and short-term quantities* (in 103T) received in 2019 by the importing countries from the exporting countries
SPOT & SHORT TERM FLOWS BY EXPORTING REGION (MTPA)120
100
80
60
40
20
0
AtlanticPacific Middle East
2010 2011 2012 2013 2014 2015 2016 2017 2018 2019
34 - GIIGNL Annual Report 2020 Edition
LNG imports in 2019

Country Algeria Angola Argentina Australia Brunei Cameroon Egypt Equatorial Guinea
Indonesia Malaysia Nigeria Norway Oman Papua New Guinea
Peru
Qatar
Russia (Arctic)
Russia (East)
Trinidad & Tobago
UAE
USA
Re-exports Received
Re-exports Loaded
2019 Net imports
China 58 - - 10,124 338 550 185 281 2,083 4,412 1,541 71 786 1,306 393 619 756 843 188 60 265 504 -71 25,294
India 209 2,273 - 203 - 98 202 513 - 395 2,710 63 820 - - 889 206 - 141 2,508 1,196 145 -68 12,503
South Korea - - - 2,831 198 - 113 77 473 2,652 360 - 128 231 459 1,033 - 446 - 182 2,426 61 - 11,670
Japan - - - 3,580 467 - 62 - 626 853 618 - 508 200 70 128 - 644 - 594 1,211 138 - 9,699
Taiwan - - - 2,178 - - 57 71 234 2,479 142 - 129 148 - 60 - 772 189 61 376 75 - 6,969
Pakistan 273 - - - - - 639 216 - 64 904 - 281 - - 745 - - - 400 453 61 - 4,036
Indonesia - - - 66 - - - - 1,768 - - - - - - - - - - - - - - 1,834
Bangladesh 286 - - - - - 63 - - 132 294 - 65 - - 321 252 - - - - 63 - 1,477
Thailand - 72 - 340 - - 62 - 144 128 - - - - - - 72 - - - 61 - - 880
Malaysia - - - 112 138 - - 77 - 61 62 - - - - - - - - - 78 66 -28 565
Singapore 7 67 - 397 - - - - 64 13 63 - - - - - - - - - 282 - -409 483
ASIA 833 2,412 - 19,830 1,141 648 1,384 1,234 5,392 11,189 6,693 135 2,718 1,885 922 3,795 1,286 2,704 518 3,805 6,349 1,113 -576 75,409
Spain 293 133 - - - 63 - 64 - - 620 - - - 200 363 725 - 647 - 2,417 - -18 5,507
Netherlands 137 200 - - - - - 42 - - 240 59 - - 280 - 2,517 - 55 - 1,237 - -139 4,629
UK 729 66 - - - 63 - - - - - 127 - - 128 95 904 - 79 - 1,985 - - 4,176
Italy 762 - - - - 306 58 - - 68 124 - - - 126 61 - 173 - 1,152 69 - 2,899
France 127 60 - - - - - - - - 122 123 - - 72 - 1,294 - 130 - 1,508 3 -611 2,826
Turkey - - - - - 324 58 - - 626 61 - - - 627 68 - 277 - 730 - - 2,772
Greece 114 66 - - - - 183 - - - 322 402 - - - 397 127 - 20 - 162 20 - 1,812
Portugal - - - - - - - - - 250 - - - - 243 72 - 109 - 503 - - 1,177
Lithuania - - - - - - - - - - 372 - - - - 240 - - - 66 57 -24 711
Belgium - 66 - - - - 113 - - - - - - - - 247 63 - - - 255 - -117 625
Poland - - - - - - - - - - 123 - - - 26 - - - - 267 - - 415
Malta - - - - - 48 - - - - 61 - - - - - - 253 - 6 - - 368
Sweden - - - - - - - - - - 104 - - - - 78 - - - - 83 - 264
Finland - - - - - - - - - - 31 - - - - 89 - - - - 16 - 135
Norway - - - - - - - - - - 113 - - - - - - - - - 5 - 118
Gibraltar - - - - - - - - - - - - - - - - - - - - 54 - 54
EUROPE 2,163 591 - - - 126 973 222 - - 2,249 1,699 - - 679 2,123 6,236 - 1,743 - 10,288 307 -908 28,489
Mexico - - - - - - - 347 - - 1,027 - - - - - - - 444 - 2,892 - - 4,709
Brazil - 68 54 - - 103 - 134 - - 200 247 - - - - - - 417 - 1,094 - - 2,316
Chile - - - - - - - - - - - - - - - - - - - - 1,267 - - 1,267
Argentina - - - - - 34 - - - - - - - - - - - - 441 - 725 - - 1,200
USA - - - - - - - - - - 70 - - - - - - - 844 - - - - 915
Dom. Rep. - - - - - - - - - - 59 - - - - - - - 250 - 215 - -31 493
Puerto Rico - - - - - - - - - - - - - - - - 58 - 344 - - 21 -35 388
Canada - 69 - - - - - - - - - - - - - - - - 210 - - - - 279
Colombia - - - - - - - - - - 59 - - - - - - - 30 - 141 - - 231
Jamaica - - - - - - - - - - - - - - - - - - 58 - 139 35 -6 226
Panama - - - - - - - - - - - - - - - - - - 19 - 89 16 - 125
AMERICAS - 136 54 - - 137 - 482 - - 1,415 247 - - - - 58 - 3,057 - 6,562 73 -73 12,148
UAE - 65 - - - - 62 - - - 133 - 62 - - - 132 - 66 133 385 64 - 1,104
Kuwait 69 - - - - - 62 - - - 308 - 527 - - - - - - - 134 - - 1,101
Israel - - - - - - - - - - - - - - - - 123 - 449 - - - - 572
Jordan - - - - - - - - - - - - - - - - - - - - 72 - - 72
Egypt - - - - - - 59 - - - - - - - - - - - - - - - - 59
MIDDLE EAST & AFRICA 69 65 - - - - 184 - - - 441 - 590 - - - 255 - 515 133 591 64 - 2,908
GLOBAL NET IMPORTS 3,065 3,205 54 19,830 1,141 911 2,540 1,937 5,392 11,189 10,797 2,080 3,308 1,885 1,602 5,917 7,835 2,704 5,833 3,938 23,790 1,557 -1,557 118,954
Spot and short-term quantities* (in 103T) received in 2019 by the importing countries from the exporting countries
SHARE OF SPOT & SHORT TERM VS. TOTAL LNG TRADE (MTPA/%)120 48%
100
80
60
40 16%
24%
32%
40%
8%20
0 0%2010 2011 2012 2013 2014 2015 2016 2017 2018 2019
* Quantities delivered under contracts of a duration of 4 years or less. Source: GIIGNL, Kpler
GIIGNL Annual Report 2020 Edition - 35
LNG imports in 2019

International re-exports
Re-exporting Country Import CountryRe-exported Volume (MT)
Total (MT)
Belgium
China 0.07
0.12Gibraltar 0.004
Norway 0.003
Sweden 0.04
France
Bangladesh 0.06
0.61
China 0.26
Greece 0.02
India 0.15
Lithuania 0.06
UAE 0.06
LithuaniaFinland 0.01
0.02Sweden 0.02
Netherlands
Finland 0.01
0.14
Gibraltar 0.04
Italy 0.07
Norway 0.002
Sweden 0.02
Spain
France 0.003
0.02Gibraltar 0.02
Greece 0.001
EUROPE 0.91
China Japan 0.07 0.07
India China 0.07 0.07
Malaysia China 0.03 0.03
Singapore
China 0.08
0.41
Japan 0.07
Malaysia 0.07
Pakistan 0.06
South Korea 0.06
Taiwan 0.07
ASIA 0.58
Dom. Rep.Panama 0.01
0.03Puerto Rico 0.02
Jamaica Panama 0.01 0.01
Puerto Rico Jamaica 0.04 0.04
AMERICAS 0.07
WORLD 1.56
RE-EXPORTS LOADED BY RELOADING COUNTRY IN 2019 (1.6 MT)
RE-EXPORTS RECEIVED BY RECEIVING COUNTRY IN 2019 (1.6 MT)
(Based on cargoes received in 2019)
Source: GIIGNL, Kpler
France: 39.2%
China: 32.4%
India: 9.3%
Japan: 8.9%Sweden: 5.3%
Taiwan: 4.8%
Italy: 4.4%
Malaysia: 4.2%
Jordan: 4.1%
Bangladesh: 4.1%
Pakistan: 3.9%
South Korea: 3.9%
Lithuania: 3.7%
Other: 10.9%
Netherlands: 8.9%
Belgium: 7.5%
China: 4.5%
India: 4.4%
Puerto Rico: 2.3%
Other: 6.9%
Singapore: 26.3%
36 - GIIGNL Annual Report 2020 Edition
LNG imports in 2019

Major LNG flows in 2019
EXPORT IMPORT
Algeria Bangladesh
Belgium
China
France
India
Italy
Japan
Mexico
Pakistan
Portugal
Netherlands
Spain
South Korea
Taiwan
Turkey
BETWEEN 2 AND 3 MT BETWEEN 3 AND 5 MT BETWEEN 5 AND 10 MT > 10 MT
UK
Angola
Australia
Brunei
Indonesia
Malaysia
Nigeria
Oman
Papua New Guinea
Qatar
Russia
USA
UAE
Trinidad & Tobago
GIIGNL Annual Report 2020 Edition - 37
LNG imports in 2019

ArgentinaIn June, Exmar completed the commissioning of Tango FLNG (0.5 MTPA), former Caribbean FLNG, redeployed to the Port of Bahía Blanca. Argentina has joined the LNG exporting countries’ club, with an initial plan to export 0.5 MTPA of LNG sourced from Vaca Muerta shale gas produced in the Neuquén Basin.
AustraliaIn 2020, Australia is expected to surpass Qatar as the world’s largest LNG exporting country on an an-nual basis as newly commissioned projects in Aus-tralia ramp up production. In June, the first shipment of LNG departed from Shell’s Prelude FLNG facility (3.6 MTPA) located 475 km North East of Broome in Western Australia.
CameroonKribi FLNG started operations in 2018 and produced 1.2 MT of LNG in 2019 from two out of the four lique-faction trains installed in the vessel. Golar LNG, the operator, has discussed with Perenco and Société Nationale des Hydrocarbures the utilization of the remaining two trains to increase output to 2.4 MTPA.
CanadaPieridae Energy, the developer of Goldboro LNG pro-ject closed the acquisition of all of Shell’s midstream and upstream assets in the southern Alberta Foothills in October. This transaction will help the company se-cure the natural gas supply needed for the first train of the Goldboro LNG project.In July, Woodfibre LNG was granted a permit from the BC Oil and Gas Commission, allowing the start of construction. The project signed a binding SPA with BP for the delivery of 0.75 MTPA of LNG over 15 years with first delivery expected in 2023. It involves the construction and operation of an LNG export facility, with a storage capacity of 250,000 m3 and production capacity of approximately 2.1 MTPA of LNG.In December, the Canada Energy Regulator approved an application from Chevron, the developer of Kitimat LNG to export LNG for a term of 40 years. Chevron has since revealed plans to sell its 50 percent share in the project.
EgyptEgypt increased LNG exports from the Idku liquefac-tion plant to 3.45 MT in 2019 compared to 1.44 MT in 2018. Idku has two trains each with a nameplate liquefaction capacity of 3.6 MTPA of LNG.
In February 2020, Eni signed a series of agreements with the Arab Republic of Egypt, the Egyptian Gene-ral Petroleum Corporation, the Egyptian Natural Gas Holding Company and Naturgy for the restart of the Damietta liquefaction plant by June 2020, which has been idle since November 2012.
IndonesiaIn July, SKK Migas, the Indonesian upstream oil and gas regulator, reported that start-up of Tangguh LNG Train 3 will be delayed by one year from its initial target of the third quarter of 2020 to the third quarter of 2021. Train 3 is expected to add a production capacity of 3.8 MTPA of LNG, bringing the total capacity of Tang-guh to 11.4 MTPA.In July, INPEX and Shell received official approval from Indonesian government authorities for the revised development plan of the Abadi LNG project with an onshore liquefaction plant. This approval followed the signing of an amendment to the PSC including a 7 year additional time allocation and a 20 year extension for the project. The project is expected to have a capacity of 9.5 MTPA of LNG with start-up around 2028.
MalaysiaIn May, PETRONAS started LNG production from its PFLNG Satu at the Kebabangan cluster field, 90 km offshore Sabah. Operated by Kebabangan Petroleum Operating Company, Kebabangan field is the second location for PFLNG Satu after its initial operation in the Kanowit field, offshore Sarawak.PFLNG Dua was delivered to PETRONAS from the EPCIC consortium of the floating LNG facility. PFLNG Dua will be moored over the Rotan Gas Field located 140 km offshore Kota Kinabalu, Sabah, with the capacity to produce 1.5 MTPA of LNG. The first cargo is expected to be delivered in the 2nd half of 2020.
Mauritania/SenegalIn February, Golar LNG signed a lease and operating agreement with BP for chartering an FLNG unit for the Greater Tortue Ahmeyim project located offshore Mauritania and Senegal. The facility is expected to start producing approximately 2.5 MTPA of LNG in 2022.
MexicoIn March 2019, Energía Costa Azul LNG project re-ceived two authorizations from the U.S. Department of Energy (DOE) to export U.S. produced natural gas
Liquefaction plantsIn 2019, global liquefaction capaci-ty increased by 21 MTPA to reach a total nameplate capacity of around 427 MTPA at year-end.
5 new large-scale liquefaction pro-jects started commercial operations in 2019: 4 onshore in the United States (Cameron LNG Train 1, the first two trains at Corpus Christi LNG, Freeport LNG Train 1 and the first two trains at Elba Island) and 1 off-shore in Australia (Prelude FLNG). In addition, 2 small-scale liquefaction plants started-up exports: 1 onshore in Russia (Vysotsk LNG) and 1 float-ing unit in Argentina (Tango FLNG).
2019 was a record year in terms of Final Investment Decision (FID) in liquefaction projects. Six FIDs were taken during the year: Calca-sieu Pass (10 MTPA), Golden Pass (15.6 MTPA) and Sabine Pass Train 6 (4.5 MTPA) in the U.S., Mozambique LNG (12.9 MTPA) in Mozambique, Arctic LNG-2 (19.8 MTPA) in Russia and NLNG Train 7 (7.6 MTPA includ-ing the debottlenecking of existing facilities) in Nigeria, are expected to add almost 71 MTPA of liquefaction capacity by the mid-2020s.
At the end of the year, approximate-ly 123 MTPA of new liquefaction capacity was under construction including the projects sanctioned in 2019. 54% of the capacity under construction was located in North America. The U.S. will continue to drive the capacity increase, with around 18 MTPA of new capacity ex-pected to come online in 2020.
38 - GIIGNL Annual Report 2020 Edition
Liquefaction plants

to Mexico and to re-export LNG to countries that do not have a free-trade agreement with the U.S, for its Phase 1 and Phase 2 liquefaction projects. Phase 1 of the project includes a single train LNG facility to be located adjacent to the existing LNG receiving termi-nal, which is expected to utilize the existing storage tanks, marine berth and associated facilities. Three HOAs for the supply of LNG were signed with Mitsui, Tokyo Gas and Total for 0.8 MTPA for 20 years each. FID is expected in the first quarter of 2020.
MozambiqueIn January 2020, Eni and the Area 4 partners an-nounced the launch of the hull of the Coral Sul Floating Liquefied Natural Gas (FLNG). The FLNG is part of the Coral South project that will put into pro-duction 450 billion cubic meters of gas of the Coral reservoir, offshore Mozambique. With a liquefaction capacity of 3.4 MTPA, the project was estimated to be over 60% complete and on track for production to start in 2022.Anadarko and its partners of Offshore Area 1 in Mozambique reached the FID on Mozambique LNG project in June. The project consists of two trains with a total nameplate capacity of 12.88 MTPA and gas supply from the Golfinho/Atum fields located in Offshore Area 1. In Sep-
tember, Total closed the acquisition of Anadarko’s 26.5% operated interest in the project and said that the company is planning to add two more trains. Mitsui 20%, ENH 15%, ONGC 10%, Bharat PetroResources 10%, PTTEP 8.5% and Oil India 10% are the other shareholders.In October, the Rovuma LNG project led by ExxonMo-bil and Eni awarded an EPC contract to a consortium of JGC Corporation, Fluor and TechnipFMC. The project includes the construction of two liquefaction trains with a total nameplate capacity of 15.2 MTPA of LNG as well as associated onshore facilities. FID for Rovu-ma LNG is expected in 2020.
NigeriaIn December 2019, Nigeria LNG (NLNG) took FID for its Train 7 project and the debottlenecking of existing facilities, which will increase the capacity of NLNG’s plant from the existing 22 MTPA to around 30 MTPA. The construction period will be approximately five years with first LNG expected in 2024.
OmanIn September 2019, Oman LNG kicked-off the debot-tlenecking of the plant, which is expected to boost the nameplate capacity from 10.4 MTPA to 11.4 MTPA. The process is expected to be completed by 2021.
Papua New Guinea In April 2019, Total, ExxonMobil and Oil Search signed a Gas Agreement with the Independent State of Papua New Guinea defining the fiscal framework for the Papua LNG Project, which will consist of two LNG trains of 2.7 MTPA capacity each. This agreement allows the partners to enter the FEED phase of study. The gas production will be operated by Total and the LNG plant will be developed in synergy with Exxon-Mobil-operated PNG LNG project through an expan-sion of the existing plant in Caution Bay.
QatarIn November, Qatar Petroleum (QP) announced that it aims to increase Qatar’s LNG production capacity to 126 MTPA by 2027, representing an increase of 64% from the current 77 MTPA.
RussiaAt the end of March 2020, the commissioning of Yamal LNG Train 4 was scheduled to start up in Q3 2020. In April 2019, Vysotsk LNG commenced its produc-tion. It is a small-scale LNG project with a liquefaction capacity of 0.66 MTPA located in Russia’s Baltic Sea port of Vysotsk. The project includes a 42,000 m3 LNG storage tank and an offloading berth for LNG carriers with a capacity of up to 30,000 m3.
GIIGNL Annual Report 2020 Edition - 39
Liquefaction plants
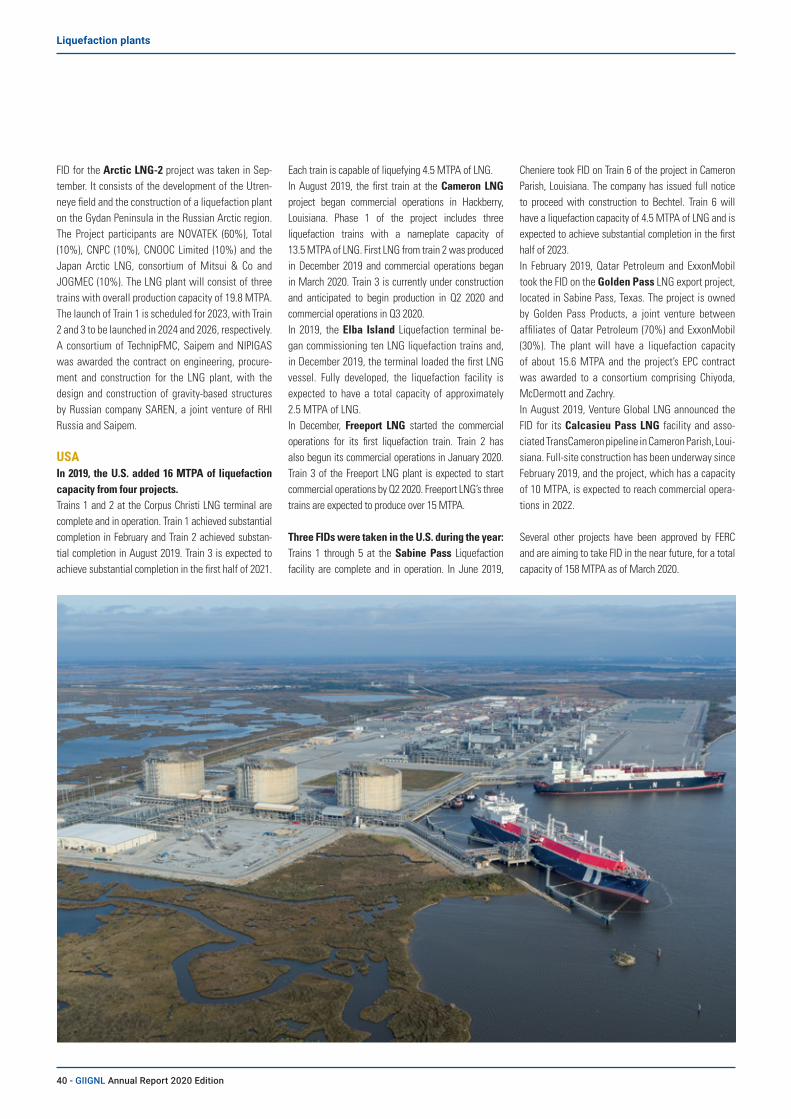
FID for the Arctic LNG-2 project was taken in Sep-tember. It consists of the development of the Utren-neye field and the construction of a liquefaction plant on the Gydan Peninsula in the Russian Arctic region. The Project participants are NOVATEK (60%), Total (10%), CNPC (10%), CNOOC Limited (10%) and the Japan Arctic LNG, consortium of Mitsui & Co and JOGMEC (10%). The LNG plant will consist of three trains with overall production capacity of 19.8 MTPA. The launch of Train 1 is scheduled for 2023, with Train 2 and 3 to be launched in 2024 and 2026, respectively. A consortium of TechnipFMC, Saipem and NIPIGAS was awarded the contract on engineering, procure-ment and construction for the LNG plant, with the design and construction of gravity-based structures by Russian company SAREN, a joint venture of RHI Russia and Saipem.
USAIn 2019, the U.S. added 16 MTPA of liquefaction capacity from four projects. Trains 1 and 2 at the Corpus Christi LNG terminal are complete and in operation. Train 1 achieved substantial completion in February and Train 2 achieved substan-tial completion in August 2019. Train 3 is expected to achieve substantial completion in the first half of 2021.
Each train is capable of liquefying 4.5 MTPA of LNG. In August 2019, the first train at the Cameron LNG project began commercial operations in Hackberry, Louisiana. Phase 1 of the project includes three liquefaction trains with a nameplate capacity of 13.5 MTPA of LNG. First LNG from train 2 was produced in December 2019 and commercial operations began in March 2020. Train 3 is currently under construction and anticipated to begin production in Q2 2020 and commercial operations in Q3 2020. In 2019, the Elba Island Liquefaction terminal be-gan commissioning ten LNG liquefaction trains and, in December 2019, the terminal loaded the first LNG vessel. Fully developed, the liquefaction facility is expected to have a total capacity of approximately 2.5 MTPA of LNG.In December, Freeport LNG started the commercial operations for its first liquefaction train. Train 2 has also begun its commercial operations in January 2020. Train 3 of the Freeport LNG plant is expected to start commercial operations by Q2 2020. Freeport LNG’s three trains are expected to produce over 15 MTPA.
Three FIDs were taken in the U.S. during the year:Trains 1 through 5 at the Sabine Pass Liquefaction facility are complete and in operation. In June 2019,
Cheniere took FID on Train 6 of the project in Cameron Parish, Louisiana. The company has issued full notice to proceed with construction to Bechtel. Train 6 will have a liquefaction capacity of 4.5 MTPA of LNG and is expected to achieve substantial completion in the first half of 2023.In February 2019, Qatar Petroleum and ExxonMobil took the FID on the Golden Pass LNG export project, located in Sabine Pass, Texas. The project is owned by Golden Pass Products, a joint venture between affiliates of Qatar Petroleum (70%) and ExxonMobil (30%). The plant will have a liquefaction capacity of about 15.6 MTPA and the project’s EPC contract was awarded to a consortium comprising Chiyoda, McDermott and Zachry. In August 2019, Venture Global LNG announced the FID for its Calcasieu Pass LNG facility and asso-ciated TransCameron pipeline in Cameron Parish, Loui-siana. Full-site construction has been underway since February 2019, and the project, which has a capacity of 10 MTPA, is expected to reach commercial opera-tions in 2022.
Several other projects have been approved by FERC and are aiming to take FID in the near future, for a total capacity of 158 MTPA as of March 2020.
40 - GIIGNL Annual Report 2020 Edition
Liquefaction plants
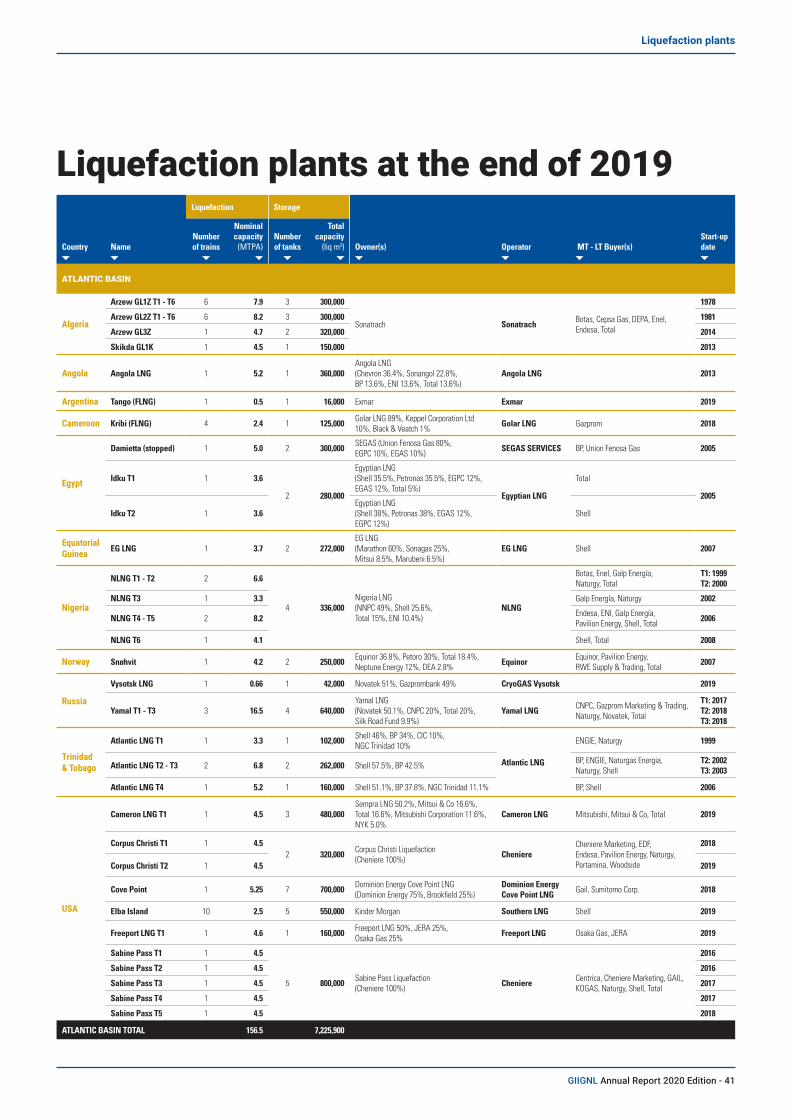
Liquefaction plants at the end of 2019Liquefaction Storage
Country NameNumber of trains
Nominal capacity
(MTPA)Number of tanks
Total capacity
(liq m3) Owner(s) Operator MT - LT Buyer(s)Start-up date
ATLANTIC BASIN
Algeria
Arzew GL1Z T1 - T6 6 7.9 3 300,000
Sonatrach Sonatrach Botas, Cepsa Gas, DEPA, Enel, Endesa, Total
1978
Arzew GL2Z T1 - T6 6 8.2 3 300,000 1981
Arzew GL3Z 1 4.7 2 320,000 2014
Skikda GL1K 1 4.5 1 150,000 2013
Angola Angola LNG 1 5.2 1 360,000Angola LNG (Chevron 36.4%, Sonangol 22.8%, BP 13.6%, ENI 13.6%, Total 13.6%)
Angola LNG 2013
Argentina Tango (FLNG) 1 0.5 1 16,000 Exmar Exmar 2019
Cameroon Kribi (FLNG) 4 2.4 1 125,000 Golar LNG 89%, Keppel Corporation Ltd 10%, Black & Veatch 1% Golar LNG Gazprom 2018
Egypt
Damietta (stopped) 1 5.0 2 300,000 SEGAS (Union Fenosa Gas 80%, EGPC 10%, EGAS 10%) SEGAS SERVICES BP, Union Fenosa Gas 2005
Idku T1 1 3.6
2 280,000
Egyptian LNG (Shell 35.5%, Petronas 35.5%, EGPC 12%, EGAS 12%, Total 5%)
Egyptian LNG
Total
2005
Idku T2 1 3.6Egyptian LNG (Shell 38%, Petronas 38%, EGAS 12%, EGPC 12%)
Shell
Equatorial Guinea EG LNG 1 3.7 2 272,000
EG LNG (Marathon 60%, Sonagas 25%, Mitsui 8.5%, Marubeni 6.5%)
EG LNG Shell 2007
Nigeria
NLNG T1 - T2 2 6.6
4 336,000Nigeria LNG (NNPC 49%, Shell 25.6%, Total 15%, ENI 10.4%)
NLNG
Botas, Enel, Galp Energía, Naturgy, Total
T1: 1999 T2: 2000
NLNG T3 1 3.3 Galp Energía, Naturgy 2002
NLNG T4 - T5 2 8.2 Endesa, ENI, Galp Energía, Pavilion Energy, Shell, Total 2006
NLNG T6 1 4.1 Shell, Total 2008
Norway Snøhvit 1 4.2 2 250,000 Equinor 36.8%, Petoro 30%, Total 18.4%, Neptune Energy 12%, DEA 2.8% Equinor Equinor, Pavilion Energy,
RWE Supply & Trading, Total 2007
Russia
Vysotsk LNG 1 0.66 1 42,000 Novatek 51%, Gazprombank 49% CryoGAS Vysotsk 2019
Yamal T1 - T3 3 16.5 4 640,000Yamal LNG (Novatek 50.1%, CNPC 20%, Total 20%, Silk Road Fund 9.9%)
Yamal LNG CNPC, Gazprom Marketing & Trading, Naturgy, Novatek, Total
T1: 2017 T2: 2018 T3: 2018
Trinidad & Tobago
Atlantic LNG T1 1 3.3 1 102,000 Shell 46%, BP 34%, CIC 10%, NGC Trinidad 10%
Atlantic LNG
ENGIE, Naturgy 1999
Atlantic LNG T2 - T3 2 6.8 2 262,000 Shell 57.5%, BP 42.5% BP, ENGIE, Naturgas Energia, Naturgy, Shell
T2: 2002 T3: 2003
Atlantic LNG T4 1 5.2 1 160,000 Shell 51.1%, BP 37.8%, NGC Trinidad 11.1% BP, Shell 2006
USA
Cameron LNG T1 1 4.5 3 480,000Sempra LNG 50.2%, Mitsui & Co 16.6%, Total 16.6%, Mitsubishi Corporation 11.6%, NYK 5.0%
Cameron LNG Mitsubishi, Mitsui & Co, Total 2019
Corpus Christi T1 1 4.52 320,000 Corpus Christi Liquefaction
(Cheniere 100%) CheniereCheniere Marketing, EDF, Endesa, Pavilion Energy, Naturgy, Pertamina, Woodside
2018
Corpus Christi T2 1 4.5 2019
Cove Point 1 5.25 7 700,000 Dominion Energy Cove Point LNG (Dominion Energy 75%, Brookfield 25%)
Dominion Energy Cove Point LNG Gail, Sumitomo Corp. 2018
Elba Island 10 2.5 5 550,000 Kinder Morgan Southern LNG Shell 2019
Freeport LNG T1 1 4.6 1 160,000 Freeport LNG 50%, JERA 25%, Osaka Gas 25% Freeport LNG Osaka Gas, JERA 2019
Sabine Pass T1 1 4.5
5 800,000 Sabine Pass Liquefaction (Cheniere 100%) Cheniere Centrica, Cheniere Marketing, GAIL,
KOGAS, Naturgy, Shell, Total
2016
Sabine Pass T2 1 4.5 2016
Sabine Pass T3 1 4.5 2017
Sabine Pass T4 1 4.5 2017
Sabine Pass T5 1 4.5 2018
ATLANTIC BASIN TOTAL 156.5 7,225,900
GIIGNL Annual Report 2020 Edition - 41
Liquefaction plants
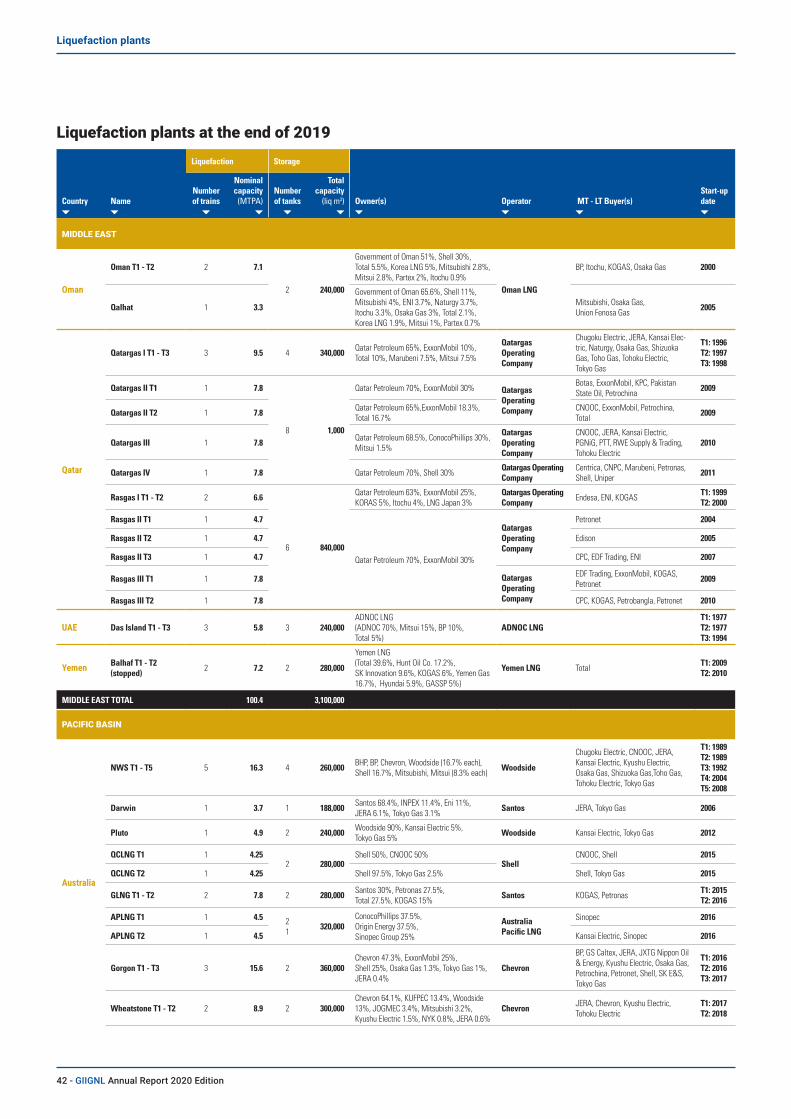
Liquefaction Storage
Country NameNumber of trains
Nominal capacity
(MTPA)Number of tanks
Total capacity
(liq m3) Owner(s) Operator MT - LT Buyer(s)Start-up date
MIDDLE EAST
Oman
Oman T1 - T2 2 7.1
2 240,000
Government of Oman 51%, Shell 30%, Total 5.5%, Korea LNG 5%, Mitsubishi 2.8%, Mitsui 2.8%, Partex 2%, Itochu 0.9%
Oman LNG
BP, Itochu, KOGAS, Osaka Gas 2000
Qalhat 1 3.3
Government of Oman 65.6%, Shell 11%, Mitsubishi 4%, ENI 3.7%, Naturgy 3.7%, Itochu 3.3%, Osaka Gas 3%, Total 2.1%, Korea LNG 1.9%, Mitsui 1%, Partex 0.7%
Mitsubishi, Osaka Gas, Union Fenosa Gas 2005
Qatar
Qatargas I T1 - T3 3 9.5 4 340,000 Qatar Petroleum 65%, ExxonMobil 10%, Total 10%, Marubeni 7.5%, Mitsui 7.5%
Qatargas Operating Company
Chugoku Electric, JERA, Kansai Elec-tric, Naturgy, Osaka Gas, Shizuoka Gas, Toho Gas, Tohoku Electric, Tokyo Gas
T1: 1996 T2: 1997 T3: 1998
Qatargas II T1 1 7.8
8 1,000
Qatar Petroleum 70%, ExxonMobil 30% Qatargas Operating Company
Botas, ExxonMobil, KPC, Pakistan State Oil, Petrochina 2009
Qatargas II T2 1 7.8 Qatar Petroleum 65%,ExxonMobil 18.3%, Total 16.7%
CNOOC, ExxonMobil, Petrochina, Total 2009
Qatargas III 1 7.8 Qatar Petroleum 68.5%, ConocoPhillips 30%, Mitsui 1.5%
Qatargas Operating Company
CNOOC, JERA, Kansai Electric, PGNiG, PTT, RWE Supply & Trading, Tohoku Electric
2010
Qatargas IV 1 7.8 Qatar Petroleum 70%, Shell 30% Qatargas Operating Company
Centrica, CNPC, Marubeni, Petronas, Shell, Uniper 2011
Rasgas I T1 - T2 2 6.6
6 840,000
Qatar Petroleum 63%, ExxonMobil 25%, KORAS 5%, Itochu 4%, LNG Japan 3%
Qatargas Operating Company Endesa, ENI, KOGAS T1: 1999
T2: 2000
Rasgas II T1 1 4.7
Qatar Petroleum 70%, ExxonMobil 30%
Qatargas Operating Company
Petronet 2004
Rasgas II T2 1 4.7 Edison 2005
Rasgas II T3 1 4.7 CPC, EDF Trading, ENI 2007
Rasgas III T1 1 7.8 Qatargas Operating Company
EDF Trading, ExxonMobil, KOGAS, Petronet 2009
Rasgas III T2 1 7.8 CPC, KOGAS, Petrobangla, Petronet 2010
UAE Das Island T1 - T3 3 5.8 3 240,000ADNOC LNG (ADNOC 70%, Mitsui 15%, BP 10%, Total 5%)
ADNOC LNGT1: 1977 T2: 1977 T3: 1994
Yemen Balhaf T1 - T2 (stopped) 2 7.2 2 280,000
Yemen LNG (Total 39.6%, Hunt Oil Co. 17.2%, SK Innovation 9.6%, KOGAS 6%, Yemen Gas 16.7%, Hyundai 5.9%, GASSP 5%)
Yemen LNG Total T1: 2009 T2: 2010
MIDDLE EAST TOTAL 100.4 3,100,000
PACIFIC BASIN
Australia
NWS T1 - T5 5 16.3 4 260,000 BHP, BP, Chevron, Woodside (16.7% each), Shell 16.7%, Mitsubishi, Mitsui (8.3% each) Woodside
Chugoku Electric, CNOOC, JERA, Kansai Electric, Kyushu Electric, Osaka Gas, Shizuoka Gas,Toho Gas, Tohoku Electric, Tokyo Gas
T1: 1989 T2: 1989 T3: 1992 T4: 2004 T5: 2008
Darwin 1 3.7 1 188,000 Santos 68.4%, INPEX 11.4%, Eni 11%, JERA 6.1%, Tokyo Gas 3.1% Santos JERA, Tokyo Gas 2006
Pluto 1 4.9 2 240,000 Woodside 90%, Kansai Electric 5%, Tokyo Gas 5% Woodside Kansai Electric, Tokyo Gas 2012
QCLNG T1 1 4.252 280,000
Shell 50%, CNOOC 50%Shell
CNOOC, Shell 2015
QCLNG T2 1 4.25 Shell 97.5%, Tokyo Gas 2.5% Shell, Tokyo Gas 2015
GLNG T1 - T2 2 7.8 2 280,000 Santos 30%, Petronas 27.5%, Total 27.5%, KOGAS 15% Santos KOGAS, Petronas T1: 2015
T2: 2016
APLNG T1 1 4.5 21 320,000
ConocoPhillips 37.5%, Origin Energy 37.5%, Sinopec Group 25%
Australia Pacific LNG
Sinopec 2016
APLNG T2 1 4.5 Kansai Electric, Sinopec 2016
Gorgon T1 - T3 3 15.6 2 360,000Chevron 47.3%, ExxonMobil 25%, Shell 25%, Osaka Gas 1.3%, Tokyo Gas 1%, JERA 0.4%
Chevron
BP, GS Caltex, JERA, JXTG Nippon Oil & Energy, Kyushu Electric, Osaka Gas, Petrochina, Petronet, Shell, SK E&S, Tokyo Gas
T1: 2016 T2: 2016 T3: 2017
Wheatstone T1 - T2 2 8.9 2 300,000Chevron 64.1%, KUFPEC 13.4%, Woodside 13%, JOGMEC 3.4%, Mitsubishi 3.2%, Kyushu Electric 1.5%, NYK 0.8%, JERA 0.6%
Chevron JERA, Chevron, Kyushu Electric, Tohoku Electric
T1: 2017 T2: 2018
Liquefaction plants at the end of 2019
42 - GIIGNL Annual Report 2020 Edition
Liquefaction plants

Liquefaction Storage
Country NameNumber of trains
Nominal capacity
(MTPA)Number of tanks
Total capacity
(liq m3) Owner(s) Operator MT - LT Buyer(s)Start-up date
AustraliaIchthys T1 - T2 2 8.9 1 165,000
INPEX 66.3%, Total 26%, CPC 2.6%, Tokyo Gas 1.6%, Kansai Electric 1.2%, Osaka Gas 1.2%, JERA 0.7%, Toho Gas 0.4%
INPEXCPC, INPEX, JERA, Kansai Electric, Kyushu Electric, Osaka Gas, Toho Gas, Tokyo Gas, Total
2018
Prelude (FLNG) 1 3.6 1 220,000 Shell 67.5%, INPEX Corporation 17.5%, KOGAS 10%, CPC 5% Shell CPC, INPEX, KOGAS, Shell 2019
Brunei Brunei T1 - T5 5 7.2 3 195,000 Brunei Government 50%, Shell 25%, Mitsubishi 25% Brunei LNG JERA, Osaka Gas, Petronas,
Shell, Tokyo Gas 1973
Indonesia
Bontang 4 11.5 6 630,000 Government of Indonesia
PT Badak NGL (Pertamina 55%, PHSS 20%, PNA 15%, Total 10%)
ENI, JERA, Kansai Electric, Kyushu Electric, Nippon Steel, Osaka Gas, PLN, Toho Gas
Tr. E: 1990 Tr. F: 1994 Tr. G: 1998 Tr. H: 1998
Tangguh T1 - T2 2 7.6 2 340,000
Tangguh LNG (BP 40.2%; CNOOC 13.9%; JX Nippon Oil & Energy 12.2%; Mitsubishi 9.9%; INPEX 7.8%; LNG Japan 7.4%; KG Berau 6.3%; Mitsui 2.3%)
Tangguh LNG CNOOC, Kansai Electric, PLN, Posco, Sempra LNG, SK E&S, Tohoku Electric 2009
Donggi-Senoro 1 2.0 1 170,000PT Donggi-Senoro LNG (Mitsubishi 45%, Pertamina 29%, KOGAS 15%, Medco 11%)
PT Donggi-Senoro LNG JERA, KOGAS, Kyushu Electric 2015
Malaysia
MLNG 1 Satu 3 8.4
6 390,000
Petronas 90%, Mitsubishi 5% Sarawak state government 5%
Petronas
Hiroshima Gas, Saibu Gas, Shikoku Electric, Tokyo Gas 1983
MLNG 2 Dua 3 9.6 Petronas 80%, Mitsubishi 10% Sarawak state government 10%
CPC, JERA, JXTG Nippon Oil & Energy, Osaka Gas, Sendai City Gas, Shizuoka Gas, Tohoku Electric, Tokyo Gas
1995
MLNG 3 Tiga 2 7.7Petronas 60%, Sarawak state government 25%, JXTG Nippon Oil & Energy 10%, Diamond Gas 5%
CNOOC, JAPEX, KOGAS, Osaka Gas, Toho Gas, Tohoku Electric, Tokyo Gas 2003
MLNG T9 1 3.6Petronas 70%, JXTG Nippon Oil & Energy 10%, PTT 10%, Sarawak state government 10%
Hokkaido Electric, Hokuriku Electric 2016
PFLNG Satu (FLNG) 1 1.2 1 180,000 Petronas Petronas 2017
Papua New Guinea
PNG LNG T1 - T2 2 6.9 2 320,000
PNG LNG (Exxon Mobil 33.2%, Oil Search 29%, Kumul Petroleum 16.8%, Santos 13.5%, JX Nippon Oil & Gas 4.7%, MRDC 2.8%)
PNG LNG BP, CNPC, CPC, JERA, Osaka Gas, Sinopec 2014
Peru Peru 1 4.45 2 260,000 Hunt Oil 50%, Shell 20%, SK Innovation 20%, Marubeni 10% Hunt Oil Shell 2010
Russia Sakhalin-2 T1 - T2 2 10.8 2 200,000Sakhalin Energy Investment Company (Gazprom 50%, Shell 27.5%, Mitsui 12.5%, Mitsubishi 10%)
Sakhalin Energy Investment Com-pany
CPC, Gazprom, Hiroshima Gas, JERA, KOGAS, Kyushu Electric, Osaka Gas, Saibu Gas, Shell, Toho Gas, Tohoku Electric, Tokyo Gas
2009
USA (Alaska) Kenai (mothballed) 1 1.5 3 108,000 Andeavour Andeavour 1969
PACIFIC BASIN TOTAL 169.7 5,406,000
WORLD TOTAL 426.6 15,731,900
GIIGNL Annual Report 2020 Edition - 43
Liquefaction plants
Australia In June, AGL selected Höegh Esperanza as the FSRU for the Crib Point project in Victoria, Australia. Höe-gh Esperanza has both a closed loop and an open loop system. It is currently chartered by CNOOC in Tianjin until June 2021.The New South Wales government awarded plan-ning approval for Australian Industrial Energy (AIE) to construct an LNG receiving terminal at Port Kembla. The project will include an FSRU, wharf infrastructure and a pipeline to connect to the existing gas network nearby. AIE selected Höegh LNG as the FSRU provider for the project and Höegh Galleon is planned to move to Port Kembla.
BahrainIn January 2020, Bahrain LNG announced that it had completed the mechanical construction and com-missioning of the LNG receiving terminal located at the port of Hidd in the Kingdom of Bahrain. The ter-minal comprises a floating storage unit (FSU) with a storage capacity of 174,000 m3, an offshore LNG receiving jetty and breakwater, an adjacent offshore regasification platform with a regasification capacity of 6.1 MTPA, subsea gas pipelines from the platform to shore, an onshore gas receiving facility, and an onshore nitrogen production facility. The commercial operations are expected to start-up in 2020.
BangladeshSummit LNG, Bangladesh’s second LNG import ter-minal located offshore Moheshkhali Island began its operations in late April 2019. Excelerate’s FSRU Summit LNG (formerly FSRU Excelerate previously moored in Abu Dhabi), was utilized for the project, with a regasification capacity of 3.8 MTPA.The government of Bangladesh is planning an onshore terminal that could handle 7.5 MTPA of LNG at Matarbari in the Cox’s Bazar district of southern Bangladesh. The process for selecting companies to build the facility under a 20-year build-own-operate-transfer basis will be conducted in 2020.In October, ACWA Power announced the signing of a MOU with the Bangladesh Power Development Board (BPDB) for a LNG-based power plant and termi-nal in Bangladesh. As part of the agreement, ACWA Power will target the development of a 3,600 MW gas-fired independent power plant as well as a re-gasification terminal located in Moheshkhali, or an alternative location.
Belgium Since December 2019, the 5th storage tank has been fully operational at the Zeebrugge LNG terminal. With a capacity of 180,000 m3, it marks the start of the long-term contract for transshipment services between Fluxys LNG and Yamal LNG. In September, Qatar Petroleum and Fluxys signed a long-term LNG Services Agreement for the Zeebrugge LNG terminal. Under the agreement, Qatar Terminal, a subsidiary of Qatar Petroleum, subscribed unloading slots at the fa-cility from the expiry of the current contracts until 2044.
BeninTotal, the Republic of Benin and the Société Bé-ninoise d’Energie Electrique have signed the Gas Supply Agreement and the Host Government Agree-ment for the development of an LNG import terminal and the supply of up to 0.5 MTPA of LNG to Benin for 15 years, starting in 2021. Total will develop and operate the regasification infrastructure that will comprise an FSRU located offshore and an offshore pipeline connected to power plants in Maria Gléta.
BrazilGolar Nanook, a FSRU with a storage capacity of 170,000 m³ reached the site of the Porto de Sergipe I Gas-to-Power project in March 2019 following a 25-year charter agreement with power company CELSE. Commercial operations of the 1,500 MW Sergipe power station are expected to commence in the 1st half of 2020.In December, BW LNG completed modification works on the FSRU BW Magna before starting a 23-year charter for the Gas Natural Açu (GNA) Gas-to-Power project in Brazil. The vessel with a storage capacity of 173,400 m³ reached Port Açu in February 2020. The GNA I power station is expected to begin operations in 2021, and GNA II, in 2023.
ChileAmeris Capital AGF Fund acquired Codelco’s stake in GNL Mejillones. A truck-loading facility has been available at the terminal since December 2019. Ship reloading facilities are under construction at the GNL Quintero terminal and the service is expected to be available as of the 2nd quarter of 2020.
ChinaTwo new regasification terminals started commercial operations in 2019. In January 2019, Fangcheng-gang LNG started up with a nameplate regasification
Regasification terminalsIn 2019, global active regasifica-tion capacity reached 920 MTPA at year-end.
42* countries imported LNG in 2019. Seven new terminals were commis-sioned, adding a combined 13 MTPA of new regasification capacity. Two terminals are based on a floa-ting solution and four are small-scale facili ties with a regasification capacity of less than 1 MTPA.
Three expansion programs were completed in India, Taiwan and Thai-land, adding 5 MTPA of LNG regasifi-cation capacity.
At the end of the year, 8 new floa-ting terminals and 18 new onshore terminals were reported to be under construction. Total regasification capacity under construction at year end reached 131 MTPA. 63% of the capacity under construction was located in Asia, of which nearly half in China and India.
* Gibraltar started receiving LNG in 2019 but the territory was not added to the number of importing countries due to its specific status. Russia inaugurated a FSRU in Kaliningrad but it had not been importing yet at the time of this writing.
44 - GIIGNL Annual Report 2020 Edition
Regasification terminals
capacity of 0.6 MTPA of LNG and Shenzhen Gas terminal (capacity 0.8 MTPA) received its first com-mercial LNG cargo in August.In November, Höegh Esperanza returned to FSRU mode at the Tianjin LNG terminal. Höegh Esperan-za is in the 2nd year of a three-plus-one year FSRU/ LNG carrier time charter with CNOOC Gas & Power Trading and Marketing.Zhoushan LNG terminal is being expanded, with two more storage tanks to be delivered by 2021 to increase the receiving capacity from 3 to 5 MTPA. The temporary permission for truck distribution through the bridge connecting Zhoushan island to the main-land started from July 31, 2019.Expansion programs in other existing terminals are ongoing in Caofeidian, Ningbo, Putian, Qidong, Qing-dao and Rudong terminals. These expansions are ex-pected to add more than 15 MTPA of regasification capacity by 2021.
ColombiaIn September, SPEC LNG, Calamari, Avenir LNG and Höegh LNG announced a Joint Development Agree-ment to offer additional LNG services from SPEC LNG, Colombia’s LNG import terminal in Cartagena based on Höegh LNG’s FSRU Höegh Grace. The additional services include cool-down of conventional LNG car-riers and re-loading of small LNG cargoes for onward distribution throughout Latin America and the Carib-bean.
Croatia In July, the European Commission has approved sup-port for a Croatian LNG terminal at Krk island. The measures will support the construction and operation of an LNG receiving terminal, consisting of an FSRU and the connections to the national gas transmission network. The LNG terminal is designed to deliver up to 2 MTPA of natural gas into Croatia’s national trans-mission network from 2021.
CyprusIn August, a consortium led by the China Petroleum Pipeline Engineering Corporation, Wilhelmsen Ship Management, Aktor, Metron, and Hudong-Zhonghua Shipbuilding, was selected as the preferred bidder for the construction of an LNG terminal at Vassiliko Port in Cyprus. The terminal will include an FSRU, a jetty and onshore pipelines as well as additional facilities. The project is scheduled to be completed in 2021.
Dominican RepublicIn October, AES awarded the engineering contract for the first phase of the expansion of its Andres LNG
terminal in Santo Domingo. The project consists of a second LNG storage tank, additional vaporization facilities and the addition of 2 truck-loading bays.
El SalvadorIn December, Energía del Pacífico (EDP) completed the project financing for the LNG-to-power project under construction at the Port of Acajutla, which consists of a 378 MW natural gas-fired power plant, an FSRU, and an approximately 44 km electric trans-mission line. The project is expected to be operatio-nal in 2021. EDP has signed a contract with Shell for the supply of LNG.
Equatorial GuineaThe first LNG receiving facility was inaugurated at the Port of Akonikien in August. The facility is being built with a storage capacity of 14,000 m3 in 12 bul-let tanks, which allows LNG to be distributed on the mainland. A truck-loading station and 12 km of gas pipeline are also being installed.
FranceIn Dunkerque, the works on the LNG truck-loading bay have been completed and the commercial ope-rations are now planned to start in the 1st half of 2020. This supports the agreement between Total Marine Fuels Global Solution and Brittany Ferries to supply LNG for the first French LNG-powered cruise ferry, the Honfleur. Works to adapt the existing jetty, which can accommodate vessels from 65,000 m3 to Qmax vessels, to be able to receive small LNG vessels from 5,000 m3 are ongoing. Completion of these works is planned in 2020. Dunkerque LNG is studying potential extensions including a 2nd jetty for transshipment, a 3rd jetty for small-scale vessels and a 2nd truck-loading bay.Since September, Fos Cavaou LNG terminal can accommodate small-scale vessels with a capacity down to 5,000 m3, allowing those vessels to of-fer LNG bunkering in the port of Marseille-Fos or to deliver LNG to neighboring French and foreign Mediterranean ports. A new truck-loading facility was commissioned in October 2019 with a capacity of approximately 40 truck-loadings per day. Fosmax LNG is considering expanding the capacity of the fa-cility, which would involve the construction of one or two additional storage tanks and one additional jetty. This would allow doubling the receiving ca-pacity to 13 MTPA and an improvement of services such as transshipment and reloading of small-scale LNG carriers. FID will be made on the basis of a mar-ket consultation. In February 2020, Total completed the sale of its interest in Fosmax LNG to LNG termi-nal operator Elengy.
At Fos Tonkin, the truck-loading capacity increased from 20 to 34 trucks per day thanks to a second loa-ding bay. Following a call for subscription conducted in 2019, Elengy has announced in January 2020 that the proposed regasification capacity has been enti-rely booked until 2028.In Montoir-de-Bretagne, Elengy also conducted an Open Subscription Period (OSP) from July to No-vember 2019, which consisted of offering the rega-sification capacity that had not been subscribed yet. As a result of this commercial operation, the terminal is now fully booked up to 2035. Elengy is considering expanding above its current level as well as beyond 2035.
GermanyIn September, German LNG Terminal, the joint venture of Vopak, Oiltanking and Gasunie completed the EPC pre-qualification process to construct an onshore LNG import terminal in Brunsbüttel in Northern Germany, with subsequent EPC contract award planned before the end of April 2020. The permit request will include two tanks of 240,000 m3 as well as a jetty for vessels and barges of up to 265,000 m3. Some of the miles-tone decisions leading up to the FID will be taken in early 2020. Commercial operations will start following a construction phase that will take up to three years.The development of the first offshore German LNG regasification terminal in Wilhelmshaven also progressed during the year. Mitsui OSK Lines and Uniper signed an MoU to seal a cooperation to design and operate the FSRU. Alongside regasifi-cation and injection into the transmission grid, the FSRU will offer the possibility of loading LNG onto bunker barges or tank trucks for road transport. The FSRU has a planned send-out capacity of 7.3 MTPA and an LNG storage capacity of around 263,000 m³. In January 2019, Uniper entered into a HOA with ExxonMobil to book a share of regasification capa-city long-term.
GhanaBased on an FRU and FSU, the Tema LNG project de-veloped by Helios Investment Partners applied for fi-nancing by the African Development Bank in April 2019.
GibraltarIn May, Shell announced the opening of a new rega-sification terminal in Gibraltar that was completed by Shell and Gasnor, a 100% Shell-owned subsidiary. As a result, Gibraltar has switched from diesel-fuelled power generation to cleaner-burning natural gas, using a newly commissioned 80 MW gas-fired power plant. LNG will be stored in five double-walled stainless-steel tanks, each able to hold 1,000 m3 of LNG.
GIIGNL Annual Report 2020 Edition - 45
Regasification terminals
GreeceAccording to DESFA’s 10-year Development Plan, LNG truck-loading and bunkering infrastructure is expec-ted to be ready in 2022 and 2024 respectively at the Revithoussa terminal.DEPA acquired a 20% stake in Gastrade, the company developing an FSRU project in Alexandroupolis in Northern Greece. The FSRU will have a storage capacity of up to 170,000 m3 and a send-out capacity of 5 MTPA of LNG. It is a project of common interest (PCI), i.e a priority project of the European Union. In January 2019, Bulgartransgaz bought a 20% share in Gastrade.
Hong KongIn June, MOL entered into a long-term contract with Hong Kong LNG Terminal Ltd.to supply an FSRU, jetty operation & maintenance services and port services. MOL will utilize the MOL FSRU Challenger which has a storage capacity of 263,000 m3 and is currently em-ployed on a mid-term charter at Dörtyol in southern Tur-key. The FSRU will be delivered to Hong Kong to begin testing and commissioning when the project finishes construction, currently expected in 2021.
India In May 2019, Indian Oil Corporation commissioned the Ennore LNG terminal. This is the first LNG termi-nal on the east coast in South India. It has a regasi-fication capacity of 5 MTPA of LNG and two storage tanks of 180,000 m³ each.GSPC LNG has developed an onshore LNG termi-nal with a capacity of 5 MTPA, expandable up to 10 MTPA, at Mundra, in the state of Gujarat. The terminal includes berthing and unloading facilities for ships with a capacity ranging from 70,000 m³ to 265,000 m³ and two LNG storage tanks of 160,000 m3 each. The commissioning of the terminal was com-pleted in February 2020.H-Energy, a unit of Hiranandani group, is at an ad-vanced stage in the commissioning of India’s first FSRU-based LNG terminal project at Jaigarh Port, in Ratnagiri district of Maharashtra. Phase-I of the project consists of a jetty based FSRU with a 4.0 MMTPA capacity. H-Energy has executed an agree-ment with Total for the charter of its Cape Ann FSRU, which has a storage capacity of 145,000 m3 and is also able to reload LNG onto other LNG vessels. It is connected to the market through two major natural gas pipeline networks, namely Dabhol-Bangalore Pipeline (DBPL) and Dahej-Uran-Panvel-Dabhol Pipe-line (DUPL-DPPL) at Dabhol, Maharashtra. The FSRU was slated to arrive on site to begin commissioning in the last week of March 2020. First deliveries are expected around six to eight weeks thereafter.
Adani Ports is constructing an onshore LNG termi-nal at Dhamra port in Odisha, on India’s north-east coast. The terminal will have an initial regasification capacity of 5 MTPA, expandable to 10 MTPA and two full containment tanks of 180,000 m3 capacity each. Indian Oil and Gail have booked regasification ca-pacity for 3 MTPA and 1.5 MTPA, respectively. The terminal is expected to be commissioned during the second half of 2021.Swan Energy Ltd. is developing an offshore 5 MTPA LNG terminal at Jafrabad port in Gujarat. The FSRU was ordered from Korea’s Hyundai yard in Au-gust 2017. A jetty is planned to berth vessels up to Q-max size. The company targets completion of the construction in 2020.Atlantic Gulf & Pacific (AG&P) is developing a 1 MTPA FSRU-based LNG import facility at Karaikal Port, South India. Commercial operations are expected by the fourth quarter of 2021.HPCL Shapoorji Energy has awarded the EPC work to Toyo Engineering for a new regasification plant at Chhara in Gujarat State on the west coast of In-dia. The regasification terminal will have a send-out capacity of 5 MTPA and a storage capacity of 200,000 m3. It is scheduled to be completed at the beginning of 2022. In June, Petronet LNG completed the expansion of Dahej terminal. The nameplate regasification capa-city of the terminal is now 17.5 MTPA, after having added two vaporizers. The company commissioned India’s first LNG dispensing station and launched the first commercially approved and registered LNG bus to commute its employees. It has also commissioned its second LNG dispensing station at Kochi Terminal in 2019. Dabhol terminal in Maharashtra is in the process of developing break water facilities by 2021 - 2022, enhancing capacity to 5 MTPA. In addition, it is commissioning its third storage tank.In January 2019, Shell announced completion of the acquisition of Total’s 26% equity interest in the Hazira LNG terminal. This takes Shell’s ownership to 100%. In October 2019, Total expanded its partnership with the Adani Group to contribute to the development of the Indian natural gas market. The 50/50 partnership includes several assets across the gas value chain notably two import and regasification LNG terminals: Dhamra in East India and potentially Mundra in the West.
IndonesiaAt Arun, PTK, a subsidiary of PT Pertamina, has ac-quired an LNG-fueled tug boat to serve the terminal.In July, Höegh LNG completed class renewal afloat of PGN FSRU Lampung. The renewal was completed while the vessel remained at its offshore location.
ItalyIn May 2019, Australian fund First State Investments acquired Uniper’s 48.24% share in OLT offshore LNG Toscana. In February 2020, Snam completed the acquisition from Iren Group of a 49.07% stake of the regasification terminal.Nuove Energie, a company owned by Enel Global Trading, continues to develop an LNG regasification terminal in the industrial area of Porto Empedocle, Sicily. The project with a nominal send-out capacity of 6 MTPA is fully authorized.
JamaicaIn July, New Fortress Energy commenced operating a floating LNG regasification terminal off the coast of Old Harbour Bay in Jamaica. With a storage ca-pacity of 125,000 m3 and a regasification capacity of 3.6 MTPA of LNG, FSRU Golar Freeze will serve a 15-year charter with New Fortress Energy and supply gas-fired power plants.
JapanHokkaido Gas is currently expanding the Ishikari LNG Terminal in Hokkaido. The fourth LNG storage tank will be completed in 2020.JERA has completed the construction of two storage tanks with a capacity of 125,000 m3 each at its Futtsu terminal and has added four BOG compressors at the Chita terminal. In September MOL announced that it had participated in an LNG bunkering trial at the Port of Kobe, orga-nized by the Kobe City Port and Harbor Authority, and carried out bunkering for the LNG-fueled tugboat Ishin. This marks the first LNG bunkering in the Port of Kobe.
LithuaniaIn November, Klaipedos Nafta made a decision to ac-quire FSRU Independence by the end of 2024.
Mozambique KARMOL (Karpower International and Mitsui OSK lines) is developing a LNG-to-powership project in Nacala. The FSRU is being converted from the existing LNG carrier Dwiputra, while the powership is currently operating with heavy fuel oil to produce electricity for Electricidade de Moçambique (EDM).
NetherlandsGate terminal invested in increasing the ship loa-ding flow rate for large ships from 2,300 m3/hour to 4,000 m3/hour to lower port time for vessels.
PakistanIn January 2020, Excelerate and Engro Elengy Ter-minal signed a HOA for the expansion of the LNG
46 - GIIGNL Annual Report 2020 Edition
Regasification terminals

import terminal located in Port Qasim, Pakistan. Under the agreement, Excelerate will exchange its existing FSRU Exquisite with a newbuild FSRU, Hull 2477, currently under construction in South Korea. Hull 2477 will increase the send-out capa-city by more than 1 MTPA of LNG and increase LNG storage capacity from 150,900 m3 to 173,400 m3. Ex-celerate will take delivery of the vessel, which has been chartered from Maran Gas in April 2020, and anticipates beginning expanded operations in Pakis-tan prior to winter 2020.
PanamaIn October, AES Corporation announced the start of com-mercial operations of the first LNG storage at the AES Colón plant. AES Colón consists of the 180,000 m3 LNG tank and a 381 MW combined cycle power plant, which reached commercial operations in 2018. GasLog signed a 10-year time charter with Sino-lam LNG Terminal for the provision of a converted 155,000 m3 floating storage unit (FSU) to a gas- fired power project being developed near Colón in Panama.
PhilippinesIn September, First Gen Corporation announced that it has chosen JGC as the EPC contractor for its LNG terminal project in Batangas City. The company will look to start building the modified jetty and the ear-ly completion of this work will allow an FSRU to be brought in on an interim basis. The FSRU will allow First Gen to receive LNG as early as 2021.
PolandIn October 2019, Polskie LNG S.A. signed a contract with Selas-Linde for the purchase of two additional submerged combustion vaporisers (SCVs), key equip-ment for the expansion program of the LNG terminal in Swinoujscie. There are currently five SCV va-porizers installed in the terminal, four in operation and one redundant. Polskie LNG is planning to expand operations at the facility through three key projects: the construction of a third LNG storage tank, delivery of additional process installations increasing the regasification capacity to 7.5 billion cubic meters per year, and a transshipment facility together with a railway siding.
RussiaIn January, the commissioning ceremony for an offshore receiving terminal called Marshal Vasile-vskiy was held in the Kaliningrad region. Since then, the FSRU has been used as an LNG carrier and no imports have been recorded.
SingaporeIn February 2019 SLNG completed modifications to its second jetty at the Jurong terminal. The modi-fications included the installation of a new marine loading arm and gangway, and new facilities for securing small LNG ships at the jetty. The terminal is now able to receive and reload small LNG vessels ranging between 2,000 m3 and 10,000 m3. Pavilion Energy and Total signed a 10-year deal to develop a LNG bunker supply chain in the port of Singapore. The cooperation includes the shared long-term use of the newly built 12,000 m3 GTT Mark III LNG bunker vessel operated by MOL.
SpainEnagás has awarded a contract to Spanish engineering company Ayesa to redesign the jetty at its Huelva LNG terminal. The revamped mooring set-up will enable the loading of small-scale gas carriers, including LNG bunker vessels, and the direct loading of bunker tanks on LNG-powered vessels.
South KoreaKOGAS has completed the construction of its small-scale regasification terminal at the Aewol port on Jeju island. The LNG terminal has two LNG storage tanks with a capacity of 45,000 m3 each and regasification facilities with a capacity of 0.4 MTPA. The terminal received its first cargo which was reloaded at KOGAS’ Tongyoung terminal in September.In January 2020, KOGAS announced that it has com-menced the FEED for of its fifth regasification termi-nal in Dangjin. The terminal will include ten LNG storage tanks with a capacity of 200,000 m3 each, related regasification facilities and a jetty for vessels of up to 270,000 m3. The first phase of the construc-tion is expected to start in 2022.
TaiwanThe phase 2 expansion program at CPC’s Taichung terminal was completed at the end of 2019. The expansion includes three new LNG storage tanks with a capacity of 160,000 m3 each, related regasi-fication facilities and additional equipment. It will commence operations in early 2020.CPC’s third receiving terminal located at Datan Borough, Taoyuan in northern Taiwan is under construction and is expected to commence opera-tions in 2023.
ThailandIn January 2019, PTT completed the expansion of Map Ta Phut LNG terminal, increasing capacity from 10.7 MTPA to 11.5 MTPA. The company plans to test the reloading facilities in 2020.
PTT is also developing the Nong Fab LNG receiving terminal in Rayong. The terminal is expected to be completed in 2022. It will have a total regasification capacity of 7.5 MTPA.
TurkeyFSRU Turquoise replaced Höegh Neptune at Etki LNG import terminal. With 170,000 m3 storage, the Turquoise FSRU has a design regasification capacity of 5.7 MTPA. The vessel is capable of reloading and bunkering LNG.
VietnamA consortium of Samsung C&T and Petrovietnam Technical Services Corporation started construction of the Tibai LNG terminal in the coastal area sou-theast of Ho Chi Minh City. The facility will provide natural gas to the Nhon Trach combined cycle power plant. The terminal includes a 180,000 m3 LNG sto-rage tank and will be constructed over a 40-month period starting in June 2019. It is expected to be completed in October 2022.In September, Delta Offshore Energy (DeltaOE) and LNG Limited (LNGL) jointly announced an alliance with the Bac Lieu Provincial Government to develop an LNG-to-power project. The project includes the construction and operation of an LNG import termi-nal, a 3,200 MW combined-cycle power plant and delivery of power generation to the Bac Lieu Province. The integrated project is expected to commence operations in 2023 pending government approvals.
GIIGNL Annual Report 2020 Edition - 47
Regasification terminals

Country Site
Storage Send-out
Owner Operator
Third Party Access
Additional Services offered
Start-up date
Number of tanks
Total capacity
(liq m3)Number of vaporizers
Nominal capacity
(MTPA)
AMERICAS
Argentina
Bahia Blanca
No vessel chartered 2008
GNL Escobar Excelerate Expedient (FSRU) 151,000 6 5.2
Owner: Excelerate Energy Charterer: UTE Escobar (50% Enarsa, 50% YPF)
YPF No 2011
Brazil
Bahia
Golar Winter (FSRU) 137,000 3.8 Owner: Golar Charterer: Petrobras Petrobras No 2013
Guanabara Bay No vessel chartered 2009
Pecem Excelerate Experience (FSRU) 173,400 6 6.0 Owner: Excelerate Energy
Charterer: Petrobras Excelerate Energy No Reloading 2009
Canada Canaport LNG 3 480,000 8 7.4 Repsol (75%), Irving Oil (25%) Canaport LNG Yes 2009
ChileMejillones 1 187,000 3 1.5 ENGIE (63%), Ameris Capital
(37%) GNLM Yes Transshipment, Truck loading 2010
Quintero 3 334,000 4 4.0 Enagas (45.4%), Omers (34,6%), ENAP (20%) GNL Quintero Yes Truck loading 2009
Colombia Cartagena Höegh Grace (FSRU) 170,000 4 4.0
Owner: Höegh LNG Charterer: Sociedad Portuaria El Cayao (SPEC)
Höegh LNG No Reloading, Transshipment 2016
Dominican Rep. Andrés 1 160,000 3 1.7 AES AES No Reloading,
Truck loading 2003
JamaicaMontego Bay 1 7,000 0.5 New Fortress Energy New Fortress
Energy Truck loading 2016
Old Harbour Golar Freeze (FSRU) 125,000 3.6 Owner: Golar
Charterer: New Fortress EnergyNew Fortress Energy Reloading 2019
Mexico
Altamira 2 300,000 5 5.7 Terminal de LNG de Altamira (Vopak 60%, Enagas 40%)
Terminal de LNG de Altamira Yes 2006
Energia Costa Azul 2 320,000 6 7.6 IEnova (Sempra) IEnova (Sempra) Yes Reloading 2008
Manzanillo 2 300,000 3.8 Mitsui (37.5%), Samsung (37.5%), KOGAS (25%) Terminal KMS 2012
Panama Costa Norte 1 180,000 1.5 AES Panama (50.1%), Inver-siones Bahia (49.9%) AES Bunkering,
Truck loading 2018
Puerto Rico Peñuelas 1 160,000 2 1.5 Naturgy (47.5%), ENGIE (35%),
Mitsui (15%), GE (2.5%) Eco Electrica 2000
USA Cameron LNG 3 480,000 10 11.4 Sempra (50.2%), Total (16.6%), Mitsubishi (16.6%), Mitsui (16.6%) Cameron LNG Yes Reloading 2009
Cove Point 7 700,000 25 13.7Dominion Energy Cove Point LNG (Dominion Energy 75%, Brookfield 25%)
Dominion Energy Cove Point LNG 1978
Elba Island 5 535,000 11 12.0 Kinder Morgan Southern LNG Yes 1978
Everett 2 155,000 4 5.1 Exelon Exelon Yes Truck loading 1971
Freeport LNG 2 320,000 7 13.2 Freeport LNG Development, L.P. Freeport LNG Development Yes 2008
Golden Pass 5 775,000 8 15.7 QP (70%), ExxonMobil (30%) Golden Pass LNG No 2010
Gulf LNG 2 320,000 8.8 Kinder Morgan (50%), GE (40%), AES (10%) Gulf LNG Energy No 2011
Lake Charles 4 425,000 14 17.9 Lake Charles LNG Lake Charles LNG Yes 1982
Northeast Gateway
No vessel chartered 151,000 6 3.0 Excelerate Energy Excelerate Energy 2008
Sabine Pass 5 800,000 24 30.4 Sabine Pass LNG Cheniere Yes Reloading 2008
AMERICAS TOTAL 7,845,400 189.1
48 - GIIGNL Annual Report 2020 Edition
Regasification terminals
Regasification terminals at the end of 2019

Country Site
Storage Send-out
Owner Operator
Third Party Access
Additional Services offered
Start-up date
Number of tanks
Total capacity
(liq m3)Number of vaporizers
Nominal capacity
(MTPA)
ASIA
Bangladesh
Moheshkhali
Excelerate Excellence (FSRU) 138,000 3.8 Owner: Excelerate Energy Charterer: Petrobangla
Excelerate Energy 2018
Summit LNG
Summit LNG (FSRU) 138,000 3.8Owner: Excelerate Energy Charterer: Summit Power International
Excelerate Energy 2019
China
Beihai, Guangxi 3 480,000 2.9 Sinopec (80%), Beibu Gulf Port Group (20%) Sinopec Truck loading 2016
Caofeidian (Tangshan), Hebei 4 640,000 6.4Petrochina (51%), Beijng Entreprises (29%), Hebei Natural Gas (20%)
Petrochina Yes Truck loading 2013, 2015
Chennan, Hainan 2 40,000 0.6 Petrochina (90%), Beijing Gas Blue Sky 10% Petrochina No 2014
Dalian, Liaoning 3 480,000 3 5.7Petrochina (75%), Dalian Port Company Limited (20%), Dalian Construction Investment (5%)
Petrochina Yes Reloading, Truck loading 2011
Dapeng, Shenzhen 4 640,000 7 6.8
CNOOC (33%), Guangdong Province Consortium (31%), BP (30%), HK & China Gas (3%), Hong Kong Electric (3%)
GDLNG No Truck loading 2006
Dongguan, Guangdong 2 160,000 4 1.0 Jovo Group Jovo Truck loading 2013
Diefu, Shenzhen 4 640,000 4.0 CNOOC (70%), Shenzhen Energy Group (30%) CNOOC Truck loading 2018
Fangchenggang, Guangxi 2 60,000 1.0 CNOOC (51%), Fangchenggang Port Group Co. LTD (49%) CNOOC 2019
Haikou, Hainan 2 320,000 3.0 CNOOC (65%), Guodian Hainan Holdings New Energy (35%) CNOOC No 2014
Hua'an, Guangdong 1 80,000 0.8 Shenzhen Gas Shenzhen Gas Truck loading 2018
Ningbo, Zhejiang 3 480,000 3.0 CNOOC (51%), Zhejiang Energy (29%), Ningbo Electric (20%) CNOOC No Truck loading 2012
Putian, Fujian 6 960,000 6.3 Fujian LNG (CNOOC 60%, Fujian Inv. & Dev.Co. 40%) CNOOC No Truck loading 2008, 2011
Qidong, Jiangsu 3 260,000 1.2 Guanghui Energy Xinjiang Guan-ghui Petroleum Truck loading 2017
Qingdao, Shandong 4 640,000 6.1 Sinopec (99%), Qingdao Port Group (1%) Sinopec No Truck loading 2014
Rudong, Jiangsu 4 680,000 3 6.5Petrochina (55%), Pacific Oil & Gas (35%), Jiangsu Guoxin Investment Group (10%)
Petrochina Yes Truck loading 2011, 2016
Tianjin Höegh Esperanza (FSRU) & Onshore facilities
4 420,000 6.0Owner: Höegh LNG Charterer: CNOOC Gas & Power Trading and Marketing
Höegh LNG No Truck loading2013, 2017 (Cape Ann) 2018
Tianjin LNG 4 640,000 3.0Sinopec (98%), Tianjin Nangang Industrial Zone Developemnt Co., Ltd. (2%)
Sinopec Truck loading 2018
Wuhaogou, Shanghai 3 120,000 1.0 Shanghai Gas (Shenergy 100%) Shenergy Group No 2008
Yangshan, Shanghai 3 480,000 3.0 Shanghai LNG (CNOOC 45%, Shenergy Group Ltd 55%) Shenergy Group No 2009
Yuedong, Guangdong 3 480,000 2.0 CNOOC CNOOC No Truck loading 2017
Zhoushan, Zhejiang 2 320,000 3.0 ENN Energy ENN Energy Truck loading 2018
Zhuhai, Guangdong 3 480,000 3.5
CNOOC (35%), Yudean (GEG) (25%), Guangdong Gas Development & Investment Group Incorporated (25%), Others (15%)
CNOOC Reloading, Truck loading 2013
GIIGNL Annual Report 2020 Edition - 49
Regasification terminals

Country Site
Storage Send-out
Owner Operator
Third Party Access
Additional Services offered
Start-up date
Number of tanks
Total capacity
(liq m3)Number of vaporizers
Nominal capacity
(MTPA)
India
Dabhol 2 320,000 6 1.9 Konkan LNG Pvt. Ltd. Gail Yes 2013
Dahej 6 932,000 21 17.5 Petronet LNG Petronet LNG Yes Truck loading 2004
Ennore 2 360,000 5.0Indian Oil Corporation (90%), Tamil Nadu Industrial Develop-ment Corporation (10%)
Indian Oil Corporation 2019
Hazira 2 320,000 5 4.9 Shell Energy India Private Ltd. (Shell 100%)
Shell Energy India Private Ltd.
Nego-tiated 2005
Kochi 2 368,000 5 5.0 Petronet LNG Petronet LNG Yes
Bunkering, Cool-down, Gassing-up, Reloading, Truck loading
2013
Indonesia
Arun Regas 2 220,000 3.0PT Perta Arun Gas (Pertamina 70%, Government of Aceh 30%)
PT Perta Arun Gas Yes
Bunkering, Cool-down, Reloading
2015
Benoa FSRU 0.3 JSK Group (50%),
PT Pelindo III (50%)PT Pelindo Ener-gi Logistik (PEL) 2016
Lampung LNG PGN FSRU Lampung (FSRU) 170,000 3 2.9 Owner: Höegh LNG
Charterer: PGN Höegh LNG No 2014
Nusantara Nusantara Regas Satu (FSRU) 125,000 6 3.0 Owner: Golar LNG
Charterer: PT Nusantara Regas
PT Nusantara Regas(Pertamina & PGN)
No 2012
Japan
Chita 7 640,000 11 10.9 Chita LNG Chita LNG Yes Truck loading 1983
Chita Kyodo 4 300,000 14 7.5 Toho Gas / JERA Toho Gas Yes Truck loading 1978
Chita-Midorihama Works 3 620,000 8 7.7 Toho Gas Toho Gas Yes Truck loading 2001
Futtsu 12 1,360,000 13 19.1 JERA JERA Yes Truck loading 1985
Hachinohe 2 280,000 5 1.0 JXTG Nippon Oil & Energy JX Nippon LNG Service Yes Reloading,
Truck loading 2015
Hatsukaichi 2 170,000 4 0.8 Hiroshima Gas Hiroshima Gas No Truck loading 1996
Hibiki 2 360,000 5 2.4 Hibiki LNG (Saibu Gas 90%, Kyushu Electric 10%) Hibiki LNG Yes
Cool-down services, Gas test services, Truck loading
2014
Higashi-Ohgishima 9 540,000 9 13.2 JERA JERA Yes 1984
Himeji 8 740,000 7 5.9 Osaka Gas Osaka Gas Yes Reloading, Truck loading 1979
Himeji LNG 7 520,000 8 8.1 Kansai Electric Kansai Electric Yes Truck loading 1979
Hitachi 1 230,000 5 5.3 Tokyo Gas Tokyo Gas Yes Reloading, Truck loading 2016
Ishikari 3 610,000 7 4.6 Hokkaido Gas / Hokkaido Electric Hokkaido Gas
Yes (No.1,2 tank) No (No.3 tank)
Reloading, Truck loading 2012
Joetsu 3 540,000 8 2.4 JERA JERA No Truck loading 2011
Kagoshima 2 86,000 3 0.2 Nippon Gas Nippon Gas No Truck loading 1996
Kawagoe 6 840,000 7 4.9 JERA JERA Yes Truck loading 1997
Minato 1 80,000 3 0.3 Gas Bureau, City of Sendai Gas Bureau, City of Sendai No Truck loading 1997
Mizushima 2 320,000 6 4.3 Mizushima LNG Mizushima LNG Yes Truck loading 2006
Nagasaki 1 35,000 3 0.1 Saibu Gas Saibu Gas Yes Truck loading 2003
Naoetsu 2 360,000 4 2.1 INPEX Corporation INPEX Corpo-ration Yes 2013
Negishi 14 1,180,000 14 12.0 Tokyo Gas / JERA Tokyo Gas Yes Truck loading 1969
Niigata 8 720,000 13 8.5 Nihonkai LNG Nihonkai LNG Yes 1984
Ohgishima 4 850,000 12 10.4 Tokyo Gas Tokyo Gas Yes 1998
50 - GIIGNL Annual Report 2020 Edition
Regasification terminals
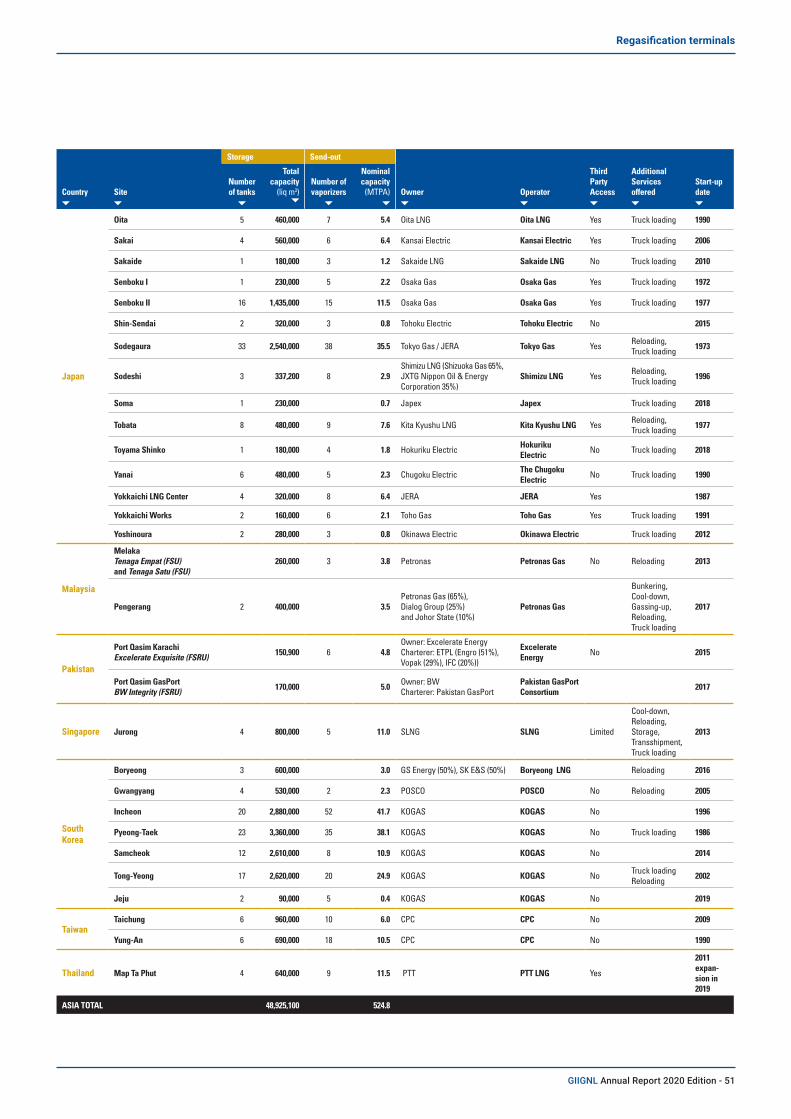
Country Site
Storage Send-out
Owner Operator
Third Party Access
Additional Services offered
Start-up date
Number of tanks
Total capacity
(liq m3)Number of vaporizers
Nominal capacity
(MTPA)
Japan
Oita 5 460,000 7 5.4 Oita LNG Oita LNG Yes Truck loading 1990
Sakai 4 560,000 6 6.4 Kansai Electric Kansai Electric Yes Truck loading 2006
Sakaide 1 180,000 3 1.2 Sakaide LNG Sakaide LNG No Truck loading 2010
Senboku I 1 230,000 5 2.2 Osaka Gas Osaka Gas Yes Truck loading 1972
Senboku II 16 1,435,000 15 11.5 Osaka Gas Osaka Gas Yes Truck loading 1977
Shin-Sendai 2 320,000 3 0.8 Tohoku Electric Tohoku Electric No 2015
Sodegaura 33 2,540,000 38 35.5 Tokyo Gas / JERA Tokyo Gas Yes Reloading, Truck loading 1973
Sodeshi 3 337,200 8 2.9Shimizu LNG (Shizuoka Gas 65%, JXTG Nippon Oil & Energy Corporation 35%)
Shimizu LNG Yes Reloading, Truck loading 1996
Soma 1 230,000 0.7 Japex Japex Truck loading 2018
Tobata 8 480,000 9 7.6 Kita Kyushu LNG Kita Kyushu LNG Yes Reloading, Truck loading 1977
Toyama Shinko 1 180,000 4 1.8 Hokuriku Electric Hokuriku Electric No Truck loading 2018
Yanai 6 480,000 5 2.3 Chugoku Electric The Chugoku Electric No Truck loading 1990
Yokkaichi LNG Center 4 320,000 8 6.4 JERA JERA Yes 1987
Yokkaichi Works 2 160,000 6 2.1 Toho Gas Toho Gas Yes Truck loading 1991
Yoshinoura 2 280,000 3 0.8 Okinawa Electric Okinawa Electric Truck loading 2012
Malaysia
Melaka Tenaga Empat (FSU) and Tenaga Satu (FSU)
260,000 3 3.8 Petronas Petronas Gas No Reloading 2013
Pengerang 2 400,000 3.5Petronas Gas (65%), Dialog Group (25%) and Johor State (10%)
Petronas Gas
Bunkering, Cool-down, Gassing-up, Reloading, Truck loading
2017
Pakistan
Port Qasim Karachi Excelerate Exquisite (FSRU) 150,900 6 4.8
Owner: Excelerate Energy Charterer: ETPL (Engro (51%), Vopak (29%), IFC (20%))
Excelerate Energy No 2015
Port Qasim GasPort BW Integrity (FSRU) 170,000 5.0 Owner: BW
Charterer: Pakistan GasPortPakistan GasPort Consortium 2017
Singapore Jurong 4 800,000 5 11.0 SLNG SLNG Limited
Cool-down, Reloading, Storage, Transshipment, Truck loading
2013
South Korea
Boryeong 3 600,000 3.0 GS Energy (50%), SK E&S (50%) Boryeong LNG Reloading 2016
Gwangyang 4 530,000 2 2.3 POSCO POSCO No Reloading 2005
Incheon 20 2,880,000 52 41.7 KOGAS KOGAS No 1996
Pyeong-Taek 23 3,360,000 35 38.1 KOGAS KOGAS No Truck loading 1986
Samcheok 12 2,610,000 8 10.9 KOGAS KOGAS No 2014
Tong-Yeong 17 2,620,000 20 24.9 KOGAS KOGAS No Truck loading Reloading 2002
Jeju 2 90,000 5 0.4 KOGAS KOGAS No 2019
TaiwanTaichung 6 960,000 10 6.0 CPC CPC No 2009
Yung-An 6 690,000 18 10.5 CPC CPC No 1990
Thailand Map Ta Phut 4 640,000 9 11.5 PTT PTT LNG Yes
2011 expan-sion in 2019
ASIA TOTAL 48,925,100 524.8
GIIGNL Annual Report 2020 Edition - 51
Regasification terminals
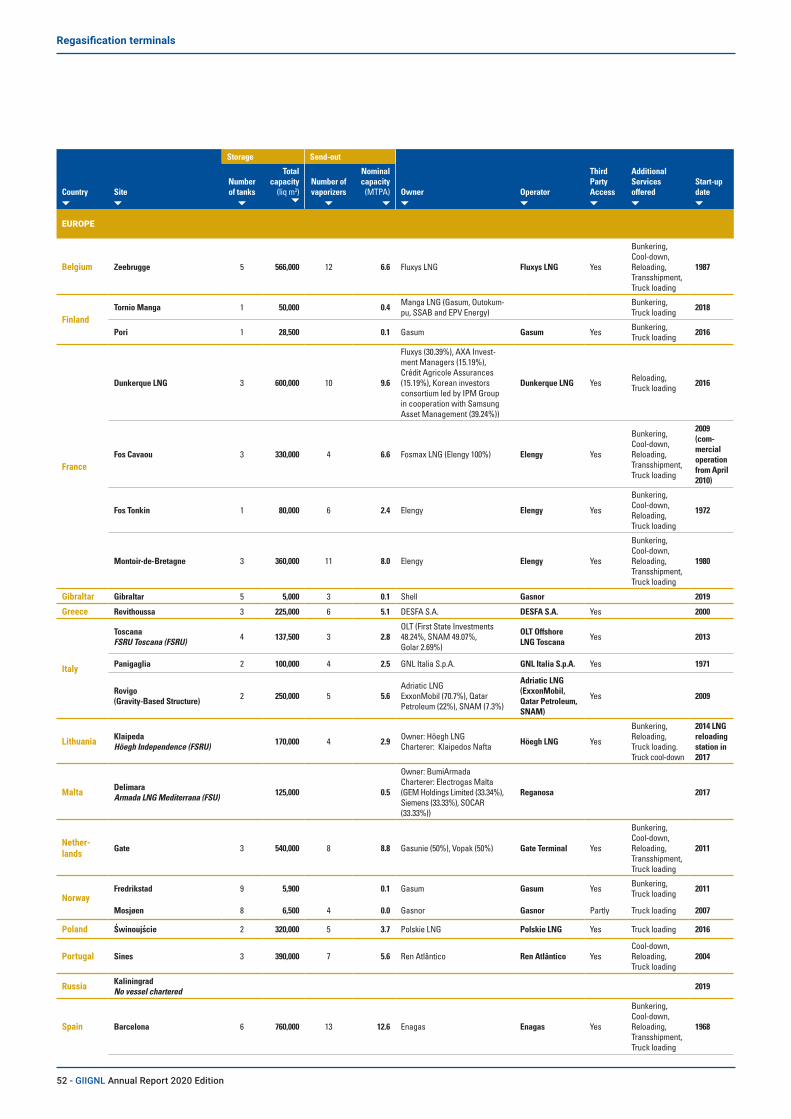
Country Site
Storage Send-out
Owner Operator
Third Party Access
Additional Services offered
Start-up date
Number of tanks
Total capacity
(liq m3)Number of vaporizers
Nominal capacity
(MTPA)
EUROPE
Belgium Zeebrugge 5 566,000 12 6.6 Fluxys LNG Fluxys LNG Yes
Bunkering, Cool-down, Reloading, Transshipment, Truck loading
1987
FinlandTornio Manga 1 50,000 0.4 Manga LNG (Gasum, Outokum-
pu, SSAB and EPV Energy)Bunkering, Truck loading 2018
Pori 1 28,500 0.1 Gasum Gasum Yes Bunkering, Truck loading 2016
France
Dunkerque LNG 3 600,000 10 9.6
Fluxys (30.39%), AXA Invest-ment Managers (15.19%), Crédit Agricole Assurances (15.19%), Korean investors consortium led by IPM Group in cooperation with Samsung Asset Management (39.24%))
Dunkerque LNG Yes Reloading, Truck loading 2016
Fos Cavaou 3 330,000 4 6.6 Fosmax LNG (Elengy 100%) Elengy Yes
Bunkering, Cool-down, Reloading, Transshipment, Truck loading
2009 (com-mercial operation from April 2010)
Fos Tonkin 1 80,000 6 2.4 Elengy Elengy Yes
Bunkering, Cool-down, Reloading, Truck loading
1972
Montoir-de-Bretagne 3 360,000 11 8.0 Elengy Elengy Yes
Bunkering, Cool-down, Reloading, Transshipment, Truck loading
1980
Gibraltar Gibraltar 5 5,000 3 0.1 Shell Gasnor 2019
Greece Revithoussa 3 225,000 6 5.1 DESFA S.A. DESFA S.A. Yes 2000
Italy
Toscana FSRU Toscana (FSRU) 4 137,500 3 2.8
OLT (First State Investments 48.24%, SNAM 49.07%, Golar 2.69%)
OLT Offshore LNG Toscana Yes 2013
Panigaglia 2 100,000 4 2.5 GNL Italia S.p.A. GNL Italia S.p.A. Yes 1971
Rovigo
(Gravity-Based Structure) 2 250,000 5 5.6Adriatic LNG ExxonMobil (70.7%), Qatar Petroleum (22%), SNAM (7.3%)
Adriatic LNG (ExxonMobil, Qatar Petroleum, SNAM)
Yes 2009
Lithuania Klaipeda Höegh Independence (FSRU) 170,000 4 2.9 Owner: Höegh LNG
Charterer: Klaipedos Nafta Höegh LNG Yes
Bunkering, Reloading, Truck loading. Truck cool-down
2014 LNG reloading station in 2017
Malta Delimara Armada LNG Mediterrana (FSU) 125,000 0.5
Owner: BumiArmada Charterer: Electrogas Malta (GEM Holdings Limited (33.34%), Siemens (33.33%), SOCAR (33.33%))
Reganosa 2017
Nether-lands Gate 3 540,000 8 8.8 Gasunie (50%), Vopak (50%) Gate Terminal Yes
Bunkering, Cool-down, Reloading, Transshipment, Truck loading
2011
NorwayFredrikstad 9 5,900 0.1 Gasum Gasum Yes Bunkering,
Truck loading 2011
Mosjøen 8 6,500 4 0.0 Gasnor Gasnor Partly Truck loading 2007
Poland Swinoujscie 2 320,000 5 3.7 Polskie LNG Polskie LNG Yes Truck loading 2016
Portugal Sines 3 390,000 7 5.6 Ren Atlântico Ren Atlântico YesCool-down, Reloading, Truck loading
2004
Russia Kaliningrad
No vessel chartered 2019
Spain Barcelona 6 760,000 13 12.6 Enagas Enagas Yes
Bunkering, Cool-down, Reloading, Transshipment, Truck loading
1968
52 - GIIGNL Annual Report 2020 Edition
Regasification terminals
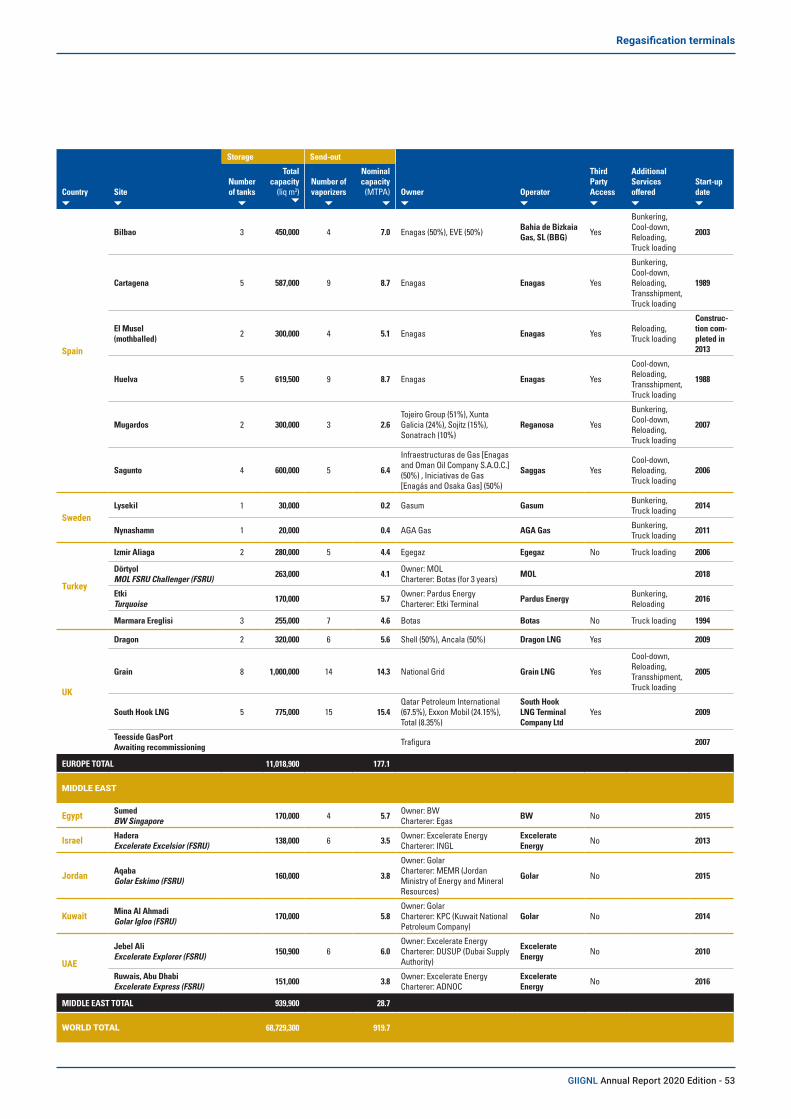
Country Site
Storage Send-out
Owner Operator
Third Party Access
Additional Services offered
Start-up date
Number of tanks
Total capacity
(liq m3)Number of vaporizers
Nominal capacity
(MTPA)
Spain
Bilbao 3 450,000 4 7.0 Enagas (50%), EVE (50%) Bahia de Bizkaia Gas, SL (BBG) Yes
Bunkering, Cool-down, Reloading, Truck loading
2003
Cartagena 5 587,000 9 8.7 Enagas Enagas Yes
Bunkering, Cool-down, Reloading, Transshipment, Truck loading
1989
El Musel (mothballed) 2 300,000 4 5.1 Enagas Enagas Yes Reloading,
Truck loading
Construc-tion com-pleted in 2013
Huelva 5 619,500 9 8.7 Enagas Enagas Yes
Cool-down, Reloading, Transshipment, Truck loading
1988
Mugardos 2 300,000 3 2.6Tojeiro Group (51%), Xunta Galicia (24%), Sojitz (15%), Sonatrach (10%)
Reganosa Yes
Bunkering, Cool-down, Reloading, Truck loading
2007
Sagunto 4 600,000 5 6.4
Infraestructuras de Gas [Enagas and Oman Oil Company S.A.O.C.] (50%) , Iniciativas de Gas [Enagás and Osaka Gas] (50%)
Saggas YesCool-down, Reloading, Truck loading
2006
SwedenLysekil 1 30,000 0.2 Gasum Gasum Bunkering,
Truck loading 2014
Nynashamn 1 20,000 0.4 AGA Gas AGA Gas Bunkering, Truck loading 2011
Turkey
Izmir Aliaga 2 280,000 5 4.4 Egegaz Egegaz No Truck loading 2006
Dörtyol
MOL FSRU Challenger (FSRU) 263,000 4.1 Owner: MOL Charterer: Botas (for 3 years) MOL 2018
EtkiTurquoise 170,000 5.7 Owner: Pardus Energy
Charterer: Etki Terminal Pardus Energy Bunkering, Reloading 2016
Marmara Ereglisi 3 255,000 7 4.6 Botas Botas No Truck loading 1994
UK
Dragon 2 320,000 6 5.6 Shell (50%), Ancala (50%) Dragon LNG Yes 2009
Grain 8 1,000,000 14 14.3 National Grid Grain LNG Yes
Cool-down, Reloading, Transshipment, Truck loading
2005
South Hook LNG 5 775,000 15 15.4Qatar Petroleum International (67.5%), Exxon Mobil (24.15%), Total (8.35%)
South Hook LNG Terminal Company Ltd
Yes 2009
Teesside GasPort
Awaiting recommissioning Trafigura 2007
EUROPE TOTAL 11,018,900 177.1
MIDDLE EAST
Egypt Sumed BW Singapore 170,000 4 5.7 Owner: BW
Charterer: Egas BW No 2015
Israel HaderaExcelerate Excelsior (FSRU) 138,000 6 3.5 Owner: Excelerate Energy
Charterer: INGLExcelerate Energy No 2013
Jordan Aqaba Golar Eskimo (FSRU) 160,000 3.8
Owner: Golar Charterer: MEMR (Jordan Ministry of Energy and Mineral Resources)
Golar No 2015
Kuwait Mina Al Ahmadi Golar Igloo (FSRU) 170,000 5.8
Owner: Golar Charterer: KPC (Kuwait National Petroleum Company)
Golar No 2014
UAE
Jebel Ali Excelerate Explorer (FSRU) 150,900 6 6.0
Owner: Excelerate Energy Charterer: DUSUP (Dubai Supply Authority)
Excelerate Energy No 2010
Ruwais, Abu Dhabi
Excelerate Express (FSRU) 151,000 3.8 Owner: Excelerate Energy Charterer: ADNOC
Excelerate Energy No 2016
MIDDLE EAST TOTAL 939,900 28.7
WORLD TOTAL 68,729,300 919.7
GIIGNL Annual Report 2020 Edition - 53
Regasification terminals
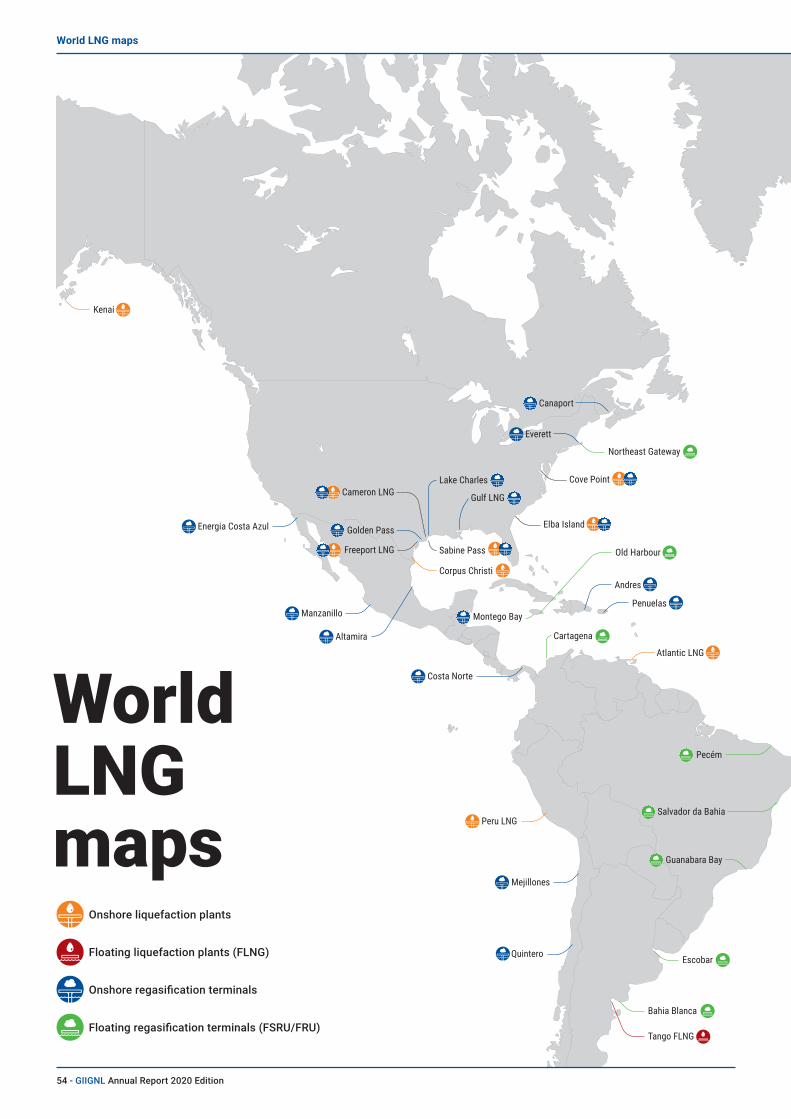
Energia Costa Azul
Manzanillo
Quintero
Mejillones
Peru LNG
NLNG
EG LNG
Cameroon FLNG
Atlantic LNG
Kenai
Pecém
Dunkerque
Fos Cavaou
ZeebruggeŚwinoujscie
Dragon LNG
South Hook LNG
Isle of Grain
Teesside
Mugardos
Montoir
Sines
Bilbao
Mosjøen
Huelva
Barcelona
Freeport LNG
Golden Pass
Cameron LNG Gulf LNG
Lake Charles
Canaport
Everett
Altamira
Costa Norte
Montego Bay
Klaipeda
Northeast Gateway
Old Harbour
Penuelas
Panigaglia
Andres
Nynashämn
Frederikstad
Lysekil
Snohvit
Salvador da Bahia
Guanabara Bay
Escobar
Bahia Blanca
Tango FLNG
Cove Point
Elba Island
Corpus Christi
Sabine Pass
Cartagena
Pori
Tornio Manga
Marmara Ereglisi
Aliaga
Gate
Gibraltar
Fos Tonkin
Rovigo
Sagunto
Revithoussa
Cartagena
Vysotsk LNG
Yamal
Qalhat
Das IslandArzew
Skikda
Delimara
Damietta
Sumed
Idku
Balhaf
Kaliningrad
Angola LNG
OLT LNG Toscana
Etki
Jebel Ali
Mina Al Ahmadi
Ruwais
Dörtyol
Hadera
Aqaba
Ras Laffan
World LNG maps
54 - GIIGNL Annual Report 2020 Edition
World LNG maps
Onshore regasification terminals
Floating regasification terminals (FSRU/FRU)
Floating liquefaction plants (FLNG)
Onshore liquefaction plants

Energia Costa Azul
Manzanillo
Quintero
Mejillones
Peru LNG
NLNG
EG LNG
Cameroon FLNG
Atlantic LNG
Kenai
Pecém
Dunkerque
Fos Cavaou
ZeebruggeŚwinoujscie
Dragon LNG
South Hook LNG
Isle of Grain
Teesside
Mugardos
Montoir
Sines
Bilbao
Mosjøen
Huelva
Barcelona
Freeport LNG
Golden Pass
Cameron LNG Gulf LNG
Lake Charles
Canaport
Everett
Altamira
Costa Norte
Montego Bay
Klaipeda
Northeast Gateway
Old Harbour
Penuelas
Panigaglia
Andres
Nynashämn
Frederikstad
Lysekil
Snohvit
Salvador da Bahia
Guanabara Bay
Escobar
Bahia Blanca
Tango FLNG
Cove Point
Elba Island
Corpus Christi
Sabine Pass
Cartagena
Pori
Tornio Manga
Marmara Ereglisi
Aliaga
Gate
Gibraltar
Fos Tonkin
Rovigo
Sagunto
Revithoussa
Cartagena
Vysotsk LNG
Yamal
Qalhat
Das IslandArzew
Skikda
Delimara
Damietta
Sumed
Idku
Balhaf
Kaliningrad
Angola LNG
OLT LNG Toscana
Etki
Jebel Ali
Mina Al Ahmadi
Ruwais
Dörtyol
Hadera
Aqaba
Ras Laffan
GIIGNL Annual Report 2020 Edition - 55
World LNG maps

Dahej
Port Qasim Karachi
Taichung
Port Qasim Gasport
Moheshkhali
Melaka
Nusantara
Benoa
Lampung
Summit LNG
Hazira
Dabhol
Kochi
Ennore
Pengerang
Jurong (Singapore)
Arun
Map Ta Phut
PFLNG Satu
Brunei LNG
Bontang
Donggi Senoro
Tangguh
MLNG
Ichthys
Darwin
APLNGGLNGQCLNG
PNG LNG
Gorgon
Wheatstone
Prelude FLNG
NWS
Pluto
Incheon
Samcheok
Tong yeong
Gwangyang
Yung-An
Jeju
Boryeong
Pyeong taek
Sakhalin-2
56 - GIIGNL Annual Report 2020 Edition
World LNG maps
Onshore regasification terminals
Floating regasification terminals (FSRU/FRU)
Floating liquefaction plants (FLNG)
Onshore liquefaction plants

Dahej
Port Qasim Karachi
Taichung
Port Qasim Gasport
Moheshkhali
Melaka
Nusantara
Benoa
Lampung
Summit LNG
Hazira
Dabhol
Kochi
Ennore
Pengerang
Jurong (Singapore)
Arun
Map Ta Phut
PFLNG Satu
Brunei LNG
Bontang
Donggi Senoro
Tangguh
MLNG
Ichthys
Darwin
APLNGGLNGQCLNG
PNG LNG
Gorgon
Wheatstone
Prelude FLNG
NWS
Pluto
Incheon
Samcheok
Tong yeong
Gwangyang
Yung-An
Jeju
Boryeong
Pyeong taek
Sakhalin-2
JapanZOOM
ZOOM
China
Ishikari
Hachinohe
Niigata
Joetsu
Naoetsu
Toyama Shinko
Higashi-Ohgishima
Sodeshi
Kawagoe
Sakai
Himeji
Hatsukaichi
Tobata
Hibiki
Nagasaki
Shin-Sendai
Shin-Minato
Soma
Hitachi
Sodegaura
Futtsu
Ohgishima
NegishiChita
Yanai
Oita
Yokkaichi
Senboku
Sakaide
Mizushima
Kagoshima
Haikou
Dapeng
Diefu
DalianTianjin
Yuedong
Caofeidian (Tangshan)
Wuhaogou
Chennan
Fangchenggang
Beihai
Hua'an
Zhuhai
Dongguan
Putian
Ningbo
Zhoushan
Yangshan
Qidong
RudongQingdao
Tianjin LNG
GIIGNL Annual Report 2020 Edition - 57
Wolrd LNG maps

Retail LNG in 2019Country
2019103 T
2018 103 T
Var. 2019/2018
BELGIUM 86.5 83.5 4%
INDONESIA 90.3 71.4 27%
JAPAN 426.6 413.5 3%
NETHERLANDS 106.4 124.0 -14%
SINGAPORE 4.3 NA NA
SOUTH KOREA 3.9 NA NA
SPAIN 30.7 0.9 3,315%
Country2019103 T
2018 103 T
Var. 2019/2018
AMERICAS
CHILE 220.5 250.8 -12%
DOMINICAN REPUBLIC 169.0 104.1 62%
USA 70.3 82.6 -15%
ASIA
CHINA 16,060.0 14,040.0 14%
INDIA 39.2 46.5 -16%
INDONESIA 35.0 2.9 1,106%
JAPAN 1,427.9 1,430.3 -0.2%
SINGAPORE 0.9 0.3 263%
SOUTH KOREA 168.8 181.3 -7%
EUROPE
BELGIUM 46.7 25.8 81%
FRANCE 162.9 112.2 45%
LITHUANIA 4.8 0.1 4,700%
NETHERLANDS 67.8 53.4 27%
POLAND 40.6 30.8 32%
PORTUGAL 121.7 116.3 5%
SPAIN 831.0 718.5 16%
TURKEY 382.2 459 -17%
UNITED KINGDOM 31.0 26.4 17%
SMALL-SCALE LNG CARGOES LOADED FROM RECEIVING TERMINALS IN 2019
TRUCK-LOADING OF LNG FROM RECEIVING TERMINALS IN 2019
58 - GIIGNL Annual Report 2020 Edition
Retail LNG in 2019

About GIIGNL GIIGNL is the international as-sociation of LNG importers. It constitutes a forum for exchange of information and experience among its members with a view to enhance safety, reliability, efficien-cy and sustainability of LNG import activities.
GIIGNL is a non-profit organisation registered under the French law of 1901 and its resources only come from the membership fees.
Governance The Association is composed of two main governing bodies: the General Assembly and the Executive Committee.
The General Assembly is composed of the whole membership and holds its annual meeting in the Fall.
The Executive Committee is currently composed of 12 member companies, who are elected by the General Assembly for 2-year terms and meet at least once a year. The Executive Committee elects a Bureau composed of the President and of 3 regional Vice-Presidents to assist him.
The Executive Committee steers two Standing Study Groups within which leaders from the LNG industry offer their commercial and technical expertise to improve efficiency and safety across the midstream of the LNG value chain.
GIIGNL’s day-to-day activities are coordinated by the General Delegate, in charge of the Central Office located near Paris (Neuilly-sur-Seine).
GIIGNL Staff
V. DemouryGeneral Delegate
S. HwangLNG Advisor
L. MoraLNG Analyst &
Communications Officer
GIIGNL Annual Report 2020 Edition - 59
About GIIGNL
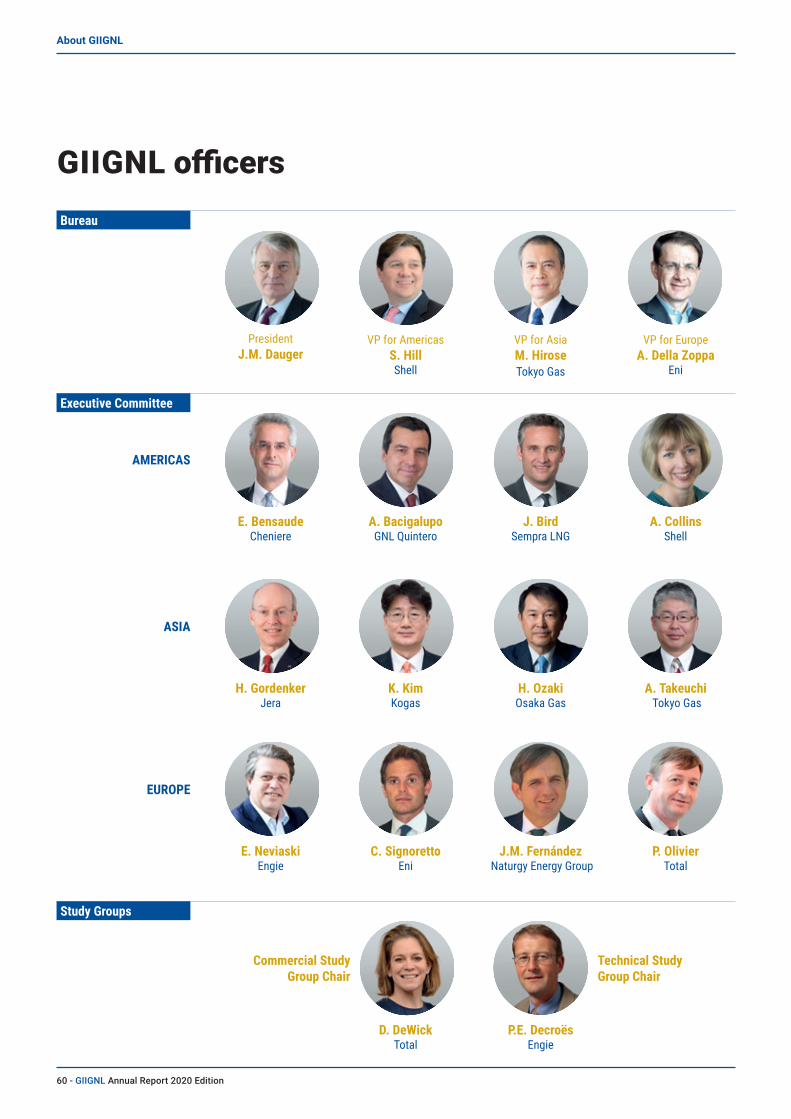
GIIGNL officersBureau
Executive Committee
Study Groups
AMERICAS
ASIA
EUROPE
Commercial Study Group Chair
Technical Study Group Chair
PresidentJ.M. Dauger
VP for Americas S. Hill Shell
VP for Asia M. Hirose Tokyo Gas
VP for Europe A. Della Zoppa
Eni
D. DeWick Total
P.E. Decroës Engie
E. Bensaude Cheniere
A. Bacigalupo GNL Quintero
J. Bird Sempra LNG
A. Collins Shell
H. Gordenker Jera
K. Kim Kogas
H. Ozaki Osaka Gas
A. Takeuchi Tokyo Gas
E. Neviaski Engie
C. Signoretto Eni
J.M. Fernández Naturgy Energy Group
P. Olivier Total
60 - GIIGNL Annual Report 2020 Edition
About GIIGNL
11 members in Americas
44 members in Asia
33 members in Europe
BP Global LNGCentrica LNG Company Ltd.Cheniere Energy, Inc.CNOOC Gas & Power Trading & Marketing Ltd.CPC CorporationDEPADominion Cove Point LNGDubai Supply Authority Dunkerque LNG SASEdison S.p.A.EDP - Energias de Portugal, S.A.Elengy S.A.Enagás S.A.Enel Trade S.p.A.ENGIEEni S.p.A.Equinor ASAExcelerate Energy L.P.Exelon Fluxys LNG SAFreeport LNG Development, L.P.Gail (India) Limited Gate Terminal B.V. GNL Italia S.p.A.GNL Quintero S.A.Guangdong Dapeng LNG Company, Ltd.Hiroshima Gas Co., Ltd.Höegh LNG ASHokkaido Gas Co., Ltd.Hokuriku Electric Power CompanyIberdrola Generación España, S.A.U.Itochu CorporationJERA Co., Inc.JXTG Nippon Oil & Energy CorporationKorea Gas CorporationKyushu Electric Power Co., Inc.
LNG Japan CorporationMarubeni CorporationMitsubishi CorporationMitsui & Co., Ltd. Mitsui O.S.K. Lines, Ltd.National Grid Grain LNG, Ltd.Naturgy Energy Group S.A.Nippon Gas Co., Ltd.N.V. Nederlandse GasunieOsaka Gas Co., Ltd.Pavilion EnergyPetroChina International Co., Ltd.Petronet LNG LimitedPTT Public Company LimitedRen Atlântico – Terminal de GNL, S.A.Saibu Gas Co., Ltd. Sempra LNGShell Energy North America, L.P.Shell Energy India Private, Ltd.Shikoku Electric Power Co., Inc.Shizuoka Gas Co.,Inc.Singapore LNG CorporationSSK E&S Co., Ltd.Southern LNG Company, L.L.C.South Hook LNG Terminal Company, Ltd.Sumitomo CorporationThe Chugoku Electric Power Co., Inc.The Kansai Electric Power Co., Inc.Toho Gas Co., Ltd.Tohoku Electric Power Co., Inc.Tokyo Gas Co., Ltd.Total S.A.TrafiguraUniper Global Commodities SEVopak LNG Holding B.V.
ENN LNG Trading Company LimitedGazprom Marketing & Trading LimitedGSPC LNG LimitedHE Terminals Pvt. Ltd.INPEX CorporationJera Global Markets Pte. Ltd.MET International AGMytilineos S.A.Novatek Gas & Power Asia Pte Ltd.Japan Petroleum Exploration Co., Ltd.ØrstedPolskie LNG S.A.PT Pertamina (Persero)Repsol Energy Canada, Ltd.RWE Supply & Trading GmbhSonatrach Gas Marketing UK LimitedYPF S.A.
88 member companies
FULL MEMBERS ASSOCIATE MEMBERS
Founded in 1971, GIIGNL gathers 88 companies from 26 countries headquartered in three regions: Americas, 11 members, Asia, 44 and Europe, 33.
GIIGNL comprises nearly all companies active in LNG imports or in the operation of LNG terminals.
About GIIGNL

Photo credits: Front Cover: Höegh LNG; P.2: Total; P.4-5: KOGAS;
P.7: Pardus Energy; P.39: Novatek; P.40: Total; P.43: Gate Terminal; P.58: Elengy_Cyrille Dupont

8, rue de l’Hôtel de Ville - 92200 Neuilly-sur-Seine - FranceE-mail: [email protected] - Website: www.giignl.org
Tel: + 33 1 56 65 51 60
More information on:
giignl.org
twitter.com/GIIGNL
youtube.com/user/GIIGNL
GROUPE INTERNATIONALDES IMPORTATEURS DEGAZ NATUREL LIQUÉFIÉ
INTERNATIONAL GROUPOF LIQUEFIED NATURAL
GAS IMPORTERS


![„The draft GIIGNL voyage charterparty for LNG shipping …final].pdf · „The draft GIIGNL voyage charterparty for LNG shipping and ... General exceptions clause 31 ... 6 This](https://static.fdocuments.in/doc/165x107/5b4168ed7f8b9a51528dcb27/the-draft-giignl-voyage-charterparty-for-lng-shipping-finalpdf-the-draft.jpg)