The Little book of valuation - Growth With Value
12
THE LITTLE BOOK OF VALUATION How to Value a Company, Pick a Stock, and Profit by Aswath Damodaran Cowley, Alistair [email protected] www.growthwithvalue.com Book Summary Chapter-by-chapter summary of the key takeaways derived from the book. The book is available for purchase from Amazon HERE
Transcript of The Little book of valuation - Growth With Value

THE LITTLE BOOK OF
VALUATION How to Value a Company, Pick a Stock, and Profit
by Aswath Damodaran
Cowley, Alistair [email protected]
www.growthwithvalue.com
Book Summary Chapter-by-chapter summary of the key takeaways derived from the book.
The book is available for purchase from Amazon HERE

The Little Book of Valuation – How to Value a Company, Pick a Stock, and Profit
Page 1 of 11
Table of Contents Chapter 1 – Understanding ..................................................................................................................... 2
Bias ...................................................................................................................................................... 2
Uncertainty ......................................................................................................................................... 2
Chapter 2 – Time Value, Risk, and Statistics ........................................................................................... 2
Time Value of Money .......................................................................................................................... 2
Financial Metrics and Ratios ............................................................................................................... 3
Chapter 3 – Determining Intrinsic Value ................................................................................................. 3
Cash Flows ........................................................................................................................................... 3
Ratios and Metrics .............................................................................................................................. 4
Growth ................................................................................................................................................ 4
Terminal Value .................................................................................................................................... 5
Options ................................................................................................................................................ 5
Conclusion ........................................................................................................................................... 5
Chapter 4 – Determining Relative Value ................................................................................................. 5
Chapter 5 – Valuing Young Growth Companies ...................................................................................... 6
Chapter 6 – Valuing Growth Companies ................................................................................................. 6
Stable Growth ..................................................................................................................................... 6
Shares and Voting Rights .................................................................................................................... 7
Conclusion ........................................................................................................................................... 7
Chapter 7 – Valuing Mature Companies ................................................................................................. 7
Valuation Issues .................................................................................................................................. 7
Growth ................................................................................................................................................ 7
Chapter 8 – Valuing Declining Companies .............................................................................................. 7
Chapter 9 – Valuing Financial Service Companies .................................................................................. 8
Chapter 10 – Valuing Cyclical and Commodity Companies .................................................................... 8
Chapter 11 – Valuing Companies with Intangible Assets ....................................................................... 8
Restating Intangibles ........................................................................................................................... 8
Intrinsic Value ................................................................................................................................... 10
Options .............................................................................................................................................. 10
Conclusion ......................................................................................................................................... 11

The Little Book of Valuation – How to Value a Company, Pick a Stock, and Profit
Page 2 of 11
Chapter 1 – Understanding Ultimately, there are dozens of valuation models but only two valuation approaches: intrinsic and
relative. In intrinsic valuation, we begin with a simple proposition: The intrinsic value of an asset is
determined by the cash flows you expect that asset to generate over its life and how uncertain you
feel about these cash flows. Assets with high and stable cash flows should be worth more than assets
with low and volatile cash flows.
In relative valuation, assets are valued by looking at how the market prices similar assets. Thus, when
determining what to pay for a house, you would look at what similar houses in the neighbourhood
sold for. With a stock, that means comparing its pricing to similar stocks, usually in its “peer group.”
Intrinsic valuation provides a fuller picture of what drives the value of a business or stock, but there
are times when relative valuation will yield a more realistic estimate of value. In general, there is no
reason to choose one over the other since nothing stops you from using both on the same investment.
In truth, you can improve your odds by investing in stocks that are undervalued not only on an intrinsic
basis but also on a relative one.
Bias All too often, your views on a company or stock are formed before you start inputting the numbers
into the models and metrics that you use and, not surprisingly, your conclusions tend to reflect your
biases.
Always be honest about your biases: Why did you pick this company to value? Do you like or dislike
the company’s management? Do you already own stock in the company? Put these biases down on
paper, if possible, before you start. In addition, confine your background research on the company to
information sources rather than opinion sources; in other words, spend more time looking at a
company’s financial statements than reading equity research reports about the company.
Uncertainty Most valuations (even good ones) are wrong.
Collecting more information and doing more analysis will not necessarily translate into less
uncertainty. In some cases, ironically, it can generate more uncertainty.
When valuing an asset, use the simplest model that you can. If you can value an asset with three
inputs, don’t use five. If you can value a company with three years of forecasting, forecasting 10 years
of cash flows is asking for trouble. Less is more.
Chapter 2 – Time Value, Risk, and Statistics
Time Value of Money There are three reasons why a cash flow in the future is worth less than a similar cash flow today.
1. People prefer consuming today to consuming in the future
2. Inflation decreases the purchasing power of cash over time. A dollar in the future will buy less
than a dollar would today.
3. A promised cash flow in the future may not be delivered. There is risk in waiting.
The Little Book of Valuation – How to Value a Company, Pick a Stock, and Profit
Page 3 of 11
The process by which future cash flows are adjusted to reflect these factors is reflected in the discount
rate. The discount rate can be viewed as a composite of the expected real return (reflecting
consumption preferences), expected inflation (to capture the purchasing power of the cash flow), and
a premium for uncertainty associated with the cash flow.
The present value of a cash flow is calculated thus:
𝐶𝑎𝑠ℎ 𝐹𝑙𝑜𝑤 𝑖𝑛 𝐹𝑢𝑡𝑢𝑟𝑒 𝑃𝑒𝑟𝑖𝑜𝑑
(1 + 𝐷𝑖𝑠𝑐𝑜𝑢𝑛𝑡 𝑅𝑎𝑡𝑒)𝑇𝑖𝑚𝑒 𝑃𝑒𝑟𝑖𝑜𝑑
A growing perpetuity is a cash flow that is expected to grow at a constant rate forever. The present
value of a growing perpetuity can be written as:
𝐸𝑥𝑝𝑒𝑐𝑡𝑒𝑑 𝐶𝑎𝑠ℎ 𝐹𝑙𝑜𝑤 𝑁𝑒𝑥𝑡 𝑌𝑒𝑎𝑟
(𝐷𝑖𝑠𝑐𝑜𝑢𝑛𝑡 𝑅𝑎𝑡𝑒 − 𝐸𝑥𝑝𝑒𝑐𝑡𝑒𝑑 𝐺𝑟𝑜𝑤𝑡ℎ 𝑅𝑎𝑡𝑒)
Although a growing perpetuity and a growing annuity share several features, the fact that a growing
perpetuity lasts forever puts constrains on the growth rate. The growth rate has to be less than the
discount rate for the equation to work, but an even tighter constraint is that the growth rate used has
to be lower than the nominal growth rate of the economy, since no asset can have cash flows growing
faster than that rate forever.
Financial Metrics and Ratios To measure profitability on a relative basis, you can scale profits to revenues to estimate margins,
both from an operating standpoint (operating margin = operating income/sales) and to equity
investors (net margin = net income/sales).
To measure how well a firm is investing its capital, we can look at the after tax operating income
relative to the capital invested in the firm, where capital is defined as the sum of book values (BV) of
the debt and equity, net of cash, and marketable securities. This is the return on capital (ROC), or
return on invested capital (ROIC) and it is computed as follows:
𝐴𝑓𝑡𝑒𝑟 𝑇𝑎𝑥 𝑅𝑂𝐶 = 𝑂𝑝𝑒𝑟𝑎𝑡𝑖𝑛𝑔 𝐼𝑛𝑐𝑜𝑚𝑒 (1 − 𝑇𝑎𝑥 𝑅𝑎𝑡𝑒)
𝐵𝑉 𝑜𝑓 𝐷𝑒𝑏𝑡 + 𝐵𝑉 𝑜𝑓 𝐸𝑞𝑢𝑖𝑡𝑦 − 𝐶𝑎𝑠ℎ
Return on equity (ROE) examines profitability from the prospective of the equity investors by relating
profits to the equity investor (net profit after taxes and interest expense) to the book value of the
equity investment and can be computed as:
𝑅𝑂𝐸 =𝑁𝑒𝑡 𝐼𝑛𝑐𝑜𝑚𝑒
𝐵𝑜𝑜𝑘 𝑉𝑎𝑙𝑢𝑒 𝑜𝑓 𝐶𝑜𝑚𝑚𝑜𝑛 𝐸𝑞𝑢𝑖𝑡𝑦
Chapter 3 – Determining Intrinsic Value There are four basic inputs that we need for a value estimate: cash flows from existing assets (net of
reinvestment needs and taxes); expected growth in these cash flows for a forecast period; the cost of
financing the assets; and an estimate of what the firm will be worth at the end of the forecast period.
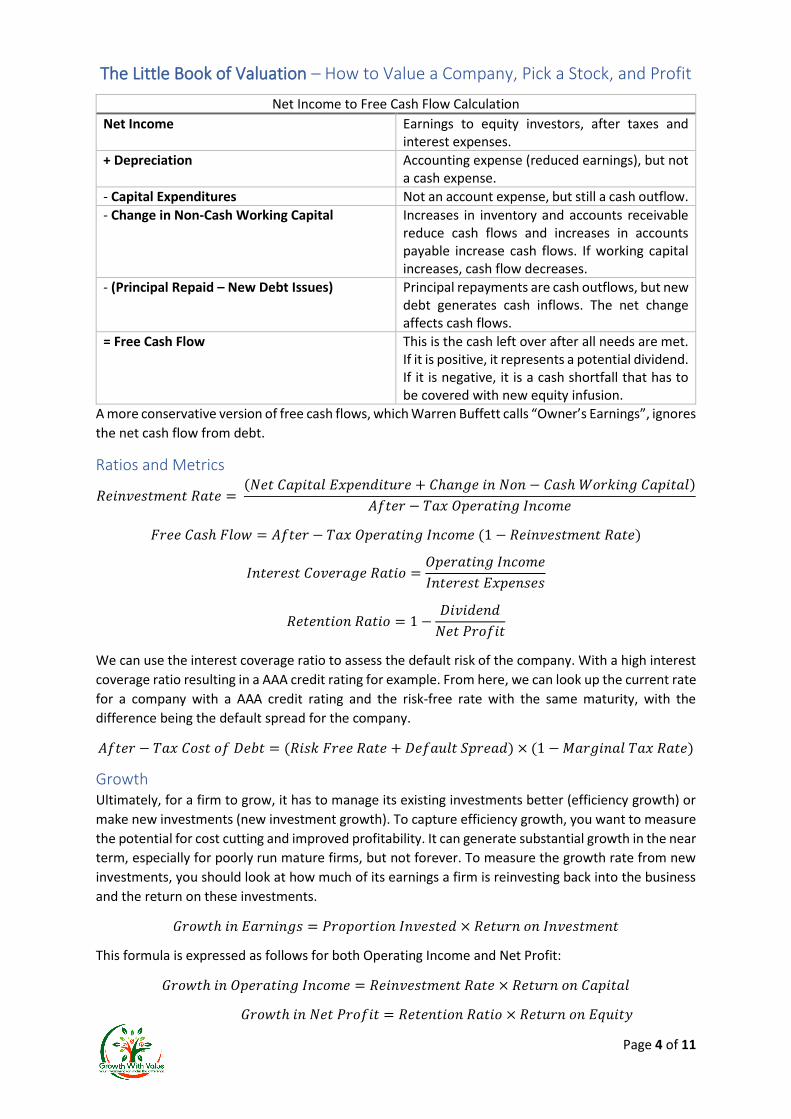
Cash Flows Free cash flow measures the cash left over after taxes, reinvestments needs, and debt cash flows have
been met.
The Little Book of Valuation – How to Value a Company, Pick a Stock, and Profit
Page 4 of 11
Net Income to Free Cash Flow Calculation
Net Income Earnings to equity investors, after taxes and interest expenses.
+ Depreciation Accounting expense (reduced earnings), but not a cash expense.
- Capital Expenditures Not an account expense, but still a cash outflow.
- Change in Non-Cash Working Capital Increases in inventory and accounts receivable reduce cash flows and increases in accounts payable increase cash flows. If working capital increases, cash flow decreases.
- (Principal Repaid – New Debt Issues) Principal repayments are cash outflows, but new debt generates cash inflows. The net change affects cash flows.
= Free Cash Flow This is the cash left over after all needs are met. If it is positive, it represents a potential dividend. If it is negative, it is a cash shortfall that has to be covered with new equity infusion.
A more conservative version of free cash flows, which Warren Buffett calls “Owner’s Earnings”, ignores
the net cash flow from debt.
Ratios and Metrics
𝑅𝑒𝑖𝑛𝑣𝑒𝑠𝑡𝑚𝑒𝑛𝑡 𝑅𝑎𝑡𝑒 = (𝑁𝑒𝑡 𝐶𝑎𝑝𝑖𝑡𝑎𝑙 𝐸𝑥𝑝𝑒𝑛𝑑𝑖𝑡𝑢𝑟𝑒 + 𝐶ℎ𝑎𝑛𝑔𝑒 𝑖𝑛 𝑁𝑜𝑛 − 𝐶𝑎𝑠ℎ 𝑊𝑜𝑟𝑘𝑖𝑛𝑔 𝐶𝑎𝑝𝑖𝑡𝑎𝑙)
𝐴𝑓𝑡𝑒𝑟 − 𝑇𝑎𝑥 𝑂𝑝𝑒𝑟𝑎𝑡𝑖𝑛𝑔 𝐼𝑛𝑐𝑜𝑚𝑒
𝐹𝑟𝑒𝑒 𝐶𝑎𝑠ℎ 𝐹𝑙𝑜𝑤 = 𝐴𝑓𝑡𝑒𝑟 − 𝑇𝑎𝑥 𝑂𝑝𝑒𝑟𝑎𝑡𝑖𝑛𝑔 𝐼𝑛𝑐𝑜𝑚𝑒 (1 − 𝑅𝑒𝑖𝑛𝑣𝑒𝑠𝑡𝑚𝑒𝑛𝑡 𝑅𝑎𝑡𝑒)
𝐼𝑛𝑡𝑒𝑟𝑒𝑠𝑡 𝐶𝑜𝑣𝑒𝑟𝑎𝑔𝑒 𝑅𝑎𝑡𝑖𝑜 =𝑂𝑝𝑒𝑟𝑎𝑡𝑖𝑛𝑔 𝐼𝑛𝑐𝑜𝑚𝑒
𝐼𝑛𝑡𝑒𝑟𝑒𝑠𝑡 𝐸𝑥𝑝𝑒𝑛𝑠𝑒𝑠
𝑅𝑒𝑡𝑒𝑛𝑡𝑖𝑜𝑛 𝑅𝑎𝑡𝑖𝑜 = 1 −𝐷𝑖𝑣𝑖𝑑𝑒𝑛𝑑
𝑁𝑒𝑡 𝑃𝑟𝑜𝑓𝑖𝑡
We can use the interest coverage ratio to assess the default risk of the company. With a high interest
coverage ratio resulting in a AAA credit rating for example. From here, we can look up the current rate
for a company with a AAA credit rating and the risk-free rate with the same maturity, with the
difference being the default spread for the company.
𝐴𝑓𝑡𝑒𝑟 − 𝑇𝑎𝑥 𝐶𝑜𝑠𝑡 𝑜𝑓 𝐷𝑒𝑏𝑡 = (𝑅𝑖𝑠𝑘 𝐹𝑟𝑒𝑒 𝑅𝑎𝑡𝑒 + 𝐷𝑒𝑓𝑎𝑢𝑙𝑡 𝑆𝑝𝑟𝑒𝑎𝑑) × (1 − 𝑀𝑎𝑟𝑔𝑖𝑛𝑎𝑙 𝑇𝑎𝑥 𝑅𝑎𝑡𝑒)
Growth Ultimately, for a firm to grow, it has to manage its existing investments better (efficiency growth) or
make new investments (new investment growth). To capture efficiency growth, you want to measure
the potential for cost cutting and improved profitability. It can generate substantial growth in the near
term, especially for poorly run mature firms, but not forever. To measure the growth rate from new
investments, you should look at how much of its earnings a firm is reinvesting back into the business
and the return on these investments.
𝐺𝑟𝑜𝑤𝑡ℎ 𝑖𝑛 𝐸𝑎𝑟𝑛𝑖𝑛𝑔𝑠 = 𝑃𝑟𝑜𝑝𝑜𝑟𝑡𝑖𝑜𝑛 𝐼𝑛𝑣𝑒𝑠𝑡𝑒𝑑 × 𝑅𝑒𝑡𝑢𝑟𝑛 𝑜𝑛 𝐼𝑛𝑣𝑒𝑠𝑡𝑚𝑒𝑛𝑡
This formula is expressed as follows for both Operating Income and Net Profit:
𝐺𝑟𝑜𝑤𝑡ℎ 𝑖𝑛 𝑂𝑝𝑒𝑟𝑎𝑡𝑖𝑛𝑔 𝐼𝑛𝑐𝑜𝑚𝑒 = 𝑅𝑒𝑖𝑛𝑣𝑒𝑠𝑡𝑚𝑒𝑛𝑡 𝑅𝑎𝑡𝑒 × 𝑅𝑒𝑡𝑢𝑟𝑛 𝑜𝑛 𝐶𝑎𝑝𝑖𝑡𝑎𝑙
𝐺𝑟𝑜𝑤𝑡ℎ 𝑖𝑛 𝑁𝑒𝑡 𝑃𝑟𝑜𝑓𝑖𝑡 = 𝑅𝑒𝑡𝑒𝑛𝑡𝑖𝑜𝑛 𝑅𝑎𝑡𝑖𝑜 × 𝑅𝑒𝑡𝑢𝑟𝑛 𝑜𝑛 𝐸𝑞𝑢𝑖𝑡𝑦

The Little Book of Valuation – How to Value a Company, Pick a Stock, and Profit
Page 5 of 11
Terminal Value Since we cannot estimate cash flows forever, we generally impose closure in valuation models by
stopping our estimation of cash flows sometime in the future and then computing a terminal value
that reflects estimated value at that point.
If we treat the firm as a going concern at the end of the period, we can estimate the value of that
concern by assuming that cash flows will grow at a constant rate forever afterwards. This perpetual
growth model draws on a simple present value equation to arrive at a terminal value:
𝑇𝑒𝑟𝑚𝑖𝑛𝑎𝑙 𝑉𝑎𝑙𝑢𝑙𝑒 𝑖𝑛 𝑌𝑒𝑎𝑟 𝑛 =𝐶𝑎𝑠ℎ 𝐹𝑙𝑜𝑤 𝑖𝑛 𝑌𝑒𝑎𝑟 (𝑛 + 1)
𝐷𝑖𝑠𝑐𝑜𝑢𝑛𝑡 𝑅𝑎𝑡𝑒 − 𝑃𝑒𝑟𝑝𝑒𝑡𝑢𝑎𝑙 𝐺𝑟𝑜𝑤𝑡ℎ
Since the terminal value equation is sensitive to small changes and thus ripe for abuse, there are a few
key constraints that should be imposed on its estimation: First, no firm can grow forever at a rate
higher than the growth rate of the economy in which it operates. In fact, a simple rule of thumb on
the stable growth rate is that it should not exceed the risk-free rate used in the valuation; the risk-free
rate is composed of expected inflation and a real interest rate, which should equate to the nominal
growth rate of the economy long term. Second, reduce the risk of the firm, as it is now considered a
mature company which generally comes with less risk, therefore a reduced discount rate.
Options When companies give options to employees, analysts often use short cuts (such as adjusting the
number of shares for dilution) to deal with these options. The right approach is to value the options
(using option pricing models), reduce the value of equity by the option value, and then divide by the
actual number of shares outstanding.
Conclusion Giving the market more time (say three to five years) to fix its mistakes (in pricing an asset) provides
better odds than hoping that it will happen in the next quarter or the next six months.
The intrinsic value of a company reflects its fundamentals. Estimates of cash flow, growth, and risk are
all embedded in that value, and it should have baked into it all of the other qualitative factors that are
often linked to high value, such as a great management team, superior technology, and a long-
standing brand name. There is no need for garnishing in a well-done intrinsic valuation.
Chapter 4 – Determining Relative Value In relative valuation, you value an asset based on how similar assets are priced in the market.
The three essential steps in relative valuation are:
1. Find comparable assets that are priced by the market
2. Scale the market prices to a common variable to generate standardised prices that are
comparable
3. Adjust for differences across assets when comparing their standardised values.
Higher growth companies should trade at higher prices than a lower growth company in the same
sector.

The Little Book of Valuation – How to Value a Company, Pick a Stock, and Profit
Page 6 of 11
The PE ratio is a consistently defined multiple, since the numerator is the price per share (which is an
equity investor value), and the denominator is the earnings per share (which is also an equity investor
value). So is the enterprise value to EBITDA multiple, since the numerator and denominator are both
measures of operating assets (debt and equity); the enterprise value measures the market value of
the operating assets of a company and the EBITDA is the cash flow generated by the operating assets.
In contrast, the price to sales ratio and price to EBITDA ratio are not consistently defined since the
divide the market value of equity b an operating measure. Using these multiples will lead you to
finding a firm with a significant debt burden to be cheap.
Since the lowest value for these multiples is zero, and the highest can be huge, the distribution for
these multiples are skewed towards the positive values. The key lesion from this distribution should
be that using the averages as a comparison measure can be dangerous with any multiple. It makes far
more sense to focus on the median.
When looking at the average price/earnings ratio across a group of firms, the firms with negative
earnings will all drop out of the sample because the price/earnings ratio cannot be computed. The
fact that the firms are taken out of the sample are the firms losing money implies that the PE ratio for
the group will be biased because of the elimination of these firms. As a general rule, you should be
sceptical about any multiple that results in a significant reduction in the number of firms being
analysed.
Comparisons of multiples across time are fraught with danger. For instance, the common practice for
branding a market to be under or overvalued based upon comparing the PE ratio to past PE ratios will
lead to misleading judgements when interest rates are higher or lower than historical norms.
Multiples tend to be used in conjunction with comparable firms to determine the value of a firm or its
equity. A comparable firm is one with cash flows, growth potential, and risk similar to the firm being
valued. Nowhere in this definition is there a component that relates to the industry or sector to which
a firm belongs. Thus, a telecommunications firm can be compared to a software firm, if the two are
identical in terms of cash flow, growth, and risk.
Chapter 5 – Valuing Young Growth Companies No relevant or important information recorded from this chapter.
Chapter 6 – Valuing Growth Companies Growth firms get more of their value from investments that they expect to make in the future and less
from investments already made. The value of growth assets is a function of not only how much growth
is anticipated but also the quality of that growth, measured in terms of excess returns: returns on the
invested capital in these assets, relative the cost of capital.
Stable Growth The question of how quickly revenue growth rates will decline at a given company, as it gets bigger,
can generally be addressed by looking at the company’s specifics – the size of the overall market for
its products and services, the strength of the competition, and the quality of both its products and
management.

The Little Book of Valuation – How to Value a Company, Pick a Stock, and Profit
Page 7 of 11
Assessing when a growth firm will become a stable company is difficult to do, but do not wait too long
to put a firm into stable growth. Both scale and competition conspire to lower growth rates quickly at
even the most promising growth companies.
Shares and Voting Rights Some growth firms continue to be controlled by their founder, who maintains control by holding onto
shares with disproportionate voting rights. If that is the case, you have to adjust for the fact that voting
shares trade at a premium over nonvoting shares; studies indicate that the premium is about 5 to 10
percent at U.S. companies. To convert the voting shares to equal the non-voting shares, multiply the
non-voting shares by 1 + 5 or 10 percent, then add these shares to the voting shares to give you the
number of shares outstanding.
Conclusion As firms become larger, growth rates will decline. Focus on firms that are able to diversify their product
offerings cater to a wider customer base as they grow. They will see more growth as they scale up
than firms that do not have this capability.
As firms become successful, there will be increased competition. Look for firms that are able to
preserve profit margins and returns as they grow. Steer away from firms that have to trade off lower
margins and returns for higher growth.
Chapter 7 – Valuing Mature Companies The common characteristics of mature companies are:
• Revenue growth is approaching growth rate in the economy: While the growth rate for
earnings for mature companies can be high, at least in some years, mature firms will register
growth rates in revenues that, if not equal to, will converge on the nominal growth rate for
the economy.
• Margins are established: Mature companies tend to have stable margins, with the exception
being commodity and cyclical firms, where margins will vary as a function of macroeconomic
variables.
Not all mature companies are large companies. Many small companies reach their growth ceiling
quickly and essentially stay on as small mature firms.
Valuation Issues The biggest challenge in valuing mature companies is complacency. When valuing these companies,
investors are often lulled into believing that the numbers from the past (operating margins, returns
on capital) are reasonable estimates of what existing assets will continue to generate in the future.
However, past earnings reflect how the firm was managed over the period.
Growth Firms can increase their long-term grow by either reinvesting more (higher reinvestment rate) or
reinvesting better (higher return on capital).
Chapter 8 – Valuing Declining Companies No relevant or important information recorded from this chapter.

The Little Book of Valuation – How to Value a Company, Pick a Stock, and Profit
Page 8 of 11
Chapter 9 – Valuing Financial Service Companies Financial services business fall into four groups depending on how they make their money. A bank
makes its money on the spread between the interest it pays to those from whom it raises funds and
the interest it charges to those who borrow from it, and from other services it offers to depositors and
its lenders. Insurance companies make their income in two ways. One is through the premiums they
receive from those who buy insurance protection from them and the other is income from the
investment portfolios that they maintain to service the claims. An investment bank provides advice
and supporting products for other firms to raise capital from financial markets or to consummate
transactions (acquisitions, divestitures). Investment firms provide investment advice or manage
investment portfolios for their clients. Their income comes from fees for investment advice and sales
fees for investment portfolios.
Chapter 10 – Valuing Cyclical and Commodity Companies Use earning averages, e.g. moving average, as a basis for calculating intrinsic value. Normalise earnings
over a period of time, usually long enough to cover the entire market cycle, typically 5 to 10 years.
Chapter 11 – Valuing Companies with Intangible Assets Accounting first principles suggest a simple rule to separate capital expenses form operating expenses.
Any expense that creates benefits over many years is a capital expense, whereas expenses that
generate benefits only in the current year are operating expenses.
Restating Intangibles Research expenses, notwithstanding the uncertainty about future benefits, should be capitalised. To
capitalise and value research assets, we have to make an assumption about how long it takes for
research and development to be converted, on average, into commercial products. This is called the
amortisable life of these assets. This life will vary across firms and reflect the commercial life of the
products that emerge from the research.
For the R&D expense, it can be reasonably assumed that the amortisation rate is uniform over time.
In the case of a research asset with a 10-year life, you assume that one-tenth of the expense is written
off each year.

The Little Book of Valuation – How to Value a Company, Pick a Stock, and Profit
Page 9 of 11
R&D Amortisation - Example
Year R&D Expense Unamortised Portion Amortisation This Year
Current 3030.00 1.00 3030.00
-1 3266.00 0.90 2939.40 326.60
-2 3366.00 0.80 2692.80 336.60
-3 2314.00 0.70 1619.80 231.40
-4 2028.00 0.60 1216.80 202.80
-5 1655.00 0.50 827.50 165.50
-6 1117.00 0.40 446.80 111.70
-7 864.00 0.30 259.20 86.40
-8 845.00 0.20 169.00 84.50
-9 823.00 0.10 82.30 82.30
-10 663.00 0.00 0.00 66.30
$13,283.60 $1,694.10
Where:
𝑈𝑛𝑎𝑚𝑜𝑟𝑡𝑖𝑠𝑒𝑑 𝑃𝑜𝑟𝑡𝑖𝑜𝑛 = 𝑅&𝐷 𝐸𝑥𝑝𝑒𝑛𝑠𝑒 × 𝑈𝑛𝑎𝑚𝑜𝑟𝑡𝑖𝑠𝑒𝑑 𝑃𝑟𝑜𝑝𝑜𝑟𝑡𝑖𝑜𝑛 𝑅𝑎𝑡𝑒
𝐴𝑚𝑜𝑟𝑡𝑖𝑠𝑎𝑡𝑖𝑜𝑛 𝑇ℎ𝑖𝑠 𝑌𝑒𝑎𝑟 = 𝑅&𝐷 𝐸𝑥𝑝𝑒𝑛𝑠𝑒 × 𝐴𝑚𝑜𝑟𝑡𝑖𝑠𝑎𝑡𝑖𝑜𝑛 𝑅𝑎𝑡𝑒 𝑜𝑓 10%
The sum of the Unamortised Portion is the total R&D Expense that is yet to be amortised.
Amortisation This Year is the amount of Amortisation required to be paid this year on all previous
years R&D Expense, with the sum of $1,694.10 being the total amount of amortisation to be
recognised in the current year.
𝐴𝑑𝑗𝑢𝑠𝑡𝑒𝑑 𝐵𝑜𝑜𝑘 𝑉𝑎𝑙𝑢𝑒 = 𝑆𝑡𝑎𝑡𝑒𝑑 𝐵𝑜𝑜𝑘 𝑉𝑎𝑙𝑢𝑙𝑒 + 𝐶𝑎𝑝𝑖𝑡𝑎𝑙 𝐼𝑛𝑣𝑒𝑠𝑡𝑒𝑑 𝑖𝑛 𝑅&𝐷
= 𝑆𝑡𝑎𝑡𝑒𝑑 𝐵𝑜𝑜𝑘 𝑉𝑎𝑙𝑢𝑒 + $13,283.60
The reported accounting income is adjusted to reflect the capitalisation of R&D expenses. First, the
R&D expenses that were subtracted out to arrive at the operating income are added back to the
operating income, reflecting their recategorization as capital expenses. Next, the amortisation of the
research asset is treated like depreciation and is netted out to arrive at the adjusted operating income
and adjusted net income, calculated as follows:
𝐴𝑑𝑗. 𝑂𝑝𝑒𝑟𝑎𝑡𝑖𝑛𝑔 𝐼𝑛𝑐𝑜𝑚𝑒 = 𝑆𝑡𝑎𝑡𝑒𝑑 𝑂𝑝𝑒𝑟𝑎𝑡𝑖𝑛𝑔 𝐼𝑛𝑐𝑜𝑚𝑒 + 𝑅&𝐷 𝐸𝑥𝑝𝑒𝑛𝑠𝑒𝑠 − 𝑅&𝐷 𝐴𝑚𝑜𝑟𝑡𝑖𝑠𝑎𝑡𝑖𝑜𝑛
= 𝑆𝑡𝑎𝑡𝑒𝑑 𝑂𝑝𝑒𝑟𝑎𝑡𝑖𝑛𝑔 𝐼𝑛𝑐𝑜𝑚𝑒 + $3,030 − $1,694.10
𝐴𝑑𝑗. 𝑁𝑒𝑡 𝐼𝑛𝑐𝑜𝑚𝑒 = 𝑁𝑒𝑡 𝐼𝑛𝑐𝑜𝑚𝑒 + 𝑅&𝐷 𝐸𝑥𝑝𝑒𝑛𝑠𝑒𝑠 − 𝑅&𝐷 𝐴𝑚𝑜𝑟𝑡𝑖𝑠𝑎𝑡𝑖𝑜𝑛
= 𝑁𝑒𝑡 𝐼𝑛𝑐𝑜𝑚𝑒 + $3,030 − $1,694.10
While R&D are the most prominent example of capital expenses being treated as operating expenses,
there are other operating expenses that arguably should be treated as capital expenses. For an
operating expense to be capitalised there should be substantial evidence that the benefits from the
expense accrue over multiple periods.
Capitalise these expenses using a procedure similar to that used to capitalise R&D expenses as follows:
1. Determine the period over which the benefits from the operating expense (such as SG&A) will
flow.
2. Estimate the value of the asset (similar to the research asset) created by these expenses. This
amount will be added back to the book value of equity/capital and used to estimate returns
on equity and capital.

The Little Book of Valuation – How to Value a Company, Pick a Stock, and Profit
Page 10 of 11
3. Adjust the operating income for the expense and the amortisation of the created asset.
The net effects of the capitalisation will be seen most visibly in the reinvestment rates and returns on
capital you estimate for these firms.
Intrinsic Value When you capitalise the expenses associated with creating intangible assets, you are in effect redoing
the financial statements of the firm and restating numbers that are fundamental inputs into valuation
– earnings, reinvestment, and measures of returns.
• Earnings: adding back the current year’s expenses and subtracting out the amortisation of
past expenses, the effect on earnings will generally be positive if expenses have risen over
time.
• Reinvestment: The effect on reinvestment is identical to the effect on earnings, with
reinvestment increasing or decreasing by exactly the same amount as earnings. That will
generally increase the reinvestment rate.
• Capital invested: Since the unamortised portion of the prior year’s expenses is treated as an
asset, it adds to the estimated equity or capital invested in the firm. The effect will increase
with the amortisable life and should therefore be higher for pharmaceutical firms (where
amortisable lives tend to be longer) than for software firms (where research pays off far more
quickly as commercial products).
• Return on Equity (capital): Since both earnings and capital invested are affected by
capitalisation, the net effects on return on equity and capital are unpredictable. If the return
on equity (capital) increases after the recapitalisation, it can be considered a rough indicator
that returns earned by the firm on R&D is greater than its returns on traditional investments.
Options Firms that pay managers and others with equity options are giving away some of the stockholders’
equity to these people. To deal with the resulting loss in value to common stockholders, there are
three approaches that are employed in intrinsic valuation.
1. Assume that all or some of the options will be exercised in the future, adjust the number of
shares outstanding and divide the value of equity by this number to arrive at per share value;
this is the diluted shares approach.
𝐼𝑛𝑡𝑟𝑖𝑛𝑠𝑖𝑐 𝑉𝑎𝑙𝑢𝑒 =𝐴𝑣𝑒𝑟𝑎𝑔𝑒 𝑉𝑎𝑙𝑢𝑒 𝑜𝑓 𝐸𝑞𝑢𝑖𝑡𝑦
𝐹𝑢𝑙𝑙𝑦 𝐷𝑖𝑙𝑢𝑡𝑒𝑑 𝑁𝑢𝑚𝑏𝑒𝑟 𝑜𝑓 𝑆ℎ𝑎𝑟𝑒𝑠
While this has the virtue of simplicity, it will lead to too low an estimate of value per share,
because it fails to reflect the proceeds from the option exercise.
2. Incorporate the exercise proceeds from the options in the numerator and then divide by the
number of shares that would be outstanding after exercise; this is the treasury stock approach.
Calculated as follows:
𝐼𝑛𝑡𝑟𝑖𝑛𝑠𝑖𝑐 𝑉𝑎𝑙𝑢𝑒 =𝑉𝑎𝑙𝑢𝑒 𝑜𝑓 𝐸𝑞𝑢𝑖𝑡𝑦 + 𝑂𝑝𝑡𝑖𝑜𝑛𝑠 𝑂𝑢𝑡𝑠𝑡𝑎𝑛𝑑𝑖𝑛𝑔 × 𝐴𝑣𝑒. 𝐸𝑥𝑒𝑟𝑐𝑖𝑠𝑒 𝑃𝑟𝑖𝑐𝑒
𝐹𝑢𝑙𝑙𝑦 𝐷𝑖𝑙𝑢𝑡𝑒𝑑 𝑁𝑢𝑚𝑏𝑒𝑟 𝑜𝑓 𝑆ℎ𝑎𝑟𝑒𝑠
This approach will yield too high a value per share, largely because the approach ignores the
time premium on the option; an option trading at or out of the money may have no exercise
value but it still has option value.

The Little Book of Valuation – How to Value a Company, Pick a Stock, and Profit
Page 11 of 11
3. Estimate the value of the options today, given today’s value per share and the time premium
on the option. Once this value has been estimated, it is subtracted from the intrinsic value,
and the remaining amount is divided by the number of shares outstanding to arrive at value
per share. Based upon the exercise price ($391.40) and the average maturity (3.5 years), the
options outstanding at Google are valued at $897 million.
𝐼𝑛𝑡𝑟𝑖𝑛𝑠𝑖𝑐 𝑉𝑎𝑙𝑢𝑒 =𝑉𝑎𝑙𝑢𝑒 𝑜𝑓 𝐸𝑞𝑢𝑖𝑡𝑦 − 𝑉𝑎𝑙𝑢𝑒 𝑜𝑓 𝑂𝑝𝑡𝑖𝑜𝑛𝑠
𝑃𝑟𝑖𝑚𝑎𝑟𝑦 𝑆ℎ𝑎𝑟𝑒𝑠 𝑂𝑢𝑡𝑠𝑡𝑎𝑛𝑑𝑖𝑛𝑔
When choosing which approach to take, consider that the first is the crudest, the second is slightly
more tempered, and the third is the most work, but it is the right way to deal with options. The fact
that most investors and analysts do not go to the trouble may provide an opportunity for those who
go the extra mile in assessing options.
The only way to incorporate the effect of options into earnings multiples is to value the options at fair
value, using the current stock price as the basis, and add this vale on to the market capitalisation to
arrive at the total market value of equity.
Conclusion Intangible Assets that generate high returns: For intangible assets to generate value, they have to earn
high returns. Look for a firm with intangible assets that are unique and difficult to replicate.
Spending to preserve and augment these intangible assets: Intangible assets do not always stay
valuable, especially if they are ignored. Focus on firms that invest in these assets (by spending on R&D,
recruiting, or advertising) to preserve and grow value.
Equity Claims drain Share Value: Incorporate the effects of outstanding options into your estimates of
value per share and avoid companies that are cavalier about issuing new options to managers.