The Little book of Pavement Friction Little Book of Tire Pavement...friction) which enables the...
23
The Little Book of Tire Pavement Friction Version 1.0 Submitted for Review and Comment Pavement Surface Properties Consortium September 2012 Gerardo W. Flintsch Kevin K. McGhee Edgar de León Izeppi Shahriar Najafi
Transcript of The Little book of Pavement Friction Little Book of Tire Pavement...friction) which enables the...

The Little Book of Tire
Pavement Friction
Version 1.0
Submitted for Review and Comment
Pavement Surface Properties Consortium
September 2012
Gerardo W. Flintsch
Kevin K. McGhee
Edgar de León Izeppi
Shahriar Najafi

1 Version 1.0 September 2012
Table of Contents
Table of Contents ............................................................................................................................ 1
1. Introduction ............................................................................................................................. 3
2. What Is the Effect of Tire Pavement Friction on Roadway Safety? ....................................... 3
3. What Is Tire Pavement Friction and Surface Texture? ........................................................... 4
3.1. Basic Concepts of Friction ............................................................................................... 4
3.2. What Is Pavement Texture? ............................................................................................. 4
3.3. Components of Tire Pavement Friction ........................................................................... 6
3.4. Braking, Accelerating, and Cornering.............................................................................. 7
4. How Do We Measure Friction? .............................................................................................. 9
4.1. Principles of Friction Measuring Equipment ................................................................. 10
4.2. Macrotexture Measuring Techniques ............................................................................. 11
4.3. The effect of Hydroplaning ............................................................................................ 12
4.4. What Operational Factors Affect Friction Measurements?............................................ 13
4.5. Non-contact measurement of friction ............................................................................. 15
4.6. Dry friction ..................................................................................................................... 15
5. What Is Equipment Calibration and Harmonization? ........................................................... 16
5.1. Calibration ...................................................................................................................... 16
5.2. Harmonization ................................................................................................................ 16
5.3. The International Friction Index .................................................................................... 17
6. What is a Pavement Friction Management Program? ........................................................... 17
6.1. Friction demand.............................................................................................................. 18
6.2. Pavement Friction Management Programs (PFMP) ...................................................... 18
6.3. Frequency of friction testing .......................................................................................... 19
7. How do we Achieve and Maintain Adequate Tire pavement Friction ................................. 19
7.1. Designing for Friction .................................................................................................... 19
7.2. Restoring Friction ........................................................................................................... 20
8. Summary and Conclusions ................................................................................................... 20
9. References ............................................................................................................................. 21

2 Version 1.0 September 2012
List of Figures
Figure 1 Force body diagram for rotating wheel 4
Figure 2 Influence of texture wavelength on tire pavement interaction 5
Figure 3 Texture Three Zone Concept of a wet surface 6
Figure 4 Key components of tire pavement friction 6
Figure 5 Friction versus slip 7
Figure 6 Force-body diagram for a wheel traveling around a curve with constant speed 9
Figure 7 Longitudinal Force Coefficient (LFC) Friction Testers 10
Figure 8 Circular Track Meter (CTMeter) 11
Figure 9 Effect of water film thickness on skid measurements 13
3 Version 1.0 September 2012
1. Introduction
Frictional properties of pavements play a significant role in road safety as the friction between
tire and pavement is a critical contributing factor in reducing potential crashes. When a tire is
free rolling in a straight line, the tire contact patch is instantaneously stationary and there is little
or no friction developed at the tire/road interface, although there may be some interactions that
contribute to rolling resistance. However, when a driver begins to execute a maneuver that
involves a change of speed or direction, forces develop at the interface in response to
acceleration, braking, or steering that cause a reaction between the tire and the road (called
friction) which enables the vehicle to speed up, slow down, or track around a curve. To reduce
the number of fatalities, injuries, and properties damage due to car crashes, the Federal Highway
Administration (FHWA) issues guidance to highway agencies in management of pavement
surface friction on roadways (FHWA 2010).
Car crashes can be due to several factors related with the driver, the vehicle, the environment,
and the roadway infrastructure. Because the lack of sufficient friction between the tire and
pavement during wet weather condition is one of the factors that can increase the risk of car
crashes, it is important for Departments of Transportation (DOTs) to monitor the friction of their
pavement networks frequently and systematically. This document provides guidelines for state
DOTs and highway agencies to effectively use tire pavement friction data to support asset
management decisions. The principles of friction and texture are explained in this document.
Methods for measuring pavement surface friction and texture, and the factors that can affect their
measurement, are further discussed. The importance of friction in safety design of highways is
also highlighted.
2. What Is the Effect of Tire Pavement Friction on Roadway Safety?
Pavement Friction is very important to roadway safety because each year many people around
the world lose their lives in vehicle-related incidents. In the United States it is one of the leading
causes of death. According to the National Highway Traffic Safety Administration (NHTSA), in
2010, more than 2.2 million people were injured in the U.S. in car crashes, and, on average, there
was a vehicle-related fatality every sixteen minutes. NHTSA also estimated that the economic
cost of traffic crashes (2000) was $230.6 Billion (NHTSA, 2010).
It has been shown that friction between tire and pavement is a critical factor in reducing crashes
(Hall et al. 2009; Henry 2000; Ivey et al. 1992). Most of the skidding problems occur when the
road surface is wet due to friction deficiencies. A study made in Kentucky in 1972 revealed that
the rate of wet crashes increases as the surface friction drops below a certain value. Data for this
study was collected on rural interstates and parkways. The study also confirmed the relationship
between the rate of wet to dry crashes and pavement friction (Rizenbergs et. al., 1972).
In a study performed in Texas, it was found that higher percentage of crashes occur on roads
with low friction while fewer crashes happen on roads with high friction (Hall et al. 2009).
Many researchers have developed models to predict the association between car crashes and
friction. Most studies confirm the association between high rates of car crashes and low levels of
pavement friction.
4 Version 1.0 September 2012
3. What Is Tire Pavement Friction and Surface Texture?
3.1. Basic Concepts of Friction
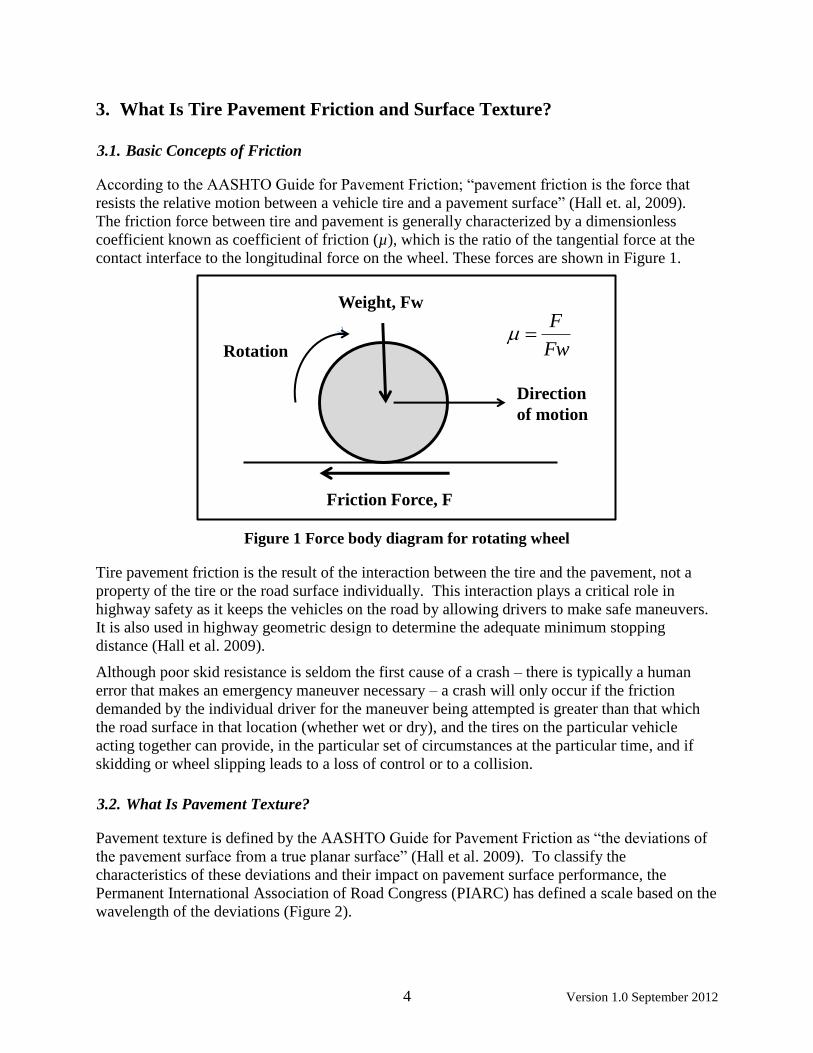
According to the AASHTO Guide for Pavement Friction; “pavement friction is the force that
resists the relative motion between a vehicle tire and a pavement surface” (Hall et. al, 2009).
The friction force between tire and pavement is generally characterized by a dimensionless
coefficient known as coefficient of friction (µ), which is the ratio of the tangential force at the
contact interface to the longitudinal force on the wheel. These forces are shown in Figure 1.
Figure 1 Force body diagram for rotating wheel
Tire pavement friction is the result of the interaction between the tire and the pavement, not a
property of the tire or the road surface individually. This interaction plays a critical role in
highway safety as it keeps the vehicles on the road by allowing drivers to make safe maneuvers.
It is also used in highway geometric design to determine the adequate minimum stopping
distance (Hall et al. 2009).
Although poor skid resistance is seldom the first cause of a crash – there is typically a human
error that makes an emergency maneuver necessary – a crash will only occur if the friction
demanded by the individual driver for the maneuver being attempted is greater than that which
the road surface in that location (whether wet or dry), and the tires on the particular vehicle
acting together can provide, in the particular set of circumstances at the particular time, and if
skidding or wheel slipping leads to a loss of control or to a collision.
3.2. What Is Pavement Texture?
Pavement texture is defined by the AASHTO Guide for Pavement Friction as “the deviations of
the pavement surface from a true planar surface” (Hall et al. 2009). To classify the
characteristics of these deviations and their impact on pavement surface performance, the
Permanent International Association of Road Congress (PIARC) has defined a scale based on the
wavelength of the deviations (Figure 2).
Weight, Fw
Friction Force, F
Direction
of motion
Rotation Fw
F

5 Version 1.0 September 2012
Figure 2 Influence of texture wavelength on tire pavement interaction (after Henry, 2000)
Tire pavement friction is dominated by the texture, or roughness, of the surface, with different
texture components making different contributions. Of fundamental importance on both wet and
dry roads is the microtexture, that is, the fine-scale texture (below about 0.5 mm) on the surface
of the coarse aggregate in asphalt or the sand in cement concrete that interacts directly with the
tire rubber on a molecular scale and provide adhesion. This component of the texture is
especially important at low speeds but needs to be present at any speed.
On wet pavements, as speed increases skid resistance decreases and the extent to which this
occurs depends on the macrotexture, typically formed by shape and size of the aggregate
particles in the surface or by grooves cut into some surfaces. Generally, surfaces with greater
macrotexture have better friction at high speeds for the same low-speed friction (Roe and Sinhal
1998) but this is not always the case1. Since all friction test methods can be insensitive to
microtexture under specific circumstances, it is recommended that friction testing be
complemented by macrotexture measurement (ASTM E1845). It has been found that at speeds
above 56 mph on wet pavements, macrotexture is responsible for a large portion of the friction,
regardless of the slip speed (Hall et al. 2009).
1 Recent research in the UK (Roe et al, 2008 and Roe and Dunford 2011, in preparation) has found that on certain types of
modern asphalt (thin surface course layers with small coarse aggregate sizes), which have relatively low texture depth, locked-
wheel friction decreases with speed but not to the extent expected from other HMA (or PCC) surfaces with comparably low
macrotexture.
0.00001 0.0001 0.001 0.01 0.1 1 10 100 ft
10-6'
10-5'
10-4'
10-3'
10-2'
10-1'
100'
101' m
Int. Noise
Splash/Spray
Rolling Resistance
Tire Wear Tire/Vehicle Damage
Texture Wavelength
Microtexture Macrotexture Megatexture Roughness/Unevenness
Friction
Ext. Noise

6 Version 1.0 September 2012
To better visualize the role of texture with the contact region of a tire on a wet pavement the
Three Zone Concept, first suggested by Gough and later extended by Moore, is shown in Figure
3 (Moore, 1966). In zone 1, water is squeezed out by the macrotexture of the pavement surface,
whereas in zone 2, the microtexture is responsible. Finally, in zone 3, the tire comes into dry
contact with the pavement’s surface. It is in this last zone, that the forces of adhesion and
hysteresis come into play, as explained next.
Figure 3 Texture Three Zone Concept of a wet surface (after Moore, 1966)
3.3. Components of Tire Pavement Friction
Tire pavement friction is the result of two main forces, adhesion and hysteresis. Adhesion is due
to the molecular bonding between the tire and the pavement surface while hysteresis is the result
of energy loss due to tire deformation. As the tire comes into contact with the pavement, the
surface texture causes deformation in the tire rubber. This deformation is the potential energy
stored in the tire. As the tire relaxes part of this energy will be recovered and part of it will be
dissipated in form of heat. The generated heat (energy loss) is known as hysteresis. Both
hysteresis and adhesion are related to surface characteristics and tire properties (Hall et al. 2009).
These two key components of tire pavement friction are illustrated in Figure 4.

7 Version 1.0 September 2012
Figure 4 Key components of tire pavement friction (after Hall et al. 2009)
3.4. Braking, Accelerating, and Cornering
When a tire is free rolling in a straight line, the tire contact patch is instantaneously stationary
and there is little or no friction developed at the tire/road interface, although there may be some
interactions that contribute to rolling resistance. However, when a driver begins to execute a
maneuver that involves a change of speed or direction, forces develop at the interface in response
to acceleration, braking, or steering that cause a reaction between the tire and the road which
enables the vehicle to speed up, slow down, or track around a curve.
During braking, as the braking force increases, the reacting force increases until it approaches a
point at which the peak coefficient of friction available between the tire and the road is exceeded
(this normally occurs between 18 and 30 percent slip). At this point (commonly known as “peak
friction”), the tire continues to slow down relative to the vehicle speed and to slip over the road
surface, even though the wheel is still rotating. If the braking force continues, the tire slips even
more. Eventually complete locking of the wheel occurs, at which time the wheel stops rotating
and the tire contact patch skids over the road surface. This is illustrated in Figure 5 below.

8 Version 1.0 September 2012
Figure 5 Friction versus slip (after Henry, 2000).
On a dry road surface, there is often little difference between peak and sliding friction and
relatively little effect of speed. However, on a wet road, peak friction is often lower than in dry
conditions, the sliding friction is typically lower than peak friction, and both usually (but not
always) decrease with increasing speed. The differences between wet and dry, and peak and
sliding friction, depend not only on vehicle speed and tire properties (including tread depth and
pattern), but also to a large extent on the characteristics of the road surface, particularly its state
of microtexture, the form and magnitude of the macrotexture, and the amount of water and other
contaminants on the pavement (the importance of which is discussed further below). It is
important to point out that when friction measurements occur on the left side of the peak, these
will be mostly influenced by the characteristics of the tire, whereas those measurements made on
the right side of the peak, will be influenced by those properties of the surface (macrotexture).
An analogous situation occurs during acceleration: although in normal circumstances the tire
contact patch remains instantaneously stationary, too great a demand for acceleration can
overcome the peak friction available and the wheel will start to slip, or in the extreme, to spin
with little or no vehicle acceleration (as on ice).
Similarly, in cornering, side forces are generated that make the vehicle follow a curved path. If
the combination of forward speed and the effective radius of curvature (influenced by the
geometry of the road and steering angle) result in a demand for friction that exceeds what the
road can provide, the wheel may slip sideways. If the demand is high enough to overcome peak
friction, the wheel may slide sideways causing the vehicle to yaw. In this situation, a marked
difference between peak and sliding friction could lead to a rapid loss of control.
The situation is exacerbated when braking and cornering occur simultaneously, because the
available friction has to be shared between the two mechanisms. If the peak is exceeded, the
sideforce goes down to near zero and the operator loses all control of steering. This is why anti-
lock braking systems (ABS) are important. They detect the onset of wheel slip and momentarily
release and then re-apply the brakes to make sure the peak friction is not exceeded and to reduce

9 Version 1.0 September 2012
the likelihood of side-slip occurring, thus helping the driver to maintain control. Similar ideas
are used in some modern vehicle control systems to reduce the risk of side-slip occurring under
simultaneous acceleration and cornering.
However, it is important to appreciate that while the instantaneous deceleration rates (and
inversely stopping distances) with ABS functioning may be greater than for a vehicle skidding
with locked wheels, there can be situations (particularly when the road is wet and the friction
level is low) when the average friction (including the times when the wheel is released as well as
those when it is slipping) will be less than in the locked-wheel condition.
4. How Do We Measure Friction?
Since friction depends on the interaction between the tire and the pavement, different
measurements are obtained for different testing conditions. This has led to the development of
different testing devices which operate under different conditions. As the tire freely roles on the
pavement surface, longitudinal frictional forces generate at the tire and the pavement interface.
The relative speed between the tire circumference and the pavement surface (slip speed) is zero
(or very low) during free rolling (no braking) condition. Applying a constant brake to the tire
will increase the slip speed to the potential maximum equivalent of the vehicle speed. This
relationship can be mathematically expressed as follows (Hall et al. 2009):
)68.0( rVVVS P (1)
Where: S = Slip speed (mph)
V = Vehicle directional speed (mph)
Vp = Average peripheral speed of tire (mph)
Ω = Angular velocity of the tire (radians/Second)
r = Average radius of the tire (ft.)
If the average peripheral speed of tire (Vp) is equal to the vehicle speed, the slip speed (S) will be
zero. During the fully locked wheel braking condition Vp is zero. This makes the slip speed to
be equal to vehicle speed. Most literature refers to locked-wheel condition as 100 percent slip
ratio and the free rolling condition as the zero slip ratio. The slip ratio can be mathematically
expressed as follow (Hall et al. 2009):
100100
V
S
V
VVSR P (2)
Where: SR = slip ratio.
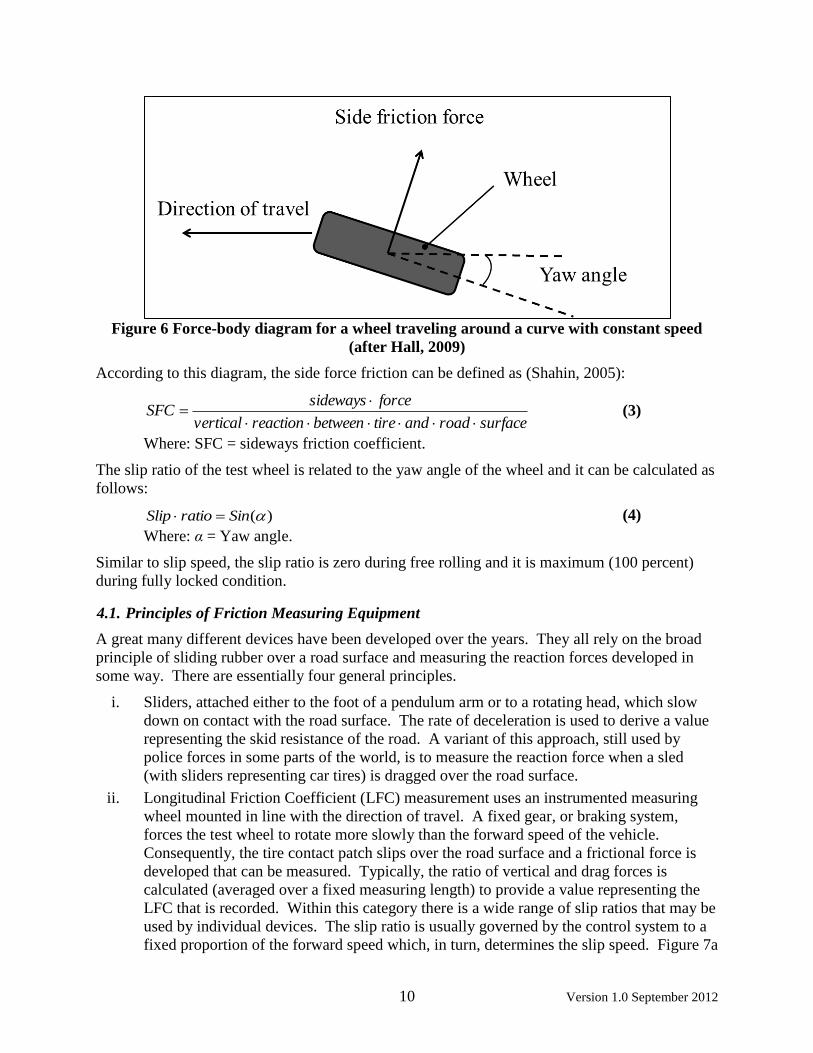
When the vehicle steers around a curve or changes lanes another type of friction force generates
at the tire pavement interface. This type of friction is called lateral (side-force) friction (Hall et
al. 2009; Shahin 2005). The angle between the wheel and direction of travel is known as the
“yaw angle”. The force-body diagram of a vehicle steering on a curve is shown in Figure 6.
10 Version 1.0 September 2012
Figure 6 Force-body diagram for a wheel traveling around a curve with constant speed
(after Hall, 2009)
According to this diagram, the side force friction can be defined as (Shahin, 2005):
surfaceroadandtirebetweenreactionvertical
forcesidewaysSFC
(3)
Where: SFC = sideways friction coefficient.
The slip ratio of the test wheel is related to the yaw angle of the wheel and it can be calculated as
follows:
)(SinratioSlip (4)
Where: α = Yaw angle.
Similar to slip speed, the slip ratio is zero during free rolling and it is maximum (100 percent)
during fully locked condition.
4.1. Principles of Friction Measuring Equipment
A great many different devices have been developed over the years. They all rely on the broad
principle of sliding rubber over a road surface and measuring the reaction forces developed in
some way. There are essentially four general principles.
i. Sliders, attached either to the foot of a pendulum arm or to a rotating head, which slow
down on contact with the road surface. The rate of deceleration is used to derive a value
representing the skid resistance of the road. A variant of this approach, still used by
police forces in some parts of the world, is to measure the reaction force when a sled
(with sliders representing car tires) is dragged over the road surface.
ii. Longitudinal Friction Coefficient (LFC) measurement uses an instrumented measuring
wheel mounted in line with the direction of travel. A fixed gear, or braking system,
forces the test wheel to rotate more slowly than the forward speed of the vehicle.
Consequently, the tire contact patch slips over the road surface and a frictional force is
developed that can be measured. Typically, the ratio of vertical and drag forces is
calculated (averaged over a fixed measuring length) to provide a value representing the
LFC that is recorded. Within this category there is a wide range of slip ratios that may be
used by individual devices. The slip ratio is usually governed by the control system to a
fixed proportion of the forward speed which, in turn, determines the slip speed. Figure 7a

11 Version 1.0 September 2012
shows an example of a fixed-slip friction tester. Locked wheels (Figure 7b) measure the
longitudinal friction by completely locking the brake of the measuring wheel, regardless
of the test vehicle speed. Locked wheels can either use ribbed tire or smooth tire. Ribbed
tires are knows to be less sensitive to pavement macrotexture and water film depth than
smooth tires.
a) LFC Fixed-slip tester
b) LFC Locked-wheel skid tester
Figure 7 Longitudinal Force Coefficient (LFC) Friction Testers
iii. Sideway Force Coefficient (SFC) measurement uses an instrumented measuring wheel
set at an angle to the direction of travel of the vehicle. Although normally freely rotating,
because it is set at an angle, the tire is made to slip over the road surface and the resulting
force along the wheel axle (the “sideways force”) is measured. The ratio of vertical and
side forces averaged over a defined measuring length provides the value that is recorded
to represent skid resistance. The wheel angle determines the slip ratio and the vehicle
speed determines the slip speed.
iv. Decelerometers are typically custom-made units mounted in a test vehicle, used to
measure the deceleration of a vehicle under emergency braking. Widely used by police
forces to assess road surface friction for collision investigations, and more recently in
experimental naturalistic driving studies, these devices are not suitable for road network
assessment or quality control purposes. They are mentioned here for completeness but
are not considered further.
More agencies around the world have started using Continuous Friction Measuring Equipment
(CFME) for highway friction management. CFMEs have the advantage that they continuously
measure the friction across the entire stretch of a road, providing greater detail about spatial
variability of the tire pavement frictional properties, using either SFC or LFC principles.
4.2. Macrotexture Measuring Techniques
Macrotexture can be measured using both highway speed profilers and static methods. While
static devices can be used for project level measurements, the high speed devices are more
appropriate for network level data collection. For static measurements, there are two basic
techniques. First, the oldest one of these is the volumetric “patch” test. This is a test in which a
known volume of sand or glass beads (or grease) is placed on the road surface and spread evenly

12 Version 1.0 September 2012
into a circular patch, filling the voids. The area is measured and thus the average depth below
the peaks in the surface is calculated to give a value known as Mean Texture Depth (MTD).
In more recent years, laser displacement sensors, which measure along a narrow line traversed by
the laser (rather than across the area of a patch of sand or glass beads), have been used to
determine a surface profile from which a number of different parameters may be calculated to
represent the texture depth. The most widely used parameter internationally, and defined in the
ASTM E1845 standard, is the Mean Profile Depth (MPD), which attempts to estimate the
average depth below the peaks in a 100-mm segment of the surface profile. The root mean
square (RMS) texture depth has also been used extensively both in research and as part of
friction management.
Numerous devices are now available to measure the MPD, such as the Circular Track Meter
(Figure 8) for static measurements, and those attached to high-speed profilers (+64 kHz) that are
primarily used to collect profile data for smoothness purposes in network evaluations. Static
texture measuring device have a displacement sensor mounted on an arm which rotates at a fixed
elevation from the surface collecting a high-resolution profile. Both, the high-speed and the
static devices, are controlled by a computer that records the data and reports the processed data
as MPD and RMS.
Figure 8 Circular Track Meter (CTMeter)
Research is showing that although both are useful in some situations, an alternative to RMS or
MPD measures will likely be necessary to fully characterize road surface behavior. What that
index should be is not clear at the moment. What is clear, is that a device that measures both,
friction and macrotexture concurrently, is needed to determine both low-speed and high-speed
friction performance (and their relative relevance in different situations) from a single
measurement pass.
4.3. The effect of Hydroplaning
On dry pavement with good texture, the tire envelopes the texture and the depth of the
penetration in the footprint is a tire property; however, when wet, water can partially prevent the

13 Version 1.0 September 2012
penetration if the macrotexture is not deep enough. Tire tread and macrotexture sometimes are
not enough to allow the water to escape and thus causes the water to be present in the tire
pavement interface.
In discussion of wet skidding crashes, reference is sometimes made to an effect known as
hydroplaning or aquaplaning. This effect occurs when the water film on the road surface is so
thick that it cannot be adequately broken up or dispersed by the passage of the tire. A thick film
builds up in front of the tire that gradually spreads underneath it and lifts the tire off the road
surface entirely, with a consequent major loss of traction even though the wheel can still rotate.
The tread pattern on the tire helps to prevent this phenomenon from occurring and for this reason
many enforcing agencies set minimum tread depth requirements for vehicle tires. Macrotexture
on the road also contributes to preventing aquaplaning. In countries that combine macrotexture
requirements with tire tread limits, the effect is rare, occurring where a defective geometric
design allows a significant build-up of water across the carriageway rather than the combination
of a smooth (or well-worn) tire running on a smooth wet road surface. AASHTO has recently
developed an automated cross-slope and drainage tool that recognizes the effect that these might
have increasing the likelihood of hydroplaning (FHWA, 2011).
Therefore, it is suggested that when implementing a Pavement Friction Management Programs
(PFMP), it collects friction, macrotexture, cross-slope, longitudinal grade, and the radius of
curvature in a one-pass operations. This will allow for a proper subdivision and identification of
different types of road that are adequately characterized with different friction thresholds.
4.4. What Operational Factors Affect Friction Measurements?
There are several operational factors that can affect the friction measurement. Better
understanding of these factors can help highway agencies to establish standard testing condition
and approaches for correcting measurement taken under different conditions.
i. As mentioned in the previous section, water film thickness is one of the factors that have
been proven to affect the friction measurements. The water on the pavement surface
decreases the tire pavement contact area which results in reduction in friction. This effect
is known to be more noticeable in higher speeds (>40 mph) compared to lower speeds
(Hall et al. 2009).
ii. Worn tires are known to be more sensitive to water film thickness. Pavement
macrotexture and tires threads can provide channels for water to escape through the tire
pavement contact area which result in increasing the traction between tire and the
pavement surface. The effect of water film thickness on locked wheel skid trailer
measurements is illustrated in Figure 9 and it suggests that smooth tires are more
sensitive to the changes of water film thickness. Due to the lower sensitivity of ribbed
tires to operational test conditions and water film thickness, some recommend them as the
preferred choice for friction measurements (Henry 2000). However, ribbed tires are less
sensitive to the pavement macrotexture, so it is recommended that their measurements be
accompanied by macrotexture measurements.

14 Version 1.0 September 2012
Figure 9 Effect of water film thickness on skid measurements (after Henry, 2000).
iii. Recent studies have also confirmed the sensitivity of Continuous Friction Measuring
Equipment (CFME) to water film thickness and other operational test conditions (Najafi
et al. 2012).
iv. Speed is also a factor. Standards for locked-wheel friction measurements (SN, skid
numbers) are set at 40 mph. Present vehicle operating speeds in Interstate and Primary
Highways are much higher than this, while urban areas often have speed limits below.
v. Since both hot mix asphalt surface and tires are viscoelastic materials, temperature also
affect their properties. Research has indicated that tire pavement friction decreases if the
tire temperature increases (Hall et al. 2009). Although several researchers have
investigated on this effect, this phenomenon is not still very well understood.
a. Jayawickrama and Thomas (1998) found that variation in skid numbers
measurements can be as significant as 10 to 12 skid numbers from one day to
another. These variations are due to changes in temperature and precipitation
(Jayawickrama and Thomas 1998).
b. During summer months, skid resistance is lower than other times of the year.
This effect can be either due to accumulation of polished particles from pavement
which decrease the microtexture and macrotexture, or it can be contamination
from vehicles such as oil and grease dripping. During the winter, winter
maintenance practices, such as applying deicing salt, cause surface wear which
expose new particle on aggregate surface and improves skid resistance. In spring,
heavy rain flushes out the fine grit and makes the aggregate surface courser. The
25
30
35
40
45
50
0 0.005 0.01 0.015 0.02 0.025 0.03 0.035
SN
40
Water Film Thickness (in)
Worn Ribbed Tire
New Ribbed Tire
Smooth Tire
15 Version 1.0 September 2012
course aggregate surface provides higher macrotexture and consequently higher
skid resistance (Jayawickrama and Thomas 1998).
c. Colony (1992) also reported that fluctuation of friction trough out the year has the
highest values in the winter and the lowest friction is experienced at the end of the
summer (Colony 1992). Faung and Hughes (2007) detected that skid
measurement on SUPERPAVE mixes, follow a cyclic pattern with the higher
values in winter and low values in fall and summer (Faung and Hughes 2007).
d. Changes in temperature do not have a direct effect on the friction of pavement
surface. However, they can affect the properties of the skid tester’s tire
(Jayawickrama and Thomas 1998). As explained before, tire pavement friction is
composed of adhesion and hysteresis. Adhesion is the shear force generated at
the interface of the contact area and hysteresis is due to the damping losses in the
tire rubber (Li et al. 2004). Higher temperature makes the tire more flexible. This
reduces the energy loss of the tire (hysteresis) and decreases the measured skid
number. Nevertheless there is no proof available for this mechanism in the
literature. While some studies stated that the effect of temperature is a very
insignificant; many others indicate that temperature is a significant factor
(Jayawickrama and Thomas 1998).
e. Bazlamit and Reza (2005) indicated that regardless of the surface texture,
increasing the temperature decreases the hysteresis component of surface friction
while for adhesion component, surface texture affects this behavior (Bazlamit and
Reza 2005). Since hysteresis accounts for greater part of total friction, the
combined friction of the surface decreases with increasing temperature (Bazlamit
and Reza 2005).
f. Hill and Henry (1982) proposed a model that predicts the seasonal variation in the
skid number intercept (SN0). The analysis was based on the data collected on test
sites in Pennsylvania from 1978 to 1980.
4.5. Non-contact measurement of friction
Emerging technologies are evaluating the computation of the pavement friction based on data
from the vehicle (deceleration, slipping information for the traction control systems, etc.) and/or
non-contact technologies (e.g., laser-based systems or image-processing) to measure
microtexture. These alternatives to rubber-on-road techniques are laudable ideas and presently
there are plenty of researchers looking into this, but they are, at the moment, not reliable
techniques and are unlikely to work at traffic speed for some time.
For the immediate and probably medium term, “dragging a tire across a road” remains the only
reasonably reliable way to assess the skid resistance of a road. It does at least have the virtue of
measuring something relating to the rubber and the road – even though it will need to be
standardized so that the measurement is transportable and not uniquely biased towards one
rubber-road interaction with limited relevance to all others.
4.6. Dry friction
Most work on skid resistance relates to wet roads. However, there may be situations in which
dry road friction becomes a contributory factor in crashes. In the 1980s, Roger Hosking from
TRL (then the TRRL) carried out a study investigating the effect of seasonal variations on
16 Version 1.0 September 2012
accident frequency in the U.K. (Hosking 1986). He observed that on most of the geographical
regions and groups of roads studied, changes in dry-road skidding rates were related to wet-road
skid resistance. However, he attributed this apparent correlation at least in part to misreporting
of roads in the accident statistics as dry when they were actually damp.
Since then, in-service skid resistance standards have been enforced since 1987, and the vast
majority of roads (especially the main highways) now have good wet skid resistance and
macrotexture. It has been found (as do the police investigating crashes) that the measured dry
friction (locked-wheel) is pretty consistently similar across the network and that wet friction is
much more variable. Therefore, it is recommended that a PFMP focus on the worst case of wet
road conditions.
5. What Is Equipment Calibration and Harmonization?
Calibration of equipment is generally done to make sure the equipment is performing properly
and ensure that measurements are accurate. Although calibration can improve the accuracy of
the equipment, there will still be some error in the measurements. It has been proposed that to
minimize the effect of error in the accuracy of the equipment, measurements should be adjusted
to a common scale. This process is called harmonization and is generally proposed after
calibration.
5.1. Calibration
Equipment calibration involves all the periodic checks that are performed on the friction tester to
ensure that the instrument is collecting accurate measurements. Most equipment users perform
in-house calibration prior to testing. This includes calibration of water delivery system, speed
measuring equipment, and force/torque transducers (Henry 2000).
ASTM standards E274 and E2793 provide instructions regarding to calibrating the speed and
skid resistance force of the full-scale tire friction testers. Speed calibration can be done by
measuring the travel time of the friction tester on a pre-measured length of pavement surface.
The surface should be reasonably flat and straight and the test vehicle should be loaded to the
normal test conditions. Force transducer calibration can also be performed in accordance with
ASTM E274.
In the US, two specialized calibration centers, the Transportation Research Center Inc. (TRC
Inc.) in Ohio and the Texas Transportation Institute (TTI) in Texas, provide E2793 Area
Reference Friction Measurement Systems (ARFMS), along with several asphalt and concrete test
surfaces that are used to calibrate locked-wheel friction testers based on ASTM standards.
5.2. Harmonization
ASTM has defined harmonization of measurements as “the adjustments of the outputs of
different devices used for the measurement of a specific phenomenon so that all devices report
the same value” (ASTM E 2100). Several studies dealing with harmonization of friction
measurement equipment have been made. These include the Permanent International Association
of Road Congress (PIARC or World Road Association) International Experiment from the early
1990s, the European HERMES project, the NASA Friction Workshops at Wallops Flight
Facility, the Virginia Tech Transportation Institute (VTTI) Pavement Surface Properties

17 Version 1.0 September 2012
Consortium Rodeo Reports, and the “Tyre and Road Surface Optimisation for Skid resistance
and Further Effects” (TYROSAFE) (Adewole 2008).
5.3. The International Friction Index
The PIARC experiment developed the International Friction Index (IFI) to compare and
harmonize between various methods used around the world to measure friction and texture
(Wambold et al. 1995). The IFI is composed of two parameters: a speed constant (Sp) and a
friction number at 60 km/hr. (F60). The speed constant (Sp) is ideally predicted by a
macrotexture measurement.
According to ASTM E1960, the IFI can be calculated following the following steps:
i. Measure the friction FR(S) at the recommended slip speed (S) for the device used
ii. Measure the Mean Profile Depth (MPD) based on ASTME1845
iii. Calculate the speed constant (Sp) according to:
MPDS p 7.892.14 (5)
Convert the friction at the measured slip speed S (FR(S)) to the friction at the standard 60
km/hr. friction (FR60):
pS
S
eFRSFR
60
60
(6)
where: FR60 = Adjusted friction
FRS = Measured friction
S = Slip speed
iv. The final step is to calculate the calibrated friction F60:
TXCeFRSBAF TXba
S
60
60 (7)
where A, B and C are the calibration factors for the friction equipment used, and a and b,
are the ones for the texture equipment used.
The IFI model builds on an early model developed at Penn State that had the same shape but
used a different parameter, the friction at zero speed, µ0, and the percent normalized gradient,
PNG (Henry 2000).
6. How to implement Pavement Friction Management Programs
Pavement friction management includes both engineering practices to provide a pavement
surface with adequate and durable friction and also periodic data collection and analysis to
ensure the effectiveness of these practices. There will be occasional situations where a sudden
change of friction on the road can cause crashes if it happens to be in the “wrong place” –
perhaps just where a driver has chosen to apply the brakes or in the sharpest part of a curve
where there has previously been sufficient traction for the radius and speed – but even then its
causative potential and the severity of the result depend on the combinations of other
circumstances. Such changes might be more important for certain vehicle types – motorcycles,
for example.

18 Version 1.0 September 2012
If the reason that the road is slippery is due to some external factor, such as ice on the surface or
a local oil spillage, there is little that the road engineer can do, apart from taking measures to
prevent ice from forming or having procedures in place to clean up spills. If, however, the road
has inherently poor skid resistance because of the materials of which it is made and how those
materials have reacted to the passage of traffic over time, then it can be said that the road may
contribute to crashes and road engineers should be able to detect such situations and take
appropriate action. Inadequate cross slope and/or grade can also contribute to crashes by
contributing to flooding of the road.
6.1. Friction demand
Factors such as traffic volume, geometrics (curves, grades, cross-slope, sight distance, etc.),
potential for conflicting vehicle movements, and intersections should be considered for
determining friction demand. Curves and intersections also tend to lose friction at a faster rate
than other roadway locations and thus justify a higher friction demand. Thus, friction demand is
the level of friction needed to safely perform braking, steering, and acceleration maneuvers.
Highway agencies can establish Investigatory Level (desirable) and Intervention Level
(minimum) values for pavement friction and texture in accordance with the AASHTO Guide for
Pavement Friction.
6.2. The role of Pavement Friction Management Programs (PFMP)
The role of a Pavement Friction Management Programs (PFMP) or policy is to provide a
framework by which road engineers can monitor the condition of their networks and, based on
objective evidence, make appropriate judgments regarding treating or resurfacing the road in
those situations that require it. This involves balancing the risk of a crash occurring with the
costs and practicalities of providing adequate friction.
There will be significant sections of the network, especially lightly trafficked routes or on major
highways with two or more lanes and traffic flowing in one direction only, where situations
likely to involve skidding are generally rare or where the contributory factors are completely
unpredictable (even those caused by braking due to traffic weaving). It could be argued that, in
these circumstances, it is not practical to expect to provide extremely high performance on the
off-chance that someone (whether prompted, for example, by a wild animal running on to the
road or an unexpected action from another road user) decides to brake suddenly or swerve
sharply on that particular spot. On the other hand, in places where it is known that drivers
frequently need to brake or turn at speed, for instance, higher friction levels are likely to be
needed than would be adequate elsewhere.
By enabling vehicles to reduce speeds more rapidly or allowing control to be retained for longer,
the consequences of a crash in terms of death or severity of injury may be improved. Although
crashes will probably never be completely eliminated, an effective policy can reduce collision
risk and reduce the severity level of those crashes that do happen. Therefore, in developing a
PFMP, all these factors will need to be considered. However, at the heart of the PFMP is the
monitoring of skid resistance on the network with the appropriate measuring equipment.
Since the range of factors causing crashes is so broad, it is next to impossible to decide on a test
method that can be directly predictive and cover all circumstances. In the long term, multi-

19 Version 1.0 September 2012
function devices might provide a solution, but it is unlikely that any one device can be
specifically linked to crash prediction. Rather, measurements should be used to set criteria for
judging the road based on an analysis of crashes, as it is recommended in the AASHTO Guide
for Pavement Friction (Hall et al. 2009) and as is the approach in the other countries (Viner et al.
2005).
Through appropriate pavement design, construction, and maintenance practices; highway
agencies can ensure their pavement surfaces provide adequate friction. FHWA Technical
Advisory TA 5040.36 "Surface Texture for Asphalt and Concrete Pavements" provides
guidelines on state-of-the-practice techniques for providing adequate surface texture and friction
(FHWA 2010).
Locations with high rate of wet-weather crashes need to be identified and investigated for the
purposes of minimizing friction-related crash rates. The procedure is commonly done by
calculating the ratio between wet weather crashes and total crashes (wet + dry) and then
following one of the subsequent approaches (FHWA 2010):
i. Agencies may use a specific value for the wet crash ratio above which a location will be
identified as an elevated wet-weather crash location. Depending on geographical and
climate circumstances this ratio can vary between 0.25 and 0.5.
ii. Agencies may compare the wet crash ratio with the average ratio for that functional class
of highway in that area. If the computed ratio is above the average by a specified
percentage that location is identified as an elevated wet-weather crash location.
iii. A minimum number of wet-weather or total crashes within a segment is another criterion
that some agencies use in order for a segment to be identified as an elevated wet-weather
crash location.
6.3. Frequency of friction testing
Roads with the highest traffic volumes, the highest likelihood of changes in friction over time,
and the highest friction demand justify the most frequent monitoring of friction (FHWA 2010).
A risk-based approach can be implemented to determine the frequency of the friction test for
roadway networks. Roads with higher friction demand require more frequent friction
monitoring. Many agencies monitor the friction of their important roadway network on an
annual basis, while a 2 to 5 year cycle may be appropriate for the part of network with lower-risk
(FHWA 2010).
Network friction monitoring is generally not necessary in both wheel paths. The left wheel path
is generally considered to have the most traffic due to passing maneuvers and is the most
frequently tested in the US (FHWA 2010).
7. How do we Achieve and Maintain Adequate Tire pavement Friction
7.1. Designing for Friction
Pavement friction design involves utilizing proper materials and construction techniques to
achieve high level of microtexture and microtexture in pavement surface. The type of aggregates
used in the surface mix directly affects the microtexture while gradation and size of aggregates

20 Version 1.0 September 2012
governs the macrotexture properties of pavement surface (Hall et al. 2009). In asphalt mixtures,
large aggregates govern the frictional properties of the surface while for concrete mixes, fine
aggregates control the frictional properties (Hall et al. 2009).
The wear characteristics of aggregates are also important in maintaining proper friction level.
Aggregates mineralogy and hardiness directly affect the durability and polish ability of the
aggregates. It is generally better to have aggregates with different size and wear characteristics
in the mix so they can constantly renew the surface (Hall et al. 2009).
7.2. Restoring Friction
There are several methods that can be used to restore the frictional properties of old pavements.
Diamond grooving is a techniques that is used mostly in order to improve the frictional
properties of the concrete pavement surfaces (Martinez 1977). The method uses diamond
infused steel cutting blades for grinding and grooving concrete pavement. For grinding, the
blades are spaced close together so that they can cut the pavement’s unevenness (megatexture)
and leave a rough pavement surface (high microtexture). For grooving, the blades are further
spaced out so they create channels on the pavement surface which increases the friction by
improving water drainage (high macrotexture) (Wulf et al. 2008).
Using High Friction Surfaces (HFS) in epoxy overlays is another option to restore surface
friction, on both concrete and asphalt pavements. This method can increase the surface friction
without jeopardizing other surface characteristics including noise and durability. HFS treatments
utilize a durable aggregate and some type of resin (binder) to hold the aggregate particles
together and glued to the road surface. There are several types of HFS commercially available in
the market including: Cargill, Tyregrip, Italgrip, Crafco, Flexogrid, etc. (Roa 2008).
8. Summary and Conclusions
It is important for highway agencies to monitor the pavement friction periodically and
systematically to support their safety management programs. The data collected data can help
implement preservation policies that improve the safety of the roadway network and decrease the
number of skidding-related crashes.
This document discusses principles of tire pavement friction and surface texture. Methods for
measuring friction and texture are further discussed. The importance of friction in safety design
of highways is also highlighted. The information in this document can be used by state DOTs
and highway agencies to effectively use tire pavement friction data for supporting asset
management decisions.
21 Version 1.0 September 2012
9. References
1. Adewole, A. (2008). "Deliverable 02: Report on Dissemination Strategy, Tyre and Road
Surface Optimisation for Skid Resistance and Further Effects (TYROSAFE), Forum of
European National Highway Research Laboratories (FEHRL)."
2. Bazlamit, S., and Reza, F. (2005). "Changes in Asphalt Friction Components and
Adjustment Number for Temperature." The Journal of Transportation Engineering,
ASCE 2005:131-470.
3. Colony, D. (1992). "Influence of traffic, surface age and environment on skid number."
Ohio Department of Transportation Project Number 14460 Final Report, Columbus,
Ohio.
4. Faung, H., and Hughes, W. (2007). "Friction Monitoring of SuperPave Mixes in
Virginia." Virginia Highway & Transportation Research Council: 8-9.
5. FHWA (2010). "Technical Advisory T5040.38, Pavement Friction Management."
6. Hall, J. W., Program, N. C. H. R., and Board, N. R. C. T. R. (2009). Guide for pavement
friction, National Cooperative Highway Research Program, Transportation Research
Board of the National Academies.
7. Henry, J. J. (2000). Evaluation of pavement friction characteristics, Transportation
Research Board.
8. Henry, J. J. (2000). "Evaluation of Pavement Friction Characteristics: A Synthesis of
Highway Practice, NCHRP Synthesis 291, Transportation Research Board, National
Research Council, Washington, D.C.".
9. Hosking, J. (1986). "Relationship between skidding resistance and accident frequency —
estimates based on seasonal variation." TRRL Research Report 76, Transport Research
Laboratory, Crowthorne, UK.
10. Ivey, D. L., Griffin III, L. I., Lock, J. R., and Bullard, D. L. (1992). "Texas Skid Initiated
Accident Reduction Program."
11. Jayawickrama, P., and Thomas, B. (1998). "Correction of Field Skid Measurements for
Seasonal Variations in Texas." Transportation Research Board 1639:147-152.
12. Li, S., Noureldin, S., and Zhu, K. (2004). "Upgrading the INDOT Pavement Friction
Testing Program." Joint Transportation Research Program, Perdue Libraries: 6-9.
13. Martinez, J. (1977). "Effects of pavement grooving on friction, braking, and vehicle
control."
14. Najafi, S., Flintsch, G. W., and McGhee, K. K. (2012). "Assessment of operational
characteristics of continuous friction measuring equipment (CFME)."
15. Roa, J. A. (2008). "EVALUATION OF INTERNATIONAL FRICTION INDEX AND
HIGHFRICTION SURFACES." Virginia Polytechnic Institute and State University.
16. Roe, P. G., and Sinhal, R. (1998). "The Polished Stone Value of aggregates and in-
service skidding resistance." TRL Report 322, TRL, Crowthorne, UK.
17. Shahin, M. Y. (2005). Pavement management for airports, roads, and parking lots,
Springer Verlag.
18. Viner, H. E., Parry, A. R., and Sinhal, R. (2005). "Linking road traffic accidents with skid
resistance – recent UK developments, International Conference on Surface Friction of
Roads and Runways, Christchurch, New Zealand."
19. Wambold, J., Antle, C., Henry, J., and Rado, Z. (1995). "PIARC (Permanent
International Association of Road Congress) Report." International PIARC Experiment to

22 Version 1.0 September 2012
Compare and Harmonize Texture and Skid Resistance Measurement, C-1 PIARC
Technical Committee on Surface Characteristics, France.
20. Wulf, T., Dare, T., and Bernhard, R. (2008). "The effect of grinding and grooving on the
noise generation of Portland Cement Concrete pavement." Journal of the Acoustical
Society of America, 123(5), 3390.
21. NHTSA, Traffic Safety Facts 2010, US DOT, (Accessed on September 12, 2012),
[online] available at: http://www-nrd.nhtsa.dot.gov/Pubs/811659.pdf
22. Rizenbergs, R.L., Burchett, J.L., and Napier, C.T., 1972. “Skid Resistance of
Pavements,” Report No. KYHPR-64-24, Part II, Kentucky Department of Highways,
Lexington, Kentucky.
23. Moore, D.F. (1966), Prediction of Skid-Resistant Gradient and Drainage Characteristics
of Pavements, Highway Research Record 131, Highway Research Board, Washington,
D.C., pp. 181-203.
24. FHWA, Focus, October 2011. (Accessed on September 12, 2012), [online] available at:
http://www.fhwa.dot.gov/publications/focus/11oct/11oct.pdf