The Link between Default and Recovery Rates: Theory, Empirical
26
Edward I. Altman Stern School of Business, New York University Brooks Brady Standard and Poor’s Andrea Resti Bocconi University, Italy Andrea Sironi Bocconi University, Milan The Link between Default and Recovery Rates: Theory, Empirical Evidence, and Implications* I. Introduction Credit risk affects virtually every financial contract. Therefore the measurement, pricing, and manage- ment of credit risk have received much attention from financial economists, bank supervisors and regulators, and financial market practitioners. Fol- lowing the recent attempts of the Basel Committee on Banking Supervision (1999, 2001) to reform the capital adequacy framework by introduc- ing risk-sensitive capital requirements, significant (Journal of Business, 2005, vol. 78, no. 6) B 2005 by The University of Chicago. All rights reserved. 0021-9398/2005/7806-0006$10.00 2203 * This paper is a significant extension of a report prepared for the International Swaps and Dealers Association ( ISDA; 2000). We thank ISDA for its financial and intellectual support. We thank Richard Herring, Hiroshi Nakaso, and the other partic- ipants at the BIS conference ( March 6, 2002) on ‘‘Changes in Risk through Time: Measurement and Policy Options’’ (London) for their useful comments. The paper also profited by the comments from participants in the CEMFI (Madrid, Spain) Workshop on April 2, 2002, especially Rafael Repullo, Enrique Sentana, and Jose Campa; from workshops at the Stern School of Busi- ness (NYU), University of Antwerp, University of Verona, and Bocconi University; and from an anonymous reviewer. This paper analyzes the association between default and recovery rates on credit assets and seeks to empirically explain this critical relationship. We examine recovery rates on corporate bond defaults over the period 1982–2002. Our econometric univariate and multivariate models explain a significant portion of the variance in bond recovery rates aggregated across seniority and collateral levels. We find that recovery rates are a function of supply and demand for the securities, with default rates playing a pivotal role. Our results have important implications for credit risk models and for the procyclicality effects of the New Basel Capital Accord.
Transcript of The Link between Default and Recovery Rates: Theory, Empirical

Edward I. AltmanStern School of Business, New York University
Brooks BradyStandard and Poor’s
Andrea RestiBocconi University, Italy
Andrea SironiBocconi University, Milan
The Link between Defaultand Recovery Rates: Theory,Empirical Evidence,and Implications*
I. Introduction
Credit risk affects virtually every financial contract.Therefore the measurement, pricing, and manage-ment of credit risk have received much attentionfrom financial economists, bank supervisors andregulators, and financial market practitioners. Fol-lowing the recent attempts of the Basel Committeeon Banking Supervision (1999, 2001) to reformthe capital adequacy framework by introduc-ing risk-sensitive capital requirements, significant
(Journal of Business, 2005, vol. 78, no. 6)B 2005 by The University of Chicago. All rights reserved.0021-9398/2005/7806-0006$10.00
2203
* This paper is a significant extension of a report prepared forthe International Swaps and Dealers Association ( ISDA; 2000).We thank ISDA for its financial and intellectual support. Wethank Richard Herring, Hiroshi Nakaso, and the other partic-ipants at the BIS conference (March 6, 2002) on ‘‘Changes in Riskthrough Time: Measurement and Policy Options’’ (London) fortheir useful comments. The paper also profited by the commentsfrom participants in the CEMFI (Madrid, Spain) Workshopon April 2, 2002, especially Rafael Repullo, Enrique Sentana,and Jose Campa; from workshops at the Stern School of Busi-ness (NYU), University of Antwerp, University of Verona, andBocconi University; and from an anonymous reviewer.
This paper analyzes theassociation betweendefault and recoveryrates on credit assetsand seeks to empiricallyexplain this criticalrelationship. Weexamine recovery rateson corporate bonddefaults over the period1982–2002. Oureconometric univariateand multivariate modelsexplain a significantportion of the variancein bond recovery ratesaggregated acrossseniority and collaterallevels. We find thatrecovery rates are afunction of supplyand demand for thesecurities, with defaultrates playing a pivotalrole. Our results haveimportant implicationsfor credit risk modelsand for the procyclicalityeffects of the New BaselCapital Accord.

additional attention has been devoted to the subject of credit risk measure-ment by the international regulatory, academic, and banking communities.This paper analyzes and measures the association between aggregate
default and recovery rates on corporate bonds and seeks to empiricallyexplain this critical relationship. After a brief review of the way creditrisk models explicitly or implicitly treat the recovery rate variable,Section III examines the recovery rates on corporate bond defaults overthe period 1982–2002. We attempt to explain recovery rates by speci-fying rather straightforward linear, logarithmic, and logistic regressionmodels. The central thesis is that aggregate recovery rates are basicallya function of supply and demand for the securities. Our econometricunivariate and multivariate time-series models explain a significant por-tion of the variance in bond recovery rates aggregated across all se-niority and collateral levels. In Sections IV and V, we briefly examinethe effects of the relationship between defaults and recoveries on creditVaR (value at risk) models and the procyclicality effects of the newcapital requirements proposed by the Basel Committee, then concludewith some remarks on the general relevance of our results.
II. The Relationship between Default Rates and Recovery Rates in Credit
Risk Modeling: A Review of the Literature
Credit risk models can be divided into three main categories: (1) ‘‘firstgeneration’’ structural-form models, (2) ‘‘second generation’’ structural-form models, and (3) reduced-form models. Rather than go through adiscussion of each of these well-known approaches and their advocates inthe literature, we refer the reader to our earlier report for ISDA (Altman,Resti, and Sironi 2001), which carefully reviews the literature on theconceptual relationship between the firm’s probability of default (PD) andthe recovery rate (RR) after default to creditors.1
During the last few years, new approaches explicitly modeling andempirically investigating the relationship between PD and RR have beendeveloped. These include Frye (2000a, 2000b), Jokivuolle and Peura(2003), and Jarrow (2001). The model proposed by Frye draws from theconditional approach suggested by Finger (1999) and Gordy (2000). Inthese models, defaults are driven by a single systematic factor–the stateof the economy–rather than by a multitude of correlation parameters.The same economic conditions are assumed to cause defaults to rise, forexample, and RRs to decline. The correlation between these two varia-bles therefore derives from their common dependence on the systematicfactor. The intuition behind Frye’s theoretical model is relatively simple:if a borrower defaults on a loan, a bank’s recovery may depend on thevalue of the loan collateral. The value of the collateral, like the value of
1. See Altman, Resti and Sironi (2001) for a formal discussion of this relationship.
2204 Journal of Business

other assets, depends on economic conditions. If the economy experi-ences a recession, RRsmay decrease just as default rates tend to increase.This gives rise to a negative correlation between default rates and RRs.The model originally developed by Frye (2000a) implied recovery froman equation that determines collateral. His evidence is consistent with themost recent U.S. bond market data, indicating a simultaneous increase indefault rates and losses given default (LGDs)2 in 1999–2001.3 Frye’s(2000b, 2000c) empirical analysis allows him to conclude that, in asevere economic downturn, bond recoveries might decline 20–25 per-centage points from their normal-year average. Loan recoveries maydecline by a similar amount but from a higher level.Jarrow (2001) presents a new methodology for estimating RRs and
PDs implicit in both debt and equity prices. As in Frye (2000a, 2000b),RRs and PDs are correlated and depend on the state of the economy. How-ever, Jarrow’s methodology explicitly incorporates equity prices in the es-timation procedure, allowing the separate identification of RRs and PDsand the use of an expanded and relevant data set. In addition, the meth-odology explicitly incorporates a liquidity premium in the estimation pro-cedure, which is considered essential in the light of the high variability inthe yield spreads between risky debt and U.S. Treasury securities.A rather different approach is proposed by Jokivuolle and Peura
(2000). The authors present a model for bank loans in which collateralvalue is correlated with the PD. They use the option pricing frameworkfor modeling risky debt: the borrowing firm’s total asset value deter-mines the event of default. However, the firm’s asset value does notdetermine the RR. Rather, the collateral value is in turn assumed to bethe only stochastic element determining recovery. Because of this as-sumption, the model can be implemented using an exogenous PD, so thatthe firm’s asset value parameters need not be estimated. In this respect,the model combines features of both structural-form and reduced-formmodels. Assuming a positive correlation between a firm’s asset value andcollateral value, the authors obtain a result similar to Frye (2000a), thatrealized default rates and recovery rates have an inverse relationship.UsingMoody’s historical bondmarket data, Hu and Perraudin (2002)
examine the dependence between recovery rates and default rates. Theyfirst standardize the quarterly recovery data to filter out the volatility ofrecovery rates given by the variation over time in the pool of borrow-ers rated by Moody’s. They find that correlations between quarterlyrecovery rates and default rates for bonds issued by U.S.-domiciled
2. LGD indicates the amount actually lost (by an investor or a bank) for each dollar lentto a defaulted borrower. Accordingly, LGD and RR always add to 1. One may also factorinto the loss calculation the last coupon payment, which is usually not realized when adefault occurs (see Altman 1989).3. Gupton, Hamilton, and Berthault (2001) provide clear empirical evidence of this
phenomenon.
2205Default and Recovery Rates

obligors are 0.22 for post 1982 data (1983–2000) and 0.19 for the1971–2000 period. Using extreme value theory and other nonpara-metric techniques, they also examine the impact of this negative cor-relation on credit VaR measures and find that the increase is statisticallysignificant when confidence levels exceed 99%.Bakshi, Madan, and Zhang (2001) enhance the reduced-form mod-
els presented earlier to allow for a flexible correlation between the risk-free rate, the default probability, and the recovery rate. Based on somepreliminary evidence published by rating agencies, they force recoveryrates to be negatively associated with default probability. They find somestrong support for this hypothesis through the analysis of a sample ofBBB-rated corporate bonds: more precisely, their empirical results showthat, on average, a 4% worsening in the (risk-neutral) hazard rate is asso-ciated with a 1% decline in (risk-neutral) recovery rates.Compared to the aforementioned contributions, our study extends
the existing literature in three main directions. First, the determinantsof defaulted bonds’ recovery rates are empirically investigated. Whilemost of the aforementioned recent studies concluded in favor of aninverse relationship between these two variables, based on the com-mon dependence on the state of the economy, none of them empiricallyanalyzed the more specific determinants of recovery rates. While ouranalysis shows empirical results that appear consistent with the intuitionof a negative correlation between default rates and RRs, we find that asingle systematic risk factor (the performance of the economy) is lesspredictive than the aforementioned theoretical models would suggest.Second, our study is the first one to examine, both theoretically and
empirically, the role played by supply and demand of defaulted bonds indetermining aggregate recovery rates. Our econometric univariate andmultivariate models assign a key role to the supply of defaulted bonds andshow that these variables together with variables that proxy the size of thehigh-yield bond market explain a substantial proportion of the variance inbond recovery rates aggregated across all seniority and collateral levels.Third, our simulations show the consequences the negative correla-
tion between default and recovery rates would have on VaR models andthe procyclicality effect of the capital requirements recently proposedby the Basel Committee. Indeed, while our results on the impact of thiscorrelation on credit risk measures (such as unexpected loss and value atrisk) are in line with the ones obtained by Hu and Perraudin (2002), theyshow that, if a positive correlation highlighted by bond data were to beconfirmed by bank data, the procyclicality effects of ‘‘Basel II’’ mightbe even more severe than expected if banks use their own estimates ofLGD. Indeed, the Basel Commission assigned a task force in 2004 toanalyze ‘‘recoveries in downturns’’ in order to assess the significance of adecrease in activity on LGD. A report was issued in July 2005 with someguidelines for banks ({ 468 of the framework document).
2206 Journal of Business

As concerns specifically the Hu and Perraudin paper, it should bepointed out that they correlate recovery rates (or percent of par, which isthe same thing) with issuer-based default rates. Our models assess therelationship between dollar-denominated default and recovery rates and,as such, can assess directly the supply/demand aspects of the defaulteddebt market. Moreover, in addition to assessing the relationship betweendefault and recovery rates using ex post default rates, we explore the effectof using ex ante estimates of the future default rates (i.e., default prob-abilities) instead of actual, realized defaults. As will be shown, however,while the negative relationship between RR and both ex post and ex antedefault rates is empirically confirmed, the probabilities of default show aconsiderably lower explanatory power. Finally, it should be emphasizedthat, while our paper and the one by Hu and Perraudin reach similarconclusions, albeit from very different approaches and tests, it is im-portant that these results become accepted and are subsequently reflectedin future credit risk models and public policy debates and regulations.For these reasons, concurrent confirming evidence from several sourcesare beneficial, especially if they are helpful in specifying fairly preciselythe default rate/recovery rate nexus.
III. Explaining Aggregate Recovery Rates on Corporate Bond Defaults:
Empirical Results
The average loss experience on credit assets is well documented instudies by the various rating agencies (Moody’s, S&P, and Fitch) aswell as by academics.4 Recovery rates have been observed for bonds,stratified by seniority, as well as for bank loans. The latter asset class canbe further stratified by capital structure and collateral type (Van deCastle and Keisman 2000). While quite informative, these studies saynothing about the recovery versus default correlation. The purpose ofthis section is to empirically test this relationship with actual defaultdata from the U.S. corporate bond market over the last two decades. Aspointed out in Section II, strong intuition suggests that default andrecovery rates might be correlated. Accordingly, this section of ourstudy attempts to explain the link between the two variables, by spec-ifying rather straightforward statistical models.5
We measure aggregate annual bond recovery rates (henceforth, BRR)by the weighted average recovery of all corporate bond defaults, primarily
4. See, e.g., Altman and Kishore (1996), Altman and Arman (2002), FITCH (1997,2001), Standard & Poor’s (2000).5. We will concentrate on average annual recovery rates but not on the factors that con-
tribute to understanding and explaining recovery rates on individual firm and issue defaults.Unal, Madan, and Guntay (2003) propose a model for estimating risk-neutral expected re-covery rate distributions, not empirically observable rates. The latter can be particularly usefulin determining prices on credit derivative instruments, such as credit default swaps.
2207Default and Recovery Rates

in theUnited States, over the period 1982–2001. Theweights are based onthe market value of defaulting debt issues of publicly traded corporatebonds.6 The logarithm of BRR (BLRR) is also analyzed.The sample includes annual and quarterly averages from about 1,300
defaulted bonds for which wewere able to get reliable quotes on the priceof these securities just after default. We utilize the database constructedand maintained by the NYU Salomon Center, under the direction of oneof the authors. Our models are both univariate and multivariate leastsquares regressions. The univariate structures can explain up to 60% ofthe variation of average annual recovery rates, while the multivariatemodels explain as much as 90%.The rest of this section proceeds as follows. We begin our analysis by
describing the independent variables used to explain the annual variationin recovery rates. These include supply-side aggregate variables that arespecific to the market for corporate bonds, as well as macroeconomicfactors (some demand-side factors, like the return on distressed bondsand the size of the ‘‘vulture’’ funds market, are discussed later). Next, wedescribe the results of the univariate analysis. We then present our mul-tivariate models, discussing themain results and some robustness checks.
A. Explanatory Variables
We proceed by listing several variables we reasoned could be correlatedwith aggregate recovery rates. The expected effects of these variableson recovery rates will be indicated by a + or � sign in parentheses. Theexact definitions of the variables we use are:
BDR(�). The weighted average default rate on bonds in thehigh-yield bond market and its logarithm (BLDR, (�)).Weights are based on the face value of all high-yield bondsoutstanding each year and the size of each defaultingissue within a particular year.7
6. Prices of defaulted bonds are based on the closing ‘‘bid’’ levels on or as close to thedefault date as possible. Precise-date pricing was possible only in the last 10 years or so,since market maker quotes were not available from the NYU Salomon Center database priorto 1990 and all prior date prices were acquired from secondary sources, primarily the S&PBond Guides. Those latter prices were based on end-of-month closing bid prices only. Wefeel that more exact pricing is a virtue, since we are trying to capture supply and demand dy-namics, which may affect prices negatively if some bondholders decide to sell their defaultedsecurities as fast as possible. In reality, we do not believe this is an important factor, sincemany investors will have sold their holdings prior to default or are more deliberate in their‘‘dumping’’ of defaulting issues.7. We did not include a variable that measures the distressed but not defaulted proportion
of the high-yield market, since we do not know of a time-series measure that goes back to1987. We define distressed issues as yielding more than 1,000 basis points over the risk-free10-year Treasury bond rate. We did utilize the average yield spread in the market and foundit was highly correlated (0.67) to the subsequent 1-year’s default rate, hence it did not addvalue (see the discussion later). The high-yield bond yield spread, however, can be quitehelpful in forecasting the following year’s BDR, a critical variable in our model (see ourdiscussion of a default probability prediction model in Section III.F).
2208 Journal of Business

BDRC(�). The 1-year change in BDR.BOA(�). The total amount of high-yield bonds outstanding for
a particular year (measured at midyear in trillions ofdollars), which represents the potential supply ofdefaulted securities. Since the size of the high-yieldmarket has grown in most years over the sample period,the BOA variable picks up a time-series trend as wellas representing a potential supply factor.
BDA(�). We also examined the more directly related bonddefaulted amount as an alternative for BOA(also measured in trillions of dollars).
GDP(+). The annual GDP growth rate.GDPC(+). The change in the annual GDP growth rate from the
previous year.GDPI(�). Takes the value of 1 when GDP growth was less than
1.5% and 0 when GDP growth was greater than 1.5%.SR(+). The annual return on the S&P 500 stock index.
SCR(+). The change in the annual return on the S&P 500 stockindex from the previous year.
B. The Basic Explanatory Variable: Default Rates
It is clear that the supply of defaulted bonds is most vividly depicted bythe aggregate amount of defaults and the rate of default. Since virtuallyall public defaults most immediately migrate to default from the non-investment grade or ‘‘junk’’ bond segment of the market, we use thatmarket as our population base. The default rate is the par value of default-ing bonds divided by the total amount outstanding, measured at facevalues. Table 1 shows default rate data from 1982–2001, as well as theweighted average annual recovery rates (our dependent variable) and thedefault loss rate (last column). Note that the average annual recovery is41.8% (weighted average 37.2%) and the weighted average annual lossrate to investors is 3.16%.8 The correlation between the default rate andthe weighted price after default amounts to 0.75.
C. The Demand and Supply of Distressed Securities
The logic behind our demand/supply analysis is both intuitive and im-portant, especially since, as we have seen, most credit risk models do notformally and statistically consider this relationship. On amacroeconomic
8. The loss rate is affected by the lost coupon at default as well as the more important lostprincipal. The 1987 default rate and recovery rate statistics do not include the massive Texacodefault , since it was motivated by a lawsuit which was considered frivolous, resulting in astrategic bankruptcy filing and a recovery rate (price at default) of over 80%. Including Texacowould have increased the default rate by over 4% and the recovery rate to 82% (reflecting thehuge difference between the market’s assessment of asset values versus liabilities, not typicalof bankrupt companies). The results of our models would be less impressive, although stillquite significant, with Texaco included.
2209Default and Recovery Rates

level, forces that cause default rates to increase during periods of eco-nomic stress also cause the value of assets of distressed companies todecrease. Hence the securities’ values of these companies will likely belower. While the economic logic is clear, the statistical relationship be-tween GDP variables and recovery rates is less significant than what onemight expect. We hypothesized that, if one drills down to the distressedfirmmarket and its particular securities, we can expect a more significantand robust negative relationship between default and recovery rates.9
TABLE 1 Default Rates, Recovery Rates, and Losses
Year
Par ValueOutstanding
(a)($million)
Par Valueof Defaults
(b)($million)
DefaultRate
Weighted Priceafter Default(Recovery
Rate)WeightedCoupon
Default Loss(c)
2001 $649,000 $63,609 9.80% 25.5 9.18% 7.76%2000 $597,200 $30,295 5.07% 26.4 8.54% 3.95%1999 $567,400 $23,532 4.15% 27.9 10.55% 3.21%1998 $465,500 $7,464 1.60% 35.9 9.46% 1.10%1997 $335,400 $4,200 1.25% 54.2 11.87% .65%1996 $271,000 $3,336 1.23% 51.9 8.92% .65%1995 $240,000 $4,551 1.90% 40.6 11.83% 1.24%1994 $235,000 $3,418 1.45% 39.4 10.25% .96%1993 $206,907 $2,287 1.11% 56.6 12.98% .56%1992 $163,000 $5,545 3.40% 50.1 12.32% 1.91%1991 $183,600 $18,862 10.27% 36.0 11.59% 7.16%1990 $181,000 $18,354 10.14% 23.4 12.94% 8.42%1989 $189,258 $8,110 4.29% 38.3 13.40% 2.93%1988 $148,187 $3,944 2.66% 43.6 11.91% 1.66%1987 $129,557 $1,736 1.34% 62.0 12.07% .59%1986 $90,243 $3,156 3.50% 34.5 10.61% 2.48%1985 $58,088 $992 1.71% 45.9 13.69% 1.04%1984 $40,939 $344 .84% 48.6 12.23% .48%1983 $27,492 $301 1.09% 55.7 10.11% .54%1982 $18,109 $577 3.19% 38.6 9.61% 2.11%Weighted
average 4.19% 37.2 10.60% 3.16%
Note.—Default rate data from 1982–2001 are shown, as well as the weighted average annualrecovery rates and the loss rates. The time series show a high correlation (75%) between default andrecovery rates.
(a) Measured at mid-year, excludes defaulted issues.(b) Does not include Texaco’s bankruptcy in 1987.(c) Includes lost coupon as well as principal loss.Source: Authors’ compilations.
9. Consider the latest highly stressful period of corporate bond defaults in 2000–02. Thehuge supply of bankrupt firms’ assets in sectors like telecommunications, airlines, and steel, toname a few, has had a dramatic negative impact on the value of the firms in these sectors as theyfiled for bankruptcy and attempted a reorganization under Chapter 11. Altman and Jha (2003)estimated that the size of the U.S. distressed and defaulted public and private debt marketsswelled from about $300 billion (face value) at the end of 1999 to about $940 billion by year-end 2002. And, only 1 year in that 3-year period was officially a recession year (2001). As wewill show, the recovery rate on bonds defaulting in this period was unusually low as telecomequipment, large body aircraft, and steel assets of distressed firms piled up.
2210 Journal of Business
The principal purchasers of defaulted securities, primarily bonds andbank loans, are niche investors called distressed asset or alternativeinvestment managers, also called vultures. Prior to 1990, there was littleor no analytic interest in these investors, indeed in the distressed debtmarket, except for the occasional anecdotal evidence of performance insuch securities. Altman (1991) was the first to attempt an analysis of thesize and performance of the distressed debt market and estimated, basedon a fairly inclusive survey, that the amount of funds under managementby these so-called vultures was at least $7.0 billion in 1990 and, if youinclude those investors who did not respond to the survey and non-dedicated investors, the total was probably in the $10–12 billion range.Cambridge Associates (2001) estimated that the amount of distressedassets under management in 1991 was $6.3 billion. Estimates since1990 indicate that the demand did not rise materially until 2000–01,when the estimate of total demand for distressed securities was about$40–45 billion as of December 31, 2001 and $60–65 billion 1 year later(see Altman and Jha 2003). So, while the demand for distressed secu-rities grew slowly in the 1990s and early in the next decade, the supply(as we will show) grew enormously.On the supply side, the last decade has seen the amounts of distressed
and defaulted public and private bonds and bank loans grow dramati-cally in 1990–91 to as much as $300 billion (face value) and $200billion (market value), then recede to much lower levels in the 1993–98period, and grow enormously again in 2000–02 to the unprecedentedlevels of $940 billion (face value) and almost $500 billion marketvalue as of December 2002. These estimates are based on calcula-tions in Altman and Jha (2003) from periodic market calculations andestimates.10
On a relative scale, the ratio of supply to demand of distressed anddefaulted securities was something like 10 to 1 in both 1990–91 and2000–01. Dollarwise, of course, the amount of supply-side moneydwarfed the demand in both periods. And, as we will show, the pricelevels of new defaulting securities was relatively very low in both pe-riods, at the start of the 1990s and again at the start of the 2000 decade.
D. Univariate Models
We begin the discussion of our results with the univariate relationshipsbetween recovery rates and the explanatory variables described in theprevious section. Table 2 displays the results of the univariate regressions
10. Defaulted bonds and bank loans are relatively easy to define and are carefully docu-mented by the rating agencies and others. Distressed securities are defined here as bondsselling at least 1,000 basis points over comparable maturity Treasury bonds (we use the10-year T-bond rate as our benchmark). Privately owned securities, primarily bank loans, areestimated as 1.4–1.8� the level of publicly owned distressed and defaulted securities basedon studies of a large sample of bankrupt companies (Altman and Jha 2003).
2211Default and Recovery Rates

TABLE 2 Univariate Regressions, 1982–2001: Variables Explaining Annual Recovery Rates on Defaulted Corporate Bonds
A. Market Variables
Regression number 1 2 3 4 5 6 7 8 9 10Dependent variableBRR X X X X XBLLR X X X X XExplanatory variables: coefficients and (t-ratios)Constant .509 �.668 .002 �1.983 .432 �.872 .493 �.706 .468 �.772
(18.43) (�10.1) (.03) (�10.6) (24.9) (�20.1) (13.8) (�8.05) (19.10) (�13.2)BDR �2.610 �6.919
(�4.36) (�4.82)BLDR �.113 �.293
(�5.53) (�5.84)BDRC �3.104 �7.958
(�4.79) (�4.92)BOA �.315 �.853
(�2.68) (�2.95)BDA �4.761 �13.122
(�3.51) (�4.08)Goodness of fit measuresR2 .514 .563 .630 .654 .560 .574 .286 .326 .406 .481Adjusted r 2 .487 .539 .609 .635 .536 .550 .246 .288 .373 .452F-statistic 19.03 23.19 30.61 34.06 22.92 24.22 7.21 8.69 12.31 16.67( p-value) .000 .000 .000 .000 .000 .000 .015 .009 .003 .001
Residual testsSerial correlation LM, 2 lags (Breusch-Godfrey) 1.021 1.836 1.522 2.295 1.366 2.981 1.559 1.855 3.443 2.994( p-value) .600 .399 .467 .317 .505 .225 .459 .396 .179 .224
Heteroscedasticity (White, Chi square) .089 1.585 .118 1.342 8.011 5.526 2.389 1.827 .282 1.506( p-value) .956 .453 .943 .511 .018 .063 .303 .401 .868 .471
N. obs. 20 20 20 20 20 20 20 20 20 20
2212
JournalofBusin
ess

B. Macro Variables
Regression # 11 12 13 14 15 16 17 18 19 20Dependent variableBRR X X X X XBLRR X X X X XExplanatory variablesConstant .364 �1.044 .419 �.907 .458 �.804 .387 �1.009 .418 �.910
(7.59) (�8.58) (18.47) (�15.65) (15.42) (�10.8) (10.71) (�11.3) (16.42) (�14.4)GDP 1.688 4.218
(1.30) (1.28)GDPC 2.167 5.323
(2.31) (2.22)GDPI �.101 �.265
(�2.16) (�2.25)SR .205 .666
(1.16) (1.53)SRC .095 .346
(.73) (1.07)Goodness of fit measuresR2 .086 .083 .228 .215 .206 .220 .070 .115 .029 .060Adjusted R2 .035 .032 .186 .171 .162 .176 .018 .066 �.025 .007F-statistic 1.69 1.64 5.33 4.93 4.66 5.07 1.36 2.35 .53 1.14
( p-value) .211 .217 .033 .040 .045 .037 .259 .143 .475 .299Residual testsSerial correlation LM, 2 lags (Breusch-Godfrey) 2.641 4.059 .663 1.418 .352 1.153 3.980 5.222 3.479 4.615
( p-value) .267 .131 .718 .492 .839 .562 .137 .073 .176 .100Heteroscedasticity (White, Chi square) 2.305 2.077 2.254 2.494 .050 .726 2.515 3.563 3.511 4.979
( p-value) .316 .354 .324 .287 .823 .394 .284 .168 .173 .083Number of observations 20 20 20 20 20 20 20 20 20 20
Note.—The table shows the results of a set of univariate regressions carried out between the recovery rate (BRR) or its natural log (BLRR) and an array of explanatoryvariables: the default rate (BDR), its log (BLDR), and its change (BDRC); the outstanding amount of bonds (BOA) and the outstanding amount of defaulted bonds (BDA); theGDP growth rate (GDP), its change (GDPC), and a dummy (GDPI) taking the value of 1 when the GDP growth is less than 1.5%; the S&P 500 stock-market index (SR) and itschange (SRC).
2213
Defa
ultandReco
veryRates

carried out using these variables. These univariate regressions, and themultivariate regressions discussed in the following section, were cal-culated using both the recovery rate (BRR) and its natural log (BLRR) asthe dependent variables. Both results are displayed in table 2, as signifiedby an X in the corresponding row.We examined the simple relationship between bond recovery rates
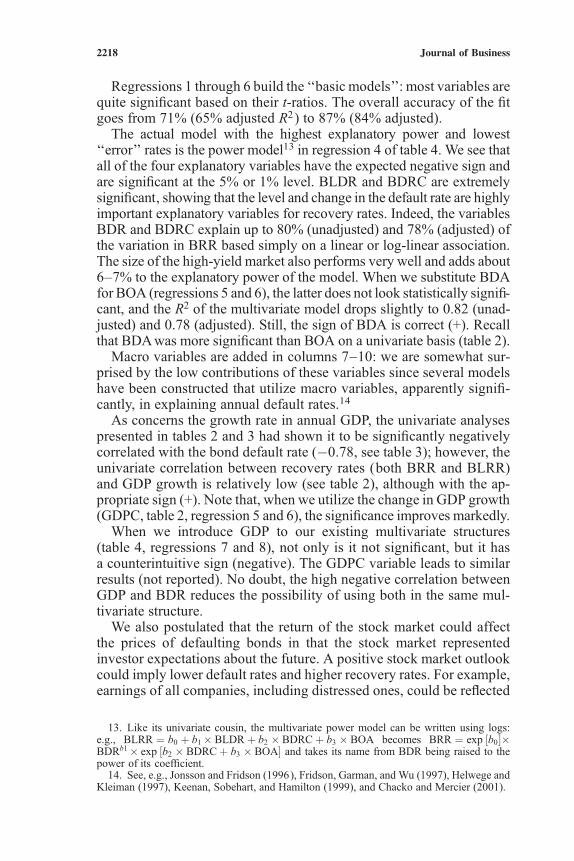
and bond default rates for the period 1982–2001. Table 2 and figure 1show several regressions between the two fundamental variables. Wefind that one can explain about 51% of the variation in the annual re-covery rate with the level of default rates (this is the linear model,regression 1) and 60% or more with the logarithmic and power11 rela-tionships (regressions 3 and 4). Hence, our basic thesis that the rate ofdefault is a massive indicator of the likely average recovery rate amongcorporate bonds appears to be substantiated.12
The other univariate results show the correct sign for each coeffi-cient, but not all of the relationships are significant. BDRC is highly
11. The power relationship (BRR ¼ eb0� BDRb1) can be estimated using the followingequivalent equation: BLRR ¼ b0 þ b1� BLDR (‘‘power model’’).12. Such an impression is strongly supported by a �80% rank correlation coefficient
between BDR and BRR (computed over the 1982–2001 period). Note that rank correlationsrepresent quite a robust indicator, since they do not depend upon any specific functionalform (e.g., log, quadratic, power).
Fig. 1.—Univariate models. Results of a set of univariate regressions carriedout between the recovery rate (BRR) or its natural log (BLRR) and the defaultrate (BDR) or its natural log (BLDR). See table 2 for more details.
2214 Journal of Business

negatively correlated with recovery rates, as shown by the very sig-nificant t-ratios, although the t-ratios and R2 values are not as significantas those for BLDR. Both BOA and BDA, as expected, are negativelycorrelated with recovery rates, with BDA being more significant on aunivariate basis. Macroeconomic variables do not explain as much ofthe variation in recovery rates as the corporate bond market variables;their poorer performance is also confirmed by the presence of someheteroscedasticity and serial correlation in the regression’s residuals,hinting at one or more omitted variables. We will come back to theserelationships in the next paragraphs.
E. Multivariate Models
We now specify some more complex models to explain recovery rates,by adding several variables to the default rate. The basic structure of ourmost successful models is
BRR ¼ f ðBDR;BDRC;BOA; or BDAÞ
Some macroeconomic variables will be added to this basic structure,to test their effect on recovery rates.Before we move on to the multivariate results, table 3 reports the cross-
correlations among our regressors (and between each of them and therecovery rate, BRR); values greater than 0.5 are highlighted. A ratherstrong link between GDP and BDR emerges, suggesting that, as expected,default rates are positively correlatedwithmacro growthmeasures.Hence,adding GDP to the BDR/BRR relationship is expected to blur the sig-nificance of the results. We also observe a high positive correlation be-tween BDA (absolute amount of all defaulted bonds) and the default rate.We estimate our regressions using 1982–2001 data to explain re-
covery rate results and predict 2002 rates. This involves linear and log-linear structures for the two key variables, recovery rates (dependent)and default rates (explanatory), with the log-linear relationships some-what more significant. These results appear in table 4.
TABLE 3 Correlation Coefficients among the Main Variables
BDR BOA BDA GDP SR BRR
BDR 1.00 .33 .73 �.56 �.30 �.72BOA 1.00 .76 .05 �.21 �.53BDA 1.00 �.26 �.49 �.64GDP 1.00 �.02 .29SR 1.00 .26BRR 1.00
Note.—The table shows cross-correlations among our regressors (and between each of them and therecovery rate BRR); values greater than 0.5 are italicized. A strong link between GDP and BDR emerges,suggesting that default rates, as expected, are positively correlated with macro growth measures.
2215Default and Recovery Rates

TABLE 4 Multivariate Regressions, 1982–2001
Linear and Logarithmic Models Logistic Models
Regressionnumber 1 2 3 4 5 6 7 8 9 10 11 12 13 14 15
Dependentvariable
BRR X X X X X X X X X XBLRR X X X X XExplanatoryvariables:coefficientsand (t-ratios)
Constant .514 �.646 .207 �1.436 .482 �1.467 .529 �1.538 .509 �1.447 �.074 �.097 .042 .000 .000(19.96) (�11.34) (2.78) (�8.70) (20.02) (�6.35) (11.86) (�9.07) (14.65) (�8.85) (�.64) (�.92) (.44) (.00) (.00)
BDR �1.358 �3.745 �1.209 �1.513 �1.332 12.200 6.713 5.346 7.421 6.487(�2.52) (�3.13) (�1.59) (�2.28) (�2.33) (4.14) (2.82) (1.55) (2.59) (2.64)
BLDR �.069 �.176 �.167 �.222 �.169(�3.78) (�4.36) (�2.94) (�4.64) (�4.17)
BDRC �1.930 �4.702 �1.748 �4.389 �2.039 �4.522 �1.937 �4.415 �1.935 �4.378 8.231 8.637 8.304 8.394(�3.18) (�3.50) (�3.39) (�3.84) (�3.03) (�3.35) (�3.11) (�4.05) (�3.09) (�3.87) (3.339) (3.147) (3.282) (3.315)
BOA �.164 �.459 �.141 �.410 �.153 �.328 �.162 �.387 .742 .691 .736(�2.13) (�2.71) (�2.12) (�2.78) (�1.86) (�2.20) (�2.03) (�2.63) (2.214) (1.927) (2.136)
BDA �1.203 �3.199 8.196(�.81) (�1.12) (1.064)
GDP �.387 �2.690 1.709(�.43) (�1.62) (.473)
SR .020 .213 �.242(.192) (1.156) (�.56)
2216
JournalofBusin
ess

Goodness offit measures
R2 .764 .819 .826 .867 .708 .817 .767 .886 .764 .878 .534 .783 .732 .786 .787Adjusted R2 .720 .785 .793 .842 .654 .782 .704 .856 .702 .845 .508 .742 .682 .729 .731F-stat 17.250 24.166 25.275 34.666 12.960 23.752 12.320 29.245 12.168 26.881 20.635 19.220 14.559 13.773 13.876
( p-value) .000 .000 .000 .000 .000 .000 .000 .000 .000 .000 .000 .000 .000 .000 .000Residual testsSerial correlation
LM, 2 lags(Breusch-Godfrey) 3.291 2.007 1.136 .718 1.235 .217 3.344 .028 5.606 1.897 1.042 2.673 1.954 2.648 5.899( p-value) .193 .367 .567 .698 .539 .897 .188 .986 .061 .387 .594 .263 .376 .266 .052
Heteroscedasticity(White,Chi square) 5.221 5.761 5.049 5.288 12.317 12.795 5.563 4.853 6.101 6.886 .008 5.566 9.963 5.735 5.948( p-value) .516 .451 .538 .507 .055 .046 .696 .773 .636 .549 .996 .474 .126 .677 .653
Numbers ofobservations 20 20 20 20 20 20 20 20 20 20 20 20 20 20 20
Note.—The table shows the results of a set of multivariate regressions based on 1982–2001 data. Regressions 1 through 6 build the ‘‘basic models’’: most variables are quitesignificant based on their t-ratios. The overall accuracy of the fit goes from 71% (65% adjusted R2 ) to 87% (84% adjusted); the model with the highest explanatory power and lowest‘‘error’’ rates is the power model in regression 4. Macroeconomic variables are added in columns 7–10, showing a poor explanatory power. A set of logistic estimates (cols. 11–15) isprovided, to account for the fact that the dependent variable (recovery rates) is bounded between 0 and 1.
2217
Defa
ultandReco
veryRates
Regressions 1 through 6 build the ‘‘basic models’’: most variables arequite significant based on their t-ratios. The overall accuracy of the fitgoes from 71% (65% adjusted R2) to 87% (84% adjusted).The actual model with the highest explanatory power and lowest
‘‘error’’ rates is the power model13 in regression 4 of table 4. We see thatall of the four explanatory variables have the expected negative sign andare significant at the 5% or 1% level. BLDR and BDRC are extremelysignificant, showing that the level and change in the default rate are highlyimportant explanatory variables for recovery rates. Indeed, the variablesBDR and BDRC explain up to 80% (unadjusted) and 78% (adjusted) ofthe variation in BRR based simply on a linear or log-linear association.The size of the high-yield market also performs very well and adds about6–7% to the explanatory power of the model. When we substitute BDAfor BOA (regressions 5 and 6), the latter does not look statistically signifi-cant, and the R2 of the multivariate model drops slightly to 0.82 (unad-justed) and 0.78 (adjusted). Still, the sign of BDA is correct (+). Recallthat BDAwas more significant than BOA on a univariate basis (table 2).Macro variables are added in columns 7–10: we are somewhat sur-
prised by the low contributions of these variables since several modelshave been constructed that utilize macro variables, apparently signifi-cantly, in explaining annual default rates.14
As concerns the growth rate in annual GDP, the univariate analysespresented in tables 2 and 3 had shown it to be significantly negativelycorrelated with the bond default rate (�0.78, see table 3); however, theunivariate correlation between recovery rates (both BRR and BLRR)and GDP growth is relatively low (see table 2), although with the ap-propriate sign (+). Note that, when we utilize the change in GDP growth(GDPC, table 2, regression 5 and 6), the significance improves markedly.When we introduce GDP to our existing multivariate structures
(table 4, regressions 7 and 8), not only is it not significant, but it hasa counterintuitive sign (negative). The GDPC variable leads to similarresults (not reported). No doubt, the high negative correlation betweenGDP and BDR reduces the possibility of using both in the same mul-tivariate structure.We also postulated that the return of the stock market could affect
the prices of defaulting bonds in that the stock market representedinvestor expectations about the future. A positive stock market outlookcould imply lower default rates and higher recovery rates. For example,earnings of all companies, including distressed ones, could be reflected
13. Like its univariate cousin, the multivariate power model can be written using logs:e.g., BLRR ¼ b0 þ b1� BLDRþ b2 � BDRCþ b3 � BOA becomes BRR ¼ exp ½b0��BDRb1� exp ½b2 � BDRCþ b3 � BOA� and takes its name from BDR being raised to thepower of its coefficient.14. See, e.g., Jonsson and Fridson (1996), Fridson, Garman, and Wu (1997), Helwege and
Kleiman (1997), Keenan, Sobehart, and Hamilton (1999), and Chacko and Mercier (2001).
2218 Journal of Business

in higher stock prices. Table 4, regressions 9 and 10, show the associ-ation between the annual S&P 500 Index stock return (SR) and recoveryrates. Note the insignificant t-ratios in the multivariate model, despitethe appropriate signs. Similar results (together with low values of R2)emerge from our univariate analysis (table 2), where the change in theS&P return (SRC) was also tested.Since the dependent variable (BRR) in most of our regressions is
bounded by 0 and 1, we also ran the same models using a logisticfunction (table 4, columns 11–15). As can be seen, R2 and t-ratios arebroadly similar to those already shown. The model in column 12, in-cluding BDR, BDRC, and BOA, explains as much as 74% (adjusted R2)of the recovery rate’s total variability. Macroeconomic variables, asbefore, tend to have no evident effect on BDR.
F. Robustness Checks
This section hosts some robustness checks carried out to verify how ourresults would change when taking into account several important mod-ifications to our approach.
Default probabilities. The models shown previously are based onthe actual default rate experienced in the high yield, speculative-grademarket (BDR) and reflect a coincident supply/demand dynamic in thatmarket. One might argue that this ex post analysis is conceptuallydifferent from the specification of an ex ante estimate of the defaultrate.We believe both specifications are important. Our previous ex post
models and tests are critical in understanding the actual experience ofcredit losses and, as such, affect credit management regulation andsupervision, capital allocations, and credit policy and planning of fi-nancial institutions. On the other hand, ex ante probabilities (PDs) arecustomarily used in VaR models in particular and for risk-managementpurposes in general; however, their use in a regression analysis of re-covery rates might lead to empirical tests that are inevitably limited bythe models used to estimate PDs and their own biases. The results ofthese tests might therefore not be indicative of the true relationshipbetween default and recovery rates.To assess the relationship between ex ante PDs and BRRs, we used
PDs generated through a well-established default rate forecasting modelfrom Moody’s (Keenan et al. 1999). This econometric model is used toforecast the global speculative grade issuer default rate and was fairlyaccurate (R2 = 0.8) in its explanatory model tests.15
15. Thus far, Moody’s has tested its forecasts for the 36-month period 1999–2001 andfound that the correlation between estimated (PD) and actual default rates was greater than0.90 (Hamilton et al. 2003). So, it appears that there can be a highly correlated link betweenestimated PDs and actual BDRs. By association, therefore, one can infer that accurate PDmodels can be used to estimate recovery rates and LGD.
2219Default and Recovery Rates

The results of using Moody’s model to explain our recovery ratesdid demonstrate a significant negative relationship but the explanatorypower of the multivariate models was considerably lower (adjusted R2 =0.39), although still impressive with significant t-tests for the change inPD and the amount of bonds outstanding (all variables had the expectedsign). Note that, since the Moody’s model is for global issuers and ourearlier tests are for U.S.-dollar-denominated high-yield bonds, we didnot expect that their PDmodel would be nearly as accurate in explainingU.S. recovery rates.
Quarterly Data. Our results are based on yearly values, so we wantedto make sure that higher-frequency data would confirm the existenceof a link between default rates and recoveries. Based on quarterly data,16
a simple, univariate estimate (see table 5) shows that (1) BDR is stillstrongly significant and shows the expected sign; (2) R2 looks relativelymodest (23.9% versus 51.4% for the annual data), because quarterlydefault rates and recovery rates tend to be very volatile (due to some‘‘poor’’ quarters with only very few defaults).Using a moving average of 4 quarters (BRR4W, weighted by the
number of defaulted issues), we estimated another model (using BDR,its lagged value and its square, see the last column in table 5), obtaininga much better R2 (72.4%). This suggests that the link between defaultrates and recovery is somewhat ‘‘sticky’’ and, although confirmed byquarterly data, is better appreciated over a longer time interval.17 Notethat the signs of the coefficients behave as expected; for example, anincrease in quarterly BDRs from 1% to 3% reduces the expected re-covery rate from 39% to 31% within the same quarter, while a furtherdecrease to 29% takes place in the following 3 months.
Risk-free rates. We considered the role of risk-free rates in explain-ing recovery rates, since these, in turn, depend on the discounted cashflows expected from the defaulted bonds. We therefore added to our‘‘best’’ models (e.g., columns 3 and 4 in table 4) some ‘‘rate’’ variables(namely, the 1-year and 10-year U.S. dollar Treasury rates taken fromthe Federal Reserve Board of Governors, the corresponding discountrates, or alternatively, the ‘‘steepness’’ of the yield curve, as measuredby the difference between 10-year and 1-year rates). The results are dis-appointing, since none of these variables ever is statistically significantat the 10% level.18
16. We had to refrain from using monthly data simply because of missing values (severalmonths show no defaults, so it is impossible to compute recovery rates when defaulted bondsamount to zero).17. This is confirmed by the equation residuals, which look substantially autocorrelated.18. This might also be because one of our regressors (BOA, the amount of outstanding
bonds) indirectly accounts for the level of risk-free rates, since lower rates imply highermarket values and vice versa. Even removing BOA, however, risk-free rates cannot be foundto be significant inside our model.
2220 Journal of Business

Returns on defaulted bonds. We examined whether the return expe-rienced by the defaulted bond market affects the demand for distressedsecurities, thereby influencing the ‘‘equilibrium price’’ of defaulted bonds.To do so, we considered the 1-year return on the Altman-NYU SalomonCenter Index of Defaulted Bonds (BIR), a monthly indicator of the mar-ket-weighted average performance of a sample of defaulted publiclytraded bonds.19 This is ameasure of the price changes of existing defaultedissues as well as the ‘‘entry value’’ of new defaults and, as such, is affectedby supply and demand conditions in this ‘‘niche’’ market.20 On a uni-variate basis, theBIR shows the expected sign (+)with a t-ratio of 2.67 andexplains 35% of the variation in BRR. However, when BIR is included inmultivariate models, its sign remains correct, but the marginal significanceis usually below 10%.
Outliers. The limited width of the time series on which our coeffi-cient estimates are based suggests that they might be affected by a smallnumber of outliers. We checked for this by eliminating 10% of theobservations, choosing those associated with the highest residuals,21
19. More details can be found in Altman (1991) and Altman and Jha (2003). Note that weuse a different time frame in our analysis (1987–2001), because the defaulted bond indexreturn (BIR) has been calculated only since 1987.20. We are aware that the average recovery rate on newly defaulted bond issues could
influence the level of the defaulted bond index and vice versa. The vast majority of issues inthe index, however, usually comprise bonds that have defaulted in prior periods. And, as wewill see, while this variable is significant on an univariate basis and does improve the overallexplanatory power of the model, it is not an important contributor.21. This amounts to 2 years out of 20, namely, 1987 and 1997.
TABLE 5 Quarterly Regressions, 1990–2002
Dependent Variable BRR BRR4W
Explanatory variables: coefficients and (t-ratios)Constant 45.48 (17.61) 48.12 (39.3)BDR �5.77 (�3.92) �8.07 (�4.24)BDR(�1) �2.62 (�2.87)BDRSQ 1.10 (2.87)Goodness of fit measuresR2 .239 .724Adjusted R2 .223 .705F-stat 15.36 38.47( p-value) .000 .000
Residual testsSerial correlation LM, 2 lags (Breusch-Godfrey) 1.129 10.456( p-value) .332 .000
Heteroscedasticity (White, Chi square) 4.857 1.161( p-value) .012 .344
Number of observations 51 48
Note.—The table shows univariate estimates based on quarterly data. It appears that (1) BDR isstrongly significant and has the expected sign; (2) R2 looks relatively modest, because quarterly defaultrates and recovery rates tend to be very volatile; (3) expressing recovery rates as the moving average offour quarterly data (BRR4W) improves R2, suggesting that the link between default rates and recoveryis somewhat ‘‘sticky.’’
2221Default and Recovery Rates

and running our regressions again. The results (not reported to saveroom) totally confirm the estimates shown in table 4. For example, formodel 3, the coefficients associated with BLDR (�0.15), BDRC(�4.26), and BOA (�0.45) are virtually unchanged, and remain sig-nificant at the 1% level; the same happens for model 4 (the coefficientsbeing, respectively, �0.15, �4.26, and �0.45).
GDP dummy and regime effects. We saw, in our multivariate results,that the GDP variable lacks statistical significance and tends to have acounterintuitive sign when added to multivariate models. The fact thatGDP growth is highly correlated with default rates, our primary ex-planatory variable, looks like a sensible explanation for this phenome-non. To try to circumvent this problem, we used a technique similar toHelwege and Kleiman (1997): they postulate that, while a change inGDP of say 1% or 2% was not very meaningful in explaining defaultrates when the base year was in a strong economic growth period, thesame change was meaningful when the new level was in a weak econ-omy. Following their approach, we built a dummy variable (GDPI)which takes the value of 1 when GDP grows at less than 1.5% and 0otherwise. The univariate GDPI results show a somewhat significantrelationship with the appropriate negative sign (table 2); however, whenone adds the ‘‘dummy’’ variable GDPI to the multivariate models dis-cussed previously, the results (not reported) show no statistically sig-nificant effect, although the sign remains appropriate.We further checked whether the relationship between default rates and
recoveries outlined in table 4 experiences a structural change depend-ing on the economy being in a ‘‘good’’ or ‘‘bad’’ regime. To do so, we re-estimated equations 1–4 in the table after removing recession years(simply defined as years showing a negative real GDP growth rate); theresults (not reported), widely confirmed the results shown in table 4; thissuggests that our original estimates are not affected by recession periods.
Seniority and original rating. Our study considers default rates andrecoveries at an aggregate level. However, to strengthen our analysisand get some further insights on the PD/LGD relationship, we also con-sidered recovery rates broken down by seniority status and original rating.Table 6 shows the results obtained on such data for our basic uni-
variate, translog model. One can see that the link between recovery ratesand default frequencies remains statistically significant for all seniorityand rating groups. However, such a link tends to be somewhat weakerfor subordinated bonds and junk issues. Moreover, while the sensitivityof BRR to the default rate looks similar for both seniority classes, re-covery rates on investment-grade bonds seem to react more steeply tochanges in the default rate. In other words, the price of defaulted bondswith an original rating between AAA and BBB decreases more sharplyas defaults become relatively more frequent. Perhaps the reason forthis is that original issue investment grade defaults tend to be larger than
2222 Journal of Business

noninvestment-grade failures and the larger amounts of distressed assetsdepresses the recovery rates even greater in difficult periods.
IV. Implications for Credit VaR Models, Capital Ratios,
and Procyclicality
The results of our empirical tests have important implications for anumber of credit-risk-related conceptual and practical areas. This sec-tion reviews two key areas that can be affected significantly when onefactors in that, in fact, default rates are negatively correlated with re-covery rates. These are (1) credit VaR models and (2) the potential im-pact of our findings on the procyclicality of capital requirements debatedby the Basel Committee.22
TABLE 6 Univariate Regressions on Data Broken by Seniority Statusand Original Rating
Data Broken bySeniority Status
Data Broken byOriginal Ratingy
Dependent Variable
RR onSenior*Bonds(Log)
RR onSubordinated**
Bonds(Log)
RR onInvestment-Grade
Bonds(Log)
RR onJunkzBonds(Log)
Explanatory variables:coefficients and (t-ratios)
Constant 2.97 2.58 2.70 2.70(13.91) (8.79) (9.77) (10.99)
BLDR �.24 �.23 �.31 �.23(�4.30) (�2.90) (�4.16) (�3.41)
Goodness of fit measuresR2 .507 .319 .519 .421Adjusted R2 .479 .281 .489 .385F-statistic 18.487 8.431 17.291 11.652( p-value) .000 .009 .001 .004
Residual testsSerial correlation LM, 2 lags( Breusch-Godfrey) .6674 1.66 4.0302 .162( p-value) .5268 .2213 .0415 .852
Heteroskedasticity(White, Chi square) .719 .2001 .4858 .4811( p-value) .5015 .8205 .6245 .6273
Number of observations 20 20 18 18
Note.—The table shows a set of univariate regressions, based on recovery rates broken down byseniority status and original rating. The link between recovery rates and default frequencies remainsstatistically significant for all seniority and rating groups. However, it grows weaker for subordinatedbonds and junk issues. Moreover, recovery rates on investment-grade bonds seem to react more steeplyto changes in the default rate.* Senior-secured and senior-unsecured bonds.** Senior-subordinated, subordinated, and discount bonds.y
Years 1993 and 1994 are not included because no default took place on investment-grade issues.z Including unrated bonds.
22. We simply summarize here our conclusions based on several simulation analyses,discussed in greater detail in Altman, Resti and Sironi (2001).
2223Default and Recovery Rates

A. VaR Models
As noted earlier, most credit VaR models treat recovery rates as de-terministic (like in the CreditRisk+model proposed by Credit SuisseFinancial Products 1997) or stochastic but independent from defaultprobabilities (like in the Creditmetrics framework; Finger, Gupton, andBhatia 1997). The impact of a negative correlation between recoveryrates and default rates is generally overlooked. To assess this impact, weran Monte Carlo simulations on a sample portfolio of bank loans andcompared the key risk measures (expected and unexpected losses) ob-tained by the two aforementioned models to those generated when re-covery rates are treated as stochastic and negatively correlated with PDs.The results of our simulations are revealing, indicating that both the
expected and unexpected losses are vastly understated if one assumesthat PDs and RRs are uncorrelated.23 As long as the PDs used in VaRmodels can be thought of as ex ante estimates of actual DRs, this impliesthat the risk measures generated by such models are biased.Summing up, if default rates (and PDs, which can be thought of as ex
ante estimates of actual DRs) are found to be correlated with RRs, thennot only the risk measures based on standard errors and percentiles (i.e.,the unexpected losses) could be seriously underestimated, but theamount of expected losses on a given credit portfolio (on which banks’provisioning policies should be based) could also be misjudged. There-fore, credit models that do not carefully factor in the negative correla-tion between PDs and RRs might lead to insufficient bank reserves andcause unnecessary shocks to financial markets.
B. The RR/PD Link and Procyclicality Effects
Procyclicality involves the sensitivity of regulatory capital require-ments to economic and financial market cycles. Since ratings and de-fault rates respond to the cycle, the new internal ratings-based (IRB)approach proposed by the Basel Committee risks increasing capitalcharges and limiting credit supply when the economy is slowing (thereverse being true when the economy is growing at a fast rate).Such procyclicality effects might be thought to be exacerbated by the
correlation between DRs and RRs found in our study (and in some of thecontributions quoted in Section II); in other words, low recovery rateswhen defaults are high would amplify cyclical effects. This results fromthe negative correlation between default rates and recovery rates, whichwould lead to more sensitive capital requirements. For example, in arecession period with increasing default rates, recovery rates woulddecrease, leading to higher credit losses. This, in turn, would lead tohigher capital requirements and, correspondingly, possibly to a decrease
23. Both expected losses and VaR measures associated with different confidence levelstend to be underestimated by approximately 30%.
2224 Journal of Business

in the supply of bank credit to the economy, thereby exacerbating therecession. On the other side, in a strong economic growth period withdecreasing default rates, recovery rates would increase leading to lowercredit losses and lower bank capital requirements. This, in turn, wouldallow an expansion of bank credit, thereby favoring economic growth.This procyclicality effect would be especially true under the so-called
advanced IRB approach, where banks are free to estimate their ownrecovery rates and might tend to revise them downward when defaultsincrease and ratings worsen.The impact of such a mechanism was assessed, for example, in Resti
(2002), based on simulations over a 20-year period, using a standardportfolio of bank loans (the composition of which is adjusted throughtime according to S&P transition matrices). Two results of these sim-ulations are worth mentioning. First, the procyclicality effect is drivenmore by upgrades and downgrades than by default rates; in other words,adjustments in the credit supply needed to comply with capital require-ments respond mainly to changes in the structure of weighted assets andonly to a lesser extent to actual credit losses (except in extremely highdefault years). Second, when RRs are permitted to fluctuate with defaultrates, the procyclicality effect increases significantly. Moreover, bankand credit derivative spreads, too, become more volatile, since revisionsin short-term RR estimates are factored into prices.One might object that, in these simulations, banks basically react to
short-term results, and regulation should encourage ‘‘advanced’’ IRBsystems to use long-term average recovery rates. However, while theuse of long-term RRs would make the procyclicality effects less marked,it would also force banks to maintain a less updated picture of their risks,thereby substituting stability for precision.
V. Concluding Remarks
This paper analyzed the link between aggregate default rates/probabilitiesand the loss given default on corporate bonds, from both a theoreticaland an empirical standpoint. As far as the theoretical aspects are con-cerned, most of the literature on credit-risk-management models andtools treats the recovery rate variable as a function of historic averagedefault recovery rates (conditioned perhaps on seniority and collateralfactors) but in almost all cases as independent of expected or actualdefault rates. This appears rather simplistic and unrealistic in the lightof our empirical evidence.We examined the recovery rates on corporate bond defaults, over the
period 1982–2002, by means of rather straightforward statistical mod-els. These models assign a key role to the supply of defaulted paper(default rates) and explain a substantial proportion of the variance inbond recovery rates aggregated across all seniority and collateral levels.
2225Default and Recovery Rates

These results have important implications for portfolio credit-riskmodels, for markets that depend on recovery rates as a key variable(e.g., securitizations, credit derivatives), and for the current debate onthe revised BIS guidelines for capital requirements on bank assets.
References
Altman, Edward I. 1989. Measuring corporate bond mortality and performance. Journal ofFinance 44:909–22.
———. 1991. Distressed securities. Burr Ridge, IL: Irwin Publishing; reprinted by BeardBooks, Frederick, MD 1999.
Altman Edward I., and Pablo Arman. 2002. Defaults and returns in the high yield bondmarket: Analysis through 2001. Working paper, Salomon Center, New York University.
Altman, Edward I., and Shubin Jha. 2003. Market size and investment performance ofdefaulted bonds and bank loans: 1987–2002. Working paper, Salomon Center, New YorkUniversity.
Altman, Edward I., and Vellore M. Kishore. 1996. Almost everything you wanted to knowabout recoveries on defaulted bonds. Financial Analysts Journal (November–December).
Altman, Edward I., Andrea Resti, and Andrea Sironi. 2001. Analyzing and explaining de-fault recovery rates. A report submitted to International Swaps and Derivatives Dealers’Association, London.
Bakshi, G., Dilip Madan, Frank Zhang. 2001. Understanding the role of recovery in defaultrisk models: Empirical comparisons and implied recovery rates. Finance and EconomicsDiscussion Series, 2001–37. Washington, DC: Federal Reserve Board of Governors.
Basel Committee on Banking Supervision. 1999. Credit risk modeling: Current practicesand applications. Basel: Bank for International Settlements.
———. 2001. The Basel capital accord. Consultative paper, Bank for International Settle-ments, Basel.
Cambridge Associates, LLC. 2001. U.S. distressed company investing. Cambridge, MA;Cambridge Associates.
Chacko, Varki, and Thomas Mercier. 2001. A model for forecasting high yield defaults.Global Research Strategy, Goldman Sachs International.
Credit Suisse Financial Products. 1997. CreditRisk+. A credit risk management framework.Technical document, Credit Suisse Financial Products.
Finger, Christopher. 1999. Conditional approaches for CreditMetrics1 portfolio distributions.CreditMetrics1Monitor (April).
Finger, Christopher C., Greg M. Gupton, and Mickey Bhatia. 1997. CreditMetrics. Technicaldocument, J. P.Morgan, New York.
FITCH. 1997. Syndicated bank loan recovery study (R. Grossman,M. Brennan, and J. Vento).FITCH, New York, NY October 22.
———. 2001. Bank loan and bond recovery study: 1997–2001 (S. O’Shea, S. Bonelli, andR. Grossman). FITCH, New York, NY March 19.
Fridson, Martin, Christopher Garman, and Chen Wu. 1997. Real interest rates and defaultrates on high yield bonds. Journal of Fixed Income (September).
Frye, John. 2000a. Collateral damage. Risk (April): 91–94.———. 2000b. Collateral damage detected. Working paper, Emerging Issues Series, Federal
Reserve Bank of Chicago, (October).———. 2000c. Depressing recoveries’’, Risk (November).Gordy, Michael B. 2000. Credit VaR models and risk-bucket capital rules: A reconciliation.
Working Paper, Federal Reserve Board (March).Gupton, Greg M., David T. Hamilton, and Alexandra Berthault. 2001. Default and recovery
rates of corporate bond issuers: 2000. Moody’s Investors Service, New York.Hamilton David et al. 2003. Default and recovery rates of corporate bond issuers: A sta-
tistical review of Moody’s ratings performance, 1920–2002. Moody’s Investors Service,New York.
2226 Journal of Business

Helwege, Jean, and Paul Kleiman. 1997. Understanding aggregate default rates of high yieldbonds. Journal of Fixed Income (June).
Hu, Yen-Ting, and William Perraudin. 2002. The dependence of recovery rates and defaults.Mimeo, BirkBeck College.
Jarrow, Robert A. 2001. Default parameter estimation using market prices. FinancialAnalysts Journal 57, no. 5:75–92.
Jokivuolle, Esa, and Samu Peura. 2003. Incorporating collateral value uncertainty in lossgiven default estimates and loan-to-value ratios. European Financial Management 9(September): 299–314.
Jonsson, Jon G., and Martin S. Fridson. 1996. Forecasting default rates on high yield bonds.Journal of Fixed Income (June).
Keenan, Sean, Jorge Sobehart, and David T. Hamilton. 1999. Predicting default rates: Aforecasting model for Moody’s issuer-based default rates. Moody’s Global Credit Re-search, Moody’s Investor Services, New York.
Resti, Andrea. 2002. The new Basel capital accord: Structure, possible changes, micro-andmacroeconomic effects. Brussels: Centre for European Policy Studies.
Standard & Poor’s. 2000. Recoveries on Defaulted Bonds Tied to Seniority Ratings(L. Brand and R. Behar). CreditWeek (February).
Unal, Haluk; Dilip Madan, and Levant Guntay. 2003. Pricing the risk of recovery in defaultwith absolute priority rule violation. Journal of Banking & Finance 27 (June): 1001–25.
Van de Castle, Karen, and David Keisman. 2000. Suddenly structure mattered: Insights intorecoveries of defaulted loans. Standard & Poor’s Corporate Ratings (May 24).
2227Default and Recovery Rates