The limits of thermal comfort: avoiding overheating in ... · feel uncomfortably hot and that this...
24
The limits of thermal comfort: avoiding overheating in European buildings TM52: 2013
Transcript of The limits of thermal comfort: avoiding overheating in ... · feel uncomfortably hot and that this...

The limits of thermal comfort:avoiding overheating inEuropean buildings
The limits of therm
al comfort: avoiding overheating in European buildings
TM52
The Chartered Institution of Building Services Engineers222 Balham High Road, London SW12 9BS+44 (0)20 8675 5211www.cibse.org TM52: 20139 7 8 1 9 0 6 8 4 6 3 4 3
ISBN 978-1-906846-34-3

The limits of thermal comfort: avoiding overheating in European buildings
CIBSE TM52: 2013
James Johnson, jam
, 10:00am 22/07/2013, 2, 34665

Note from the publisherThis publication is primarily intended to provide guidance to those responsible for the design, installation, commissioning, operation and maintenance of building services. It is not intended to be exhaustive or definitive and it will be necessary for users of the guidance given to exercise their own professional judgement when deciding whether to abide by or depart from it.
Any commercial products depicted or described within this publication are included for the purposes of illustration only and their inclusion does not constitute endorsement or recommendation by the Institution.
The rights of publication or translation are reserved.
No part of this publication may be reproduced, stored in a retrieval system or transmitted in any form or by any means without the prior permission of the Institution.
© July 2013 The Chartered Institution of Building Services Engineers London
Registered charity number 278104
ISBN 978-1-906846-34-3
This document is based on the best knowledge available at the time of publication. However no responsibility of any kind for any injury, death, loss, damage or delay however caused resulting from the use of these recommendations can be accepted by the Chartered Institution of Building Services Engineers, the authors or others involved in its publication. In adopting these recommendations for use each adopter by doing so agrees to accept full responsibility for any personal injury, death, loss, damage or delay arising out of or in connection with their use by or on behalf of such adopter irrespective of the cause or reason therefore and agrees to defend, indemnify and hold harmless the Chartered Institution of Building Services Engineers, the authors and others involved in their publication from any and all liability arising out of or in connection with such use as aforesaid and irrespective of any negligence on the part of those indemnified.
Layout and typesetting by Bonnie Craig
Printed in Great Britain by Page Bros. (Norwich) Ltd., Norwich, Norfolk NR6 6SA
Cover illustration: ©Monkey Business Images, sourced through Shutterstock Inc. (www.shutterstock.com)
Jam
es J
ohns
on, j
ames
@ho
dkin
sonc
onsu
ltanc
y.co
m, 1
0:00
am 2
2/07
/201
3, 2
, 346
65

Foreword
Overheating has become a key problem for building design. The need to reduce energy consumption whilst dealing with global climate change has reduced the options available for building comfortable, low-energy buildings. Research has been directed towards methods for increasing indoor winter temperatures but this can lead to lightweight, highly insulated buildings that respond poorly in the summer. CIBSE has responded by forming the Overheating Task Force.
The Task Force realised that one problem for designers has been the absence of an adequate definition of overheating in naturally ventilated buildings. In the past overheating has been defined as a number of hours over a particular temperature, irrespective of conditions outside the building. Recent work embodied in European standards suggests that the temperature that occupants will find uncomfortable changes with the outdoor conditions in a predictable way. This research informs the CIBSE guidance presented in this Technical Memorandum (TM). The meaning of the research and the link with overheating are explained and a series of criteria by which the risk of overheating can be assessed or identified are suggested.
More detailed information about using simulation to predict the danger of overheating is available in CIBSE Guide A (CIBSE, 2006/2013). CIBSE KS16: How to manage overheating in buildings (CIBSE, 2010c) gives information directed at building managers and owners about the cause of overheating and some practical suggestions for avoiding or mitigating it.
Fergus Nicol Principal author
Principal author
Fergus Nicol (Oxford Brookes University)
Contributing author
Brian Spires (Technical Consultant)
Task Force members
Andy Ford (Chair) (Mott MacDonald Fulcrum) Fergus Nicol (Oxford Brookes University) Michael Humphreys (Oxford Brookes University) Brian Spires (Technical Consultant) Andrew PG Moore (HSE) Hywel Davies (CIBSE) Gay Lawrence Race (CIBSE) Max Fordham (Max Fordham LLP) Jake Hacker (Arup) Anastasia Mylona (CIBSE)
CIBSE referees
Michael Davies (Barlett School of Graduate Studies, University College London) Ken Parsons (Loughborough University) David Fisk (Imperial College London)
James Johnson, jam
, 10:00am 22/07/2013, 2, 34665

AcknowledgementsThe Institution gratefully acknowledges Paul Tuohy (Strathclyde University) for kindly providing the data underlying Figures 10 and 11, and Vic Crisp for providing detailed comments prior to publication.
EditorBonnie Craig
Editorial ManagerKen Butcher
CIBSE Technical DirectorHywel Davies
CIBSE Head of KnowledgeNicolas Peake
Jam
es J
ohns
on, j
ames
@ho
dkin
sonc
onsu
ltanc
y.co
m, 1
0:00
am 2
2/07
/201
3, 2
, 346
65

Contents
1 Introduction 1
2 Comfort and discomfort 1
2.1 Our thermal sense 1
2.2 How can we judge if a building is overheating? 3
2.3 Behaviour and discomfort 3
3 Predicting discomfort 3
3.1 The basics 3
3.2 Investigating and modelling thermal comfort 4
3.3 Predicted mean vote (pmv) and predicted percentage 6 dissatisfied (ppd) using the heat balance model of comfort
3.4 Other considerations 8
4 The basis of comfort standards 9
4.1 Existing standards 9
4.2 Problems for standards 10
5 Risk of overheating 11
5.1 Problems with a single temperature overheating limit 11
5.2 Discomfort as a function of a deviation from comfort temperature 11
6 CIBSE recommendations for identifying overheating 12
6.1 CIBSE guidance 12
6.2 Overheating in mechanically cooled buildings 16
References 17
Additional sources of information 18
James Johnson, jam
, 10:00am 22/07/2013, 2, 34665

by occupant behaviour. It then considers the complexity of calculating comfort in occupied buildings and what is the likelihood that a building will overheat. It then goes on to consider ways in which overheating has been described and characterised. It explains how this has been handled in international standards for the indoor thermal environment and how these have shaped the thinking of the CIBSE Overheating Task Force.
Finally, it outlines the approach adopted by the CIBSE Overheating Task Force, an approach based on European Standard BS EN 15251 (BSI, 2007). It considers the ways in which the standard seeks to ensure that a building is comfortable for its occupants and how the likelihood of discomfort due to overheating can be predicted. Criteria are suggested that will enable the recommendations of the standard to be applied to buildings, which are based on the predicted indoor environment. Ways are suggested by which discomfort can be diagnosed in existing occupied buildings and those with mechanical cooling systems. Whilst the guidance is primarily intended for application to non-domestic buildings, much of it is also relevant to the consideration of overheating in dwellings.
TM52 concludes with worked examples.
2 Comfort and discomfort
2.1 Our thermal sense
As ‘warm blooded’ mammals, human beings require a near steady internal body temperature in order to remain healthy and active. The metabolic heat being released in the body, and its flow to the environment, are regulated to keep the internal organs, and in particular the brain, at a temperature of around 37 ˚C. This is a dynamic process because the indoor environment changes and the occupants move around, either indoors, or between indoors and outdoors. The body needs a mechanism for keeping the temperature of our internal organs more or less constant despite these changes.
The thermal sense serves to warn when the thermal state of the body becomes a cause for concern. There can be serious health implications if a deviation as small as a degree or two occurs in the internal body temperature. The result is hypo-thermia if it drops much below the control temperature, or hyperthermia if it rises much above it.
The descriptors for thermal comfort usually used in thermal comfort research are shown in Table 1 below. Discomfort from heat is generally assumed when subjects vote +2 or +3 on the ASHRAE scale, or 6 or 7 on the Bedford scale.
1 IntroductionThis Technical Memorandum (TM) is about predicting overheating in buildings. It is intended to inform designers, developers and others responsible for defining the indoor environment in buildings. It includes the recommendations of the Overheating Task Force of the Chartered Institution of Building Services Engineers (CIBSE), which has sponsored and published this document. The Task Force is a group of experts and professionals brought together to improve our understanding of the term ‘overheating’ and to help building designers to design buildings that do not overheat. The Task Force was established to advise CIBSE on how to approach this problem. The Task Force recognised that existing advice on overheating, as contained in chapter 1 of the 2006 edition of CIBSE Guide A (CIBSE, 2006), is increasingly restrictive and therefore was asked to contri bute more comprehensive guidance for the next edition of Guide A (CIBSE, 2013) and other CIBSE documents.
‘Overheating’ is a widely used term but it is not precisely defined or understood. It implies that building occupants feel uncomfortably hot and that this discomfort is caused by the indoor environment. Generally this is taken to mean that the temperature in the building is too high for comfort. This is the approach usually used in predicting the danger of overheating. In fact there are a number of other factors that are important, both environmental (such as humidity and air movement) and contextual (such as the purpose of the building, its design and management, and the occupants’ attitude to it), which will also be important.
Another consideration of the Task Force was that over-heating in buildings will become a bigger concern in a world where changing climates and global energy insecurity make the control of indoor climate increasingly problematic. This makes it especially important to have guidelines or regulations that use an appropriate definition of overheating to avoid buildings being wrongly assessed.
Overheating happens in a building either through bad design, poor management or inadequate services. This publication centres on the overheating that occurs in warm weather in buildings without mechanical cooling, but also considers other circumstances where overheating could occur. Before predicting that a building is likely to overheat, it is necessary to be clear about the relationship between the indoor environment and human discomfort including the variability in comfort responses between individuals. That variability needs to be reflected in any detailed definition of overheating.
TM52 starts by discussing ‘comfort’ and ‘discomfort’ as they apply to the thermal environment. It considers existing approaches to comfort and shows the role that can be played
The limits of thermal comfort: avoiding overheating in European buildings
1Ja
mes
Joh
nson
, jam
es@
hodk
inso
ncon
sulta
ncy.
com
, 10:
00am
22/
07/2
013,
2, 3
4665

2 The limits of thermal comfort: avoiding overheating in European buildings
A lot of the time the internal temperature is controlled with little or no conscious intervention. If it increases, the body will try to increase heat loss and stop the temperature rise by increasing the blood flow to the skin. If it drops there may be some extra tension in the muscles to increase metabolic heat production. The blood flow to the surface of the body is also decreased to reduce heat flow and prevent the internal temperature dropping. This is experienced as cold hands and feet. The temperature of the skin, especially in the extremities, is continually changing and adjusting to the thermal state of the body and of the environment.
If these responses are not enough to control the internal temperature, the automatic physiological mechanisms of sweating (to increase heat loss by evaporation) and shivering (to increase metabolic heat production in the muscles) are necessary.
With some variations, these physiological mechanisms are shared by all mammals. Humans also share with other mammals the use of behaviour as part of the thermal regulation. Humans excel in this aspect of thermal regulation. The reason that they can survive and prosper in such a wide range of environments — from the equator almost to the poles — is their ability to find ways to control
their thermal interaction with the environment. Some of these responses use the existing natural world — the sun, the wind and the shelter of trees or the landscape; but they also use specific technologies for heating or cooling —clothes, fires, fans and, in particular, buildings.
Historically, the technologies people used to make them-selves comfortable were made locally and used relatively little energy in their manufacture or use. Modern comfort options such as central heating and comfort cooling use energy in increasingly sophisticated ways. These changes greatly increase the range of climates we can inhabit comfortably. They also mean we may live in buildings that would not be habitable without using energy. The ability to be comfortable is no longer simply about physics and physiology backed up by behaviour — it assumes reliable access to fuel and the technologies that use it.
Where we depend on a source of energy being available, and on having the means to use the energy to heat or cool the environment, our situation is no longer strictly comparable to that of other mammals. We depend on social and economic networks for the very warmth of our environment, the clothes we wear and the means to ensure they remain available.
Figure 1 gives a simple picture of the heat flows in the body and the different ways they are regulated, both by invol-untary physiological actions and by conscious actions in response to subjective thermal comfort or discomfort.
At the same time, the accelerating pace of climate change and the threat of rapid fuel price rises, mean we can no longer rely on the use of cheap, fossil-fuel energy to make buildings habitable. We must design buildings to minimise their dependence on the energy they use to remain habitable. Well-designed buildings can remain comfortable for much of the year using only small amounts of energy by the judicious use of thermal mass, shading and other passive techniques.
Activity changes
Actions arising fromsubjective warmth
Involuntary actions
Environmental control
Clothing changes
Heat flow
Posture
Shiver
Vaso-regulation
Sweat
Information Action CNS: Central nervous system
CNS
Body tissues(heat source) Skin Clothing Environment
Figure 1 A diagram representing the control system for ensuring the internal body temperature is kept constant. Heat from the body tissues passes out through the skin and clothes to the environment. The temperatures of the various elements in the energy chain are influenced by physiological actions (left-hand side) and actions taken consciously (right-hand side) to influence the activity, clothing insulation and posture as well as actions to change the thermal environment. The whole is under the involuntary or conscious control of the central nervous system (CNS) in response to information about the thermal state of the body. Changes of venue are also possible though not shown. (After Nicol and Humphreys 1973.)
Table 1 ASHRAE and Bedford comfort descriptors with usual numerical equivalents. Note that, unlike the Bedford scale, the idea of comfort is absent from the ASHRAE scale: people voting between –1 and +1 on the ASHRAE scale are generally assumed to be comfortable and those voting +2 or +3 to be uncomfortably hot.
ASHRAE comfort scale Bedford comfort scale
+3 Hot 7 Much too hot +2 Warm 6 Too warm +1 Slightly warm 5 Comfortably warm 0 Neutral 4 Comfortable –1 Slightly cool 3 Comfortably cool –2 Cool 2 Too cold –3 Cold 1 Much too cold
James Johnson, jam
, 10:00am 22/07/2013, 2, 34665

Predicting discomfort 3
2.2 How can we judge if a building is overheating?
A building can be said to have performed its task if occupants are not ‘conscious’ of its temperature. If building occupants say, when asked, that they are comfortable, this usually signifies that (in the short term at least) their body is able to remain in equilibrium with the environment. Thermal discomfort or overheating, on the other hand, is a sign that the mechanisms that we have in place to remain comfortable are inadequate. So if a student finds it hard to concentrate during an exam at school because the room is too hot for that particular task, the school building, its services or the building management, have individually or collectively failed in an important task.
The best way to identify an overheating building is to ask the occupants. The environment that is making the student uncomfortable in the above example might be found perfectly comfortable by a student doing something else, or at a different time of year or in a different climate. Conditions for comfort can change with the seasons, for instance, as the kind of clothing worn changes. Ways are needed to predict what indoor environments are unacceptable.
There is, however, a difference between saying that the interior of a building is too hot — an instantaneous assessment by one or more inhabitants — and saying that the building overheats over a period, which is a more general assessment of the building in use.
Post-occupancy evaluation (poe) is a tool that is recognised as a way to investigate how or why buildings fall short of the aspirations of the designer. While poe may have a specific aim, such as how much energy is used by the building, comfort is also measured as a way to judge how well the building functions from the occupants’ point of view. The approach of poe is to ask the occupants questions such as ‘Does the building overheat in summer/winter?’. This means that the survey participant is asked about the building in general and not just the current state of the indoor environment. Such an assessment will still be very subjective. It will depend on the person’s experience of the building and may only apply to one part of the building. Taken together, however, the responses of a number of building users will give a picture of whether occupants perceive it as one than overheats — and, if so, when.
The problem becomes more difficult when we are considering buildings that are not yet built. Buildings that produce high indoor temperatures have an increased likelihood of overheating but the relationship is not precise. This means that a judgment must be made about the likelihood of a building overheating by using computer simulation to model the indoor climate. Thermal comfort theory can then be applied to predict the likely response of the building occupants and, in particular, whether they are likely to feel too hot (see section 3).
2.3 Behaviour and discomfort
In most situations, the response to thermal discomfort or the threat of discomfort is to make efforts to return to, and remain in, comfort. This does not necessarily mean that people must become uncomfortable before they will take action. In fact, most people in a building they are familiar
with will not wait until they are uncomfortable to initiate the use of controls. For example, people may open a window when they enter a room on a sunny morning because they know that otherwise it will become too hot. If people are uncomfortable and take an action that makes them comfortable again this change is often experienced as pleasurable. The means afforded by the building for control — windows to open, shades to draw and so on — are often referred to as ‘adaptive opportunities’ (Baker and Standeven, 1995). POE has shown that a building that gives people adaptive opportunities to make changes to their environ-ment is more likely to be positively rated and one that does not is more liable to overheat (Leaman and Bordass, 1997).
3 Predicting discomfort
3.1 The basics
In order to predict whether a building will overheat, we first need to develop a model of the indoor environment of that building and then a model of comfort that will allow us to assess whether the indoor environment will give rise to discomfort. Such a model is likely to include the four important physical parameters: air temperature; radiant temperature; humidity and air movement; and also information about clothing and activity. More detail of the processes described is available in Parsons (2003) and Nicol, Humphreys and Roaf (2012).
3.1.1 Temperature
The temperature of the environment includes both the air temperature and the radiant temperature. The air temperature (Ta) decides the heat loss from the body by convection and the radiant temperature (Tr) by radiation. The radiant temperature is generally understood to be the mean radiant temperature, which is the temperature of a black sphere at the point in question that would exchange no net radiation with the surroundings. The radiant temperature can also have a distinct directionality, such as when there is a radiant heater, a cold window or direct sunlight.
The air and radiant temperatures are usually combined to give the operative temperature (Top), which models the combined effect of convective and radiant heat exchange. The operative temperature is a weighted mean temperature between air and radiant temperatures. In a well-designed building in winter, most of the surfaces are close to air temperature and the Ta can often equal Top. In sunny weather, however, this may not be the case. At air speeds of 0.1 m/s or less Top is more or less equal to:
Top ≈ (Tr + Ta) / 2
but as the air speed increases, the operative temperature tends towards air temperature. More detail on the calcula-tion of operative temperature is given in Box 1.
Current, commercially available, digital simulation software uses a simplified model that calculates the bulk air temperature, assuming the air is well mixed, that is combined with the mean radiant temperature at the centre of the space. It is clear, however, that the operative temperature at any point in an internal space is affected by
Jam
es J
ohns
on, j
ames
@ho
dkin
sonc
onsu
ltanc
y.co
m, 1
0:00
am 2
2/07
/201
3, 2
, 346
65

4 The limits of thermal comfort: avoiding overheating in European buildings
may even gain heat). In these circumstances, much of the metabolic heat being lost from the body is the result of evaporation of sweat. However, it is generally agreed that the amount of water in the air has little effect on comfort, except when both the temperature and the humidity are high. If the body produces sweat to keep comfortable, there may be a problem if sufficient sweat does not evaporate. Actual responses to these conditions suggest that the effect of high humidity on thermal comfort is less than might be expected. Results from field surveys in warm climates suggest that high humidity has the same effect as a rise in temperature of about 1 K (Nicol, 2004). The increased discomfort that is commonly experienced at high humidity may not be entirely experienced as feeling hotter.
In addition to the effect of the four environmental variables, any ‘rational’ comfort index will include the metabolic heat production and the insulation of the clothing.
3.2 Investigating and modelling thermal comfort
Two approaches have been used to develop a model of thermal comfort:
— surveys in the field
— experiments in climate chambers.
Though one might expect the results to be similar, this is not always the case.
the air speed and the radiant temperature, both of which can change from place to place so that any such model will produce only an approximate result.
It is important that any thermal simulation achieves a realistic assessment of the operative temperatures within a space under normal occupant behaviour. The thermal simulation therefore requires a realistic representation of occupant behaviour, which is governed by occupant comfort and is limited by the available adaptive opportunities of the space. In simple terms, this means that the thermal modelling should ideally be able to predict the variations in temperature distributions and airflows within rooms, and also simulate the ventilation (window opening) and other adaptive behaviour of the occupants.
3.1.2 Air movement
Air movement acts to strip away the warm air from the surface of the body and is therefore important for convective heat loss. In the same way, when heat is lost by evaporation, the action of the air movement is to increase heat loss by transporting the moist air away from the body surface. In both cases the heat loss is roughly proportional to the square root of the air velocity.
3.1.3 Humidity
The effect of humidity on thermal comfort is difficult to gauge. In warm conditions, high temperatures mean that the body can lose less heat by convection and radiation (it
The operative temperature (Top) combines the air temperature and the mean radiant temperature into a single value to express their joint effect. It is a weighted average of the two, the weights depending on the heat transfer coefficients by convection (hc), which depends on the air velocity, and by radiation (hr) at the clothed surface of the occupant.
The operative temperature is defined as:
Top = H Ta + (1 – H) Tr (1.1)
where Ta is the indoor air temperature (°C), Tr is the mean radiant temperature (°C), H is the ratio hc / (hc + hr) and (1 – H) is the ratio hr / (hc + hr) where hc and hr are the surface heat transfer coefficients by convection and by radiation respectively (W·m–2·K–1).
Researchers have differed in their estimates of the values of these heat transfer coefficients, and hence of the value of H. In this publication, the value of √(10 v), where v is the air speed (m·s–1) is used for the ratio of hc to hr, and so:
Ta √(10 v) + Tr Top = —–––––––––— (1.2) 1 + √(10 v)
At indoor air speeds below 0.1 m·s–1, natural convection is assumed to be equivalent to v = 0.1, and equation 1.2 becomes:
Top = ½ Ta + ½ Tr (1.3)
Operative temperature approximates closely to the temperature at the centre of a painted globe of some 40 mm diameter. A table-tennis ball is a suitable size, and may be used to construct a globe thermometer appropriate for indoor spaces.
In well-insulated buildings and away from direct radiation from the sun or from other high temperature radiant sources, the difference between air and the mean radiant temperatures (and hence between the air and operative temperatures) is small.
Note: from the presence of the air speed in the equation 1.2, it has sometimes been assumed that operative temperature fully
allows for the effect of air speed on the occupant. This is not so. Increased air movement has two related effects:
● It alters the ratio hc / (hc + hr), thus potentially altering operative temperature.
● It alters the absolute value of the combined heat transfer coefficient between the clothed surface and the enclosure (hc + hr).
Thus the surface temperature of the occupant requires for its estimation both the operative temperature and the air speed.
Box 1: Operative temperature (from CIBSE Guide A (CIBSE, 2006))
1.00.0 0.1 0.2 0.3 0.4 0.5 0.6 0.7 0.8 0.9
1.5
0.5
0.1
Air
vel
ocit
y / (
m/s
)
Relative influence of air temperature
Diameter / mm
20
50
100
150
300
1.0
Figure B1.1 The relative importance of the air temperature in the temperature of a globe thermometer. The operative temperature is close to that of a 40 mm sphere. At an air speed of 0.1 m·s–1 the relative importance is about 0.5 but as air speed increases the relative importance of air temperature also increases (source: BS EN ISO 7726 (BSI, 2001)).
James Johnson, jam
, 10:00am 22/07/2013, 2, 34665

Predicting discomfort 5
3.2.2 Comfort and indoor conditions
Figure 3 shows how the comfort or neutral temperature (y-axis) is related to the average indoor operative tempera-ture (Top) for a whole field study*.The database on which the graph is based includes the results from some 700 comfort surveys. The value of the comfort temperature has been adjusted to allow for the effect of air movement. An adjustment will be given in the forthcoming edition of CIBSE Guide A (CIBSE, 2013). The equation for the adjustment (∆Tv K) that raises the comfort temperature when air speeds are fairly uniform and exceed 0.1 m/s is:
∆Tv = 7 – 50 / (4 + 10 √v) (1)
where v is the air speed (m/s).
Below 0.1 m/s the air speed is assumed to be equal to 0.1 m/s (caused by natural convection and bodily movement). The correction applies to sedentary or lightly active people. If a comfort temperature was estimated when the air speed was elevated, and it is desired to adjust it to what it would have been had the air speed been 0.1 m/s, the correction is subtracted from it.
3.2.1 Field surveys
Comfort surveys in the field (Figure 2) take subjects in their normal surroundings, e.g. workplace or home, leaving them to dress normally and to go about their normal everyday activities. Such a survey can combine observation of the subjects, their clothing and activity, observation or their behaviour and measurement of their physical surroundings. At intervals they will be asked for their sub-jective assessment of the conditions they are experiencing. The aim is to make a statistical analysis of the feelings of heat or cold recorded by the subjects on a scale of the kind shown in Table 1 and show how they relate to the measured environment. It has become increasingly common to also observe the actions the subjects take to keep comfortable — opening windows, using shades and fans, using heating or cooling, etc.
Such an approach has the problem that a number of relevant variables are changing simultaneously as people go about their daily business — changes of clothing, posture or activity as well as opening and closing of doors, windows and other equipment that people use to try to control their thermal environment. Since many are not easy to measure, the statistical analysis of a small survey can end up being, in effect, just a description of the data the researcher has collected, making scientific generalisation difficult. Nicol, Humphreys and Roaf (2012) discuss ways in which such data can be statistically analysed to estimate the operative temperature (the comfort temperature) at which the subject or subjects will be comfortable.
Luckily, a large number of comfort surveys are available in the literature (partly because they are relatively easy and cheap to conduct). Not all have all the behavioural material, but most have the environmental measurements and the subjective responses. This has enabled researchers to generalise through a ‘meta-analysis’ of a number of surveys. The first to do this systematically was Humphreys (1976) who showed that the temperature which subjects in a survey find comfortable — the ‘neutral temperature’ — is related to the average temperature measured near to the subject during the survey. Figure 3 is an update of Humphreys’ 1976 findings and has results from heated and cooled buildings (red) as well as free-running and hybrid buildings. Notice that in most cases the neutral (or comfort) temperature (y-axis) is close to the mean room temperature recorded during the survey (x-axis).
Figure 2 The field survey of thermal comfort. The researcher measures the environment, notes the subject’s clothing and activity, use of controls (windows, blinds, use of heating/cooling etc) and asks for the subject’s subjective response to the environment on a scale such as that in Table 1.
Figure 3 The relationship between the comfort or neutral temperature (Tn) and the mean operative temperature (Top) based on a meta analysis of over 700 comfort surveys. Each point is from an individual survey with more than 20 comfort votes and associated environmental measurements. The comfort temperature is calculated from the comfort data in the method outlined in Nicol, Humphreys and Roaf (2012) adjusted to allow for the effect of air movement (CIBSE, 2013) and the mean operative temperature is over the period of the particular survey. The error in the positioning of the point is small. The data include buildings that are free-running (blue), heated or cooled (red) and mixed mode (open). Of all the points, 95% lie between the upper and the lower lines. (After Humphreys, Rijal and Nicol, 2013.)
Neu
tral
tem
pera
ture
(°C
)
40
35
30
25
20
15
10
5 10 15 20 25 30 35 40
Top
Free runningMixed modeHeated/cooled
* Some readers accustomed to the relatively temperate indoor conditions in ‘Western’ countries will be surprised to see comfort temperature below 15 ˚C and above 35 ˚C. Clearly, the subjects in these comfort surveys are acclimatised both physiologically and culturally to such temperatures. Appropriate use of clothing and lifestyle expectations are part of the culture in many parts of the world and mean that temperatures seen by some as extreme are normal. In fact, it is worth noting that temperatures in many European homes were 15 ˚C or under only a few decades ago and French et al (2006) report that up to 25% of New Zealand homes have indoor temperatures of 15 ˚C or under in their living rooms in winter. Arsandrie et al (2012) and Gómez-Azpeitia et al (2012) report comfort temperatures up to 35 ˚C in warm but not extreme climates.
Jam
es J
ohns
on, j
ames
@ho
dkin
sonc
onsu
ltanc
y.co
m, 1
0:00
am 2
2/07
/201
3, 2
, 346
65
6 The limits of thermal comfort: avoiding overheating in European buildings
The comfort temperature has generally been calculated using regression analysis using a procedure that is fully explained in Nicol, Humphreys and Roaf (2012). It expresses the tendency for occupants to adapt to the conditions they normally encounter. The majority of these studies were carried out during daytime in non-domestic buildings. There is surprisingly little information about night-time thermal comfort (CIBSE, 2013), though it is generally assumed that sleep deprivation due to overheating during the night is a major motivation for buying domestic cooling. This trend is particularly problematic in the urban context where there is less air movement and urban heat island effects are most noticeable after dark.
This relationship between comfort and environment is a consequence of adaptation by the subjects to the environment they normally encounter. It is the underlying relationship of the ‘adaptive’ model of thermal comfort. Note that the relationship applies irrespective of whether the buildings are mechanically or naturally conditioned, or indeed mixed-mode.
Figure 3 above illustrates the result of adaptation to indoor conditions. While the comfort temperature is not equal to the mean indoor temperature, the range of indoor comfort temperatures for a given mean indoor operative temperature is in the region of 3–4 K (95% confidence interval). Because each point on the graph is the result of a considerable number of individual comfort assessments (minimum 20), the actual values are statistically fairly precise, so this is a real range of comfort temperature, not merely an error about a mean. While there are potential sources of error in, for example, the sampling of the buildings and the times of day at which the data were collected, this suggests that the comfort temperature can generally be estimated from the mean operative temperature within a degree or two.
The indoor neutral temperature is not equal to the indoor mean operative temperature, but is somewhat below it in hot conditions and above it in cold conditions. Note, however, that the results shown in Figure 3 are for still-air conditions. In conditions where there is air movement the neutral temperatures will be higher. In hot climates fans are often provided in offices as a matter of course so that the degree of overheating implied by the discrepancy between neutral temperature and operative temperature will be reduced.
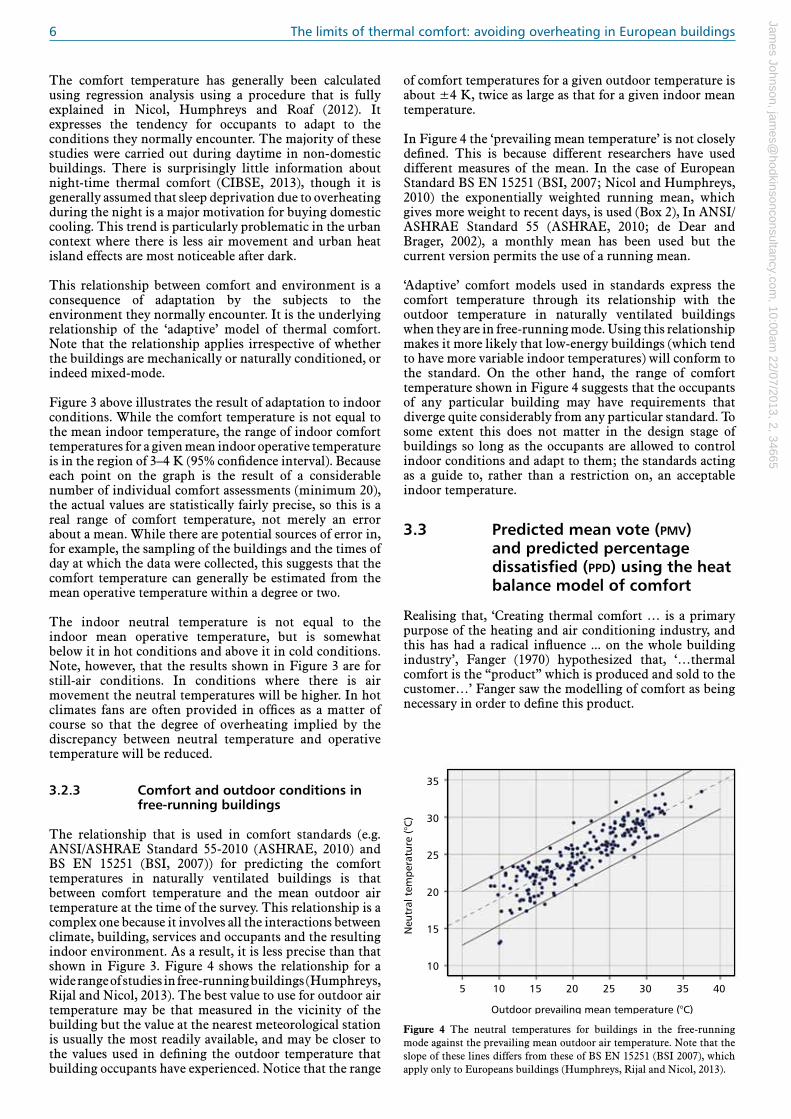
3.2.3 Comfort and outdoor conditions in free-running buildings
The relationship that is used in comfort standards (e.g. ANSI/ASHRAE Standard 55-2010 (ASHRAE, 2010) and BS EN 15251 (BSI, 2007)) for predicting the comfort temperatures in naturally ventilated buildings is that between comfort temperature and the mean outdoor air temperature at the time of the survey. This relationship is a complex one because it involves all the interactions between climate, building, services and occupants and the resulting indoor environment. As a result, it is less precise than that shown in Figure 3. Figure 4 shows the relationship for a wide range of studies in free-running buildings (Humphreys, Rijal and Nicol, 2013). The best value to use for outdoor air temperature may be that measured in the vicinity of the building but the value at the nearest meteoro logical station is usually the most readily available, and may be closer to the values used in defining the outdoor temperature that building occupants have experienced. Notice that the range
of comfort temperatures for a given outdoor temperature is about ±4 K, twice as large as that for a given indoor mean temperature.
In Figure 4 the ‘prevailing mean temperature’ is not closely defined. This is because different researchers have used different measures of the mean. In the case of European Standard BS EN 15251 (BSI, 2007; Nicol and Humphreys, 2010) the exponentially weighted running mean, which gives more weight to recent days, is used (Box 2), In ANSI/ASHRAE Standard 55 (ASHRAE, 2010; de Dear and Brager, 2002), a monthly mean has been used but the current version permits the use of a running mean.
‘Adaptive’ comfort models used in standards express the comfort temperature through its relationship with the outdoor temperature in naturally ventilated buildings when they are in free-running mode. Using this relationship makes it more likely that low-energy buildings (which tend to have more variable indoor temperatures) will conform to the standard. On the other hand, the range of comfort temperature shown in Figure 4 suggests that the occupants of any particular building may have requirements that diverge quite considerably from any particular standard. To some extent this does not matter in the design stage of buildings so long as the occupants are allowed to control indoor conditions and adapt to them; the standards acting as a guide to, rather than a restriction on, an acceptable indoor temperature.
3.3 Predicted mean vote (pmv) and predicted percentage dissatisfied (ppd) using the heat balance model of comfort
Realising that, ‘Creating thermal comfort … is a primary purpose of the heating and air conditioning industry, and this has had a radical influence ... on the whole building industry’, Fanger (1970) hypothesized that, ‘…thermal comfort is the “product” which is produced and sold to the customer…’ Fanger saw the modelling of comfort as being necessary in order to define this product.
Neu
tral
tem
pera
ture
(°C
)
35
30
25
20
15
10
Outdoor prevailing mean temperature (°C)
5 10 15 20 25 30 35 40
Figure 4 The neutral temperatures for buildings in the free-running mode against the prevailing mean outdoor air temperature. Note that the slope of these lines differs from these of BS EN 15251 (BSI 2007), which apply only to Europeans buildings (Humphreys, Rijal and Nicol, 2013).
James Johnson, jam
, 10:00am 22/07/2013, 2, 34665

Predicting discomfort 7
The adaptive model of thermal comfort has found that the comfort temperature inside free-running buildings is related to the outdoor air temperature. The measure of outdoor temperature has often been the monthly mean. The comfort temperature is related to the thermal history of the subject with more recent experiences being more influential. This makes the exponentially weighted running mean an attractive measure for past temperatures. Such running means had previously shown their usefulness in describing changes in clothing in response to changing temperatures (Humphreys, 1979). The exponentially weighted running mean temperature, Trm, for any day is expressed in the series:
Trm = (1 – a) (Tod–1 + a Tod–2 + a2 Tod–3 ....) (2.1)
where a is a constant (<1) and Tod–1, Tod–2, etc. are the daily mean temperatures for yesterday, the day before, and so on.
(Note that ‘today’s’ daily mean temperature is not used because it remains unknown until the end of the day.) Since a <1, this series puts greater weight on the temperature for days closer to the present. The larger the value of a, the more important the past experience will be. For a series of days the value of Trm for any day
can be simply calculated from the value of the running mean and of the mean outdoor temperature for the previous day (Trm–1 and Tod–1):
Trm = (1 – a) Tod–1 + a Trm–1 (2.2)
This makes the running mean very simple to use once a starting value has been established. The optimal value of a to use in calculating the changes in indoor comfort temperature has been investigated using the data from comfort surveys conducted throughout Europe. The value of Trm calculated using equation 2.1 correlates best with Tc when a = 0.8.
Where an extensive run of days is not available, BS EN 15251 (BSI, 2007) gives an approximate calculation method using the mean temperatures for the last seven days (a = 0.8):
Trm = (Tod–1 + 0.8 Tod–2 + 0.6 Tod–3 + 0.5 Tod–4
+ 0.4 Tod–5 + 0.3 Tod–6 + 0.2 Tod–7) / 3.8 (2.3)
This approximate value can also be used to ‘start off’ a longer run of Trm.
Box 2: Exponentially weighted running mean of the daily mean outdoor air temperature
His premise was that a balance between the heat produced by the body and the heat lost from it is a necessary, but not sufficient, condition for thermal comfort. It is not sufficient because there are situations in which a physical balance would occur, but that would not be considered comfortable (for example, where there is a big asymmetric radiant source such as a cold window). So the determination of comfort conditions is in two stages: first find the conditions for thermal balance and then determine which of the conditions so defined are consistent with comfort.
The basic equation for thermal balance is:
H – Eis – Esw – Eres – Cres = K = R + C (2)
where H is the net metabolic heat production (metabolic rate less work done) and K is the heat transfer from the skin to the outer surface of the clothed body by conduction through the clothing, R and C are the radiant and convective heat loss from the outer surface and Eis, Esw, Eres are the evaporative heat losses from skin, by sweating and from respiration and Cres is the convective heat loss from respiration.
Equations can be derived for all of these individual contributions to the heat balance equation if the metabolic rate, the thermal resistance of the clothing and the four environmental parameters (air and radiant temperatures, humidity and air speed) are known.
It remained to define the conditions consistent with comfort within the conditions for heat balance. Fanger proposed that the condition for thermal comfort for a given person is that his or her skin temperature and sweat secretion must lie within narrow limits. Data were obtained from climate chamber experiments in which sweat rate and skin temperature were measured on people at various metabolic rates who considered themselves comfortable. The conditions for thermal comfort were expressed by the regression line of skin temperature and sweat rate on metabolic rate from these experiments. In this way an expression for comfort can be deduced from the metabolic rate, clothing insulation and environmental conditions. In further experiments, he confirmed in climate chambers, to his satisfaction, that there were not significant differences by race, gender or climate of origin of the subjects.
The final equation for optimal thermal comfort is fairly complex (BSI, 2005) and need not concern us here. Equations for combinations of comfortable conditions were calculated by computer and the results presented in the form of diagrams from which optimal comfort conditions can be read, given a knowledge of metabolic rate and clothing insulation.
This work was extended by proposing an index that predicts the mean thermal sensation vote (ASHRAE scale in Table 1) called the predicted mean vote (PMV). The assumption was that the sensation experienced by a person was a function of the physiological strain imposed by the environment. The strain is defined as, ‘the difference between the internal heat production and the heat loss to the actual environment for a person kept at the comfort values for skin temperature and sweat production at the actual activity level’ (Fanger, 1970). This extra load was calculated for people involved in climate chamber experiments and their comfort vote was plotted against it. The PMV predicts what mean comfort vote would be cast by a group of subjects arising from a given set of environmental conditions for a given clothing insulation and metabolic rate. Tables of PMV are available for different environments for given clothing and metabolic rates. Such tables form the basis of standard BS EN ISO 7730 (BSI, 2005).
The PMV has been extended to predict the proportion of any population that will be dissatisfied with the environment — the predicted percentage dissatisfied (PPD). A person’s dissatisfaction was defined in terms of their comfort vote. Those who voted outside the central three scaling points on the ASHRAE scale (i.e. those voting –3, –2, +2 or +3, see Table 1) were counted as dissatisfied. PPD is defined in terms of the PMV. PPD adds information about the range of different reactions by people to their environment. The distribution of PPD is based on observations from climate chamber experiments.
We have deliberately avoided a detailed description of the PMV to keep this discussion simple. More detail of the physics of the model is available in Fanger (1970) and in, for example, McIntyre (1980) or Parsons (2003). There are, however, a number of points that need to be noted:
Jam
es J
ohns
on, j
ames
@ho
dkin
sonc
onsu
ltanc
y.co
m, 1
0:00
am 2
2/07
/201
3, 2
, 346
65

8 The limits of thermal comfort: avoiding overheating in European buildings
— The data on which Fanger’s model is based were obtained exclusively from climate chamber studies and in conditions that were kept constant for a number of hours so that a steady state had been reached.
— The prediction of conditions for optimal comfort, PMV or PPD require a knowledge of the clothing insulation and these are obtained by the practitioner from tables such as those in ISO 9920 (ISO, 2009) where clothing insulation is listed against descriptions of items or ensembles of clothing determined in experiments using a heated manikin.
— Metabolic rate is similarly obtained from tables such as those in BS EN ISO 8996 (BSI, 2004) of activities for each of which the appropriate metabolic rate is given. Note, in addition, that the metabolic rate for a given task is assumed to be independent of the indoor environment.
— Because the value of PMV incorporates humidity and air movement, these have to be estimated or assumed as well as air and radiant temperatures when using the equations.
For the client (building owner or developer) and for the designer, these characteristics of PMV pose a number of problems:
— It is assumed that the designer knows what clothing the occupants of the building will wear and will, in general, make an assumption based on a particular clothing insulation.
— Likewise, an assumption must be made about what activity they will be engaged in and there is an additional problem for buildings where a number of different activities are taking place in the same space.
— Design conditions in the building are based on those of the steady state in the climate chamber.
All these factors will influence the designer towards a highly serviced building producing closely controlled internal conditions appropriate to some assumed clothing norm and activity. This makes the method very difficult to apply to buildings not using mechanical heating, cooling or ventilation. The temperature in such buildings in free-running mode will almost certainly change continually with time, even if the inhabitants are able to control it to some extent.
3.4 Other considerations
There are some situations where the major comfort models are poor or where models have not yet been developed. Rooms where the temperature is variable can make it difficult to make an accurate prediction of occupants’ responses. Buildings that are mixed-mode, for example, i.e. those that are naturally ventilated but where comfort cooling comes into play when temperatures get too high, are difficult to characterise using the current divide between mechanical and natural ventilation. And, of course, there are some environments where the conditions get so extreme that thermal stress is the issue, rather than thermal comfort.
3.4.1 Designing variability
Variability of indoor conditions around a room is hard to deal with. Many existing models and regulations assume that what is needed is a temperature that is constant in space as well as time. Simulation software usually calculates the bulk air temperature, assuming the air is well mixed; this is then combined with the mean radiant temperature at the centre of the space to estimate operative temperature.
Is such constancy always what is wanted? Why not build in at least the possibility of variability, while avoiding conditions that are clearly undesirable? Could variations in indoor environment be the result of choices made by occupants, such as a change in the thermostat or the opening of a window?
In reality, the operative temperature at any point in an internal space is a function of the air speed, the radiant and the air temperatures at that point. These are, in turn, a function of the design and operation of the heating and ventilation system, i.e. location, size, type and use of openings, ventilation strategy. Until relatively recently the heating systems of many buildings not only created variability, but that variability enabled more effective use of the space. An example is an open fire where occupants make themselves comfortable by moving nearer to the fire or further away.
3.4.2 Mixed-mode or hybrid buildings
At the time of writing there is an increased interest in the use of hybrid or mixed-mode buildings. These are buildings that use a variety of means of ventilation. They may be naturally ventilated buildings that have a controlled indoor climate for part of the year. Thus, many naturally ventilated buildings will have controlled indoor climate during the winter and increasingly one that is cooled for part of the summer. Another type of hybrid building will have both mechanical ventilation and temperature control and at the same time may use passive controls such as shading, or use ground- or air-source heating or cooling at various times.
One approach might be to apply PMV when the building is in ‘mechanically controlled’ mode and an adaptive approach when it is ‘free-running’ or ‘passively controlled’ mode. This is not satisfactory because the two relationships do not usually give the same result, and the implication would be a ‘jump’ in internal temperature when there was a transfer from one mode to another. This does not make sense either in terms of comfort or of energy use (a jump may require a large amount of energy to accomplish).
At the same time the adaptive relationship between comfort and indoor climate shown in Figure 3 applies irrespective of the mode of heating or cooling. This may necessitate new approaches to the purpose of standards and the intentions behind them (Nicol, Humphreys and Roaf, 2012).
3.4.3 Heat stress
Heat stress occurs when the body’s means of controlling its internal temperature start to fail. The combined interaction of air temperature, radiant temperature, air velocity, humidity, work rate and clothing produce a strain on the body as it becomes too hot and attempts to maintain its internal temperature at an optimum level.
James Johnson, jam
, 10:00am 22/07/2013, 2, 34665

The basis of comfort standards 9
The wet bulb globe temperature (WBGT) index is the most widely used and accepted index for the assessment of heat stress in industry. It has been published as BS EN ISO 7243 (BSI, 1994). For buildings where there is no solar load, the wbgt index combines two measure ments: natural wet bulb temperature (Tnw) and globe temperature (Tg).
Inside buildings and outside buildings on overcast days:
wbgt = 0.7 Tnw + 0.3 Tg (3)
Outside buildings with solar load, air temperature (Ta) is included in the measures so that:
wbgt = 0.7 Tnw +0.2 Tg +0.1 Ta (4)
The conditions where heat stress is likely to occur are outside those required to maintain thermal comfort or an acceptable level of overheating in buildings, as such the subject is not dealt with in this TM. More detail on the limiting values of WBGT can be found on the Health and Safety Executive website (HSE, no date) or in BS EN ISO 7243 (BSI, 1994).
4 The basis of comfort standards
From the 1970s until the start of the 21st century, standards for indoor temperatures (principally BS EN ISO 7730 (BSI, 2005) and ANSI/ASHRAE Standard 55 (ASHRAE, 2010)) were based on the PMV model outlined previously or the standard effective temperature (SET) based on the Pierce two-node model of thermal physiology (Gagge, Stolwiik and Nishi, 1970). The SET approach eventually fell into disuse and the PMV became the accepted model. BS EN ISO 7730 (BSI, 2005) in particular, is essentially a handbook of the PMV approach. It also includes suggestions for related issues, such as allowing for draughts, floor temperatures and other technical issues.
4.1 Existing standards
More recently, and following from the work of Humphreys (1978) in the 1970s, de Dear and Brager (2001) and many others, there has been increasing realisation that the PMV model is not appropriate, especially in naturally ventilated buildings that are in free-running mode (neither heated nor cooled). This has led to new formulations of various standards starting in America with ANSI/ASHRAE Standard 55 (ASHRAE, 2010), in Holland (van den Linden et al., 2006) and then throughout Europe in CEN standard BS EN 15251 (BSI, 2007), which include ‘adaptive’ tempera-ture limits for naturally ventilated or free-running buildings.
4.1.1 ISO Standard BS EN ISO 7730
The ISO standard concerned with indoor environment is BS EN ISO 7730 (BSI, 2005). This standard essentially provides means to calculate PMV and PPD indices, together with some information for the estimation of some localised effects.
4.1.2 ANSI/ASHRAE Standard 55
For mechanically conditioned buildings ANSI/ASHRAE Standard 55 (ASHRAE, 2010) follows the form of BS EN ISO 7730. It maps out bounds of the area predicted to be acceptable to a majority of occupants, including upper limits of temperature and relative humidity. The resulting area of acceptability is presented on a psychometric chart.
Since 2004, ANSI/ASHRAE Standard 55 has also included a chart (Figure 5) relating an acceptable range of operative temperatures in naturally conditioned buildings related to the monthly mean of the outdoor temperature. Two ranges are presented — one within which 90% acceptability is expected and a second for 80% acceptability. The adaptive equation for comfort underlying the ASHRAE standard is:
Tcomf = 0.31 Tom + 17.8 (5)
where Tcomf is the comfort temperature and Tom is the monthly mean outdoor temperature.
The definition of Tom is under discussion and may in future include running mean as well as monthly mean temperatures.
4.1.4 CEN Standard BS EN 15251
European standard BS EN 15251 (BSI, 2007) is one of a suite of European standards designed to underpin the Energy Performance of Buildings Directive (EPBD)*, which seeks to reduce energy use in the European building stock. BS EN 15251: Indoor environmental input parameters for design and assessment of energy performance of buildings addressing indoor air quality, thermal environment, lighting and acoustics, seeks to define indoor environments consistent with occupant satisfaction in order to ensure that energy efficiency is as far as possible achieved without cost to the comfort, performance or wellbeing of building occupants.
Like ANSI/ASHRAE Standard 55 (ASHRAE, 2010), BS EN 15251 has separate environmental standards for mechanically cooled buildings. These are also based on the PMV index and are given ranges of PMV that are acceptable in different categories of building.
The approach to naturally ventilated buildings in free-running mode is also similar to that in ANSI/ASHRAE
Figure 5 Acceptable operative temperature ranges for naturally conditioned spaces (ASHRAE, 2010).
Indo
or o
pera
tive
tem
pera
ture
/ °C
°F
32
30
28
26
24
22
20
18
16
14
86·0
82·4
78·8
75·2
71·6
68·0
64·4
60·8
5 10 15 20 25 30
50 59 68 77 86 95
35Mean monthly outdoor air temperature / °C
90% acceptability limits
80% acceptability limits
°F
* Directive 2002/91/EC of the European Parliament and of the Council of 16 December 2002 on the energy performance of buildings.
Jam
es J
ohns
on, j
ames
@ho
dkin
sonc
onsu
ltanc
y.co
m, 1
0:00
am 2
2/07
/201
3, 2
, 346
65

10 The limits of thermal comfort: avoiding overheating in European buildings
Standard 55 and the equation relating comfort temperature to outdoor temperature in European standard BS EN 15251 is similar (Figure 6) but uses Trm, the exponentially weighted running mean of the daily mean outdoor air temperature as the measure of outdoor temperature (for definition see Box 2):
Tcomf = 0.33 Trm + 18.8 (6)
The graph shows acceptable temperature ranges for different categories of buildings as listed in Table 2.
In ANSI/ASHRAE Standard 55 (ASHRAE, 2010) and BS EN ISO 7730 (BSI, 2005) buildings are classified as A, B or C class on the basis of the range of pmv encountered in their internal environment: the ranges of acceptable values of pmv are ±0.2 (ppd ≤ 6%), ±0.5 (ppd ≤ 10%) and ±0.7 (ppd ≤ 20%) respectively. In these standards there is a definite implication that an A building is better than a B or a C building. In other words, the more highly controlled, A-rated ‘premium office space’, which is by implication mechanically controlled, is superior. Naturally ventilated buildings have more variable indoor climates so the implication is that they are inferior. In European standard BS EN 15251 (BSI, 2007) the acceptable ranges of pmv in Categories I, II and III are shown in Table 2. They are defined in terms of the type of building and its use, rather than as an indication of building quality. Though this is an improvement, it is still possible to interpret a Category I as better than a Category II or III.
The UK Government’s Energy Consumption Guide 19: Energy use in offices (EEBPP, 2000) makes it clear that highly controlled indoor environments are linked to high energy
use and thus the ABC classification implies that a high-energy building is superior.
BS EN 15251 (BSI, 2007) was intended to provide back-up to the EPBD and the category system is designed to avoid unnecessarily handicapping low-energy, naturally ventilated buildings.
BS EN 15251 (BSI, 2007) includes the effect on comfort of fans and other sources of air movement under the control of the building occupants. Figure 7 shows the increase allowed in the comfort temperature for any given value of the air speed (va). There is an upper limit on the air speed in any real situation, such as an office where papers might get blown around. Analysis of the effect of running fans suggests that in a hot climate the presence of a fan can increase the comfort temperature by about 2 K (Nicol, 2004).
A description of the derivation of the ASHRAE chart for naturally conditioned buildings may be found in de Dear and Brager (2002) and for BS EN 15251 in Nicol and Humphreys (2010).
4.2 Problems for standards
All comfort standards have problems, because they try to give precise definitions when the phenomenon they are describing is inherently imprecise. The wide range of possible indoor comfort temperatures for any given outdoor temperature illustrated in Figure 4 is a problem for standards based on the adaptive model. If the conformity to the standard is tested by monitoring, this range suggests that a building that is found comfortable by its occupants may be found to be towards the limit of the temperature range suggested by the standard.
Table 2 Suggested applicability of the categories and their associated acceptable temperature range for free-running buildings and of pmv for mechanically ventilated buildings (from BSI, 2007). The CIBSE suggestion is that designers should aim to remain within the Category II limits.
Category Explanation Suggested acceptable Suggested acceptable
range (K) limits PMV
I High level of expectation only used for spaces occupied by very sensitive and fragile persons ± 2 ± 0.2
II Normal expectation (for new buildings and renovations) ± 3 ± 0.5
III A moderate expectation (used for existing buildings) ± 4 ± 0.7
IV Values outside the criteria for the above categories (only acceptable for a limited periods) >4 > 0.7
Figure 6 Limiting values for the operative temperature in buildings operating in the fr mode as a function of the exponentially weighted running mean of the external temperature (BSI, 2007).
32
30
28
26
24
22
20
18
Com
fort
tem
pera
ture
, To
/ °C
Running mean outdoor temperature, Trm / °C8 10 12 14 16 18 20 22 24 26 28 30
I upper limitII upper limitIII upper limit
IIIIII
IIIIII
I lower limitII lower limitIII lower limit
Figure 7 Allowance for air movement in BS EN 15251 (BSI, 2007) when, for example, a ceiling fan or other source of air movement is available under the control of occupants. Note: DTo is similar to the allowance for air velocity, DTc given in section 3.2.2.
4·03·02·01·00·0
1·5
1·0
0·5
0·0
ΔTo (K)
Air
spe
ed, v
a (m
/s)
James Johnson, jam
, 10:00am 22/07/2013, 2, 34665

Risk of overheating 11
The tem pera tures predicted to be comfortable by the standard could be too high or too low for comfort and temperatures that it predicts will cause discomfort might be found to be acceptable. This suggests that standards are useful for suggesting an acceptable indoor environment at the design stage, but may be less useful in assessing existing buildings.
The division between mechanically and naturally ventilated (free-running) buildings will also become problematic with the increasing use of mixed-mode or hybrid buildings. At the same time, Figure 3 suggests people actually respond in a similar way to all kinds of buildings, irrespective of their ventilation system.
5 Risk of overheatingOne way to define overheating is to identify a particular temperature above which a given proportion of people in a building (say 20%) vote +2 or +3 on the ASHRAE scale (Table 1). If this occurs at the sort of indoor temperatures that will frequently occur in a building, the building is considered to overheat.
5.1 Problems with a single temperature overheating limit
In the 2006 edition of CIBSE Guide A (CIBSE, 2006), the definition of an overheating building was one in which the temperature exceeded 28˚C for more than 1 per cent of working hours. Yet Figure 6 suggests that this temperature might be considered acceptable in a warm UK summer. There are problems with the use of such a fixed, nationwide (or even international) threshold temperature and an ‘hours over’ criterion.
(1) The ‘adaptive’ approach to thermal comfort shows that the temperature at which the majority of people are comfortable ‘tracks’ the mean indoor tempera-ture because of the correlation between indoor and outdoor temperature in free-running buildings. This means that comfort temperature also varies with outdoor temperature in buildings in free-running mode.
(2) While the ‘limiting values’ of the indoor temperature in Figure 6 can be used as a measure of the occurrence of overheating, they do not provide a measure of its severity. For example, a building that exceeds the limiting temperature by 1 K might be considered to have less of an overheating problem than one that exceeds it by 4 K even if it was for a longer time. BS EN 15251 (BSI, 2007) suggests a degree-hours measure whereby the number of hours over the limiting value is weighted as shown in the example in Table 3. This takes discomfort to be linearly proportional to the difference from the discomfort threshold criteria to take account of both severity as well as occurrence.
(3) Any criterion that has a sharp threshold temperature is very sensitive to the method used to predict indoor temperatures. Systematic errors in calculation methods can lead to changes in the shape of the distribution of indoor temperatures that can significantly affect the extreme ‘tail’ which is the critical part of the distribution for discomfort.
(4) There is the danger that the number of ‘occupied hours’ can be altered to achieve a different percentage of occupied hours above the threshold temperature. Merely increasing the hours of occupation may appear to ‘solve’ an overheating problem, as currently defined.
(5) It is arguable whether thermal discomfort over a whole season or year is a good measure of overheating, or whether perceptions of overheating are actually caused by periods of thermal discomfort concentrated in a shorter period of time. In building simulations a ‘design summer year’ (DSY) is used to test the likelihood of overheating. Presently such DSYs are chosen for their high average temperature and may not be the most likely to cause discomfort.
5.2 Discomfort as a function of a deviation from comfort temperature
Discomfort is a function not of the temperature, but of the deviation from the comfort temperature (Nicol and Humphreys, 2007). Figure 8 shows how the number of people who feel comfortable (ASHRAE vote –1 to +1) varies in relation to the deviation from the comfort temperature as defined in BS EN 15251 (BSI, 2007; equation 6). The deviation shown here is from the comfort temperature for all the buildings in the survey. If the deviation is from the comfort temperature for the building that the subject occupies, the maximum proportion com-fortable would probably be greater and the range of comfortable temperatures narrower.
Table 3 Weighting factors based on temperature difference (or ppd for mechanically heated or cooled buildings) following the assumptions shown in the text (BSI, 2007). Note that this table assumes a Category I building where acceptable temperatures lie within ±2 ˚C of the optimum and that the optimum temperature is between 24 and 25 ˚C.
Description Temperature (°C) Weighting factors
wf (Temp.) wf (ppd)
Cool 20 3 4.7 21 2 3.1 22 1 1.9 Neutral 23 0 0 24 0 0 25 0 0 26 0 0 Warm 27 1 1.9 28 2 3.1 29 3 4.7
Prop
orti
on /
%
–5 –1–2–3 0 1 2 3 4–4 5Tdiff / °K
Comfortable
Neutral
100
80
60
40
20
0
Figure 8 Proportion of people in a building who are comfortable (comfort vote –1, 0 or +1 on the ASHRAE scale or neutral as a function of deviation (Tdiff) of operative temperature from comfort temperature (as defined for BS EN 15251)). Solid lines: free-running buildings; dashed lines: heated or cooled buildings (Nicol and Humphreys, 2007).
Jam
es J
ohns
on, j
ames
@ho
dkin
sonc
onsu
ltanc
y.co
m, 1
0:00
am 2
2/07
/201
3, 2
, 346
65

12 The limits of thermal comfort: avoiding overheating in European buildings
The likelihood of discomfort from heat (generally accepted as ASHRAE vote = +2 or +3) has been derived from a logistic regression analysis based on comfort surveys in European office buildings (Nicol and Humphreys, 2007). It gives the proportion P of subjects voting ‘warm’ or ‘hot’ on the ASHRAE comfort scale (the accepted definition of discomfort from heat) as (see Figure 9):
e(0.4734 DTdiff – 2.607)
P = ———————–—– (7)
1 + e(0.4734 DTdiff – 2.607)
Note that even when the indoor operative temperature is equal to the comfort temperature some discomfort will still occur because of differences between individuals.
Although most of the available data on thermal comfort comes from non-domestic buildings, European standard BS EN 15251 claims applicability in domestic buildings. This can be accepted as an interim assumption, as it has been found that a given group of people are generally less sensitive to temperature in their home surroundings because these are familiar to them and restrictions such as dress codes are unlikely to apply (Oseland, 1994). This does not mean that high temperature is not a problem at home for especially sensitive individuals, such as the very young and the very old, or at night where problems with sleeping are a frequent complaint in hot weather. The opportunity to control the temperature to Category I building limits, if necessary, should be available but data from occupants of dwellings in use actually suggests that they are less sensitive to temperature changes just because they have more choice.
Above 25 °C, CIBSE Guide A suggested:
— relaxation of formal office dress to encourage individual adaptation to conditions
— individual control over the thermal environment, where practicable, such as by opening windows, using blinds or moving out of sunny areas
— flexible working so people can work at more comfortable times
— availability of hot or cold drinks
— increased air movement; e.g. the cooling effect of local fans can be equivalent to reducing the operative temperature by around 2 K.
Indoor operative temperatures of 30 ˚C or more were identified as, ‘rarely acceptable to occupants of office buildings in the UK’.
While this advice is basically sound, the assumption that there is a single indoor temperature limit irrespective of outdoor conditions is no longer considered sufficient.
6.1 CIBSE guidance
The CIBSE Overheating Task Force has decided that a new approach to the definition of overheating is necessary, particularly for buildings without mechanical cooling. This will follow the methodology and recommendations of BS EN 15251 (BSI, 2007) to determine whether an existing occupied building can be classed as overheating or a proposed building is in danger of becoming overheated.
6.1.1 Estimating overheating in unoccupied (or recently occupied) buildings
In cases where buildings are still in the design stage or have not long been occupied, the recommendations of BS EN 15251 (BSI, 2007), together with evidence of the likely indoor temperatures in use, can be used to suggest whether a problem of overheating is likely to occur.
(1) Prediction by simulation
Overheating in such new buildings can only be predicted before occupation by dynamic simulation. In order for the simulation to be applicable in periods when overheating is likely to occur, it is suggested that an appropriate ‘design summer year’ (DSY) weather file (see chapters 2 and 5 of CIBSE Guide A (CIBSE, 2006)) is used in the simulation. It is also necessary that:
— simulation predicts operative temperatures in occupied buildings
— in free-running buildings the simulation includes a realistic allowance for the use of window opening (one of the chief means of temperature control in free-running buildings) (see, e.g. Rijal et al., 2007)
— the various sources of heat gain to the building (e.g. electrical appliances, light fittings etc) as well as the effects of solar radiation through windows are fully and realistically accounted for.
Ove
rhea
ting
ris
k
–2 –1 0 1 2 3 4 5 6Difference between operative temperature
and comfort temperature / °K
60%
50%
40%
30%
20%
10%
0%
Figure 9 The proportion of subjects voting ‘warm’ or ‘hot’ on the ASHRAE scale (overheating risk) as a function of the difference between the indoor operative temperature and the CEN comfort temperature (equation 6) (developed from Nicol and Humphreys, 2007).
6 CIBSE recommendations for identifying overheating
The 2006 edition of CIBSE Guide A (CIBSE, 2006) recommended 25 °C as an acceptable indoor design operative temperature for non-air conditioned office buildings in summer and suggested limiting the expected occurrence of operative temperatures above 28 °C to 1 per cent of the annual occupied period (e.g. around 25–30 hours). Indoor operative temperatures over 28 °C for long periods were expected to result in increased dissatisfaction and reduced productivity, and were deemed to overheat.
James Johnson, jam
, 10:00am 22/07/2013, 2, 34665

CIBSE recommendations for identifying overheating 13
Recommendations for these factors will be given in the forthcoming edition of CIBSE Guide A (CIBSE, 2013).
(2) Prediction by monitoring
There may also be circumstances where the building is only recently occupied. Here the procedure suggested in 6.1.4 using surveys of building occupants is not applicable, as it relies on occupant familiarity with the building. The procedure suggested is to monitor the operative temperature regularly in a number of representative spaces in the building. Operative temperature can be measured using a ~40 mm diameter black or dark-grey globe as recommended in an appendix to chapter 1 of CIBSE Guide A (CIBSE, 2006). Where there are distinctive indoor climates in different rooms of the building, separate monitoring will be necessary. An example of such an analysis is given below. The problem here is to find periods of typical weather*.
6.1.2 Criteria for defining overheating in free-running buildings
The following three criteria, taken together, provide a robust yet balanced assessment of the risk of overheating of buildings in the UK and Europe. A room or building that fails any two of the three criteria is classed as overheating.
(1) The first criterion sets a limit for the number of hours that the operative temperature can exceed the threshold comfort temperature (upper limit of the range of comfort temperature) by 1 K or more during the occupied hours of a typical non-heating season (1 May to 30 September).
(2) The second criterion deals with the severity of overheating within any one day, which can be as important as its frequency, the level of which is a function of both temperature rise and its duration. This criterion sets a daily limit for acceptability.
(3) The third criterion sets an absolute maximum daily temperature for a room, beyond which the level of overheating is unacceptable.
The recommended definitions for the criteria are given below. They should be explained to clients and there may be circumstances where stricter limits are appropriate for a particular building or building type. Limits that are looser than recommended should be avoided.
CIBSE recommends that new buildings, major refurbishments and adaptation strategies should conform
to Category II in BS EN 15251 (BSI, 2007) (for category definition see Table 2), which sets a maximum acceptable temperature of 3 °C above the comfort temperature (equation 6) for buildings in free-running mode. For such buildings the maximum acceptable temperature (Tmax) can be calculated from the running mean of the outdoor temperature (Trm) (see Box 2) using the formula:
Tmax = 0.33 Trm + 21.8 (8)
where Tmax is the maximum acceptable temperature (°C).
It should be noted that for buildings that have a higher level of expectation in respect to, say, spaces that are occupied by very sensitive and fragile persons, you may wish to agree with the client the more demanding standard suggested for Category I. This sets the maximum acceptable temperature (Tmax) at 1 K less than the above recommendation.
The criteria are all defined in terms of DT the difference between the actual operative temperature in the room at any time (Top) and Tmax the limiting maximum acceptable temperature. DT is calculated as:
DT = Top – Tmax (9)
DT is rounded to the nearest whole degree (i.e. for DT between 0.5 and 1.5 the value used is 1 K; for 1.5 to 2.5 the value used is 2 K, and so on).
(a) Criterion 1: Hours of exceedance (He)
The number of hours (He) during which DT is greater than or equal to one degree (K) during the period May to September inclusive shall not be more than 3 per cent of occupied hours.
If data are not available for the whole period (or if occupancy is only for a part of the period) then 3 per cent of available hours should be used.
Background
An understanding of how often a building is likely to exceed its comfort range during the summer months can provide useful information about the building’s thermal characteristics and potential risk of overheating over the range of weather conditions to which it will be subjected. This simple ‘hours of exceedance’ criterion is something that designers are familiar with and provides a good first assessment of acceptability. The 3 per cent maximum of occupied hours is suggested in BS EN 15251.
The following results are from an exemplar case (Tuohy et al., 2009) and will provide a clearer picture of the use of this criterion. Simulation studies were used to examine the thermal performance of two south-facing office designs during the summer months of June, July and August. The location chosen for the studies was the city of Dundee, which is cooler than southern UK locations, but is known to have relatively high solar gains and provides a good test for overheating studies.
Figures 10 and 11 show the external air (Tout) and internal operative temperatures (Top) along with the upper limit of the range of comfort temperatures (Tmax) for two case
* The suggestion in BS EN 15251 (BSI, 2007) is as follows:
‘...measurements shall be made where occupants are known to spend most of their time and under representative weather condition of cold and warm season. For the winter (heating season) measurements at or below mean outside temperatures for the three coldest months of the year, and for the summer (cooling season) measurements at or above statistically average outside temperatures for the three warmest months of the year with clear sky. The measurement period for all measured parameters should be long enough to be representative, for example 10 days.’
Operative temperature should be measured using a 40 mm globe thermometer (Box 1). Otherwise air temperature can be used in long-term measurements and corrected for large hot or cold surfaces to estimate the operative temperature of the room.
Jam
es J
ohns
on, j
ames
@ho
dkin
sonc
onsu
ltanc
y.co
m, 1
0:00
am 2
2/07
/201
3, 2
, 346
65

14 The limits of thermal comfort: avoiding overheating in European buildings
studies described below. Also shown is the absolute upper limit for Top (Tupp) as defined in criterion 3.
The physical characteristics of the first design are that it is built to 1990s standards, has limited/poor solar, daylight and glare control, low thermal mass and no night cooling strategy. Figure 10 suggests that it will be likely to receive regular complaints of overheating. The results suggest an unsatisfactory thermal performance. Tmax is exceeded (i.e. DT > 0) 64 hours (11 per cent of the 594 occupied hours) and thus the buildings fails criterion 1.
The second design (Figure 11) has the same characteristics as the first, but with external shading added, exposed thermal mass ceilings and a night cooling strategy. This is a building that is likely to provide a high level of satisfaction in respect to thermal comfort and indoor air quality (IAQ). This building (Figure 11) shows a more satisfactory thermal performance where Tmax is not exceeded and the building therefore satisfies criterion 1.
(b) Criterion 2: Daily weighted exceedance (We)
To allow for the severity of overheating the weighted exceedence (We ) shall be less than or equal to 6 in any one day where:
We = (∑ he) × wf
= (he0 × 0) + (he1 × 1) + (he2 × 2) + (he3 × 3)
(10)
where the weighting factor wf = 0 if DT ≤ 0, otherwise wf = DT, and hey is the time (h) when wf = y.
Thus suppose we have a room where the temperature is simulated or monitored at half-hourly intervals over 8 occupied hours, so we have 16 readings, ten of them where DT is zero or negative (wf = 0), three readings where DT = 1 (wf = 1), two where DT = 2 (wf = 2) and one where DT = 3 (wf = 3) then:
We = ½ [(10 × 0) + (3 × 1) + (2 × 2) + (1 × 3)]
= 5 (i.e. the criterion is fulfilled)
Background
This criterion sets an acceptable level for the severity of overheating and is based on Annex F Method B, ‘Degree-hours criteria’ in BS EN 15251 (BSI, 2007). It is the time (hours and part hours) during which the operative temperature exceeds the specified range during the occupied hours, weighted by a factor that is a function depending on by how many degrees the range has been exceeded. The value of the weighting factor is based on the observed increase in the percentage of occupants voting ‘warm’ or ‘hot’ on the ASHRAE scale (overheating risk) with each degree increase in DT, the temperature above the comfort threshold temperature (see Figure 9).
The value of 6 is an initial assessment of what constitutes an acceptable limit of overheating on any single day. This initial assessment was made from observations of the temperature profiles from case studies of a range of free-running buildings that are perceived to perform well at one end of the range and poorly at the other in regards to limiting overheating. This is exemplified by the base case study as shown in Figure 12.
The results of the first case study show that the value We for the base case exceeds the limit of 6 on two separate days during one hot week (Figure 13) and it fails criterion 2. There were five days of exceedance during the test period June to August, which is almost 8% of the ~65 occupied days. Figure 12 shows the profile for the worst day (9 August), which had a We of 14. The second case study building (satisfactory thermal performance design) shows that neither criterion 1 nor 2 were exceeded during the test period and it would not be likely to overheat.
(c) Criterion 3: Upper limit temperature (Tupp)
To set an absolute maximum value for the indoor operative temperature the value of DT shall not exceed 4 K.
Background
The threshold or upper limit temperature is fairly self-explanatory and sets a limit beyond which normal adaptive actions will be insufficient to restore personal comfort and
Tem
pera
ture
(°C
)
35
30
25
20
15
10
5
0
Top
Tout
Tmax
Tupp
Summer hours: 1 June – 31 August
Unsatisfactory thermal performance (season)
Tem
pera
ture
(°C
)
35
30
25
20
15
10
5
0
Top
Tout
Tmax
Tupp
Summer hours: 1 June – 31 August
Satisfactory thermal performance (season)
Figure 10 Outdoor air temperatures (Tout) and indoor operative temperatures in an exemplar building with little thermal mass and no shading. Also shown are the day-to-day values of Tmax and Tupp (Tmax + 4) as defined in criterion 3 (data from Tuohy et al, 2009).
Figure 11 Outdoor air temperatures (Tout) and indoor operative temperatures in an exemplar building with exposed thermal mass, night cooling and solar shading. Also shown are the day-to-day values of Tmax and Tupp (Tmax + 4) as defined in criterion 3 (data from Tuohy et al, 2009) .
James Johnson, jam
, 10:00am 22/07/2013, 2, 34665

CIBSE recommendations for identifying overheating 15
the vast majority of occupants will complain of being ‘too hot’. This criterion covers the extremes of hot weather conditions and future climate scenarios.
6.1.3 Examples of testing
Another way that has been used to represent indoor operative temperature is to plot Top against the outdoor running mean air temperature in the manner used on BS EN 15251 (BSI, 2007) (see Figure 6). Examples using data from monitored and simulated buildings are given here.
(1) Testing using monitoring
Figure 14(a) shows the results of a comfort survey and temperature monitoring that were undertaken in a building. This building was monitored from July to September and the Category II temperature limits were exceeded by 1 K or more for 40 hours (3.6%). The building does fail criterion 1 but only
marginally and by inspection it abides by criteria 2 and 3. Figure 14(b) shows the comfort votes cast by the building’s occupants that concur with the prediction of a building where overheating is higher than would be desirable.
(2) Testing by simulation
The procedure for predicting overheating by simulation is similar to that for monitoring (Figure 15). Here the indoor temperature is calculated for each of the months where the building is expected to be in free-running mode. The simulation tool used should be capable of calculating Top and Trm and should be able to realistically account for the occupancy pattern of the building and the adaptive behaviour of the building occupants. Figure 15 shows an example using data from CIBSE TM36 (CIBSE, 2005b) of the expected effect of climate change between 2020 and 2050.
Tem
pera
ture
(°C
)
35
30
25
20
15
10
5
0
Top
Tout
Tmax
Tupp
Summer hours: 9 August
Unsatisfactory thermal performance (day)
1 4 7 10 13 16 19 22
Figure 12 A typical summer temperature profile in a building that overheats. The value of Top is equal to or above Tmax for several hours in the normal working day (data from Tuohy et al, 2009).
Tem
pera
ture
(°C
)
35
30
25
20
15
10
5
0
Top
Tout
Tmax
Tupp
Summer hours: 6 August
Unsatisfactory thermal performance (day)
1 25 49 73 97 121 145
Figure 13 One week of hot summer weather pushes the temperature up in this building so that it fails criterion 2 on two separate days (data from Tuohy et al, 2009).
32
30
28
26
24
22
20
18
Indo
or o
pera
tive
tem
pera
ture
(°C
)
Outdoor running mean temperature (°C)
14 16 18 20 22 24 26
Freq
uenc
y
600
500
400
300
200
100
01 2 3 4 5 6 7
Comfort vote
July – September 2009 July – September 2009
(a) (b)
Figure 14 Results of a comfort survey and temperature monitoring: (a) scatter of the indoor operative temperature against the outdoor running mean air temperature; analysis shows that of the 1105 indoor temperature readings during occupied hours, 40 (3.6%) were above the Category II limit (red); (b) of 1115 comfort votes cast, 155 were for comfort vote warm and 36 as hot. These votes are generally classed as outside the comfort zone giving a proportion of votes for too hot of 17.1%. This level of discomfort could be judged sub-optimal but acceptable (cf Figure 9).
Jam
es J
ohns
on, j
ames
@ho
dkin
sonc
onsu
ltanc
y.co
m, 1
0:00
am 2
2/07
/201
3, 2
, 346
65

16 The limits of thermal comfort: avoiding overheating in European buildings
Figure 15 Two graphs are shown from TM36 (CIBSE, 2005b) with the various limiting values shown against the simulated values for Top in one room of the ‘advanced naturally ventilated office’ for 2020 and 2050. Notice that the values of criteria 1 and 2 are acceptable in 2020 but not in 2050.
Indo
or o
pera
tive
tem
pera
ture
(°C
)
35
33
31
29
27
25
23
21
19
Exceedance for Category II = 16 h (1.3%)0 h over absolute limit (Criterion 3)Weighted exceedance 1 degree hour
Exceedances 2020
Tmax
Crit 3
Top•
5 10 15 20 25 30
Outdoor running mean temperature (°C)
Indo
or o
pera
tive
tem
pera
ture
(°C
)
35
33
31
29
27
25
23
21
19
Exceedance for Category II = 51 h (4.2%)0 h over absolute limit (Criterion 3)Weighted exceedance 80 degree hours
Exceedances 2050
Tmax
Crit 3
Top•
5 10 15 20 25 30
Outdoor running mean temperature (°C)
6.1.4 Measuring overheating in occupied buildings
As a subjective phenomenon, overheating can be best indicated by the observations of building occupants. Questionnaire surveys are a possible approach, but given that the weather outdoors cannot be controlled, it is suggested that the questions should be couched in general terms. The success of this approach is dependent on the familiarity of the occupants with the building in a range of weather conditions, so it should preferably be used only if the occupants are familiar with the building. A question such as ‘Does your room/building overheat regularly in summer?’ can be asked and the results can be examined to see whether complaints of overheating are commonplace. If 20 per cent or more of occupants in any one area report overheating then a problem clearly exists.
Such a survey can also suggest areas of the building that are especially prone to overheating and used to suggest ways in which the problem can be overcome. If the occupants consider the building to be overheating, the methods of overcoming these problems introduced in CIBSE user advice sheets (CIBSE, 2010a/2010b) on overheating and
CIBSE’s KS16: How to Manage Overheating in Buildings (CIBSE, 2010c) are a start. This advice can be taken further by reading CIBSE Guide B (CIBSE, 2005a) and subsequent CIBSE Guides as appropriate. If physical intervention is necessary (e.g. solar shading) the responses of building occupants can be used to gauge appropriate measures. For dwellings see the Zero Carbon Hub pamphlet Overheating in Homes (ZCH, 2012).
6.2 Overheating in mechanically cooled buildings
Buildings that are cooled or heated mechanically can also overheat if the ventilation system is, for example, undersized or poorly controlled. Here BS EN 15251 (BSI, 2007) defines the acceptable indoor conditions according to the PMV index, and overheating is therefore a function not only of temperature but of the humidity, air speed and the clothing and activity of the occupants. The extent of overheating will also be judged according to the PPD, as suggested in Table 3.
James Johnson, jam
, 10:00am 22/07/2013, 2, 34665

References 17
6.2.1 Testing for overheating in mechanically cooled buildings using PMV/ PPD
A mechanically cooled building should aim to provide an indoor environment where the PMV index is near to or equal to zero. According to Table 2, it will be considered as overheating if the value of the PMV index is above 0.5 (PPD ≥ 10%). Many building simulations now include the opportunity to calculate the PMV index and these should be used, particularly where the metabolic rate and clothing insulation are known. If they are not known then an estimate of the metabolic rate and the clothing insulation will be needed. In BS EN 15251 (BSI, 2007) a value of 0.5 clo is used for summer conditions (Table 4). Tables of values of met and clo are available in Parsons (2003) and BS EN ISO 7730 (BSI, 2005) or BS EN ISO 8996 (BSI, 2004) and ISO 9920 (ISO, 2009). The building can be monitored and PMV calculated but this is an expensive process as the six variables all need to be measured with sufficient accuracy.
6.2.2 Testing for overheating in mechanically conditioned buildings using operative temperature
The procedure for testing for overheating in mechanically conditioned buildings (including naturally conditioned
buildings during months when the heating is in use) can follow the general methodology shown in section 6.1.1 but use the maximum temperatures in Table 4, which apply for Category II limits that would give rise to PMV = ±0.5*.
Again, simulation can be used to calculate indoor temperature and the rest of the procedure follows as for free-running buildings.
Table 4 Maximum temperatures for different types of indoor space. Clothing is assumed to be 1.0 clo in winter and 0.5 clo in summer (after BS EN 15251 (BSI, 2007), Table A2)
Type and Assumed met Winter Summer use of space (clo = 1.0) (clo = 0.5) pmv<+0.5 pmv<+0.5
Residential (sedentary) 1.2 25.0 26.0 Residential (active) 1.5 25.0 Offices 1.2 24.0 26.0 Public spaces (auditoria, cafe etc.) ~1.2 24.0 26.0 Classrooms 1.2 24.0 26.0 Kindergarten 1.4 22.5 25.5 Shops 1.6 22.0 25.0
* Where the building is occupied, a more realistic estimate can be made of the actual metabolic rate and clothing insulation of the inhabitants to improve the estimate of pmv. For this calculation assume rh = 50%, air velocity = zero and operative temperature = radiant temperature = air temperature.
CIBSE (2005a) Heating, ventilating, air conditioning and refrigeration CIBSE Guide B (London: Chartered Institution of Building Services Engineers)
CIBSE (2005b) Climate change and the indoor environment: impacts and adaptation CIBSE TM 36 (London: Chartered Institution of Building Services Engineers)
CIBSE (2006) Environmental design CIBSE Guide A (7th edn.) (London: Chartered Institution of Building Services Engineers)
CIBSE (2010a) Keeping Cool in a Heatwave: Top Tips for Facilities Managers CIBSE Heat Wave Briefing 1 (London: Chartered Institution of Building Services Engineers) (available at https://www.cibseknowledgeportal.co.uk/component/dynamicdatabase/?layout=publication&revision_id=80&st= overheating) (accessed June 2013)
CIBSE (2010b) Keeping Cool in a Heatwave: Top Tips for Building Users CIBSE Heat Wave Briefing 1 (London: Chartered Institution of Building Services Engineers) (available at https://www.cibseknowledgeportal.co.uk/component/dynamicdatabase/?layout=publication&revision_id=81&st= overheating) (accessed June 2013)
CIBSE (2010c) How to manage overheating in buildings CIBSE KS16 (London: Chartered Institution of Building Services Engineers)
CIBSE (2013) Environmental design CIBSE Guide A (8th edn.) (London: Chartered Institution of Building Services Engineers) (in preparation; publication expected December 2013)
de Dear RJ and Brager GS (2001) ‘The adaptive model of thermal comfort and energy conservation in the built environment’ International Journal of Biometeorology 45 (2) 100–108
de Dear RJ and Brager GS (2002) ‘Thermal comfort in naturally ventilated buildings: revisions to ASHRAE Standard 55’ Energy and Buildings 34 (6) 549–561
ReferencesArsandrie Y, Kurvers S, Bokel R and van der Linden K (2012 ) ‘Comfort temperatures for the low-income group in a hot-humid climate’ Proc. Conf: The Changing Context of Comfort in an Unpredictable World, Cumberland Lodge, Windsor, 12–15 April, 2012 [online] http://nceub.org.uk (accessed January 2013)
ASHRAE (2010) ANSI/ASHRAE Standard 55-2010: Thermal Environmental Conditions for Human Occupancy (Atlanta, Georgia: American Society of Heating, Refrigerating and Air-Conditioning Engineers)
Baker NV and Standeven MA (1995) ‘A behavioural approach to thermal comfort assessment in Naturally Ventilated Buildings’ Proc. CIBSE National Conference, Eastbourne, 76–84
BSI (1994) BS EN ISO 7243: 1994: Hot environments. Estimation of heat stress on a working man, based on the WBGT–index (wet bulb globe temperature) (London: British Standards Institution)
BSI (2001) BS EN ISO 7726: 2001: Ergonomics of the thermal environment. Instruments for measuring physical quantities (London: British Standards Institution)
BSI (2004) BS EN ISO 8996: 2004: Ergonomics of the thermal environment. Determination of metabolic rate (London: British Standards Institution)
BSI (2005) BS EN ISO 7730: 2005: Ergonomics of the thermal environment. Analytical determination and interpretation of thermal comfort using calculation of the PMV and PPD indices and local thermal comfort criteria (London: British Standards Institution)
BSI (2007) BS EN 15251: 2007: Indoor environmental input parameters for design and assessment of energy performance of buildings addressing indoor air quality, thermal environment, lighting and acoustics (London: British Standards Institution)
Jam
es J
ohns
on, j
ames
@ho
dkin
sonc
onsu
ltanc
y.co
m, 1
0:00
am 2
2/07
/201
3, 2
, 346
65

18 The limits of thermal comfort: avoiding overheating in European buildings
Nicol JF and Humphreys MA (2007) ‘Maximum temperatures in European office buildings to avoid heat discomfort’ Solar Energy 81 (3) 295–304
Nicol JF and Humphreys MA (2010) ‘Derivation of the equations for comfort in free-running buildings in CEN Standard EN 15251’ Buildings and Environment 45 (1) 11–17
Nicol JF, Humphreys MA and Roaf SC (2012) Adaptive Thermal Comfort: Principles and Practice (Oxford: Routledge)
Oseland NA (1994) ‘A comparison of the predicted and reported thermal sensation vote in homes during winter and summer’ Energy and Buildings 21 45–54
Parsons KC (2003) Human Thermal Environments (2nd edition) (Oxford: Blackwell Scientific)
Rijal HB, Tuohy P, Nicol F, Humphreys MA, Samuel A and Clarke J (2007) ‘Development of an adaptive window opening algorithm to predict the thermal comfort, energy use and over heating in buildings’ Journal of Building Performance Simulation 1 (1) 17–30
Tuohy P, Humphreys MA. Nicol F, Rijal H and Clarke J (2009) ‘Occupant behaviour in naturally ventilated and hybrid buildings’ ASHRAE Trans. 115 (1) 16–27
van der Linden AC, Boerstra AC, Raue AK, Kurvers SR and de Dear RJ (2006) ‘Adaptive temperature limits: a new guideline for the Netherlands’ Energy and Buildings 38 (11) 8–17
ZCH (2012) Overheating in Homes: An introduction for planners, designers and property owners (Milton Keynes: Zero Carbon Hub)
Additional sources of informationKeeping Cool in a Heatwave 1: Top Tips for Facilities Managers CIBSE Heat Wave Briefing 1 (London: Chartered Institution of Building Services Engineers) (2010) (available at https://www.cibseknowledgeportal.co.uk/component/dynamicdatabase/?layout=publication&revision_id=80&st= overheating) (accessed June 2013)
Keeping Cool in a Heatwave 2: Top Tips for Building Users (CIBSE Heat Wave Briefing 2 (London: Chartered Institution of Building Services Engineers) (2010) (available at https://www.cibseknowledgeportal.co.uk/component/dynamicdatabase/?layout=publication&revision_id=81&st= overheating) (accessed June 2013)
Leeman A and Bordass W ‘Probe 15: Productivity — the killer variables’ Building Services J. E19–E21 June 1998 (available at http://www.cibse.org/content/Ed/PROBE/Productivity%20-%20the%20killer%20variables.pdf) (accessed June 2013)
EEBPP (2000) Energy use in offices Energy Consumption Guide 19 (London: Energy Efficiency Best Practice Programme)
Fanger PO (1970) Thermal Comfort (Copenhagen: Danish Technical Press)
French LJ, Camilleri MT, Isaacs NP and Pollard AR (2006) ‘Winter temperatures in New Zealand houses’ Proc. Conf: Comfort and Energy Use in Buildings: Getting Them Right, Cumberland Lodge, Windsor, 27–30 April 2006
Gagge AP, Stolwiik J and Nishi Y (1970) ‘An effective temperature scale based on a simple model of human physiological regulatory response’ ASHRAE Transactions 70 (1) 247–260
Gómez-Azpeitia GG, Bojórquez-Morales RP, Ruiz I, Marincic E, González E, Tejeda A (2012) ‘Extreme adaptation to extreme environments: case study of hot dry, hot sub-humid, and hot humid climates in Mexico’ Proc. Conf: The Changing Context of Comfort in an Unpredictable World, Cumberland Lodge, Windsor, 12–15 April, 2012 [online] http://nceub.org.uk (accessed January 2013)
HSE (no date) Wet bulb globe temperature index (Bootle: Health and Safety Executive) [online] http://www.hse.gov.uk/temperature/heatstress/measuring/wetbulb.htm (accessed June 2013)
Humphreys MA (1976) ‘Field studies of thermal comfort compared and applied’ Journal of Institution of Heating and Ventilating Engineers 44 (1976) 5–27
Humphreys MA (1978) ‘Outdoor temperatures and comfort indoors’ Building Research and Practice (J. CIB) 6 (2) 92–105
Humphreys MA (1979) ‘The influence of season and ambient temperature on human clothing behaviour’ in Fanger PO and Valbjorn O (eds.) Indoor Climate 699–713 (Copenhagen: Danish Building Research)
Humphreys MA, Rijal HB and Nicol JF (2013) ‘Updating the adaptive relationship between climate and comfort indoor; new insights and an extended database’ Building and Environment 63 40–55
ISO (2009) ISO 9920: 2009: Ergonomics of the thermal environment. Estimation of the thermal insulation and evaporative resistance of a clothing ensemble (Geneva: International Standards Organization)
Leaman AJ and Bordass WT (1997) Productivity in Buildings: The ‘Killer’ Variables (London: Workplace Comfort Forum)
McIntyre DA (1980) Indoor Climate (London: Applied Science Publishers)
Nicol JF (2004) ‘Adaptive thermal comfort standards in the hot-humid tropics’ Energy and Buildings 36 (7) 628–637
Nicol JF and Humphreys MA (1973) ‘Thermal comfort as part of a self-regulating system’ Building Research and Practice (J. CIB) 1 (3) 174–179
James Johnson, jam
, 10:00am 22/07/2013, 2, 34665