Normative Analysis and Statistical Treatment/Validity of the Likert Scale
Reproduced with permission of the copyright owner. Further reproduction prohibited without permission.
The Likert scale revisited: An alternate versionGerald AlbaumMarket Research Society. Journal of the Market Research Society; Apr 1997; 39, 2; ABI/INFORM Globalpg. 331
A I b a u m: The I~ ike r t sea 1 ere v 1 S 1 ted: a n a I t ern ate ve r <; ion
The Likert scale revisited: an alternate version
Gerald Albaum University of Oregon
Gerald Albawn
This study examined the effect of alternative scale formats on reporting of intensity of attitudes on Likert scales of agreement. A standard one-stage format and an alternate two-stage format were tested in three separate studies on samples of university students in three countries. In general, the two-stage format generated the greatest percentage of extreme-position (Le. most intense) responses across scales. A test of predictive ability showed that the two-stage format was a better predictor of product preferences. Underlying data structures did not differ much between the two.
The Likert scale revisited: an alternate version Marketing researchers have available for their use in measuring attitudes or components of attitudes a number of different types of scales or scale formats, including the semantic differential, Stapel scale, Likert scale, Thurstone differential scale, and direct rating scales. One of the most widely used formats is the Likert scale.
The purpose of this article is to examine the Likert scale in terms of its ability to detect the intensity of feeling that respondents have about their attitudes. An alternative format is proposed and tested against the standard approach.
Nature of the Likert scale Attitude is a complex thing. Recent theoretical models of attitudes suggest that there are two dimensions - direction (e.g. a positive or negative predisposition toward an object) and strength (Petty & Krosnick in press; Raden 1985). For example, a person may like or dislike a product and may hold this attitude with a varying degree of strength or intensity - interpreted as either confidence, certainty, accessibility or conviction (Berger & Alwin 1996). Abelson (1988) distinguishes between firmly held attitudes and those that are more superficial by utilising the idea of attitude conviction. Berger & Alwin (1996) propose that conviction is a subjective component of an attitude which gauges the extent to which the attitude is 'owned' or firmly held and reflects the functions the attitude
331

Reproduced with permission of the copyright owner. Further reproduction prohibited without permission.
J~)urnal (If (he .rV1.arket Research Society Volume 34 Number 2 Apr1) 1997
serves. Our concern in this paper is with the extent to which an attitude is firmly held. Consequently, we equate conviction with strength and intensity.
When a Likert scale is used to measure attitude, its usual or standard format consists of a series of statements to which a respondent is to indicate a degree of agreement or disagreement using the following options: strongly agree, agree, neither agree nor disagree, disagree, strongly disagree. As such the scale purports to measure direction (by 'agree/disagree') and intensity (by 'strongly' or not) of attitude. The scale, per se, was intended as a summated scale, which was then assumed to have interval scale properties (Likert 1932). This 1evel-ofmeasurement characteristic together with ease of administration and response explains its popularity in marketing research applications. The individual scale is not assumed to be intervally measured although it usually is treated as such. In practice, the scale is often used by researchers in marketing as individual scale items or as a summated scale based on a small number of scale items (as few as two or three).
According to Tourangeau (1984; 1992) with some attitude questions a person must compute an evaluative judgement whereas with others such a judgement is simply retrieved. The form of the attitude question may also influence whether a respondent employs one process or the other. A Likert-type item, because it requires a person to rate extent of agreement, may encourage the retrieval and integration of more detailed information from memory than do items calling for a simple evaluation. In a real sense we can view an opinion as a verbal expression of an attitude which means that opinions are the means we have for measuring attitudes.
The standard Likert scale tends to confound the direction and intensity dimensions of attitude so there may be an under-reporting of the most intense agreement or disagreement (i.e. the extreme position of the scale). When looking at extreme positions, we are dealing with the furthermost categories of the response set alternatives and not extremeness in amount of direction. In the Likert scheme the furthermost categories represent the most intensity of response. In an analysis-of-variance context the standard Likert scale measures directly the interaction and indirectly, the main effects of direction and intensity. In short, main effects are inferred from the interaction measure.
An alternative way of presenting the Likert scale is as a two-stage scale (Mager & Kluge 1987). The first stage asks whether there is agreement or disagreement with the statement. The second stage then asks how strongly the person fe:els about the answer provided in the first stage. In a more general sense, the split question technique has been called 'unfolding' and has been used in telephone surveys as an alternative to the use of 'show cards' in face-to-face interviews (Groves 1979; Groves & Kahn 1979; Miller 1984; Sykes & Collins 1988). The end result of this split question process for the Likert scale is that the direction dimension of attitude is being addressed by the first stage and the intensity (or strength) dimension is measured directly by the second stage. Interaction effects can then be measured. This process comes closer to the usual ANOVA approach. In addition, Berger & Alwitt (1996) present evidence that
332
Reproduced with permission of the copyright owner. Further reproduction prohibited without permission.
Albaum: The Liker[ scale revisited: an <llternatc vcrs ion
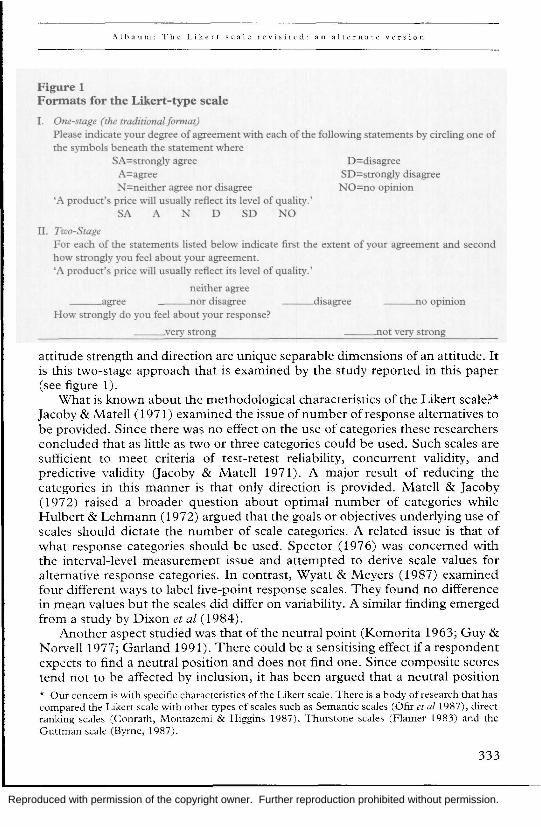
Figure 1 Fonnats for the Likert-type scale
1. One-stage (the traditional format) Please indicate your degree of agreement with each of the following statements by circling one of the symbols beneath the statement where
SA=strongly agree A=agree N=neither agree nor disagree
'A product's price will usually reflect its level of quality.' SA AND SD NO
II. Two-Stage
D=disagree SD=strongly disagree NO=no opinion
For each of the statements listed below indicate first the extent of your agreement and second how strongly you feel about your agreement. 'A product's price will usually reflect its level of quality. '
neither agree ___ agree ~or djsagree ___ disagree ~oopinion
How strongly do you feel about your response?
___ very strong ~ot very strong
attitude strength and direction are unique separable dimensions of an attitude. It is this two-stage approach that is examined by the study reported in this paper (see figure 1).
What is known about the methodological characteristics of the Likert scale?* Jacoby & Matell (1971) examined the issue of number of response alternatives to be provided. Since there was no effect on the use of categories these researchers concluded that as little as two or three categories could be used. Such scales are sufficient to meet criteria of test-retest reliability, concurrent validity, and predictive validity Oacoby & Matell 1971). A major result of reducing the categories in this manner is that only direction is provided. Matell & Jacoby (1972) raised a broader question about optimal number of categories while Hulbert & Lehmann (1972) argued that the goals or objectives underlying use of scales should dictate the number of scale categories. A related issue is that of what response categories should be used. Spector (1976) was concerned with the interval-level measurement issue and attempted to derive scale values for alternative response categories. In contrast, Wyatt & Meyers (1987) examined four different \vays to label five-point response scales. They found no difference in mean values but the scales did differ on variability. A similar finding emerged from a study by Dixon et at (1984).
Another aspect studied was that of the neutral point (Komorita 1963; Guy & Norvell 1977; Garland 1991). There could be a sensitising effect if a respondent expects to find a neutral position and does not find one. Since composite scores tend not to be affected by inclusion, it has been argued that a neutral position * Our concern is with specific characteristics of the Likert scalc. Thcre is a body of research that has compared the Likert scale with other types of scales such as Semantic scales (Ofir el aiI987), direct ranking scales (Conrath, Montazemi & Higgins 1987), Thurstone scales (Flamer 1983) and the Guttman scale (Byrne, 1987).
333
Reproduced with permission of the copyright owner. Further reproduction prohibited without permission.
J () U r Il a 1 () f the ,\1 ark e t Res ear c h Soc i c t V Vol II m c 3 9 K u m b erA p r ill 9 9 7
should always be provided. In another study, Armstrong (1987) compared different ways to express the midpoint - undecided or neutral. Analysis showed differences were negligible and little if any erosion of score appeared to result. A neutral position is one that is neither agree nor disagree, and does not include the categories 'don't know' and 'no opinion.'
As with any scale and scale format there is concern for systematic errors, one type of which is form-related (Bardo, Yeager & Klingsporn 1982; Bardo & Yeager 1982; Phelps et al1986; Greenleaf 1992b). Form-related errors concern psychological orientation towards responding to different item formats and include the following types:
• Leniency: tendency to rate something too high or too low (i.e. rate in an extreme way). • Central tendency: reluctance to give extreme scores. • Proxim.ity: give similar responses to items that occur close to one another.
The present study will allow for an appraisal of whether the form-related potential errors might be 'generic' for the Likert scale and Likert-type data.
Directly related to the present study is the issue of direction and extremeness. Indeed, a question can be raised as to whether there is a difference between extremeness and intensity in using a Likert scale. Converse & Presser (1986) have argued that the Likert scale confounds extremity (a dimension of attitudinal position) with intensity (how strongly a position is felt). Although intensity and extremity may frequently covary, a person may hold an extreme position with little feeling, or have a middle of the road position with considerable passion; without separate questions for positions and intensity it is difficult, if ever possible, to separate these dimensions. Peabody (1962) has argued that there are both theoretical and practical reasons for considering the components of direction and extremeness (i.e. intensity) separately. Their research did not deal specifically with the Likert scale. Similarly, Compeau & Franke (1990) explored direction and intensity in the broader category rating scale. Both sets of researchers agree that composite scores (e.g. that from a Likert scale) do not reflect the intensity dimension well, and separating the direction and intensity components may allow the researcher to explain more variance than the composite score where the two dimensions are combined. Furthermore, separating the components may assist the researcher in interpreting how the respondents used the measure (Compeau & Franke 1990). Applying the technique to dual scaling - an approach to correspondence analysis - has been suggested as a way to separate intensity and direction (Compeau & Franke 1990; Franke 1985). The present paper presents another approach.* It must be remembered that in the Likert Scale format extremity and positions on the scale measure intensity of feeling about direction and not amount of direction. Amount of direction in attitude has to be captured by the statement itself. * On a more generallcvcl, Greenleaf (l992a) proposes a method for creating, validating and scoring extreme re"ponse style measures,
334
Reproduced with permission of the copyright owner. Further reproduction prohibited without permission.
Albaum: The Likert ~calc revIsIted: an alternate vcrS-Ion
More recent research dealing specifically with the Likert scale and Likerttype data involves adaptive survey designs based on a graded-response Latent Trait Theory model (Singh, Howell & Rhoads 1990). Operating like an expert system, an adaptive survey design adapts the questions asked to each respondent based upon responses to previous questions. In short, an adaptive survey asks different questions of different respondents, but is able to estimate all respondents' locations, along the same attitude continuum. Because Likert-type data provide much information, a smaller number of items may be used for a design based on the graded-response model than for other survey designs using the scale. These researchers suggest efficiencies of the magnitude of 33% compared with conventional survey designs (Singh, Howell & Rhoads 1990, p. 320). Finally, Russell & Bobko (1992) examined how characteristics of a Likert-type scale affected the power of moderated regression analysis. The response scale was not a true Likert-scale as the categories were of motivation towards some future behaviour not categories of agreement with statements.
As mentioned earlier, the present study looks primarily at the issue of confounding of attitude components and the reporting of intensity (or extreme positions available) by the scale. It is hypothesised that the standard one-stage Likert scale tends to under-report the most intense position (thus, enhancing central leniency errors), compared with a two-stage format. The specific hypothesis was suggested by the results of a small exploratory study of these alternative scale formats for the Likert scale (Albaum & Murphy 1988). In most cases, a two-stage approach generated a greater percentage of most intense position values than did standard and modified one-stage versions.
Method Three distinct studies were conducted to generate the data needed to test the overall hypothesis. Each study was set up as a simple experiment using a completely randomised design. Two treatment levels were used as shown previously in figure 1. Data were collected in different countries at different time periods over several months.
The topic of Study 1 was economic systems. Separate convenience samples of business students were drawn from two different universities in the United States (N1=64, N n =97), one university in New Zealand (N=121), and one university in Denmark (N=98). The sample in Denmark consisted of part-time students, each of whom is employed full time. This study was done in three countries to explore whether each scale type tends to be culture-bound (an emic) or culture-free (an etic). Independent of the absolute values that emerge, the Likert scale will possess etic properties as a scale type if results of one-stage and two-stage comparison are similar within each country.
The Likert-scale instrument for the United States sample included 11 statements about capitalism and different economic systems. For both the Denmark and New Zealand samples, two additional statements were added giving a total of 13 statements. These two statements were added because ofthe interest in them by associates in the countries who assisted in data collection.
335

Reproduced with permission of the copyright owner. Further reproduction prohibited without permission.
Jourr. al of the i'viarket Research Society Volume 19 Number April 1997
One statement dealt with communism and resource allocation efficiency; the other statement was about size of firm and private enterprise as capitalism. For the most part, the final measurement instruments were the same in each country. The instrument used in Denmark was presented to respondents in Danish after two rounds of translation and back translation.
To remove doubt that might arise about a topic/scale-format interaction Study 2 was designed around a topic that is quite different from that used in Study 1. The overall topic of Study 2 was alienation. A convenience sample of 176 students in New Zealand responded to a set of 37 statements about consumer alienation from the marketplace (Allison 1978). As in Study 1, a completely randomised experimental design with two treatment levels (onestage and two-stage Likert scales) was used in Study 2.
The results of the first two studies were such that a third study was needed to assess which of the formats was 'best'. Study 3 was designed around the topic of consumer ethnocentrism. A sample of 50 students in the United States responded to the 17 statements that comprise the CETSCALE (Shimp & Sharma 1987). This scale is designed to measure consumers' ethnocentric tendencies related to purchasing foreign- versus American-made products. Although originally developed and validated with samples of US consumers only, other research has shown that the CETSCALE is a reliable measure across other countries and affords some evidence of validity as well (Netemeyer, Durvasula & Lichtenstein 1991). In addition to the CETSCALE items, a question was included asking for preferences regarding purchasing nine consumer durable products ranging from electronics to athletic shoes. A ninecategory scale was used, anchored with 'American-made' and 'foreign-made.' As in the previous two studies, a completely randomised experimental design with two treatment levels was used in Study 3.
Results For all three studies responses to the one-stage and two-stage Likert scales were compared at the level of the individual scale. Although the Likert Scale is supposed to be used as a summated scale, it often is not used that way by academic and practitioner marketing researchers. Individual scale item scores are used for analysis, as are average scale values for the scales comprising a construct. In addition, many reported summated scores consist of as few as two or three scale items. As we pointed out earlier there is evidence in the literature that composite scores do not reflect the intensity dimension well. On a more practical level, there are times when researchers are interested in groups - such as market segments - having intense beliefs about an object of concern. Often, this is best picked up at the individual scale level. The two-stage version was scored to be comparable with the one-stage version. That is, a respondent who answered the first stage with 'agree' or 'disagree' and the second stage with 'not very strong' was scored the same as one who indicated 'agree' or 'disagree' to the one-stage version. Similarly, a respondent who answered the second stage with 'very strong' was scored the same as one who answered 'strongly agree' or
336
Reproduced w
ith permission of the copyright ow
ner. Further reproduction prohibited w
ithout permission.
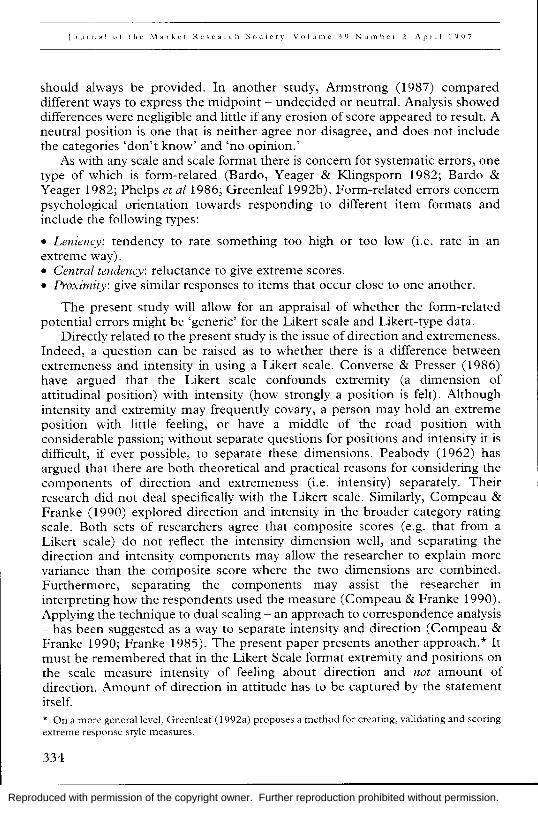
Table 1 Extreme responses to economic systems, attitude statements, I :<-United States samples*
(Percent of respondents) US-ll US-J
Strongly Strongly Slrongly Strongly I .., disagree agree dLwgree agree
One- Two- One- Two- One- Two- One- Two-
AltilUde slatement slage" slage'> p stage" Slageb p Slage" staged p slage" slage" p I r-<
The United States should move towards socialism 43.0% 54.7% .10 2.2% 6.7% .16 40.6% 53.1% .15 3.1% 9.4% .14 ;:
The private enterprise system is best for small business firms rather than big business finns 10.6 26.3 .01 2.1 18.4 .01 12.9 34.4 .01 0.0 15.6 .01
The private enterprise economic system is synonymous with small business 4.3 27.0 .01 3.2 12.2 .02 12.9 41.9 .01 0.0 6.5 .04
In order to achieve economic growth environmental laws should be relaxed 38.1 79.5 .01 0.0 3.6 .07 25.0 84.4 .01 0.0 6 .3 .04
Capitalism does not encourage small business 31.9 67.5 38.7 .01 I
"-.01 2.1 5.0 .30 61.3 0.0 3.2 .15
Big business operates best within a framework ~
~
of capitalism rather than private enterprise 6.0 9.9 .31 2.4 31.0 .01 3.7 11.5 .10 3.7 15.4 .03
The economic system of capitalism is synonymous with big business 2.2 6.4 .15 2.2 34.6 .01 6.7 29.0 .01 3.3 12.9 .05
Capitalism is socially equitable 9.7 36.0 .01 1.1 12.0 .01 13.8 35.5 .01 0.0 6.5 .04
Socialism leads to high living standards 28.7 54.5 .01 0.0 5.2 .03 38.7 61.3 .01 0.0 9.7 .01
Capitalism and private enterprise are different economic systems 8.8 30.3 .01 0.0 7.9 .01 6.9 23.1 .01 3.4 11.5 .08
Government should guarantee a good standard of living 8 .3 40.2 .01 5 .2 30.5 .01 21.9 46.9 .01 3 .1 9.4 .14
*Excludes 'don't know', and 'no opinion'. aN = 49 bN = 48 eN = 32 <iN = 32
v:> v:> -J

Reproduced w
ith permission of the copyright ow
ner. Further reproduction prohibited w
ithout permission.
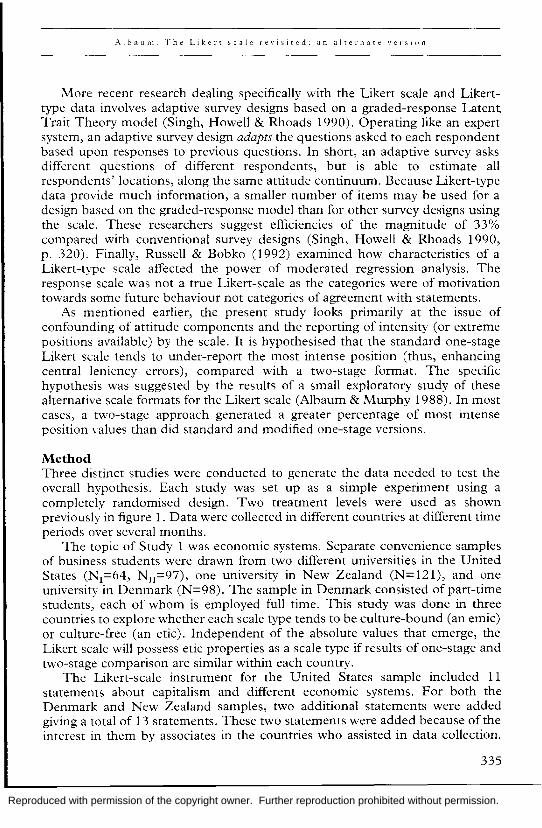
\.N \.N Table 2 Extrem.e responses to econOlnic system.s, attitude statem.ents, 00
Denm.ark and New Zealand* (percent of respondents)
Denmark New Zealand Strongly Strongly Strongly Strongly disagree agree disagree agree
One- Twa- One- Twa- One- Twa- One- Two-Attitude statement stage" stageb p stage" stage" p stage" Stage" p stage" stage" p ;T
Denmark (New Zealand) should ;: move towards socialism 6.1% 2.0% .15 69.4% 81.6% .05 3.5% 4.9% .59 33.3% 59.0% .01 The private enterprise system is best for small ;;. business firms rather than big business firms 0.0 18.6 .01 14.0 23.3 .10 0.0 13.6 .01 5.2 18.6 .01 The private enterprise economic system is ;>::
n
synonymous with small business 11.6 27.9 .0 1 9.3 30.2 .01 1.7 17.9 .01 6.9 19.6 .01 In order to achieve economic growth environmental laws should be relaxed 0.0 8.3 .01 30.6 70.8 .01 0.0 0.0 1.0 33.9 71.4 .01
I :T
Capitalism does not encourage small business 2.1 2.2 .97 56.3 71.7 .03 3.3 6.6 .26 16.7 50.8 .01 v.
Big business operates best within a framework of capitalism rather than private enterprise 0.0 12.2 .01 2.4 26.8 .01 1.9 16.0 .01 0.0 10.0 .01 The economic system of capitalism is I: synonymous with big business 0.0 19.6 .01 19.1 43.5 .01 3.4 15.8 .01 1.7 7.0 .05 Capitalism is socially equitable 0.0 13.3 .01 8.9 26.7 .01 3.4 15.3 .01 15.5 25.4 .06 Socialism leads to high living standards 0.0 4.2 .04 59.6 64.6 .48 0.0 1.8 .24 25.9 47.4 .01 Capitalism and private enterprise are ~
different economic systems 2.3 9.1 .04 16.3 54.5 .01 0.0 9.3 .01 7.1 35.2 .01 0
z Communism is efficient in allocating resources 2.1 4.3 .38 55.3 74.5 .01 0.0 11.5 .01 29.8 50.8 .01 3
0'
Government should guarantee a good standard of living 2.0 28.3 .01 10.2 28.3 .01 3.4 30.2 .01 5.1 27.0 .01 Private enterprise is a most suitable economic I » system for different -sized business firms than is capitalism 0.0 5.7 .02 5.6 2.9 .35 0.0 18.4 .01 0.0 6.1 .01
*Excludes 'don't know', and 'no opinion'. aN = 49 bN = 49 eN = 60 dN = 61 I "
Reproduced with permission of the copyright owner. Further reproduction prohibited without permission.
A I b 3. U m' r h e L i k t' r r sea l ~' r t' \ ' i s i t c d: a n a 1 t er n a t t' \' e r s i n n
'strongly disagree ' to the one-stage version. The analysis was of most intense (i.e. extreme scale position), values only, i.e. 'strongly agree' and ' strongly disagree'.
For Study 1 the absolute values of the proportion of subjects in each sample who responded 'strongly agree' or 'strongly disagree' varied across scales and samples, as shown in tables 1 and 2. For both United States samples and that in New Zealand, on an absolute basis without exception there were a greater number of extreme position (most intense) responses (agree and disagree) from the twostage format. Another possible type of analysis would be to compute mean values for each version and then test for significant differences using the Student t test. Mean values tend to 'hide' differences such as those for extreme intensity values . In fact, for Study I the number of differences within three of the four sample groups were within chance expectations based on the binomial distribution. Similar results emerged for the Mann-Whitney nonparametic test for distribution. Our concern is with a scale format's ability to detect people with extreme intensity responses. In Denmark, there were only two instances, one each for 'agree' and 'disagree', where the one-stage generated a greater response frequency than did the two-stage format.
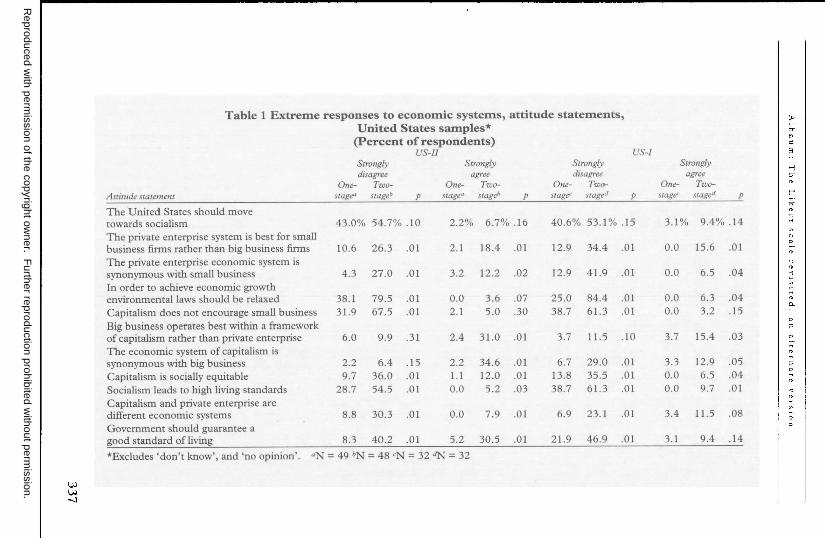
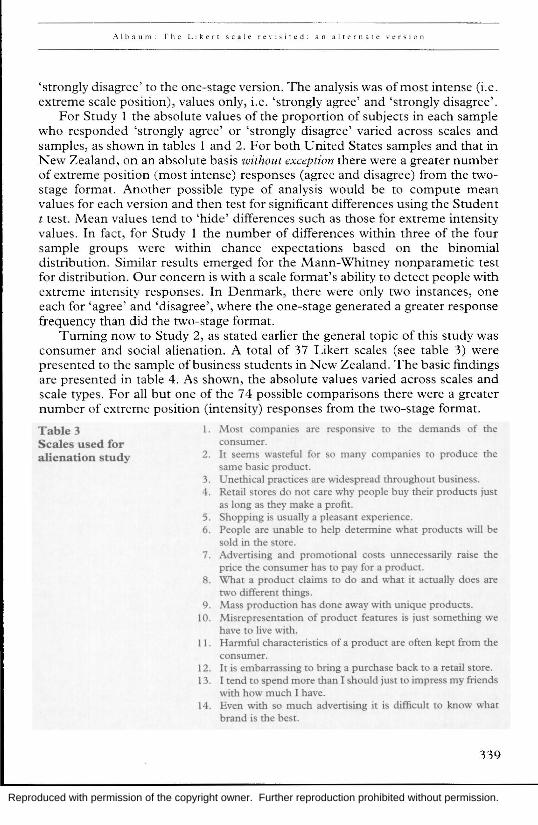
Turning now to Study 2, as stated earlier the general topic of this study was consumer and social alienation. A total of 37 Likert scales (see table 3) were presented to the sample of business students in New Zealand. The basic findings are presented in table 4. As shown, the absolute values varied across scales and scale types. For all but one of the 74 possible comparisons there were a greater number of extreme position (intensity) responses from the two-stage format.
Table 3 Scales used for alienation study
1. Most companies are responsive to the demands of the consumer.
2. It seems wasteful for so many companies to produce the same basic product.
3. Unethical practices are widespread throughout business. 4. Retail stores do not care why people buy their products just
as long as they make a profit. 5. Shopping is usually a pleasant experience. 6. People are unable to help determine what products will be
sold in the store. 7 . Advertising and promotional costs unnecessarily raise the
price the consumer has to pay for a product. 8. What a product claims to do and what it actually does are
two different things. 9. Mass production has done away with unique products.
10. Misrepresentation of product features is just something we have to live with.
11. Harmful characteristics of a product are often kept from the consumer.
12. It is embarrassing to bring a purchase back to a retail store. 13. I tend to spend more than I should just to impress my friends
with how much I have. 14. Even with so much advertising it is difficult to know what
brand is the best.
339

Reproduced with permission of the copyright owner. Further reproduction prohibited without permission.
J 0 u r II a 1 0 f the 1\1 ark c t Res ear c h S () C i c t y Vol U ill C 3 q N u m b c r April 1997
15. A sale is not really a bargain but a way to draw people into a retail store.
16. It is difficult to identify with current trends and fads in fashion.
17. I often feel guilty for buying so many unnecessary products. 18. Most brands are the same with just different names and
labels. 19. A product will usually break down as soon as the warranty is
up. 20. Business is responsible for unnecessarily depleting our
natural resources. 21. It is difficult to identify with business practices today. 22. One must be willing to tolerate poor service from most retail
stores. 23. It is difficult to know what store has the best buy. 24. Business's prime objective is to make money rather than
satisfy the consumer. 25 . I often feel frustrated when I fail to find what I want in the
store. 26. After making a purchase I often find myself wondering 'why.' 27. It is hard to understand why some brands are rwice as
expensive as others. 28. It is not unusual to find out that business had lied to the
public. 29. Buying beyond one's means is justifiable through the use of
credit. 30. It is often difficult to understand the real meaning of most
advertisements. 31. Products are designed to wear out long before they should. 32. Most claims of product quality are true. 33. I am often dissatisfied with a recent purchase. 34. The wide variety of competing products makes intelligent
buying decisions more difficult. 35. Advertisements usually present a true picture of the product. 36 . A product'S price will usually reflect its level of quality. 37. What other people think will often influence what I buy.
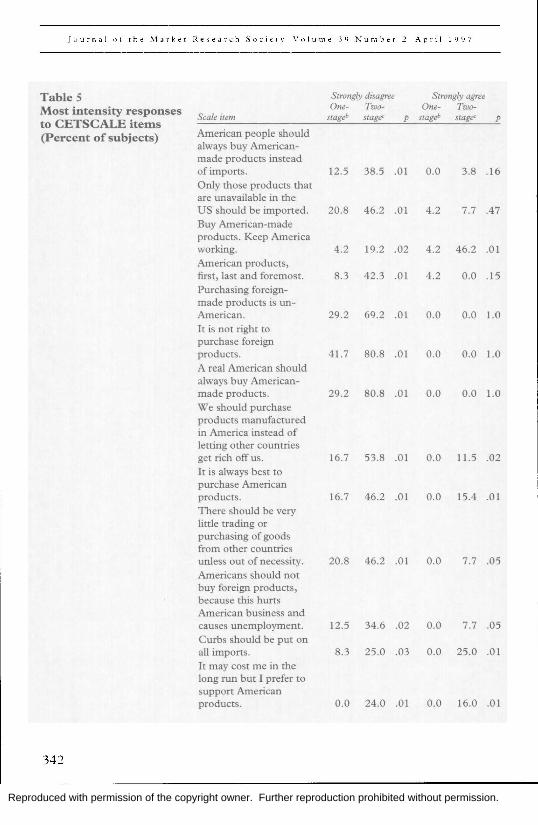
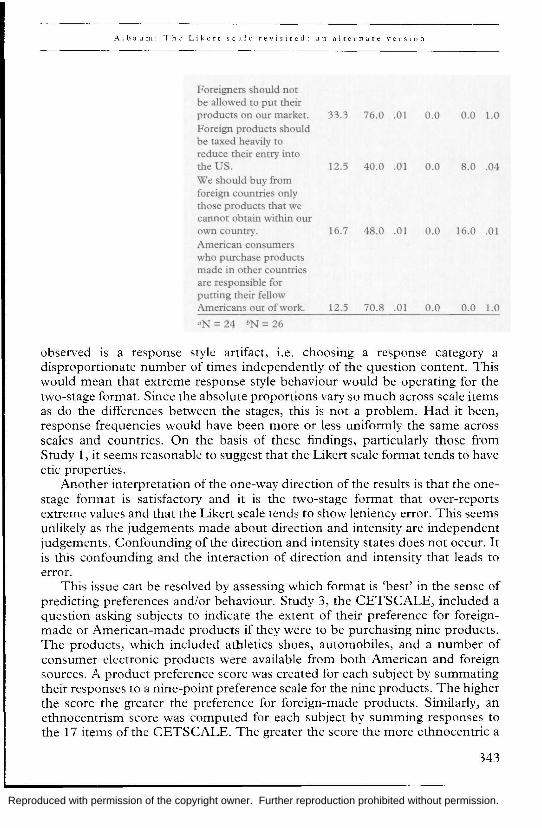
For Study 3 the absolute values of the proportion of subjects who responded 'strongly disagree' varied widely across scales, as shown in table 5. Similar variation occurred for subjects responding 'strongly agree' in the two-stage treatment condition. However, there was little variation for 'strongly agree' in the one-stage condition. Of the 34 possible comparisons there was only one where the one-stage version elicited a greater extreme intensity response than did the two-stage format.
Discussion and conclusions On the basis of the three studies reported in this paper an overwhelming conclusion is that the two-stage Likert scale elicited greater extreme position values than did the one-stage format. Although not all proportion differences were statistically significant the vast majority were at p <.05 and the number far
340

Reproduced with permission of the copyright owner. Further reproduction prohibited without permission.
Albaum: The Likert scale revisited: an alternate verSion
Table 4 Scrmtgly disagree Scrongly agree
ExtreIne responses to One- Two- One- Two-Scale" stage" stage< p stage" Stage< p
alienation scales (Percent of respondents) I. 7.8 20.6 .01 4.9 12.3 .02
2. 22.3 50.7 .0 1 3.9 6 .9 .22 3. 3.9 5.5 .48 19.4 34 .2 .01 4. 2.9 8.2 .03 13.6 41.1 .01 5. 6.8 19.2 .01 8.7 27.4 .01 6. 13.6 28.8 .01 3.9 15.1 .01 7. 12.6 30.1 .01 4.9 15.1 .01 8. 1.9 8.2 .01 10.7 21.9 .01 9. 12.6 26.0 .01 9.7 11.0 .69
10. 21.4 56.1 .01 5.8 11.0 .08 II. 2.9 5.5 .23 12.6 42.5 .01 12. 25 .2 32.9 .11 7 .8 19.2 .01 13. 40.8 60.3 .01 1.9 4.1 .23 14. 3.9 1.4 .15 18 .4 50.7 .0 1 15. 2 .9 4.1 .55 27.2 49.3 .01 16. 5.8 28.8 .01 2.9 8.2 .03 17. 14.6 19.2 .25 3.9 12.3 .01 18. 6.8 12.3 .08 4.8 24.7 .01 19. 12.6 26.0 .01 1.9 13.7 .01 20. 13.6 32.9 .01 3.9 11.0 .02 2l. 7.8 26.0 .01 2.9 4 .1 .54 22. 40.8 71.2 .01 1.9 13.7 .01 23. 3.9 9.6 .04 11.6 34.2 .01 24. 6.8 11.0 .17 16.5 34.2 .01 25. 1.0 26.2 .01 26.2 67.1 .01 26. 15.5 30.1 .01 2.9 11.0 .01 27. 9.7 15.1 .13 10.7 37 .0 .0 1 28. 4.8 6 .8 .43 7.8 26.0 .01 29. 33.0 52.0 .01 1.9 11.0 .01 30. 9.7 28.8 .01 5.8 11.0 .08 31. 4.8 11.0 .03 10.7 24.7 .01 32. 10.7 20.5 .02 1.0 9.6 .01 33. 5.8 23.2 .01 2.9 9.6 .01 34. 10.7 13.7 .39 5.8 27.4 .01 35. 13.6 27.4 .01 0.0 1.4 .1 2 36. 13.6 20.5 .09 3.9 24.7 .01 37. 9.7 13.7 .25 1.9 15.1 .01
aSee table 3 bN=103 cN=73
exceeded chance binomial probabilities. In light of this finding, it appears that Likert scales as generally used tend to underestimate the extreme positions held by people, and that a central tenden(v forms-related error exists. Perhaps when faced with the standard one-stage format respondents are reluctant to express an extreme position even though they have it. The two-stage would give them the flexibility to express their true opinions. It is always possible that what has been
341
Reproduced with permission of the copyright owner. Further reproduction prohibited without permission.
J 0 U r 11 a I t) f the :\1 ark e t Res e d r (: h Soc i e t y V t) I u m e 3 q K u m b e r April 1997
Table 5 Strongly dIsagree Strongly agree
Most intensity responses One- Two- One- Two-Scale item stage'> stage< p stage'> stage< p
to CETSCALE items (Percent of subjects) American people should
always buy American-made products instead of imports. 12.5 38.5 .01 0.0 3.8 .16 Only those products that are unavailable in the US should be imported. 20.8 46.2 .01 4.2 7.7 .47 Buy American-made products. Keep America working. 4.2 19.2 .02 4.2 46.2 .01 American products, first, last and foremost. 8.3 42.3 .01 4.2 0.0 .15 Purchasing foreign-made products is un-American. 29 .2 69.2 .01 0.0 0.0 1.0 It is not right to purchase foreign products. 41.7 80.8 .01 0.0 0.0 1.0 A real American should always buy American-made products. 29.2 80.8 .0 1 0.0 0.0 1.0 We should purchase products manufactured in America instead of letting other countries get rich off us. 16.7 53.8 .01 0.0 11.5 .02 It is always best to purchase American products. 16.7 46 .2 .01 0.0 15.4 .01 There should be very lirtle trading or purchasing of goods from other countries unless out of necessity. 20.8 46 .2 .01 0.0 7 .7 .05 Americans should not buy foreign products, because this hurts American business and causes unemployment. 12.5 34.6 .02 0.0 7.7 .05 Curbs should be put on all imports. 8.3 25.0 .03 0.0 25.0 .01 It may cost me in the long run but I prefer to
support American products. 0.0 24.0 .01 0.0 16.0 .01
342
Reproduced with permission of the copyright owner. Further reproduction prohibited without permission.
Albaum The Likert scale revisited: an alternate version
Foreigners should not be allowed to put their products on our market. 33.3 76.0 .01 0 .0 0.0 1.0 Foreign products should be taxed heavily to reduce their entry into the US. 12.5 40.0 .01 0 .0 8.0 .04 We should buy from foreign countries only those products that we cannot obtain within our own country. 16.7 48.0 .01 0.0 16.0 .01 American consumers who purchase products made in other countries are responsible for putting their fellow Americans out of work. 12 .5 70.8 .01 0.0 0 .0 1.0
aN = 24 bN = 26
observed is a response style artifact, i.e. choosing a response category a disproportionate number of times independently of the question content. This would mean that extreme response style behaviour would be operating for the two-stage format. Since the absolute proportions vary so much across scale items as do the differences between the stages, this is not a problem. Had it been, response frequencies would have been more or less uniformly the same across scales and countries. On the basis of these findings, particularly those from Study 1, it seems reasonable to suggest that the Likert scale format tends to have etic properties.
Another interpretation of the one-way direction of the results is that the onestage format is satisfactory and it is the two-stage format that over-reports extreme values and that the Likert scale tends to show leniency error. This seems unlikely as the judgements made about direction and intensity are independent judgements. Confounding of the direction and intensity states does not occur. It is this confounding and the interaction of direction and intensity that leads to error.
This issue can be resolved by assessing which format is 'best' in the sense of predicting preferences and/or behaviour. Study 3, the CETSCALE, included a question asking subjects to indicate the extent of their preference for foreignmade or American-made products if they were to be purchasing nine products. The products, which included athletics shoes, automobiles, and a number of consumer electronic products were available from both American and foreign sources. A product preference score was created for each subject by summating their responses to a nine-point preference scale for the nine products. The higher the score the greater the preference for foreign-made products. Similarly, an ethnocentrism score was computed for each subject by summing responses to the 17 items of the CETSCALE. The greater the score the more ethnocentric a
343
Reproduced with permission of the copyright owner. Further reproduction prohibited without permission.
JourLal of the .\larket Research Society Volume 3C) Number April 1997
person is. Correlations were run between ethnocentrism and preference scores with the following results:
One-stage: r =-.02 Two-stage: R=-.55
For the reduced version of the CETSCALE (only 10 items used), the correlations are:
One-stage: r =-.21 Two-stage: R=-.70
All correlations are in the expected direction as there should be a negative relationship between CETSCALE score and preference as scored. It is quite clear that the two-stage format was a better predictor in Study 3.
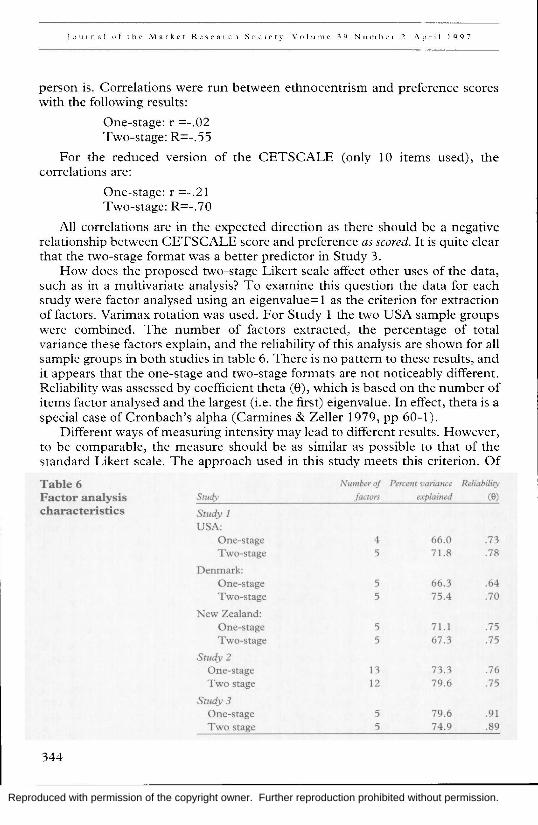
How does the proposed two-stage Likert scale affect other uses of the data, such as in a multivariate analysis? To examine this question the data for each study were factor analysed using an eigenvalue= 1 as the criterion for extraction of factors. Varimax rotation was used. For Study 1 the two USA sample groups were combined. The number of factors extracted, the percentage of total variance these factors explain, and the reliability of this analysis are shown for all sample groups in both studies in table 6. There is no pattern to these results, and it appears that the one-stage and two-stage formats are not noticeably different. Reliability was assessed by coefficient theta (8), which is based on the number of items factor analysed and the largest (i.e. the first) eigenvalue. In effect, theta is a special case of Cronbach's alpha (Carmines & Zeller 1979, pp 60-1).
Different ways of measuring intensity may lead to different results. However, to be comparable, the measure should be as similar as possible to that of the standard Likert scale. The approach used in this study meets this criterion. Of
Table 6 Number oj Perce1ll variance Reliability
Factor analysis Study jactors explained (e)
characteristics Study 1 USA:
One-stage 4 66.0 .73 Two-stage 5 71.8 .78
Denmark: One-stage 5 66.3 .64 Two-stage 5 75 .4 .70
New Zealand: One-stage 5 71.1 .75 Two-stage 5 67.3 .75
Study 2 One-stage l3 73.3 .76 Two stage 12 79.6 .75
Study 3 One-stage 5 79.6 .91 Two stage 5 74.9 .89
344

Reproduced with permission of the copyright owner. Further reproduction prohibited without permission.
Alballm: Th~ Lik('rt ~cale rC\'isltcd: an alternate ver')ion
course, it may be that the two-stage format measures extremeness of direction not intensity. This is an issue brought up by Converse & Presser (1986), who argue that extremity is confounded with intensity, and that extremity is a dimension of attitudinal position. This issue applies to the standard Likert scale as well. However, the wording used in the two-stage format would suggest that an intensity of attitude was being provided. In contrast, it is possible that respondents could interpret the confounded categories in the one-stage format (strongly agree, agree, etc.) as amounts of agreement. This would mean that 'strongly agree' and 'strongly disagree' were measuring extremeness of direction, not intensity.
This study has been limited in that students were used as experimental subjects. There are no inherent reasons why students should react differently from the different formats than other groups. Consequently, in order to assess more accurately whether the scaling methods are etic- or emic-bound, further research using non-students, more countries and different topics would seem to be in order.
The data in this study suggest that the two-stage format is a better predictor of preferences. In addition, we have issued a warning that researchers need to be aware that reporting extreme positions on a Likert scale can vary by scale format. The next step would seem to be testing the two-stage format on actual behaviour. This would represent a so-called 'building-block' approach to research. As such then the present study represents a foundation of the knowledge-building process, albeit a major foundation. The study also raises questions about whether the phenomenon observed exists for other scale formats as well, such as the semantic differential and rating scales in general.
One inherent characteristic of the two-stage approach to Likert-scale use is that the length ofthe measurement instrument will be increased, leading perhaps to greater costs in implementing research projects. Respondents may have to commit more time to responding. This is most likely to be true for surveys using mail questionnaires. For personal interview surveys it mayor may not be true. For a telephone interview, we suggest that it would be easier for an interviewer to use the two-stage Likert format. Indeed, as we mentioned earlier two-stage questioning (i.e. unfolding) is used in telephone surveys for various types of question and scale formats. Studies that have compared one-stage and two-stage versions of telephone interviewing have been inconclusive regarding differences between the two. This is probably due in part to the fact that the studies were not comparable in that different types of questions and formats were studied. It is interesting to note, however, that in one of the experiments conducted by Sykes & Collins (1988), the average response to 10 Likert scales showed that the unfolded version generated a greater response percentage in the two 'strongly' categories than did the standard one-step version. However, the main justification for using the two-stage, rather than the one-stage, format is that for those whose major interest is in most intense (i.e. extreme position) views the two-stage provides higher data quality! After all, is it not data quality that should be guiding researchers?
345

Reproduced with permission of the copyright owner. Further reproduction prohibited without permission.
J n urn a I 0 f the .\1 a :- k e t Res ear c h Soc jet y V 0 I u m c 3 9 N u m b c r April 1997
The author thanks Jesper Strandskov, Aarhus School of Business (Denmark) and Brian Murphy, Auckland Institute of Studies (New Zealand) for their assistance in data collection. The comments made by Paul Green, Wharton School, Frank Carmone, Wright State University, Robert Peterson, t;niversity ,)fTexas at Austin, and the anonymous referee are greatly appreciated.
References ABELSON, ROBERT P. (1988). Conviction. American Psychologist, 43, 4, pp 267-75. ALBAU,\l, GERALD & MURPHY, BRIA:-.r D. (1988). Extreme response on a Likert scale. Psychological Reports, 63, pp 501-2. ALLISON, NEIL K. (1978). A psychometric development of a test for consumer alienation from the marketplace. Journal of !vlarketing Research, 15, pp 565-75. ARMSTRONG, R. L. (1987). The midpoint on a five-point Likert-type scale. Perceptual and Motor Skills, 64, pp 359-62. BARDO, J. W. & YEAGER, S. J. (1982). Consistency of response style across types of response formats. Perceptual and Motor Skills, 55, 1, pp 307-10. BARDO, J. W., YEAGER, S. J. & KUNGSPORN, M. J. (1982). Preliminary assessment of format-specific central tendency and leniency error in summated rating scales. Perceptual and Motor Skills, 54, 1, pp 227-34. BERGER, IDA E. & ALw1TT, LINDA F. (1996). Attitude conviction: a measure of strength and functlon. Unpublished paper. BYRKE, BARBARA M. (1987). Multitrait-multimethod analyses of three self-concept scales: testing equivalencies of construct validity across ability. Paper presented at the annual meeting of the American Educational Research Association. CARMINES, EDWARD G. & ZELLER, RICHARD A. (1979). Reliability and validity assessment. Beverly Hills, CA: Sage Publications. COMPEAU, L. D. & FRANKE, G. R. (1990). Isolating and quantifying the intensity dimension of category rating scales. Proceedings of the Annual Educators' Conference of the Amen'can Marketing Association, pp 293-98. CONRATH, D. W., MONTAZEMI, A. R. & HIGGINS, c. R. (1987). Evaluating information in ill-structured decision environments. Jounzal of the Operational Research Society, 38, pp 375-85. CO:-.rvERSE, JEAN & PRESSER, STANLEY (1986). Survey questions. Beverly Hills, CA: Sage Publications. DIXON, PAGL N. et al. (1984). Response differences and preferences for all-categorydefined and end-defined Likert formats. Educational and Psychological 1l1easurement, 44, pp 61-6. FL..v.1ER, STEPHEN (1983). Assessment of the multitrait-multimethod matrix validity of Likert scales via confirmatory factor analysis. !vlultivariate Behavior Research, 18, pp 275-308. FRfu"l"KE, G. R. (1985). Evaluating measures through data quantification: applying dual scaling to an advertising copy test. Journal of Business Research, 13, pp 61-9. GARLAND, Ro:-.r (1991). The mid-point on a rating scale: is it desirable? Marketing Bulletin, 2, pp 66-70. GREENLEAF, ERIC (1992a). Measuring extreme response style. Public Opinion Quarterly, 56, Summer, pp 328-51. GREENLEAF, ERIC (1992b). Improving rating scale measures by detecting and correcting bias components in some response styles. Journal of Marketing Research, 29, May, pp 176-88.
346

Reproduced with permission of the copyright owner. Further reproduction prohibited without permission.
:\Ibaum The Likert "calc revIsited: an alternate version
GROVES, ROBERT M. (1979). Actors and questions in telephone and personal interview surveys. Public Opinion Quarterly, 43, pp 190-205. GROVES, ROBERT M. & K'\H:-.!, ROBERT L. (1979). Surveys by telephone: a national comparison with personal interviews. New York: Academic Press. GGY, REBECCA F. & NORVELL, MELISSA (1977). The neutral point on a Likert scale. 17Je Jounzal of Psychology, 95, pp 199-204. HULBERT, JA,\1ES & LEH,'vlANK, DOKALD R. (1972). Are three-point Likert scales always good enough? Jounzal of Marketing Research, 9, pp 444-6. JACOBY, JACOB & MATELL, MICHAEL S. (1971). Three-point Likert scales are good enough. Jounzal of l'vIarketing Research, 8, pp 495-506. KOMORITA, S. S. (1963). Attitude content, intensity, and the neutral point on a Likert scale. Jounzal of Social Psychology, 61, pp 327-34. LIKERT, RENSIS (1932). A technique for the measurement of attitudes. Archives of Psychology, 140, pp 44-53. MAGER, JOHN & KLCGE, E. ALAN (1987). One-stage versus two-stage attitude measurement: separating the dimensions of direction and intensity. Paper presented at the Academy of Marketing Science World Marketing Congress, Barcelona, Spain. MATELL, MICHAEL S. & JACOBY, JACOB (1972). Is there an optimal number of alternatives for Likert-scale items? Jounzal of Applied Psychology, 56, pp 506-9. MILLER, PETER V. (1984). Alternative question forms for attitude scale questions in telephone interviews. Public Opinion Quarterly, 48, pp 766-78. NETEMEYER, R. G., DURVASULA, S. & LrCHTE:-.!STEIN, D. R. (1991). A cross-national assessment of the reliability and validity of the CETSCALE. Jounzal of Marketing Research, 28, August, pp 320-7. OFIR, CHEZY et al (1987). Are semantic response scales equivalent? Multivariate Behavior Research, 22, pp 21-38. PEABODY, D. (1962). Two components in bipolar scales: direction and intensity. Psychological Review, 69, pp 65-73. PETTY, RICHARD E. & KROSNICK, JON A. (in press). Attitude strength: antecedents and consequences. Hillside, NJ: LEA. PHELPS, LEADELLE et al (1986). The effects of halo and leniency on co-operating teacher reports using Likert-type rating scales. Jounzal of Educational Research, 79, Jan-Feb, pp 151-4. R,\DEN, DAVID (1960). Strength related attitude dimensions. Social Psychology Quarterly, 48, pp 312-30. RUSSELL, CRAIG J. & BOBKO, PHILIP (1992). Moderated regression analysis and Likert scale: too coarse for comfort. Jounzal of Applied Psychology, 77, 3, pp 336-42. SHIMP, T. A. & SHARc'v1A, S. (1987). Consumer ethnocentrism: construction and validation of the CETSCALE. Jounzal of Marketing Research, 24, August, pp 280-9. SINGH, JAGDlP, HOWELL, Roy D. & RHOADS, GARY K. (1990). Adaptive designs for Likert-type data: an approach for implementing marketing surveys. Jounzal of Marketing Research, 27, pp 304-21. SPECTOR, PACL E. (1976). Choosing response categories for summated rating scales. Jounzal of Applied Psychology, 61, pp 374-5. SYKES, WENDY & COLLINS, MARTIN (1988). Effects of mode of interview: experiments in the UK. In R. Groves et al. (Eds.), Telephone survey methodology. New York: Academic Press.
347
Reproduced with permission of the copyright owner. Further reproduction prohibited without permission.
Journal of [he _rvtarket Re::.earch Society Volume 39 Kumber April 1997
TOURANGEAC, ROGER (1984). Cognitive sciences and survey methods. In T. B. Jabine, M. L. Straf, J. 1'v1. Tanur & R. Tourangeau (Eds.), Cognitive aspects of survey methodology: building a bridge between disciplines. Washington, DC: National Academy Press, pp 73-100. TOURANGEAU, ROGER (1992). Context effects on responses to attitude questions: attitudes or memory structures. In N. Schwarz and S. Sudman (Eds), Context effects in social and psychological research. New York: Springer-Verlag, pp 35-47. WYATT,RA:"\fDALL C. & MEYERS, LAWRENCE S. (1987). Psychometric properties offour 5-point Likert-type response scales. Educational and Psychological lVleasurement, 47, pp 27-35.
348