The level of cAMP-dependent protein kinase A activity strongly affects osmotolerance...
17
The level of cAMP-dependent protein kinase A activity strongly affects osmotolerance and osmo-instigated gene expression changes in Saccharomyces cerevisiae JOAKIM NORBECK* AND ANDERS BLOMBERG Department of Cell and Molecular Biology, Lundberg Laboratory, Go ¨teborg University, Medicinaregatan 9C, SE-41390 Go ¨teborg, Sweden The influence of cAMP-dependent protein kinase (PKA) on protein expression during exponential growth under osmotic stress was studied by two-dimensional polyacrylamide gel electrophoresis (2D–PAGE). The responses of isogenic strains (tpk2Dtpk3D) with either constitutively low (tpk1 w1 ), regulated (TPK1) or constitutively high (TPK1bcy1D) PKA activity were compared. The activity of cAMP-dependent protein kinase (PKA) was shown to be a major determinant of osmotic shock tolerance. Proteins with increased expression during growth under sodium chloride stress could be grouped into three classes with respect to PKA activity, with the glycerol metabolic proteins GPD1, GPP2 and DAK1 standing out as independent of PKA. The other osmotically induced proteins displayed a variable dependence on PKA activity; fully PKA-dependent genes were TPS1 and GCY1, partly PKA-dependent genes were ENO1, TDH1, ALD3 and CTT1. The proteins repressed by osmotic stress also fell into distinct classes of PKA-dependency. Ymr116c was PKA-independent, while Pgi1p, Sam1p, Gdh1p and Vma1p were fully PKA-dependent. Hxk2p, Pdc1p, Ssb1p, Met6p, Atp2p and Hsp60p displayed a partially PKA-dependent repression. The promotors of all induced PKA-dependent genes have STRE sites in their promotors suggestive of a mechanism acting via Msn2/4p. The mechanisms governing the expression of the other classes are unknown. From the protein expression data we conclude that a low PKA activity causes a protein expression resembling that of osmotically stressed cells, and furthermore makes cells tolerant to this type of stress. Copyright # 2000 John Wiley & Sons, Ltd. KEY WORDS — cAMP-dependent protein kinase; osmotic stress; protein expression; yeast INTRODUCTION It is well established that the response of yeast to saline stress involves an increased production and retention of glycerol as a compatible solute, as well as an increased active out-transport of sodium ions (Blomberg and Adler, 1993; Hohmann, 1997). The increased glycerol produc- tion is mediated by the induction of the two enzymes, GPD1 (Albertyn et al., 1994; Larsson et al., 1993) and GPP2 (Norbeck et al., 1996), while the increased glycerol retention is partly due to closing of the glycerol facilitator, Fps1p (Luyten et al., 1995). Increased sodium efflux is brought about mainly by induced expression of the Ena1p sodium ATPase (Haro et al., 1991). The expression of several other genes is reportedly upregulated by salt, e.g. ALD2, DDR48, CTT1, DAK1, HSP12 and the genes involved in treha- lose metabolism (Akhtar et al., 1997; Hirayama et al., 1995; Miralles and Serrano, 1995; Schu ¨ ller et al., 1994; Varela et al., 1995; Winderickx et al., 1996). However, the available data mainly deals with induction of gene expression during the period of adaption to osmotic stress, during which a large number of genes change their expression with a high magnitude and with *Correspondence to: J. Norbeck, Department of Cell and Molecular Biology, Lundberg Laboratory, Go ¨ teborg Univer- sity, Medicinaregatan 9C, SE-41390 Go ¨ teborg, Sweden. E-mail: [email protected] YEAST Yeast 2000; 16: 121–137. Received 14 June 1999 Accepted 27 September 1999 CCC 0749-503X/2000/020121–17$17.50 Copyright # 2000 John Wiley & Sons, Ltd.
Transcript of The level of cAMP-dependent protein kinase A activity strongly affects osmotolerance...

The level of cAMP-dependent protein kinase Aactivity strongly affects osmotolerance andosmo-instigated gene expression changes inSaccharomyces cerevisiae
JOAKIM NORBECK* AND ANDERS BLOMBERG
Department of Cell and Molecular Biology, Lundberg Laboratory, GoÈteborg University, Medicinaregatan 9C,SE-41390 GoÈteborg, Sweden
The in¯uence of cAMP-dependent protein kinase (PKA) on protein expression during exponential growth underosmotic stress was studied by two-dimensional polyacrylamide gel electrophoresis (2D±PAGE). The responses ofisogenic strains (tpk2Dtpk3D) with either constitutively low (tpk1w1), regulated (TPK1) or constitutively high(TPK1bcy1D) PKA activity were compared. The activity of cAMP-dependent protein kinase (PKA) was shownto be a major determinant of osmotic shock tolerance. Proteins with increased expression during growth undersodium chloride stress could be grouped into three classes with respect to PKA activity, with the glycerolmetabolic proteins GPD1, GPP2 and DAK1 standing out as independent of PKA. The other osmoticallyinduced proteins displayed a variable dependence on PKA activity; fully PKA-dependent genes were TPS1 andGCY1, partly PKA-dependent genes were ENO1, TDH1, ALD3 and CTT1. The proteins repressed by osmoticstress also fell into distinct classes of PKA-dependency. Ymr116c was PKA-independent, while Pgi1p, Sam1p,Gdh1p and Vma1p were fully PKA-dependent. Hxk2p, Pdc1p, Ssb1p, Met6p, Atp2p and Hsp60p displayed apartially PKA-dependent repression. The promotors of all induced PKA-dependent genes have STRE sites intheir promotors suggestive of a mechanism acting via Msn2/4p. The mechanisms governing the expression of theother classes are unknown. From the protein expression data we conclude that a low PKA activity causes aprotein expression resembling that of osmotically stressed cells, and furthermore makes cells tolerant to this typeof stress. Copyright # 2000 John Wiley & Sons, Ltd.
KEY WORDS Ð cAMP-dependent protein kinase; osmotic stress; protein expression; yeast
INTRODUCTION
It is well established that the response of yeastto saline stress involves an increased productionand retention of glycerol as a compatible solute,as well as an increased active out-transportof sodium ions (Blomberg and Adler, 1993;Hohmann, 1997). The increased glycerol produc-tion is mediated by the induction of the twoenzymes, GPD1 (Albertyn et al., 1994; Larssonet al., 1993) and GPP2 (Norbeck et al., 1996),
while the increased glycerol retention is partly dueto closing of the glycerol facilitator, Fps1p(Luyten et al., 1995). Increased sodium ef¯ux isbrought about mainly by induced expression ofthe Ena1p sodium ATPase (Haro et al., 1991).The expression of several other genes is reportedlyupregulated by salt, e.g. ALD2, DDR48, CTT1,DAK1, HSP12 and the genes involved in treha-lose metabolism (Akhtar et al., 1997; Hirayamaet al., 1995; Miralles and Serrano, 1995; SchuÈ lleret al., 1994; Varela et al., 1995; Winderickx et al.,1996). However, the available data mainly dealswith induction of gene expression during theperiod of adaption to osmotic stress, duringwhich a large number of genes change theirexpression with a high magnitude and with
*Correspondence to: J. Norbeck, Department of Cell andMolecular Biology, Lundberg Laboratory, GoÈteborg Univer-sity, Medicinaregatan 9C, SE-41390 GoÈteborg, Sweden.E-mail: [email protected]
YEAST
Yeast 2000; 16: 121±137.
Received 14 June 1999Accepted 27 September 1999
CCC 0749-503X/2000/020121±17$17.50Copyright # 2000 John Wiley & Sons, Ltd.

varying temporal patterns (Blomberg, 1995). Incontrast, fully adapted growing cells display asmaller number of proteins with induced expres-sion (Norbeck and Blomberg, 1996, 1997a).Repression of protein expression was alsoreported, both during growth under osmoticstress, e.g. for several glycolytic and ethanol-producing proteins and many biosyntheticenzymes (Norbeck and Blomberg, 1997a), andduring the period of adaptation following theaddition of salt (Blomberg, 1995).
A number of osmostress-related cellular fea-tures appear strain-dependent. There was a strik-ing dissimilarity in the protein response of strainsSKQ2n and Y41 to growth under osmotic stress;while strain SKQ2n displayed a large number ofexpression changes, strain Y41 had only a few(Norbeck et al., 1996; Norbeck and Blomberg,1997a). A further difference was also found instudies of tolerance to osmotic shock, where strainY41 was more sensitive and displayed a lowerosmotic hypersensitivity threshold as comparedto other common laboratory strains (Blomberg,1997). It was also evident that, while strain X2180-1A cultured on a carbon source other than glucosewas highly tolerant to osmotic shock, thisincrease in tolerance was much lower in strainY41, indicating a strain-dependent in¯uence ofnutrient status on osmotolerance. The moleculardeterminant(s) causing this strain-related osmoticresponse is not known.
The RAS±cAMP pathway and its target,cAMP-dependent protein kinase (PKA), is aregulatory pathway which has been suggested tohave a role in coordinating responses to nutrientstatus and various forms of stress (e.g. Thevelein,1994). The central messenger molecule in this pathis cyclic AMP (cAMP), which is produced fromATP by the regulated action of adenylate cyclase.The most important target of cAMP is PKA,which consists of a regulatory subunit homodimer,encoded by BCY1, and of a heterodimer kinasesubunit, encoded by TPK1, TPK2 and TPK3(Toda et al., 1987a, 1987b). Binding of cAMP toBcy1p releases the regulatory subunit from thePKA complex, thereby increasing kinase activity.A constitutively high PKA activity, as found in astrain bearing a deletion in the BCY1 gene, causesa severe decrease in tolerance to heat andstarvation stress (Toda et al., 1987a). Conversely,an adenylate cyclase mutant, with low PKAactivity, was highly stress-tolerant (Iida, 1988).The PKA pathway thus seems to have a strong
negative in¯uence on the response to most typesof stress and is, in fact, the only good candidateto date for a common denominator for thevarious yeast stress responses (Siderius andMager, 1997).
At the CTT1 promotor, induction by variousforms of stress has been shown to be mediated bythe stress-responsive element (STRE) and thisstress response via STRE is strongly counteractedby high activity of PKA (Marchler et al., 1993).This is most likely due to the fact that the nuclearlocalization of the STRE-binding transcriptionfactors Msn2p and Msn4p (Martinez-Pastor et al.,1996) is negatively affected by high PKA activity(GoÈrner et al., 1998). Many of the proteins whoseexpression is induced during adaption to osmoticstress are strongly affected by the osmosensingHOG pathway (Akhtar et al., 1997; Brewsteret al., 1993), which transmits signals from twoputative plasma membrane-localized osmosensors(Maeda et al., 1995, 1994). The HOG pathwayhas, furthermore, been shown to act via STRE(SchuÈ ller et al., 1994) and overexpression ofPBS2, the MAPKK of the HOG pathway, cansupress stress-sensitive mutants with a constitu-tively active RAS±cAMP pathway (Boguslawski,1992). Taken together, available data stronglysuggest a major involvement of PKA in deter-mining the level of salinity regulation ofgene expression. The level of cAMP in yeasthas indeed been reported to decrease followingosmotic stress (MaÂrquez and Serrano, 1996),which implies a salinity-imposed reduction ofPKA activity. However, even in a msn2/4 pbs2triple deletion mutant there was still osmoticinduction of a STRE-driven promotor (Martinez-Pastor et al., 1996), albeit to a drastically reduceddegree, indicating the existence of osmosensingpathways in addition to the HOG pathway inyeast.
In the present study we have elucidated thein¯uence of PKA activity on the expression ofproteins identi®ed as responsive to growth underosmotic stress (Norbeck and Blomberg, 1997a). Astrong in¯uence of PKA activity was found formost salt-regulated proteins, the genes encodingproteins involved in glycerol metabolism being astriking exception. PKA activity was accordinglyalso found to be a major determinant of toleranceto osmotic shock. The implications of these data inrelation to strain-dependent effects on osmostress-related phenomena is discussed.
122 J. NORBECK AND A. BLOMBERG
Copyright # 2000 John Wiley & Sons, Ltd. Yeast 2000; 16: 121±137.

MATERIALS AND METHODS
Strains, growth conditions, radioactive labellingand preparation of cell extracts
All strains (Table 1) were grown at 30uC inYNB medium (Yeast Nitrogen Base withoutamino acids and ammonium sulphate; Difco,MI) with 20 g/l of glucose and 5 g/l of ammoniumsulphate, supplemented with 120 mg/ml of theappropriate amino acids. 1 M NaCl was addedwhere indicated. Growth conditions, labelling,harvest and preparation of protein extracts wasperformed as described previously (Blomberget al., 1995). Brie¯y, 10 ml of cell culture wasinoculated to an OD610 of 0.1, corresponding to acell density of 1 million cells/ml, and grown at ashaker speed of 110 rpm for more than twogenerations to an OD610 of approximately 0.5,at which time 150 mCi of 35S methionine wasadded to the culture. Cells were harvested after30 min and protein was extracted for running ontwo-dimensional polyacrylamide gel electrophor-esis (2D±PAGE). Following labelling, growth ofthe cultures proceeded, in all cases, for at least onegeneration before growth arrested (data notshown).
2D±PAGE, protein visualization and analysisof gels
The 2D±PAGE gels were run as previouslydescribed (Norbeck and Blomberg, 1997b). Driedgels were exposed to phospho-imager plates andimage ®les were processed on a Pentium PCrunning the PDQuest program (Protein Data-bases Inc.), which was also used for comparisonof gels, as previously described (Blomberg et al.,1995).
Osmotic hypersensitivity plating assay
At an OD610 of approximately 0.4, aliquotswere withdrawn from the same cultures that weresubsequently radioactively labelled and analysedfor protein expression changes by 2D±PAGE.10 ml droplets from a dilution series, in MilliQwater (Millipore Inc), were tested for survival ofosmotic stress by plating on a series of YPDmedium plates (yeast extract, 10 g/l; peptone,20 g/l; glucose, 20 g/l; and bacteriological agar,20 g/l) with a range of salinities up to 1.8 M NaCl,as described previously (Blomberg, 1997).
Northern analysis
Cells from 50 ml cultures in 300 ml ¯asks, withYNB medium as described above, were har-vested at an OD610 of 0.5. Total RNA wassubsequently extracted and analysis of transcriptlevels was performed as described previously,with the same ACT1 probe being utilized(Eriksson et al., 1995). The GPP2 and GCY1probes were identical to the ones previously used(Norbeck and Blomberg, 1997a). The oligonu-cleotide probe for detection of the ALD2/YMR170c mRNA had the following sequence:5k-GCA CCT TTG TCA AAC TTA TCA GCG-3k; the probe for ALD3/YMR169c was asfollows: 5k-TCA CCC ATA TTG AAC TTGTCG ACC-3k, with both probes being comple-mentary to the region of low sequence homologybetween nucleotides 402 and 425 in the respec-tive open reading frame. Quanti®cation ofbands was performed on images produced bya Phospho-imager (Molecular Dynamics 425E)utilizing the manufacturer-supplied program,Image Quant.
Table 1. Strains of S. cerevisiae used in this study.
Strain Genotype
SKQ2na MATa/a adel/+ +/ade2 +/his1FY1679b MATa/a ura3-52/ura3-53 +/leu2-1 +/trp1-63 +/his3-200W303-1Ac MATa, ura3-1, leu2-3,112, trp1-1, his3-11,15, ade2-1, can1-100SP1d MATa leu2 his3 trp1 ura3 ade1 can1S18-1Dd MATa his3 leu2 ura3 trp1 ade8 TPK1wl tpk2D::HIS3 tpk3D::TrP1S7-7Ad MATa his3 leu2 ura3 trp1 ade8 tpk2D::HIS3 tpk3D::TRP1S13-3Ad MATa his3 leu2 ura3 trp1 ade8 tpk2D::HIS3 tpk3D::TRP1 bcylD::LEU2
aATCC 44827.bWinston et al. (1995). Strain kindly supplied by Dr P. Sunnerhagen.cHaploid yJN009-1A (Norbeck et al., 1999b) is isogenic with w303-1A.dCameron et al. (1988). Strain kindly supplied by Dr J. Winderickx, Leuven, Belgium.
PKA ACTIVITY AFFECTS YEAST GENE EXPRESSION AND OSMOTOLERANCE 123
Copyright # 2000 John Wiley & Sons, Ltd. Yeast 2000; 16: 121±137.
Search for transcription factor binding sites
A region spanning 1000 bp upstream of the startcodon, from all the salt-regulated genes, wassearched for the presence of binding sites ofknown transcription factors from S. cerevisiae,using the MatInspector 2.2 program (http://transfac.gbf-braunschweig.de/cgi-bin/matSearch/matsearch.pl) using Transfac v3.5 matrices.
RESULTS
Novel identi®cations of salt-induced proteins
In a previous paper, proteins whose expressionwas more than three-fold changed during steady-state growth of strain SKQ2n at high salinitieswere identi®ed by quantitative 2D±PAGE analy-sis, and most responding proteins were linked to agene by microsequencing (Norbeck and Blomberg,1997a). This search for proteins that are regulatedby osmotic stress in strain SKQ2n was hereextended to include recently identi®ed proteinswith more alkaline pI values, utilizing a non-linearwide range (pH 3±10) immobilized pH gradient inthe ®rst dimension separation (Norbeck andBlomberg, 1997b).
The most striking novel response in the pI>6.5range was the induction of Tdh1p, encoded by anisogene of glyceraldehyde 3-phosphate dehydro-genase, which in strain SKQ2n increased roughly50-fold during growth in 1.4 M NaCl. The degreeof Tdh1p induction in strain W303-1A wasroughly seven-fold, the lower factorial increasemainly being due to a somewhat higher basal levelof expression (Figure 1). For none of the otherroughly 300 proteins resolved in the pH 6.5±10range did expression change by a factor of morethan three-fold.
An unidenti®ed 53 kDa protein with a pI of 5.7was reported as one of the most highly inducedproteins during growth of strain SKQ in 1.4 M
NaCl (Norbeck and Blomberg, 1997a). A similarresponse on the expression of this protein duringgrowth in saline medium was also found in strainW303-1A (Figure 1). Of further interest is that thisprotein was reported as strictly HOG pathway-dependent in its response during adaptation to anosmotic shock (Akhtar et al., 1997). This proteinwas recently unequivocally linked to the ALD3(YMR169c) gene through the use of mass spectro-metric analysis of tryptic peptides (Norbeck et al.,1999a). Since ALD2 (YMR170c), not ALD3, waspreviously reported as induced by osmotic stress
(Miralles and Serrano, 1995), we decided tocon®rm our observation at the protein level by acomparison of the salt-induced expression at thetranscript level of ALD2 and ALD3. To be ableto exclude a strain-dependent salinity-regulatedexpression of the two genes, this analysis wasperformed with different strains (SKQ2n, FY1679and W303-1A). All strains exhibited inducedexpression of ALD3, also on the transcript level,during growth under osmotic stress (Figure 2).The ALD2 transcript, on the other hand, was in allcases recorded as a weak signal, not affected byosmotic stress (data not shown). We therefore
Figure 1. Expression of Ald3p, Tdh1p and Tps1p. Quantita-tive values were taken from 2D±PAGE gels of protein extractsfrom cells exponentially growing in YNB medium with glucoseas carbon and energy source, either without addition of NaCl(light bars) or with addition of NaCl to 1.4 M NaCl (darkbars). Protein values are given for the two strains w303-1A andSKQ2n. Units are given as ppm of total protein and normal-ized for methionine content. Error bars indicate standarddeviation (n=2).
124 J. NORBECK AND A. BLOMBERG
Copyright # 2000 John Wiley & Sons, Ltd. Yeast 2000; 16: 121±137.

conclude that ALD3 and not ALD2 is theosmoregulated form of the two isogenes.
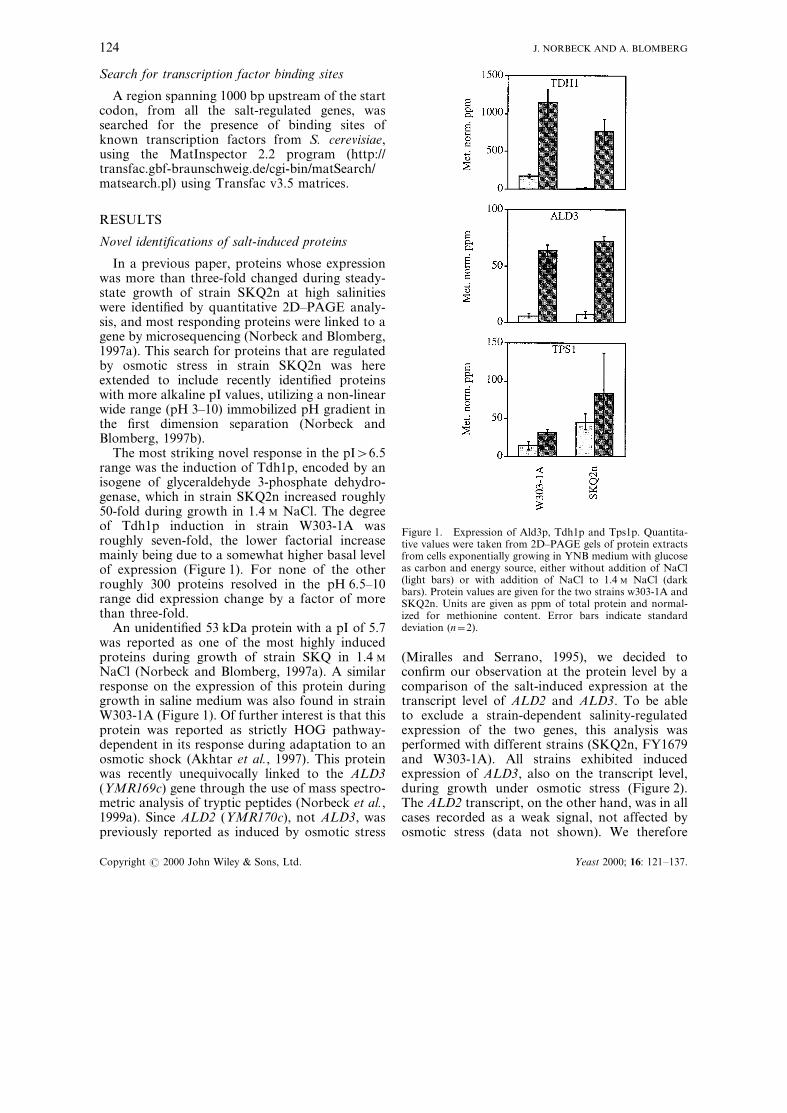
One additional protein, Tps1p (trehalose phos-phate synthase), has been included in the presentanalysis. The position and identity of Tps1p(Figure 3) was taken from gel matching toprevious identi®cations on 2D gels (Boy-Marcotteet al., 1998; Garrels et al., 1997; Godon et al.,1998). The corresponding protein spot (p51.3/5.7)was strongly induced during adaptation to osmo-tic stress in a partly PBS2-dependent manner(Akhtar et al., 1997), but less than three-fold
during steady-state growth of strain SKQ2n in1.4 M NaCl (Norbeck and Blomberg, 1997a).However, both in strain W303-1A and in strainSKQ2n there was a roughly two-fold induction ofthis protein during growth in 1.4 M NaCl(Figure 1).
In the pH 3±10 immobilized system, the proteinspot corresponding to Gpp2p partially overlappedwith the neighbouring spot. Furthermore, nospot corresponding to the salt-induced putativeglycerol dehydrogenase, GCY1 (Norbeck andBlomberg, 1997a), has yet been identi®ed. Wetherefore studied the expression of GPP2 andGCY1 at the level of mRNA (see below).
Taken together, combined 2D±PAGE andNorthern analysis allowed simultaneous study ofthe expression of nine salt-induced genes. Thepresent study also deals with the 11 genespreviously identi®ed as showing repressed expres-sion during growth under osmotic stress (Norbeckand Blomberg, 1997a).
In¯uence of PKA activity and salt on generationtime and survival of osmotic shock
In the present study we have investigatedwhether the strain-dependent differences in pro-tein expression during steady-state growth underosmotic stress (Norbeck and Blomberg, 1996,1997a) might be explained by differences in PKAactivity. For this purpose we used a set of threemutants with different levels of PKA activity(Table 1). All these three strains are deleted forTPK2 and TPK3, and the strain with only thesedeletions (S7-7A) is henceforth termed strainTPK1. A constitutively high PKA activity wasobtained by additional deletion of the proteinkinase A regulatory subunit, BCY1 (S13-3A,henceforth termed strain bcy1D). A constitutivelylow PKA activity is achieved by replacement ofthe wild-type allele of TPK1 with the tpk1w1 allele(S18-1D, henceforth termed strain tpk1w1), origin-ally isolated as a mutation suppressing a bcy1D(Cameron et al., 1988).
The generation time of the PKA mutants inbasal medium varied from 4.4 h for the bcy1Dstrain to 10.1 h for the tpk1w1 strain, while theTPK1 strain had a generation time of 5.9 h(Table 2). The generation times for the TPK1strain should be compared to the correspondingvalue for the wild-type SP1, from which themutants are derived, which was 4.2 h (Table 2),showing that the deletion of TPK2 and TPK3
Figure 2. Northern analysis of mRNA from ALD3/YMR169c. The graph represents ACT1 normalized quanti®ca-tion of ALD3 mRNA from exponentially growing cells of thethree strains SKQ2n, FY1679 and W303-1A, in YNB/glucosemedium, either without addition of NaCl (light bars) or with1.4 M NaCl added (dark bars). All values were normalized bydivision with the quantity of FY1679 in 1.4 M NaCl. Error barsrepresent standard deviation (n=2). The lower panels show theACT1 and ALD3 signal of the ®lters, either with or withoutaddition of NaCl.
PKA ACTIVITY AFFECTS YEAST GENE EXPRESSION AND OSMOTOLERANCE 125
Copyright # 2000 John Wiley & Sons, Ltd. Yeast 2000; 16: 121±137.
causes a roughly 50% increase in generation timein this strain background. Also, during growth at1 M NaCl, the generation time of the TPK1 strain(18 h) was intermediate between the bcy1D strain(12.2 h) and the tpk1w1 strain (22.1 h). Thefactorial increase in generation time during
growth in saline medium was for all strainsbetween two- and three-fold. The tpk1w1 straindisplayed the lowest-fold change increase ingeneration time, which is interesting in view ofthe fact that it was also the most tolerant toosmotic stress (Figure 4, see below).
Figure 3. Details from 2D±PAGE gels. Representative portions of 2D±PAGE gels from the three mutants used in this study,exponentially growing either with or without addition of 1 M NaCl. (A) The expression and position of the spots corresponding toAld3p/Ymr169c and Tps1p, the position of Pdc1p is indicated for reference. (B) The expression and position of Tdh1p, theposition of Tdh2p and Tdh3p is indicated for reference. Below the gel portions is given the apparent pI (acidic end to the left), onthe left side of the gel portions is given the Mr value (kDa).
126 J. NORBECK AND A. BLOMBERG
Copyright # 2000 John Wiley & Sons, Ltd. Yeast 2000; 16: 121±137.
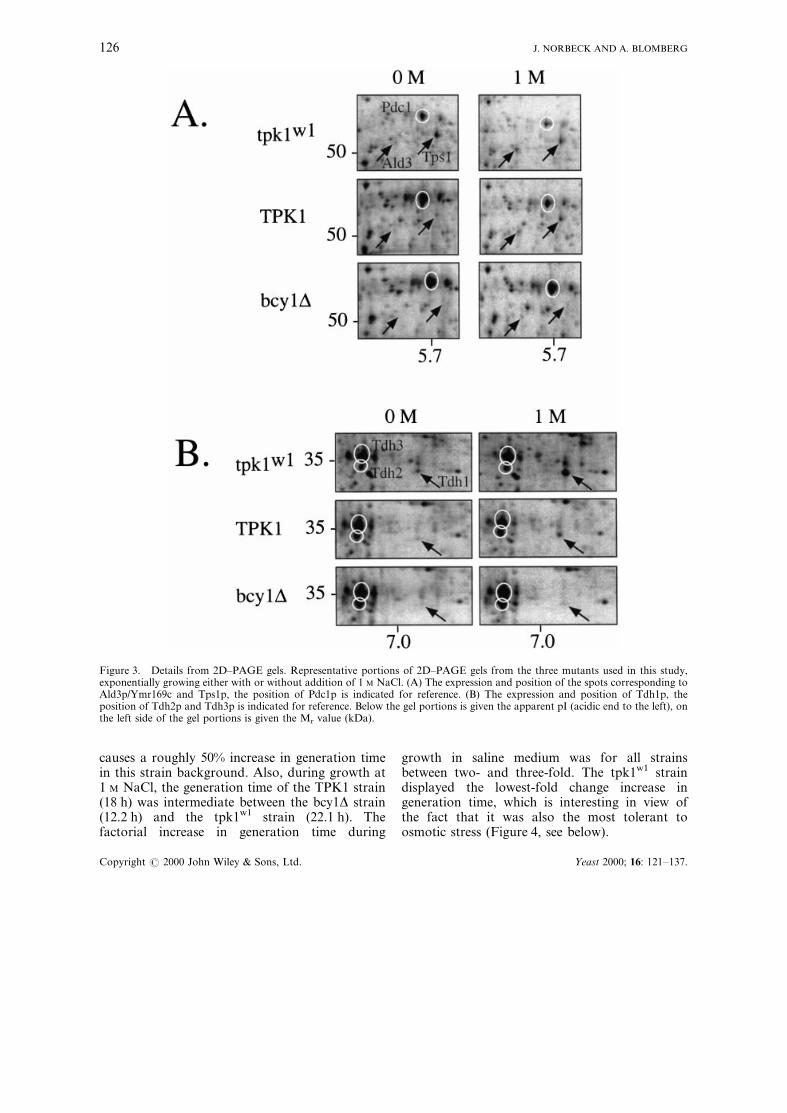
Since a high PKA activity is known to causesensitivity to various forms of stress, such as heatshock and starvation (Toda et al., 1987a), weinvestigated whether the level of PKA activitywould also have a strong in¯uence on osmoticshock tolerance for actively growing cells. Thiswas indeed found to be the case, the threshold forsensitivity to hyperosmotic shock, as assayed byplating, being inversely proportional to PKAactivity (Figure 4). The bcy1D strain was by farthe most sensitive, with an LD10 value ofapproximately 0.4 M NaCl, which is markedlylower than the LD10 values of 1.06±1.38 M NaClwhich was found for a variety of wild-type strains(Blomberg, 1997). The TPK1 strain had a LD10
value of approximately 0.8 M, while the tpk1w1
mutant showed only marginally reduced viability,even at 1.4 M NaCl. However, the latter strain didnot produce colonies at higher salinities, even afterseveral weeks' incubation, but this is probably dueto the extremely slow growth of this strain at highlevels of osmotic stress (Table 2), a phenotypewhich might conceivably be further exacerbatedby growth conditions on the agar surface.
Differential PKA-dependence of salt-induced genes
All proteins that were identi®ed in earlierstudies as induced during growth in high salinities(1.4 M NaCl) were also induced in the TPK1 strainin 1 M NaCl (Figures 5A, 6). In the present studywe have studied expression changes at 1 M NaCl,mainly for the reason that the tpk1w1 strain growsextremely slowly at 1.4 M NaCl. The regulatorypattern, in relation to PKA and medium salinity,for the salt-induced proteins identi®ed fell intothree groups (Figure 5A, 6). The ®rst group(Group I: induced; PKA-independent) comprisesproteins which were independent of PKA activityduring growth at either 0 or 1 M NaCl, showingroughly the same basal levels and fold-inductionby salt stress in all three strains. The members ofthis group are the glycerol-producing enzymesGpd1p and GPP2 (Figure 6), together withthe recently identi®ed dihydroxyacetone kinase,Dak1p (Norbeck and Blomberg, 1997a). Thus, allthe proteins in group I are involved in glycerolmetabolism. In this context it is interesting to notethat the proposed glycerol dehydrogenase, GCY1(Figure 6), fell into a second regulatory group(Group II: induced; strictly PKA-dependent),together with Tps1p (trehalose phosphate syn-thase), which is characterized by a basal level ofexpression inversely proportional to the level ofPKA activity, but also by a lack of salt inductionin the two extremes of PKA activity, i.e. in the
Table 2. Generation times (h)tSD (n=2), of S. cerevisiae strains used in this study during growth in YNBmedium with 2% glucose, with indicated amount of NaCl added. The fold change in generation time in 1 M
NaCl is given in the last column.
Strain 0 M NaCl 1 M NaCl Fold change in 1 M NaCl
SP1 4.2t0.3 10.3t0.3 2.5S18-1D (tpk1wl) 10.1t0.3 22.1t1.5 2.2S7-7A (TPK1) 5.9t0.4 18.0t0.3 3.1S13-3A (bcylD) 4.4t0.4 12.2t0.1 2.8
Figure 4. Survival of osmotic shock. Survival was assayed byplating of cells from the indicated strains, exponentiallygrowing on YNB glucose medium without added NaCl, onplates with YPD medium containing up to 1.4 M NaCl. Valuesare expressed as a percentage of the cells forming colonies onplates (CFU%), with the value 100% assigned to the CFU from0 M sodium chloride.
PKA ACTIVITY AFFECTS YEAST GENE EXPRESSION AND OSMOTOLERANCE 127
Copyright # 2000 John Wiley & Sons, Ltd. Yeast 2000; 16: 121±137.

tpk1w1 strain and in the bcy1D strain. Similar tothe second group, the third group (Group III:induced; partly PKA-dependent) also has a basallevel which is elevated by low PKA activity. But incontrast to the second group, Group III showedsubstantial induction by 1 M NaCl, even in atpk1w1 strain, while the high PKA activity of abcy1D precluded such induction. Members ofGroup III are metabolically diverse and includeEno1p (one of two isoproteins of enolase), Tdh1p(a glyceraldehyde 3-phosphate dehydrogenase),Ctt1p (cytosolic catalase T) and Ald3p (analdehyde dehydrogenase).
Differential PKA-dependence of genes repressedby osmotic stress
Repression of many proteins during growth in1.4 M NaCl was previously reported (Norbeck andBlomberg, 1997a) and most of these proteins were
also repressed by osmotic stress in the TPK1 strainin the present study (Figure 5B), notable excep-tions being Adh1p (Figure 7) and Ilv5p (data notshown). In analogy with the salt-induced proteins,also the proteins whose expression was repressedby 1 M NaCl varied in their dependence on PKAactivity, which to our knowledge has not beenreported previously. Proteins that were repressedby salt, irrespective of PKA activity, although thebasal level was somewhat repressed in the tpk1w1
mutant, constitute group IV (repressed; PKA-independent). The only member of this group,Ymr116c, is a yeast homologue of human RACK1(receptor of activated C-kinase), suggested to beinvolved in translational ef®ciency. Group V(repressed; fully PKA-dependent) consists ofproteins that have a strongly repressed basallevel in low PKA activity, but which are notrepressed by salt stress in a bcy1D strain. In thisgroup is found Sam1p (one of two isogenes for S-
128 J. NORBECK AND A. BLOMBERG
Copyright # 2000 John Wiley & Sons, Ltd. Yeast 2000; 16: 121±137.
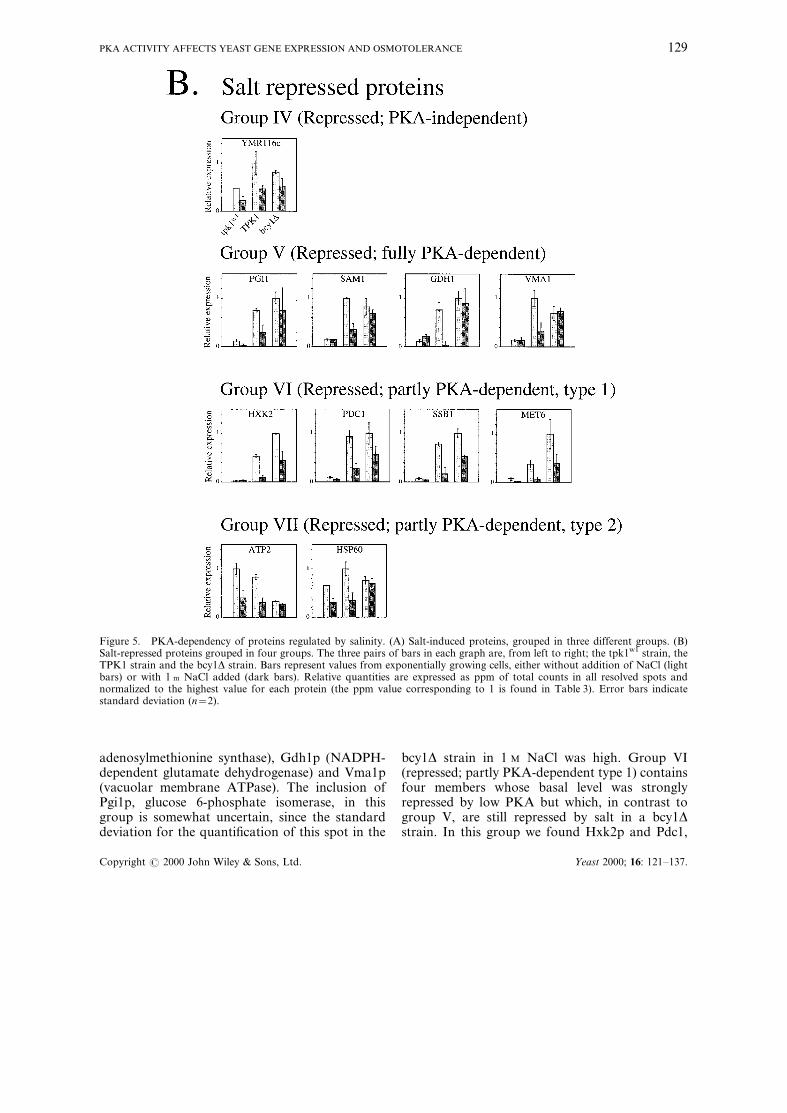
adenosylmethionine synthase), Gdh1p (NADPH-dependent glutamate dehydrogenase) and Vma1p(vacuolar membrane ATPase). The inclusion ofPgi1p, glucose 6-phosphate isomerase, in thisgroup is somewhat uncertain, since the standarddeviation for the quanti®cation of this spot in the
bcy1D strain in 1 M NaCl was high. Group VI(repressed; partly PKA-dependent type 1) containsfour members whose basal level was stronglyrepressed by low PKA but which, in contrast togroup V, are still repressed by salt in a bcy1Dstrain. In this group we found Hxk2p and Pdc1,
Figure 5. PKA-dependency of proteins regulated by salinity. (A) Salt-induced proteins, grouped in three different groups. (B)Salt-repressed proteins grouped in four groups. The three pairs of bars in each graph are, from left to right; the tpk1w1 strain, theTPK1 strain and the bcy1D strain. Bars represent values from exponentially growing cells, either without addition of NaCl (lightbars) or with 1 m NaCl added (dark bars). Relative quantities are expressed as ppm of total counts in all resolved spots andnormalized to the highest value for each protein (the ppm value corresponding to 1 is found in Table 3). Error bars indicatestandard deviation (n=2).
PKA ACTIVITY AFFECTS YEAST GENE EXPRESSION AND OSMOTOLERANCE 129
Copyright # 2000 John Wiley & Sons, Ltd. Yeast 2000; 16: 121±137.

which constitute the ®rst step in glucose metabo-lism and in the pathway to ethanol, respectively.Ssb1p, which is associated with translating ribo-somes and Met6p-encoding methionine synthase,also belong in this group. A fourth group ofrepressed proteins was identi®ed (Group VII:repressed; partly PKA-dependent type 2), whichis characterized by being repressed by osmoticstress in both the TPK1 and tpk1w1 strains, butnot in a bcy1D strain. The identi®ed members ofgroup VII are Atp2p and Hsp60p, both of whichare mitochondrial.
PKA-dependence of genes with connection to salt-regulated genes
Many of the genes that are regulated by saltalso have either sequence homologues in yeast, orare physiologically connected to the salt-regulatedgenes by involvement in the same metabolicpathway. Several examples of this are found inthe central glycolytic pathway from glucose toethanol. Thus, to gain insight into the effect of
PKA activity and salt stress on carbon ¯owthrough central metabolism, we have studied theexpression also of proteins in glycolysis, ethanoland acetate production and the ®rst step in the¯ow to the TCA-cycle (Figure 7). There was awide variety of regulatory patterns found, notonly between the known isogenes (e.g. Hxk2p/Glk1p, Tdh1p/Tdh2p/Tdh3p and Eno1p/Eno2p)but also between the different enzymatic steps.Adh1p, alcohol dehydrogenase I, showed a strongnegative in¯uence from PKA activity, but nosalinity dependence, which is in strong contrast tothe regulation of Pdc1p in the preceding step. Inthe metabolic branch to the TCA cycle, the E1-bsubunit of the pyruvate dehydrogenase complex,Pdb1p, showed little in¯uence of PKA activity and
Figure 6. Northern analysis of mRNA from GCY1 andGPP2. The graphs represent ACT1 normalized quanti®cationof GCY1 and GPP2 mRNA from exponentially growing cellsof the tpk1w1, TPK1 and bcy1D strains, in YNB/glucosemedium, either without addition of NaCl (light bars) or with1 M NaCl added (dark bars). The values were normalized bydivision with the highest value for the respective gene.
Table 3. Values (ppm) of quanti®ed proteins, corre-sponding to a value of 1 in Figures 5 and 7.
Protein Unnormalized Methionine-normalized*
Adh1p 13512 2252Ald3p 1053 150Ald6p 4374 398Atp2p 2067 295Ctt1p 251 42Dak1p 1175 118Eno1p 10551 2110Eno2p 66791 7421Fba1p 56440 8063Gdh1p 3385 423Glk1p 384 27Gpd1p 770 128Gmp1 7099 7099Hsp60p 1636 149Hxk2p 3270 251Met6p 14420 1802Pdb1p 1272 182Pdc1p 37374 3114Pfk1p 346 25Pgi1p 1526 170Pgk1p 11595 3865Pyk1p 30178 2743Sam1p 3482 497Ssb1p 5704 633Tdh1p 4515 752Tdh2p 40156 5736Tdh3p 92198 15366Tps1p 2154 269Vmalp 1769 118Ymr116c 7076 1010
*Value ppm divided by the number of methionines (Norbeckand Blomberg, 1997b).
130 J. NORBECK AND A. BLOMBERG
Copyright # 2000 John Wiley & Sons, Ltd. Yeast 2000; 16: 121±137.

Figure 7. Expression of proteins in the central metabolism. The three pairs of bars in each graph are, from left to right; thetpk1w1 strain, the TPK1 strain and the bcy1tD strain. Bars represent values from exponentially growing cells, either withoutaddition of NaCl (light bars), or with 1 M NaCl added (dark bars). Relative quantities are expressed as ppm of total counts in allresolved spots and normalized to the highest value for each protein (the ppm value corresponding to 1 is found in Table 3). Errorbars indicate standard deviation (n=2). The identi®cation of Pfk1p is taken from Garrels et al., (1997).
PKA ACTIVITY AFFECTS YEAST GENE EXPRESSION AND OSMOTOLERANCE 131
Copyright # 2000 John Wiley & Sons, Ltd. Yeast 2000; 16: 121±137.
salinity. Ald6p, the major cytoplasmic aldehydedehydrogenase, showed a strong PKA dependencein the absence of osmotic stress, an effect whichwas reduced in 1 M NaCl.
DISCUSSION
The PKA activity has a differential in¯uence onsalinity-instigated changes in protein expression
A striking result from the present study was thevery few genes showing salt-induced expression inthe bcy1D strain, with constitutively high PKAactivity. The fact that this limited number of salt-induced expression changes, which were all foundin genes involved in glycerol metabolism (GPD1,GPP2 and DAK1), were nevertheless suf®cient toallow this strain to grow well in saline mediumclearly underscores the crucial role of glycerol inacclimatization to salt. In contrast to the otherglycerol metabolic genes, the putative glyceroldehydrogenase GCY1 was almost totally depen-dent on PKA activity for osmotic induction. Thisregulatory deviation could be taken as evidencefor a function of GCY1 in a pathway outsideglycerol metabolism. However, we believe that thedata presented does not rule out the proposed rolefor GCY1 as a glycerol dehydrogenase, since it willstill be induced by salt stress in a wild-type TPK1strain (this study), in good accordance with whatwas shown earlier for strain SKQ2n (Norbeck andBlomberg, 1997a). It does, however, indicate thatthis step in a putative glycerol cycle requires aregulation different from that of the other cyclecomponents. In this context it is interesting thatboth GCY1 and TPS1 might function as regula-tors of ATP-consuming `glycolytic safety valve'cycles, glycerol metabolism and trehalose metabo-lism, respectively (Blomberg, 2000). Further evi-dence for a metabolic linkage between glyceroland trehalose metabolism is the fact that bothGCY1 and TPS1 display induced expressionduring growth on galactose (Gonzalez et al.,1992; Magdolen et al., 1990) and also showmoderate transient induction at the diauxic shift,with transcript levels staying slightly induced inrespiratory cells (DeRisi et al., 1997).
We have found that PKA activity has a major,but differential, effect on the expression of manyof the genes regulated during growth underosmotic stress. However, it was evident that veryfew were solely PKA-dependent, indicating theexistence of other factors mediating the response
in addition to PKA (see below). Most proteinsindicated as salt-regulated during steady-stategrowth in this study are also rapidly inducedduring adaptation to osmotic stress (Akhtar et al.,1997). An exception to this is Eno1p, which doesnot display the typical rapid and transientresponse during adaptation to osmotic stress(data not shown), indicating the existence ofdifferent signalling and regulatory mechanisms,acting during adaption to salt stress and duringsteady-state growth in saline medium. Among therepressed proteins there was also a large variationin the in¯uence of PKA activity, which has to ourknowledge not been reported earlier. The regula-tory counterparts of the three classes found forinduced proteins could also be identi®ed for theserepressed proteins, i.e. (i) PKA-independent, (ii)fully PKA-dependent, and (iii) partly PKA-dependent. In addition, a fourth class was iden-ti®ed where both members were mitochondrialproteins.
It has been suggested that clustering of genes byregulatory patterns can provide clues to theirfunction, since genes known to be physically orfunctionally connected, e.g. ribosomal subunitsand proteasome components, display similarexpression pro®les when comparing responses toa wide variety of conditions (Eisen et al., 1998).Consistent with this view, in the present study,Group I only contained genes in glycerol meta-bolism and the members in Group II might befunctionally connected by having a role in anATP-level regulatory mechanism. On the otherhand, there was a strong diversity in dependenceon either salt or PKA, or on both, for proteins inglycolysis (Figure 7). This most likely re¯ects thefact that there are many steps where the ¯ow ofcarbon from glucose to ethanol is diverted toother parts of metabolism (e.g. glycerol produc-tion, pentose phosphate pathway, TCA cycle andthe various biosynthetic pathways), thus necessi-tating largely independent regulation of genesinvolved in this central metabolic pathway. Agood example of this diversi®ed regulation isfound for the three members of the TDHfamily, which all displayed individual regulationpatterns.
In terms of physiology, what are the potentialimplications of the observed regulatory patterns?One effect of low PKA activity appears to bereduced expression of Pdc1p, Adh1p and Ald6p,while the pyruvate dehydrogenase componentPdb1p was more or less constant in expression.
132 J. NORBECK AND A. BLOMBERG
Copyright # 2000 John Wiley & Sons, Ltd. Yeast 2000; 16: 121±137.

The interpretation of this could be that pyruvate ismainly utilized in the TCA cycle in the strain withlow PKA activity. The members of group VII wereboth mitochondrial proteins, which could be takenas evidence for a reduced need for this organelleduring saline stress, an effect which would becounteracted by high PKA activity. However,speaking against this is the fact that Ilv5p andPdb1, which are also mitochondrial proteins, didnot show the same pattern of regulation. The fourproteins identi®ed as involved in methioninemetabolism all had different expression pro®les.That Sam1p, but not Sam2p (data not shown) andVma1p have similar expression patterns is inter-esting, since part of the S-adenosylmethioninepool is accumulated in the vacuole (Farooqi et al.,1983). The expression of Met6p, methioninesynthase, was strongly repressed by salt and lowPKA activity. However, the incorporation ofinorganic sulphur into organic compounds wasroughly unchanged, as judged from the PKA andsalt-independent expression of Met17p (data notshown), indicating a need for other sulphur-containing compounds during conditions whenMet6p is low, one possible candidate beingglutathione, which is an important component indefence against oxidative stress. It has beensuggested that cells under oxidative stress adapttheir metabolism to increase NADPH productionneeded for stress protection (Godon et al., 1998),and increased glycerol production will cause anincreased demand for NADH. In this light it islogical that Gdh1p is repressed while Gln1p is not,since this will conserve NADPH. The changes inHxk2p, Pgi1p, Tdh1p, Eno1p, Pdc1p and Ald3pcould serve to optimize central metabolism forincreased NADH production. This increaseddemand for NADH might in turn cause an alteredcellular redox state leading to increased peroxidegeneration, thus explaining the co-regulation withCtt1p. Whatever the expression changes imply,they re¯ect a metabolism in equilibrium, sincelabelling was performed during steady-stategrowth. Thus, it is clear from this study thatstable steady states in S. cerevisiae metabolism canbe accomplished with highly diverse regulatorypatterns.
Expression groups in relation to promotorfeatures
The diversity in responses in relation to PKAindicates the existence of several different regula-
tory mechanisms. However, it is clear that thebinding of known transcription factors (searchedby Transfac; see Methods) can not completelyexplain the grouping into different responseclasses, either for repressed or induced genes. Awell-studied promotor element mediating induc-tion of expression under a variety of adversestress conditions is the stress-responsive element(STRE), the pentanucleotide CCCCT. The tran-scriptional activation from this element has beendemonstrated to be highly dependent on the levelof PKA activity (Marchler et al., 1993) and also tomediate osmotic stress response via the HOGpathway (SchuÈ ller et al., 1994). It is thereforenoteworthy that all of the PKA-dependent andPKA-in¯uenced salt-induced genes (Groups IIand III) contain at least one STRE element intheir promotors, suggesting a mechanism actingvia the STRE-binding proteins Msn2p and Msn4p(Martinez-Pastor et al., 1996). For these transcrip-tional regulatory proteins, nuclear localizationwas recently shown to be PKA-dependent(GoÈrner et al., 1998), which would provide asound mechanistic background to the responses ofmembers in Groups II and III. However, nocandidate for factors explaining the differencebetween classes II and III could be found in thesearch for binding sites of transcription factors.The salt-induced GPD1 and GPP2 genes also haveSTRE-containing promotors, but despite this donot seem to be affected by PKA. Furthermore, thepromotor of DAK1, which shows a very similarregulation to that of GPD1 and GPP2, does notcontain any STRE sites and thus is an exception tothe rule that promotors of salt-induced genescontain STRE sites. This indicates the existence ofosmotically activated signalling pathways inde-pendent of signalling via STRE. In accordancewith this, mutation of all the STRE elements ofthe GPD1 promotor did not have a major effecton the osmotic induction of this gene (Alipour H,Eriksson P, Blomberg A. The STRE elements inthe stress responsive GPD1 gene are not func-tional. Submitted).
An in¯uence of glucose repression pathways ongenes which are induced by osmotic stress hasbeen demonstrated by the observation that dele-tion of SSN6 and TUP1 can suppress thephenotype of a hog1 deletion strain (MaÂrquezet al., 1998). In addition, a strong in¯uence of thecarbon source utilized was found for the osmoti-cally induced expression of HSP12 (Siderius et al.,1997), stress induction of this gene being reduced
PKA ACTIVITY AFFECTS YEAST GENE EXPRESSION AND OSMOTOLERANCE 133
Copyright # 2000 John Wiley & Sons, Ltd. Yeast 2000; 16: 121±137.
on ethanol and almost completely absent whengrown on glycerol. For ENA1 expression, theosmotic induction was suggested to be mediatedby a HOG pathway-dependent release fromrepression acting via Sko1p, on a site in thepromotor distinct from the Mig1p binding site,which mediates glucose repression (Proft andSerrano, 1999). However, similar to STRE,putative binding sites for Sko1p are not found inall promotors of salt-induced proteins. The pre-sence of elements homologous to parts of theENO1 upstream repressor sequence in the promo-tors of salt-induced genes was also reported(Norbeck and Blomberg, 1997a) and such putativerepressor binding sites are also found in the TDH1and CTT1 promotors, but not in those of theALD3 and TPS1 genes.
Also, for the repressed genes there was nocorrelation between the observed expression pat-terns and the presence of binding sites for knowntranscription factors. However, in analogy to thesituation for the positive regulators Msn2/4p onecould speculate that PKA activity causes analteration in the nuclear localization of one orseveral different transcription factors involved inthe expression of the repressed genes. Onepossibility would be that Msn2/4p could act asrepressors in the promotors of salt-repressedgenes. However, speaking against this is the factthat STRE sites are only found in a few of thepromotors of the repressed genes.
Putative determinants of osmotolerance
Tolerance of yeast to osmotic shock has beendemonstrated to be strain-dependent (Blomberg,1997). The effect of deleting BCY1 in the TPK1strain was to lower the hypersensitivity thresholdto extremely low levels of NaCl. In contrast,replacing the TPK1 gene with the tpk1w1 alleledrastically increased osmoshock tolerance. Thus,the level of PKA activity is a potent determinantof tolerance to osmotic shock. A high PKAactivity has since long been known to negativelyin¯uence stress tolerance (Toda et al., 1987a), butto our knowledge the strong effect of PKA activityon osmotic stress tolerance has not previouslybeen shown. In a strain with low PKA activity,high osmotolerance correlated well with enhancedbasal expression of many stress-induced proteins,e.g. Ctt1p, Eno1p, Tdh1p, Ald3p and Tps1p,suggesting this constitutively increased expressionas the reason for the cells being osmotolerant. In
line with this, Enolp was the only protein found tobe induced both in a cyr1 (adenylate cyclase)mutant and by various stresses, e.g. heat shock.Eno1p was therefore suggested to be responsiblefor stress tolerance, at the time under the name ofp48a (Iida and Yahara, 1984, 1985). However, thisENO1-related stress tolerance hypothesis seemsunlikely, since deletions of ENO1 are not sensitiveto osmotic stress or heat shock (unpublisheddata), and mutations in ENO1 have furthermorenot been identi®ed in screens for osmosensitivemutants. Instead, it is probably some other effectsof the low PKA activity of a cyr1 mutant thatcause the stress tolerance, with Eno1p being themost dominant protein responding to altered PKAactivity.
The major differences found when comparingsalt-induced expression in strains with low andhigh PKA activity highlights the need for cautionwhen comparing results from different strainbackgrounds. It also provides a tentative explana-tion for the con¯icting data found for stressresponses, e.g. the difference found for the proteinresponse of Y41 (few responses) and SKQ2n(many responses) during exponential growthunder osmotic stress (Norbeck et al., 1996;Norbeck and Blomberg, 1997a). In the presentstudy the bcy1D strain, with high PKA activity,displayed few changes in protein expression inresponse to osmotic stress. The fact that theseexpression changes were similar to those found forstrain Y41, which has a poor osmotolerancecompared to other wild-type strains, further high-lights the resemblance between strains Y41 andbcy1D. We thus hypothesize the industrial baker'syeast strain Y41 to have an elevated level of PKAactivity.
Yeast cells have also been shown to bemarkedly more tolerant to osmotic shock whengrown on ethanol or galactose as carbon andenergy source (Blomberg, 1997), conditions underwhich neither the genes in group III nor theglycerol metabolic genes are induced (Norbeckand Blomberg, 1997b, and unpublished data). Ofthe induced genes, only the members of Group II(TPS1 and GCY1) are reported as induced duringthese conditions (DeRisi et al., 1997; Gonzalezet al., 1992; Magdolen et al., 1990). A similaritybetween cells grown under osmotic stress, galac-tose or ethanol, as compared to cells grown onbasal glucose medium, is the marked overlap inrepressed proteins (Norbeck and Blomberg,1997a, 1997b). Most of these proteins were, in
134 J. NORBECK AND A. BLOMBERG
Copyright # 2000 John Wiley & Sons, Ltd. Yeast 2000; 16: 121±137.

this study, found to be repressed by low PKAactivity. Furthermore, it was found that thepresence of glucose is a prerequisite for rapidkilling of cells at extreme salinities (Blomberg,unpublished data). Repression of glycolytic genes,in combination with the presence of `glycolyticsafety valves', the latter being a suggested role forTPS1 and GCY1, could both contribute to areduced glycolytic ¯ux. Both these features, mostclearly seen in the tpk1w1 mutant, might thus befactors mediating stress resistance.
ACKNOWLEDGEMENTS
This study was funded by grants from the SwedishNatural Science Research Council (NFR) andthe Swedish Research Council for EngineeringSciences (TFR). The assistance of Ellinor Petters-son in performing Northern analyses is highlyacknowledged.
REFERENCES
Akhtar N, Blomberg A, Adler L. 1997. Osmoregulationand protein expression in a pbs2D mutant of S.cerevisiae during adaptation to hypersaline stress.FEBS Lett 403: 173±180.
Albertyn J, Hohmann S, Prior BA. 1994. GPD1, whichencodes glycerol-3-phosphate dehydrogenase, isessential for growth under osmotic stress in Sacchar-omyces cerevisiae, and its expression is regulated bythe high-osmolarity glycerol pathway. Mol Cell Biol14: 4135±4144.
Blomberg A. 1995. Global changes in protein synthesisduring adaptation of the yeast Saccharomyces cerevi-siae to 0.7 M NaCl. J Bacteriol 177: 3563±3572.
Blomberg A. 1997. The osmotic hypersensitivity of theyeast Saccharomyces cerevisiae is strain- and growthmedia-dependent: quantitative aspects of the phe-nomenon. Yeast 13: 529±539.
Blomberg A. 2000. Metabolic surprises in Saccharo-myces cerevisiae during adaptation to saline condi-tions: questions, some answers and a model. FEMSLett 182: 1±8.
Blomberg A, Adler L. 1993. Tolerance of fungi to NaCl.In Stress Tolerance of Fungi, Jennings DH (ed.).Marcel Dekker: New York; 209±232.
Blomberg A, Blomberg L, Norbeck J, Fey SJ, MoseLarsen P, Larsen M, Roepstorff P, Degand H, BoutryM, Posch A, GoÈrg A. 1995. Interlaboratory repro-ducibility of yeast protein patterns analyzed byimmobilized pH gradient two-dimensional gelelectrophoresis. Electrophoresis 16: 1935±1945.
Boguslawski G. 1992. PBS2, a yeast gene encoding aputative protein kinase, interacts with the RAS2
pathway and affects osmotic sensitivity of S. cerevi-siae. J Gen Microbiol 138: 2425±2432.
Boy-Marcotte E, Perrot M, Bussereau F, Boucherie H,Jacquet M. 1998. Msn2p and Msn4p control a largenumber of genes induced at the diauxic transitionwhich are repressed by cyclic AMP in S. cerevisiae.J Bact 180: 1044±1052.
Brewster JL, De Valoir T, Dwyer ND, Winter E, GustinMC. 1993. An osmosensing signal transductionpathway in yeast. Science 259: 1760±1763.
Cameron S, Levin L, Zoller M, Wigler M. 1988. cAMP-independent control of sporulation, glycogen meta-bolism and heat shock resistance in S. cerevisiae. Cell53: 555±566.
DeRisi JL, Vishwanath RI, Brown P. 1997. Exploringthe metabolic and genetic control of gene expressionon a genomic scale. Science 278: 680±686. http://cmgm.stanford.edu/pbrown/explore/index.html.
Eisen MB, Spellman PT, Brown PO, Botstein D. 1998.Cluster analysis and display of genome-wide expres-sion patterns. Proc Natl Acad Sci U S A 95:14863±14868.
Eriksson P, Andre L, Ansell R, Blomberg A, Adler L.1995. Cloning and characterization of GPD2, asecond gene encoding sn-glycerol 3-phosphate dehy-drogenase (NAD+) in Saccharomyces cerevisiae, andits comparison with GPD1. Mol Microbiol 17: 95±107.
Farooqi JZ, Woo Lee H, Kim S, Park WK. 1983.Studies on compartmentation of S-adenosyl-methionine in Saccharomyces cerevisiae and isolatedrat hepatocytes. Biochim Biophys Acta 747: 342±351.
Garrels JI, McLaughlin CS, Warner JR, Futcher B,Latter GI, Kobayashi R, Schwender B, Volpe T,Anderson DS, Mesquita-Fuentes R, Payne WE. 1997.Proteome studies of S. cerevisiae: identi®cation andcharacterization of abundant proteins. Electrophoresis18: 1347±1360.
Godon C, Lagniel G, Lee J, Buhler J-M, Kieffer S,Perrot M, Boucherie H, Toledano MB, Labarre J.1998. The H2O2 stimulon in Saccharomyces cerevisiae.J Biol Chem 273: 22480±22489.
Gonzalez MI, Stucka R, Blazquez MA, Feldmann H,Gancedo C. 1992. Molecular cloning of CIF1, a yeastgene necessary for growth on glucose. Yeast 8:183±192.
GoÈrner W, Durchschlag E, Martinez-Pastor MT,Estruch F, Ammerer G, Hamilton B, Ruis H, SchuÈ llerC. 1998. Nuclear localization of the C2H2 zinc ®ngerprotein Msn2p is regulated by stress and proteinkinase A activity. Genes Dev 12: 586±597.
Haro R, Garciadeblas B, RodrigueÂz-Navarro A. 1991.A novel P-type ATPase from yeast involved insodium transport. FEBS Lett 291: 189±191.
Hirayama T, Maeda T, Saito H, Shinozaki K. 1995.Cloning and characterization of seven cDNAs forhyperosmolarity-responsive (HOR) genes of Sacchar-omyces cerevisiae. Mol Gen Genet 249: 127±138.
Hohmann S. 1997. Shaping up: the response of yeast to
PKA ACTIVITY AFFECTS YEAST GENE EXPRESSION AND OSMOTOLERANCE 135
Copyright # 2000 John Wiley & Sons, Ltd. Yeast 2000; 16: 121±137.

osmotic stress. In Yeast Stress Responses, HohmannS, Mager WH (eds). R.G. Landes Co.: Austin, TX;101±145.
Iida H. 1988. Multistress resistance of Saccharomycescerevisiae is generated by insertion of retrotransposonTy into the 5k coding region of the adenylate cyclasegene. Mol Cell Biol 8: 5555±5560.
Iida H, Yahara I. 1984. A heat shock resistant mutantof Saccharomyces cerevisiae shows constitutive synth-esis of two heat shock proteins and altered growth.J Cell Biol 99: 1441±1450.
Iida H, Yahara I. 1985. Yeast heat shock protein of Mr
48 000 is an isoprotein of enolase. Nature 315:688±690.
Larsson K, Ansell R, Eriksson P, Adler L. 1993. A geneencoding sn-glycerol 3-phosphate dehydrogenase(NAD+) complements an osmosensitive mutant ofSaccharomyces cerevisiae. Mol Microbiol 10:1101±1111.
Luyten K, Albertyn J, Fourie-Skibbe W, Prior B,Ramos J, Thevelein JM, Hohmann S. 1995. Fps1, ayeast member of the MIP family of channel proteins, is afacilitator for glycerol uptake and ef¯ux and is inactiveunder osmotic stress. EMBO J 14: 1360±1371.
Maeda T, Takekawa M, Saito H. 1995. Activation ofyeast PBS2 MAPKK by MAPKKKs or by binding ofan SH3-containing osmosensor. Science 269: 554±558.
Maeda T, Wurgler-Murphy SM, Saito H. 1994. A twocomponent system that regulates an osmosensingMAP kinase cascade in yeast. Nature 369: 242±245.
Magdolen V, Oechsner U, Trommler P, Bandlow W.1990. Transcriptional control of a yeast gene encod-ing a protein homologous to mammalian aldo/ketoreductases. Gene 90: 105±114.
Marchler G, SchuÈ ller C, Adam G, Ruis H. 1993.A Saccharomyces cerevisiae UAS element controlledby protein kinase A activates transcription inresponse to a variety of stress conditions. EMBO J12: 1997±2003.
MaÂrquez JA, Pascual-Ahuir A, Proft M, Serrano R.1998. The Ssn6±Tup1 repressor complex of S.cerevisiae is involved in the osmotic induction ofHOG-dependent and -independent genes. EMBO J17: 2543±2553.
MaÂrquez JA, Serrano R. 1996. Multiple transductionpathways regulate the sodium-extrusion gene PMR2/ENA1 during salt stress in yeast. FEBS Lett 382:89±92.
Martinez-Pastor MT, Marchler G, SchuÈ ller C, March-ler-Bauer A, Ruis H, Estruch F. 1996. The Sacchar-omyces cerevisiae zinc ®nger proteins Msn2p andMsn4p are required for transcriptional inductionthrough the stress-response element (STRE). EMBOJ 15: 2227±2235.
Miralles VJ, Serrano R. 1995. A genomic locus inSaccharomyces cerevisiae with four genes upregulatedby osmotic stress. Mol Microbiol 17: 653±662.
Norbeck J, Blomberg A. 1996. Protein expression
during exponential growth in 0.7 M NaCl medium ofSaccharomyces cerevisiae. FEMS Microbiol Lett 137:1±8.
Norbeck J, Blomberg A. 1997a. Metabolic and regula-tory changes associated with growth of Saccharo-myces cerevisiae in 1.4 M NaCl: evidence for osmoticinduction of glycerol dissimilation via the dihydrox-yacetone pathway. J Biol Chem 272: 5544±5554.
Norbeck J, Blomberg A. 1997b. Two-dimensionalelectrophoretic separation of yeast proteins using anon-linear wide range (pH 3±10) immobilized pHgradient in the ®rst dimension: reproducibility andevidence for isoelectric focusing of alkaline (pI>7)proteins. Yeast 13: 1519±1534.
Norbeck J, Larsson T, Warringer J, Karlsson K-A,Blomberg A. 1999a. Effects of gel staining methodsand sample preparation on sensitivity of proteinidenti®cation from SDS±PAGE gels usingMS±MALDI (unpublished manuscript).
Norbeck J, Molin M, Blomberg A. 1999b. Character-ization of the yeast dihydroxyacetone kinase geneDAK1 (unpublished manuscript).
Norbeck J, PaÊhlman A-K, Akhtar N, Blomberg A, andAdler L. 1996. Puri®cation and characterizationof two isoenzymes of dl-glycerol-3-phosphatase fromSaccharomyces cerevisiae. J Biol Chem 271:13875±13881.
Proft M, Serrano R. 1999. Repressors and upstreamrepressing sequences of the stress-regulated ENA1gene in S. cerevisiae: bZIP protein Sko1p confersHOG-dependent osmotic regulation. Mol Cell Biol19: 537±546.
SchuÈ ller C, Brewster JL, Alexander MR, Gustin MC,Ruis H. 1994. The HOG pathway controls osmoticregulation of transcription via the stress responseelement (STRE) of the Saccharomyces cerevisiaeCTT1 gene. EMBO J 13: 4382±4389.
Siderius M, Mager WH. 1997. General stress response:in search of a common denominator. In Yeast StressResponses, Hohmann S, Mager WH (eds). R.G.Landes Co.: Austin, TX; 213±230.
Siderius M, Rots E, Mager WH. 1997. High-osmolaritysignalling in Saccharomyces cerevisiae is modulatedin a carbon source-dependent fashion. Microbiology143: 3241±3250.
Thevelein J. 1994. Signal transduction in yeast. Yeast10: 1753±1790.
Toda T, Cameron S, Sass P, Zoller M, Scott JD,McMullen B, Hurwitz M, Krebs EG, Wigler M.1987a. Cloning and characterization of BCY1, a locusencoding a regulatory subunit of the cAMP-dependent protein kinase in yeast. Mol Cell Biol 7:1371±1377.
Toda T, Cameron S, Sass P, Zoller M, Wigler M. 1987b.Three different genes in S. cerevisiae encode thecatalytic subunits of the cAMP-dependent proteinkinase. Cell 50: 277±287.
Varela JCS, Praekelt UM, Meacock PA, Planta RJ,
136 J. NORBECK AND A. BLOMBERG
Copyright # 2000 John Wiley & Sons, Ltd. Yeast 2000; 16: 121±137.
Mager WH. 1995. The Saccharomyces HSP12 gene isactivated by the high-osmolarity glycerol pathwayand negatively regulated by protein kinase A. MolCell Biol 15: 6232±6245.
Winderickx J, de Winde JH, Crauwels M, Hino A,Hohmann S, Van Dijck P, Thevelein JM. 1996.Regulation of genes encoding subunits of the
trehalose synthase complex in Saccharomyces cerevi-siae: novel variations of STRE-mediated transcriptioncontrol? Mol Gen Genet 252: 470±482.
Winston F, Dollard C, Ricupero-Hovasse SL. 1995.Construction of a set of convenient Saccharomycescerevisiae strains that are isogenic to S288C. Yeast 11:53±55.
PKA ACTIVITY AFFECTS YEAST GENE EXPRESSION AND OSMOTOLERANCE 137
Copyright # 2000 John Wiley & Sons, Ltd. Yeast 2000; 16: 121±137.