The Lean Certification Handbookpinnaclelean.com/pdfs/Lean_Handbook.pdfA Lean Guide to Transforming...
72
The Lean Handbook H1403_Manos_pi_410.indd 1 5/25/12 11:32 AM
Transcript of The Lean Certification Handbookpinnaclelean.com/pdfs/Lean_Handbook.pdfA Lean Guide to Transforming...
The Lean Handbook
H1403_Manos_pi_410.indd 1 5/25/12 11:32 AM
Also available from ASQ Quality Press:
Lean Kaizen: A Simplified Approach to Process ImprovementsGeorge Alukal and Anthony Manos
The Certified Six Sigma Master Black Belt HandbookT.M. Kubiak
Lean-Six Sigma for the Public Sector: Leveraging Continuous Process Improvement to Build Better GovernmentsBrandon Cole
Lean Acres: A Tale of Strategic Innovation and Improvement in a Farm-iliar SettingJim Bowie
A Lean Guide to Transforming Healthcare: How to Implement Lean Principles in Hospitals, Medical Offices, Clinics, and Other Healthcare OrganizationsThomas G. Zidel
Lean Doctors: A Bold and Practical Guide to Using Lean Principles to Transform Healthcare Systems, One Doctor at a TimeAneesh Suneja and Carolyn Suneja
Profitability with No Boundaries: Optimizing TOC and Lean-Six SigmaReza (Russ) M. Pirasteh and Robert E. Fox
The Logical Thinking Process: A Systems Approach to Complex Problem SolvingH. William Dettmer
The Executive Guide to Understanding and Implementing Lean Six Sigma: The Financial ImpactRobert M. Meisel, Steven J. Babb, Steven F. Marsh, and James P. Schlichting
The Certified Six Sigma Black Belt Handbook, Second EditionT.M. Kubiak and Donald W. Benbow
Six Sigma for the New Millennium: A CSSBB Guidebook, Second EditionKim H. Pries
The Certified Six Sigma Green Belt HandbookRoderick A. Munro, Matthew J. Maio, Mohamed B. Nawaz, Govindarajan Ramu, and Daniel J. Zrymiak
Lean ISO 9001: Adding Spark to your ISO 9001 QMS and Sustainability to your Lean EffortsMike Micklewright
Optimizing Student Learning: A Lean Systems Approach to Improving K-12 EducationBetty Ziskovsky and Joe Ziskovsky
Root Cause Analysis: Simplified Tools and Techniques, Second EditionBjørn Andersen and Tom Fagerhaug
Quality Function Deployment and Lean-Six Sigma Applications in Public HealthGrace L. Duffy, John W. Moran, and William J. Riley
To request a complimentary catalog of ASQ Quality Press publications, call 800-248-1946, or visit our website at http://www.asq.org/quality-press.
H1403_Manos_pi_410.indd 2 5/29/12 4:14 PM
The Lean Handbook
A Guide to the Bronze Certification Body of Knowledge
Anthony Manos and Chad Vincent, editors
ASQ Quality PressMilwaukee, Wisconsin
H1403_Manos_pi_410.indd 3 5/25/12 11:32 AM
American Society for Quality, Quality Press, Milwaukee 53203© 2012 by ASQAll rights reserved. Published 2012Printed in the United States of America16 15 14 13 12 11 5 4 3 2 1
Library of Congress Cataloging-in-Publication Data
The lean handbook / Anthony Manos and Chad Vincent, editors. p. cm. Includes bibliographical references and index. ISBN 978-0-87389-804-1 (alk. paper) 1. Total quality management. 2. Industrial efficiency. I. Manos, Anthony, 1963– II. Vincent, Chad. HD62.15.L4324 2012 658.4’013—dc23 2012010040
No part of this book may be reproduced in any form or by any means, electronic, mechanical, photocopying, recording, or otherwise, without the prior written permission of the publisher.
Publisher: William A. TonyAcquisitions Editor: Matt MeinholzProject Editor: Paul Daniel O’MaraProduction Administrator: Randall Benson
ASQ Mission: The American Society for Quality advances individual, organizational, and community excellence worldwide through learning, quality improvement, and knowledge exchange.
Attention Bookstores, Wholesalers, Schools, and Corporations: ASQ Quality Press books, video, audio, and software are available at quantity discounts with bulk purchases for business, educational, or instructional use. For information, please contact ASQ Quality Press at 800-248-1946, or write to ASQ Quality Press, P.O. Box 3005, Milwaukee, WI 53201-3005.
To place orders or to request a free copy of the ASQ Quality Press Publications Catalog, visit our website at http://www.asq.org/quality-press.
Printed on acid-free paper
H1403_Manos_pi_410.indd 4 5/25/12 11:32 AM
To Jennifer, who puts up with all my antics. To Judy, who taught me her version of continuous improvement—“Do not rest on your laurels.” And to George, for supporting
me and for helping me reach a higher level of accomplishment.
—Tony Manos
To my wife, Holly, and my kids, Austin and Miranda, who gave up their time with a husband and father to make this book possible, and whose continued support provides
me strength to pursue my dreams.
—Chad Vincent
H1403_Manos_pi_410.indd 5 5/25/12 11:32 AM

H1403_Manos_pi_410.indd 6 5/25/12 11:32 AM
Table of Contents
List of Figures and Tables . . . . . . . . . . . . . . . . . . . . . . . . . . . . . . . . . . . . . . . . . . . . . . . . . xiForeword . . . . . . . . . . . . . . . . . . . . . . . . . . . . . . . . . . . . . . . . . . . . . . . . . . . . . . . . . . . . . . xviiPreface . . . . . . . . . . . . . . . . . . . . . . . . . . . . . . . . . . . . . . . . . . . . . . . . . . . . . . . . . . . . . . . . xixAcknowledgments . . . . . . . . . . . . . . . . . . . . . . . . . . . . . . . . . . . . . . . . . . . . . . . . . . . . . . . xxiiiA Brief History of the Lean Certification Body of Knowledge . . . . . . . . . . . . . . . . . . . . . xxvSpecial Dedication. . . . . . . . . . . . . . . . . . . . . . . . . . . . . . . . . . . . . . . . . . . . . . . . . . . . . . . xxviiPrologue . . . . . . . . . . . . . . . . . . . . . . . . . . . . . . . . . . . . . . . . . . . . . . . . . . . . . . . . . . . . . . xxixContributing Authors and Editors . . . . . . . . . . . . . . . . . . . . . . . . . . . . . . . . . . . . . . . . . . xxxi
Module 1 Cultural Enablers . . . . . . . . . . . . . . . . . . . . . . . . . . . . . . . . . . . . . 1
1.1 Principles of Cultural Enablers . . . . . . . . . . . . . . . . . . . . . . . . . . . . . . . . . . . . . . 21.1.1. Respect for the Individual . . . . . . . . . . . . . . . . . . . . . . . . . . . . . . . . . . . . . . 71.1.2. Humility . . . . . . . . . . . . . . . . . . . . . . . . . . . . . . . . . . . . . . . . . . . . . . . . . . . . . 8References . . . . . . . . . . . . . . . . . . . . . . . . . . . . . . . . . . . . . . . . . . . . . . . . . . . . . . . . . 10
1.2 Processes for Cultural Enablers . . . . . . . . . . . . . . . . . . . . . . . . . . . . . . . . . . . . . . 111.2.1. Planning & Deployment . . . . . . . . . . . . . . . . . . . . . . . . . . . . . . . . . . . . . . . . 111.2.2. Create a Sense of Urgency . . . . . . . . . . . . . . . . . . . . . . . . . . . . . . . . . . . . . . 131.2.3. Modeling the Lean Principles, Values, Philosophies . . . . . . . . . . . . . . . . 151.2.4. Message Deployment—Establishing Vision and Direction . . . . . . . . . . 171.2.5. Integrating Learning and Coaching . . . . . . . . . . . . . . . . . . . . . . . . . . . . . . 181.2.6. People Development—Education, Training & Coaching . . . . . . . . . . . . 201.2.7. Motivation, Empowerment & Involvement . . . . . . . . . . . . . . . . . . . . . . . 211.2.8. Environmental Systems . . . . . . . . . . . . . . . . . . . . . . . . . . . . . . . . . . . . . . . . 231.2.9. Safety Systems . . . . . . . . . . . . . . . . . . . . . . . . . . . . . . . . . . . . . . . . . . . . . . . . 25References . . . . . . . . . . . . . . . . . . . . . . . . . . . . . . . . . . . . . . . . . . . . . . . . . . . . . . . . . 26
1.3 Cultural Enabler Techniques and Practices . . . . . . . . . . . . . . . . . . . . . . . . . . . 271.3.1. Cross Training . . . . . . . . . . . . . . . . . . . . . . . . . . . . . . . . . . . . . . . . . . . . . . . . 271.3.2. Skills Assessment . . . . . . . . . . . . . . . . . . . . . . . . . . . . . . . . . . . . . . . . . . . . . 291.3.3. Instructional Goals . . . . . . . . . . . . . . . . . . . . . . . . . . . . . . . . . . . . . . . . . . . . 311.3.4. On- the-Job Training . . . . . . . . . . . . . . . . . . . . . . . . . . . . . . . . . . . . . . . . . . . 32
vii
H1403_Manos_pi_410.indd 7 5/25/12 11:32 AM
viii Table of Contents
1.3.5. Coaching & Mentoring . . . . . . . . . . . . . . . . . . . . . . . . . . . . . . . . . . . . . . . . . 331.3.6. Leadership Development . . . . . . . . . . . . . . . . . . . . . . . . . . . . . . . . . . . . . . . 361.3.7. Teamwork . . . . . . . . . . . . . . . . . . . . . . . . . . . . . . . . . . . . . . . . . . . . . . . . . . . . 381.3.8. Information Sharing (Yokoten) . . . . . . . . . . . . . . . . . . . . . . . . . . . . . . . . . . 411.3.9. Suggestion Systems . . . . . . . . . . . . . . . . . . . . . . . . . . . . . . . . . . . . . . . . . . . . 42References . . . . . . . . . . . . . . . . . . . . . . . . . . . . . . . . . . . . . . . . . . . . . . . . . . . . . . . . . 44
Module 2 Continuous Process Improvement . . . . . . . . . . . . . . . . . . . 45
2.1 Principles of Continuous Process Improvement . . . . . . . . . . . . . . . . . . . . . . . 472.1.1. Process Focus . . . . . . . . . . . . . . . . . . . . . . . . . . . . . . . . . . . . . . . . . . . . . . . . . 472.1.2. Identification and Elimination of Barriers to Flow . . . . . . . . . . . . . . . . . . 502.1.3. Match Rate of Production to Level of Customer Demand— Just-in-Time . . . . . . . . . . . . . . . . . . . . . . . . . . . . . . . . . . . . . . . . . . . . . . . . . . 612.1.4. Scientific Thinking. . . . . . . . . . . . . . . . . . . . . . . . . . . . . . . . . . . . . . . . . . . . . 622.1.5. Jidoka . . . . . . . . . . . . . . . . . . . . . . . . . . . . . . . . . . . . . . . . . . . . . . . . . . . . . . . 682.1.6. Integrate Improvement with Work . . . . . . . . . . . . . . . . . . . . . . . . . . . . . . . 792.1.7. Seek Perfection . . . . . . . . . . . . . . . . . . . . . . . . . . . . . . . . . . . . . . . . . . . . . . . . 80References . . . . . . . . . . . . . . . . . . . . . . . . . . . . . . . . . . . . . . . . . . . . . . . . . . . . . . . . . 84
2.2 Continuous Process Improvement Systems . . . . . . . . . . . . . . . . . . . . . . . . . . . 852.2.1. Visual Workplace . . . . . . . . . . . . . . . . . . . . . . . . . . . . . . . . . . . . . . . . . . . . . . 862.2.2. Lot Size Reduction . . . . . . . . . . . . . . . . . . . . . . . . . . . . . . . . . . . . . . . . . . . . 1082.2.3. Load Leveling . . . . . . . . . . . . . . . . . . . . . . . . . . . . . . . . . . . . . . . . . . . . . . . . 1102.2.4. 3P Production Process Preparation . . . . . . . . . . . . . . . . . . . . . . . . . . . . . . . 1152.2.5. Total Productive Maintenance (Including Predictive) . . . . . . . . . . . . . . 1162.2.6. Standard Work . . . . . . . . . . . . . . . . . . . . . . . . . . . . . . . . . . . . . . . . . . . . . . . . 1242.2.7. Built- in Feedback . . . . . . . . . . . . . . . . . . . . . . . . . . . . . . . . . . . . . . . . . . . . . . 1302.2.8. Strategic Business Assessment . . . . . . . . . . . . . . . . . . . . . . . . . . . . . . . . . . 1322.2.9. Continuous Improvement Process Methodology. . . . . . . . . . . . . . . . . . . 1352.2.10. Quality Systems . . . . . . . . . . . . . . . . . . . . . . . . . . . . . . . . . . . . . . . . . . . . . . 1472.2.11. Corrective Action System . . . . . . . . . . . . . . . . . . . . . . . . . . . . . . . . . . . . . . 1482.2.12. Project Management . . . . . . . . . . . . . . . . . . . . . . . . . . . . . . . . . . . . . . . . . . 1512.2.13. Process Design . . . . . . . . . . . . . . . . . . . . . . . . . . . . . . . . . . . . . . . . . . . . . . . 1542.2.14. Pull System . . . . . . . . . . . . . . . . . . . . . . . . . . . . . . . . . . . . . . . . . . . . . . . . . . 1602.2.15. Knowledge Transfer . . . . . . . . . . . . . . . . . . . . . . . . . . . . . . . . . . . . . . . . . . 163References . . . . . . . . . . . . . . . . . . . . . . . . . . . . . . . . . . . . . . . . . . . . . . . . . . . . . . . . . 165
2.3 Continuous Process Improvement Techniques & Practices. . . . . . . . . . . . . . 1672.3.1. Work Flow Analysis . . . . . . . . . . . . . . . . . . . . . . . . . . . . . . . . . . . . . . . . . . . 1672.3.2. Data Collection and Presentation . . . . . . . . . . . . . . . . . . . . . . . . . . . . . . . . 1862.3.3. Identify Root Cause . . . . . . . . . . . . . . . . . . . . . . . . . . . . . . . . . . . . . . . . . . . 1962.3.4. Presenting Variation Data . . . . . . . . . . . . . . . . . . . . . . . . . . . . . . . . . . . . . . 2022.3.5. Product and Service Design . . . . . . . . . . . . . . . . . . . . . . . . . . . . . . . . . . . . 2152.3.6. Organizing for Improvement . . . . . . . . . . . . . . . . . . . . . . . . . . . . . . . . . . . 235
H1403_Manos_pi_410.indd 8 5/25/12 11:32 AM
Table of Contents ix
2.3.7. Countermeasure Activities . . . . . . . . . . . . . . . . . . . . . . . . . . . . . . . . . . . . . 2402.3.8. Supply Processes External . . . . . . . . . . . . . . . . . . . . . . . . . . . . . . . . . . . . . . 2612.3.9. Supply Processes Internal . . . . . . . . . . . . . . . . . . . . . . . . . . . . . . . . . . . . . . 269References . . . . . . . . . . . . . . . . . . . . . . . . . . . . . . . . . . . . . . . . . . . . . . . . . . . . . . . . . 276
Module 3 Consistent Lean Enterprise Culture . . . . . . . . . . . . . . . . . . 277
3.1 Principles of Consistent Lean Enterprise Culture . . . . . . . . . . . . . . . . . . . . . . 2783.1.1. Systemic Thinking . . . . . . . . . . . . . . . . . . . . . . . . . . . . . . . . . . . . . . . . . . . . . 2783.1.2. Constancy of Purpose . . . . . . . . . . . . . . . . . . . . . . . . . . . . . . . . . . . . . . . . . . 2853.1.3. Social Responsibility . . . . . . . . . . . . . . . . . . . . . . . . . . . . . . . . . . . . . . . . . . . 289References . . . . . . . . . . . . . . . . . . . . . . . . . . . . . . . . . . . . . . . . . . . . . . . . . . . . . . . . . 289
3.2 Processes for Developing Consistent Lean Enterprise Culture . . . . . . . . . . 2903.2.1. Enterprise Thinking . . . . . . . . . . . . . . . . . . . . . . . . . . . . . . . . . . . . . . . . . . . 2903.2.2. Policy Deployment/Strategy Deployment . . . . . . . . . . . . . . . . . . . . . . . . 298References . . . . . . . . . . . . . . . . . . . . . . . . . . . . . . . . . . . . . . . . . . . . . . . . . . . . . . . . . 306
3.3 Consistent Enterprise Culture Techniques & Practices . . . . . . . . . . . . . . . . . 3073.3.1. A3 . . . . . . . . . . . . . . . . . . . . . . . . . . . . . . . . . . . . . . . . . . . . . . . . . . . . . . . . . . . 3073.3.2. Catchball . . . . . . . . . . . . . . . . . . . . . . . . . . . . . . . . . . . . . . . . . . . . . . . . . . . . . 3093.3.3. Redeployment of Resources . . . . . . . . . . . . . . . . . . . . . . . . . . . . . . . . . . . . 310
Module 4 Business Results . . . . . . . . . . . . . . . . . . . . . . . . . . . . . . . . . . . . . . 313
4.1 Principles of Business Results . . . . . . . . . . . . . . . . . . . . . . . . . . . . . . . . . . . . . . . 3144.1.1. Create Value First to Drive Performance . . . . . . . . . . . . . . . . . . . . . . . . . . 315References . . . . . . . . . . . . . . . . . . . . . . . . . . . . . . . . . . . . . . . . . . . . . . . . . . . . . . . . . 322
4.2 Measurement Systems. . . . . . . . . . . . . . . . . . . . . . . . . . . . . . . . . . . . . . . . . . . . . . 3234.2.1. Measurement . . . . . . . . . . . . . . . . . . . . . . . . . . . . . . . . . . . . . . . . . . . . . . . . . 3234.2.2. Goal and Objective Setting . . . . . . . . . . . . . . . . . . . . . . . . . . . . . . . . . . . . . . 3384.2.3. Analysis—Understand What Moves the Dial on Measures . . . . . . . . . . 3424.2.4. Reporting . . . . . . . . . . . . . . . . . . . . . . . . . . . . . . . . . . . . . . . . . . . . . . . . . . . . 343References . . . . . . . . . . . . . . . . . . . . . . . . . . . . . . . . . . . . . . . . . . . . . . . . . . . . . . . . . 343
4.3 Key Lean Related Measures . . . . . . . . . . . . . . . . . . . . . . . . . . . . . . . . . . . . . . . . . 3444.3.1. Quality . . . . . . . . . . . . . . . . . . . . . . . . . . . . . . . . . . . . . . . . . . . . . . . . . . . . . . 3454.3.2. Delivery . . . . . . . . . . . . . . . . . . . . . . . . . . . . . . . . . . . . . . . . . . . . . . . . . . . . . 3484.3.3. Cost . . . . . . . . . . . . . . . . . . . . . . . . . . . . . . . . . . . . . . . . . . . . . . . . . . . . . . . . . 3544.3.4. Financial Impact . . . . . . . . . . . . . . . . . . . . . . . . . . . . . . . . . . . . . . . . . . . . . . 3714.3.5. Competitive Impact . . . . . . . . . . . . . . . . . . . . . . . . . . . . . . . . . . . . . . . . . . . 373References . . . . . . . . . . . . . . . . . . . . . . . . . . . . . . . . . . . . . . . . . . . . . . . . . . . . . . . . . 378
Appendix A Lean Certification Body of Knowledge . . . . . . . . . . . . . . . . . . . . . 379
H1403_Manos_pi_410.indd 9 5/25/12 11:32 AM
x Table of Contents
Appendix B Recommended Reading for Lean Certification Exam Preparation . . . . . . . . . . . . . . . . . . . . . . . . . . . . . . . . . . . . . . . . . . . . . . . . . . 385Lean Knowledge Certificate & Lean Bronze Certification Recommended Reading . . . . . . . . . . . . . . . . . . . . . . . . . . . . . . . . . . . . . . . . . . . . . . . . . . . . . . . . . . . 385Lean Silver Certification Recommended Reading . . . . . . . . . . . . . . . . . . . . . . . 385Lean Gold Certification Recommended Reading . . . . . . . . . . . . . . . . . . . . . . . . 386
Appendix C Lean Glossary of Terms . . . . . . . . . . . . . . . . . . . . . . . . . . . . . . . . . . . 387
Index . . . . . . . . . . . . . . . . . . . . . . . . . . . . . . . . . . . . . . . . . . . . . . . . . . . . . . . . . . . . . . . . . 395
H1403_Manos_pi_410.indd 10 5/25/12 11:32 AM
xi
List of Figures and Tables
Module 1Figure 1.1-1 Empowered culture . . . . . . . . . . . . . . . . . . . . . . . . . . . . . . . . . . . . . . . . . . . . 6
Table 1.1.2-1 Level 5 Leadership—personal humility traits . . . . . . . . . . . . . . . . . . . . . . 9
Figure 1.2.1-1 Lean roadmap . . . . . . . . . . . . . . . . . . . . . . . . . . . . . . . . . . . . . . . . . . . . . . . . . 11
Figure 1.2.1-2 Roadmap for transformation . . . . . . . . . . . . . . . . . . . . . . . . . . . . . . . . . . . . 13
Figure 1.2.4-1 Message alignment . . . . . . . . . . . . . . . . . . . . . . . . . . . . . . . . . . . . . . . . . . . . 17
Figure 1.2.7-1 The tactics of innovation . . . . . . . . . . . . . . . . . . . . . . . . . . . . . . . . . . . . . . . . 22
Figure 1.3.2-1 Skills matrix example . . . . . . . . . . . . . . . . . . . . . . . . . . . . . . . . . . . . . . . . . . 30
Figure 1.3.2-2 Skills training matrix competency levels . . . . . . . . . . . . . . . . . . . . . . . . . . 31
Table 1.3.5-1 Coaching and mentoring qualities . . . . . . . . . . . . . . . . . . . . . . . . . . . . . . . 34
Table 1.3.5-2 Coaching and mentoring differences . . . . . . . . . . . . . . . . . . . . . . . . . . . . . 36
Figure 1.3.7-1 Four phases of team building . . . . . . . . . . . . . . . . . . . . . . . . . . . . . . . . . . . . 38
Table 1.3.7-1 Teams versus groups . . . . . . . . . . . . . . . . . . . . . . . . . . . . . . . . . . . . . . . . . . . 40
Figure 1.3.9-1 Idea board . . . . . . . . . . . . . . . . . . . . . . . . . . . . . . . . . . . . . . . . . . . . . . . . . . . . 43
Module 2Figure 2.0-1 The Shingo Transformational Process . . . . . . . . . . . . . . . . . . . . . . . . . . . . . 45
Figure 2.1.1-1 Lean mind-set and process versus results focus . . . . . . . . . . . . . . . . . . . . 48
Figure 2.1.2.2-1 Breakdown of the components of work . . . . . . . . . . . . . . . . . . . . . . . . . . . 53
Figure 2.1.3-1 Ideal state of JIT processing . . . . . . . . . . . . . . . . . . . . . . . . . . . . . . . . . . . . . 62
Figure 2.1.4.1-1 House of Toyota as illustrated by Liker . . . . . . . . . . . . . . . . . . . . . . . . . . . 64
Figure 2.1.4.2-1 House of Gemba as illustrated by Imai . . . . . . . . . . . . . . . . . . . . . . . . . . . 65
Figure 2.1.5-1 Components of autonomation . . . . . . . . . . . . . . . . . . . . . . . . . . . . . . . . . . . 68
Figure 2.1.5.3-1 Example of conventional vs. man/machine separation layouts . . . . . . . 74
Table 2.1.5.3-1 Four stages of man/machine separation . . . . . . . . . . . . . . . . . . . . . . . . . . 75
Figure 2.1.5.4-1 Example of conventional manufacturing to multi-process handling . . . 76
Table 2.1.6-1 Integrated improvement at different organizational levels . . . . . . . . . . . 79
Figure 2.1.7.1-1 Kaizen improvement vs. traditional improvement . . . . . . . . . . . . . . . . . . 81
Figure 2.1.7.2-1 Kaikaku without kaizen . . . . . . . . . . . . . . . . . . . . . . . . . . . . . . . . . . . . . . . . 83
Figure 2.1.7.2-2 Kaizen combined with kaikaku . . . . . . . . . . . . . . . . . . . . . . . . . . . . . . . . . . 83
Figure 2.2-1 Aligned vs. nonaligned organization . . . . . . . . . . . . . . . . . . . . . . . . . . . . . 86
H1403_Manos_pi_410.indd 11 5/25/12 11:32 AM
xii List of Figures and Tables
Figure 2.2.1-1 Visual device for showing status . . . . . . . . . . . . . . . . . . . . . . . . . . . . . . . . . 88
Figure 2.2.1-2 Visual device for sharing work activities . . . . . . . . . . . . . . . . . . . . . . . . . . 88
Figure 2.2.1-3 Visual device for preventing defects . . . . . . . . . . . . . . . . . . . . . . . . . . . . . . 89
Figure 2.2.1-4 Visual device for providing ease of access . . . . . . . . . . . . . . . . . . . . . . . . . 89
Figure 2.2.1-5 Floor bordering . . . . . . . . . . . . . . . . . . . . . . . . . . . . . . . . . . . . . . . . . . . . . . . . 90
Figure 2.2.1-6 Labeling pharmaceuticals in a pharmacy . . . . . . . . . . . . . . . . . . . . . . . . . . 91
Figure 2.2.1-7 Tooling sharpening visual workplace . . . . . . . . . . . . . . . . . . . . . . . . . . . . . 91
Figure 2.2.1-8 Visual workplace for a scrap separator . . . . . . . . . . . . . . . . . . . . . . . . . . . . 92
Figure 2.2.1-9 Visual workplace at an airport . . . . . . . . . . . . . . . . . . . . . . . . . . . . . . . . . . . 93
Figure 2.2.1-10 Airport without visual workplace . . . . . . . . . . . . . . . . . . . . . . . . . . . . . . . . 94
Figure 2.2.1-11 Fewer questions/More value add . . . . . . . . . . . . . . . . . . . . . . . . . . . . . . . . 95
Figure 2.2.1-12 Kindergarten classroom visual management . . . . . . . . . . . . . . . . . . . . . . 96
Figure 2.2.1-13 Stoplight colors green, yellow, and red indicate good, caution, and bad (red and green are used most commonly for status and volume indicators) . . . . . . . . . . . . . . . . . . . . . . . . . . . . . . . . . . . . . . . . . . . . . 97
Figure 2.2.1-14 Example of an andon board . . . . . . . . . . . . . . . . . . . . . . . . . . . . . . . . . . . . . 97
Figure 2.2.1-15 Common stacklight used in hospital environments . . . . . . . . . . . . . . . . . 98
Figure 2.2.1-16 Visual control to manage work-in-process (parts) on a production line . . . . . . . . . . . . . . . . . . . . . . . . . . . . . . . . . . . . . . . . . . . . . . . . . . . . . . . . . . 98
Figure 2.2.1-17 Visual control to manage raw materials in a warehouse . . . . . . . . . . . . . 99
Figure 2.2.1-18 Visual control to manage office supply inventory levels . . . . . . . . . . . . . 99
Figure 2.2.1-19 Visual management of a welding operation and steel cutting process . . 100
Figure 2.2.1-20 Resource management board to trigger the addition of an inspector and manual cleaning operation . . . . . . . . . . . . . . . . . . . . . . . . . 100
Figure 2.2.1-21 File management at a doctor’s office . . . . . . . . . . . . . . . . . . . . . . . . . . . . . 101
Figure 2.2.1-22 Color coding for inventory locations in a warehouse. . . . . . . . . . . . . . . . 101
Figure 2.2.1-23 Diagonal line identifying whether critical documents are missing . . . . 102
Figure 2.2.1-24 LOTO tool . . . . . . . . . . . . . . . . . . . . . . . . . . . . . . . . . . . . . . . . . . . . . . . . . . . . 102
Figure 2.2.1-25 LOTO station easily identifies where LOTO supplies are located and when they are missing . . . . . . . . . . . . . . . . . . . . . . . . . . . . . . . . . . . . . . 103
Figure 2.2.1-26 Examples of various safety signs . . . . . . . . . . . . . . . . . . . . . . . . . . . . . . . . . 103
Table 2.2.1-1 Example of a production hour-by-hour chart . . . . . . . . . . . . . . . . . . . . . . 104
Table 2.2.1.1-1 The 5Ss . . . . . . . . . . . . . . . . . . . . . . . . . . . . . . . . . . . . . . . . . . . . . . . . . . . . . . . 105
Figure 2.2.2-1 Customer demand showing peaks and valleys . . . . . . . . . . . . . . . . . . . . . 109
Figure 2.2.3-1 Three components of production leveling . . . . . . . . . . . . . . . . . . . . . . . . . 110
Figure 2.2.3-2 Production leveled for different time periods . . . . . . . . . . . . . . . . . . . . . . 111
Figure 2.2.3-3 Total volume is leveled, and product type volumes are variable . . . . . . 112
Figure 2.2.3-4 Total volume is leveled, and product type volumes are leveled over a time period . . . . . . . . . . . . . . . . . . . . . . . . . . . . . . . . . . . . . . . . . . . . . 112
Figure 2.2.3-5 Inventory reduction with mixed model production . . . . . . . . . . . . . . . . . 114
Figure 2.2.3-6 Example of a heijunka box . . . . . . . . . . . . . . . . . . . . . . . . . . . . . . . . . . . . . . 114
Figure 2.2.5-1 OEE waterfall chart . . . . . . . . . . . . . . . . . . . . . . . . . . . . . . . . . . . . . . . . . . . . 118
Figure 2.2.5-2 OEE loss categories . . . . . . . . . . . . . . . . . . . . . . . . . . . . . . . . . . . . . . . . . . . . 118
H1403_Manos_pi_410.indd 12 5/25/12 11:32 AM
List of Figures and Tables xiii
Table 2.2.5-1 The Six Big Losses of OEE. . . . . . . . . . . . . . . . . . . . . . . . . . . . . . . . . . . . . . . 119
Figure 2.2.5-3 The machine loss pyramid . . . . . . . . . . . . . . . . . . . . . . . . . . . . . . . . . . . . . . 120
Table 2.2.5-2 Other lean tools implemented during the TPM process . . . . . . . . . . . . . 123
Table 2.2.6-1 Reasons for resistance to standard work . . . . . . . . . . . . . . . . . . . . . . . . . . 125
Figure 2.2.6-1 Example of production (process) capacity chart . . . . . . . . . . . . . . . . . . . . 127
Figure 2.2.6-2 Example of standardized work (operation) combination table . . . . . . . 128
Figure 2.2.6-3 Example of a standardized work analysis chart . . . . . . . . . . . . . . . . . . . . 129
Figure 2.2.6-4 Example of a job element sheet . . . . . . . . . . . . . . . . . . . . . . . . . . . . . . . . . . 130
Figure 2.2.7-1 A typical feedback loop . . . . . . . . . . . . . . . . . . . . . . . . . . . . . . . . . . . . . . . . . 131
Figure 2.2.8-1 Aligning organizational goals and operational measures . . . . . . . . . . . . 134
Table 2.2.8-1 Measures useful for strategic and tactical business assessment . . . . . . . 135
Figure 2.2.9-1 Juran’s Quality Trilogy . . . . . . . . . . . . . . . . . . . . . . . . . . . . . . . . . . . . . . . . . 136
Figure 2.2.9-2 The concept of continuous improvement versus reengineering . . . . . . . 137
Figure 2.2.9.1-1 The PDCA cycle of improvement . . . . . . . . . . . . . . . . . . . . . . . . . . . . . . . . 138
Figure 2.2.9.1-2 Ishikawa’s modified PDCA cycle of improvement . . . . . . . . . . . . . . . . . . 139
Figure 2.2.9.1-3 Deming’s modified PDSA Cycle . . . . . . . . . . . . . . . . . . . . . . . . . . . . . . . . . 140
Table 2.2.9.1-1 Comparison of improvement methodologies . . . . . . . . . . . . . . . . . . . . . . 140
Table 2.2.9.2-1 DMAIC methodology . . . . . . . . . . . . . . . . . . . . . . . . . . . . . . . . . . . . . . . . . . 141
Figure 2.2.9.3-1 Examples of problem-solving storyboard based on DMAIC structure . . . . . . . . . . . . . . . . . . . . . . . . . . . . . . . . . . . . . . . . . . . . . . . . . . . . . . 144
Figure 2.2.9.3-2 Simplified example of problem-solving storyboard (A3 format) . . . . . . 145
Figure 2.2.9.3-3 Example of a detailed A3 from Managing to Learn . . . . . . . . . . . . . . . . . . 146
Figure 2.2.12-1 Example of a Gantt chart with visual management incorporated . . . . . 152
Figure 2.2.12-2 Example of a PERT chart . . . . . . . . . . . . . . . . . . . . . . . . . . . . . . . . . . . . . . . . 153
Figure 2.2.13-1 SIPOC diagram . . . . . . . . . . . . . . . . . . . . . . . . . . . . . . . . . . . . . . . . . . . . . . . . 155
Figure 2.2.13-2 SIPOC and the linking of processes . . . . . . . . . . . . . . . . . . . . . . . . . . . . . . 155
Figure 2.2.13-3 Contributors to variation . . . . . . . . . . . . . . . . . . . . . . . . . . . . . . . . . . . . . . . 156
Figure 2.2.13-4 Prediction for a stable process based on standard deviation. . . . . . . . . . 156
Table 2.2.13-1 Translation of process capability measure . . . . . . . . . . . . . . . . . . . . . . . . . 157
Table 2.2.13-2 Example of process capacity sheet. . . . . . . . . . . . . . . . . . . . . . . . . . . . . . . . 158
Figure 2.2.13-5 Spaghetti diagram showing the flow of materials through an operation . . . . . . . . . . . . . . . . . . . . . . . . . . . . . . . . . . . . . . . . . . . . . . . . . . . . . 159
Figure 2.2.13-6 The organization as a series of processes working together to serve customers . . . . . . . . . . . . . . . . . . . . . . . . . . . . . . . . . . . . . . . . . . . . . . . . . . . . 160
Figure 2.2.14-1 Example of a supermarket pull system . . . . . . . . . . . . . . . . . . . . . . . . . . . 161
Figure 2.2.14-2 Example of a sequential pull system . . . . . . . . . . . . . . . . . . . . . . . . . . . . . . 162
Figure 2.2.14-3 Example of a mixed pull system . . . . . . . . . . . . . . . . . . . . . . . . . . . . . . . . . 162
Table 2.2.15-1 Examples of knowledge waste . . . . . . . . . . . . . . . . . . . . . . . . . . . . . . . . . . . 165
Figure 2.3.1-1 Value stream map system broken down into processes and tasks . . . . . 168
Figure 2.3.1.1-1 High-level flowchart for a request-for-quote process . . . . . . . . . . . . . . . . 169
Figure 2.3.1.1-2 Detail-level flowchart for a request-for-quote process . . . . . . . . . . . . . . . 170
Figure 2.3.1.2-1 Analytical process chart for a LEGO block manufacturing process . . . . 173
H1403_Manos_pi_410.indd 13 5/25/12 11:32 AM
xiv List of Figures and Tables
Figure 2.3.1.2-2 Alternate example of an analytical process chart for a LEGO block manufacturing process . . . . . . . . . . . . . . . . . . . . . . . . . . . . . . . . . . . . . . . . . 174
Figure 2.3.1.3-1 The process of value stream mapping . . . . . . . . . . . . . . . . . . . . . . . . . . . . 175
Figure 2.3.1.3-2 Example of a product family matrix . . . . . . . . . . . . . . . . . . . . . . . . . . . . . . 175
Figure 2.3.1.3-3 Basic structure of the value stream map . . . . . . . . . . . . . . . . . . . . . . . . . . . 177
Figure 2.3.1.3-4 Value stream map components . . . . . . . . . . . . . . . . . . . . . . . . . . . . . . . . . . 178
Figure 2.3.1.3-5 Common value stream mapping icons . . . . . . . . . . . . . . . . . . . . . . . . . . . . 179
Figure 2.3.1.4-1 Takt time analysis of processes in a value stream . . . . . . . . . . . . . . . . . . . 181
Table 2.3.1.4-1 Takt time analysis of services in an organization . . . . . . . . . . . . . . . . . . . 181
Figure 2.3.1.4-2 Line balancing example: current state . . . . . . . . . . . . . . . . . . . . . . . . . . . . 182
Figure 2.3.1.4-3 Line balancing example: current state (bar chart format) . . . . . . . . . . . . 183
Figure 2.3.1.4-4 Line balancing example: future state option 1 . . . . . . . . . . . . . . . . . . . . . . 183
Figure 2.3.1.4-5 Line balancing example: future state option 1 (bar chart format) . . . . . 184
Figure 2.3.1.4-6 Line balancing example: future state option 2 . . . . . . . . . . . . . . . . . . . . . . 184
Figure 2.3.1.4-7 Line balancing example: future state option 2 (bar chart format) . . . . . 185
Figure 2.3.1.4-8 Line balancing example: current state (modified bar chart format) . . . . 185
Figure 2.3.1.4-9 Line balancing example: ideal state (modified bar chart format) . . . . . . 186
Figure 2.3.2.1-1 Histogram with a normal distribution . . . . . . . . . . . . . . . . . . . . . . . . . . . . 188
Figure 2.3.2.1-2 Histogram with negatively skewed data . . . . . . . . . . . . . . . . . . . . . . . . . . 189
Figure 2.3.2.1-3 Histogram with a bimodal distribution . . . . . . . . . . . . . . . . . . . . . . . . . . . 189
Table 2.3.2.2-1 Example of a Pareto data table . . . . . . . . . . . . . . . . . . . . . . . . . . . . . . . . . . . 192
Table 2.3.2.2-2 Example of a Pareto data table . . . . . . . . . . . . . . . . . . . . . . . . . . . . . . . . . . . 192
Figure 2.3.2.2-1 Example Pareto chart . . . . . . . . . . . . . . . . . . . . . . . . . . . . . . . . . . . . . . . . . . . 193
Table 2.3.2.3-1 Example of a check sheet for errors on an essay test . . . . . . . . . . . . . . . . 195
Figure 2.3.2.3-1 Example of a check sheet (pictogram) of rust location occurrences on a car door at a service center . . . . . . . . . . . . . . . . . . . . . . . . . . . . . . . . . . 195
Figure 2.3.3.1-1 Example of a CE (fishbone) diagram with Toyota’s 4 Ms . . . . . . . . . . . . 197
Table 2.3.3.2-1 Example of 5-Whys . . . . . . . . . . . . . . . . . . . . . . . . . . . . . . . . . . . . . . . . . . . . 199
Table 2.3.3.3-1 Steps to construct an FMEA . . . . . . . . . . . . . . . . . . . . . . . . . . . . . . . . . . . . . 201
Figure 2.3.3.3-1 Example of a process FMEA . . . . . . . . . . . . . . . . . . . . . . . . . . . . . . . . . . . . . 203
Table 2.3.4-1 Examples of various analysis tools compared with variation and audience types . . . . . . . . . . . . . . . . . . . . . . . . . . . . . . . . . . . . . . . . . . . . . . . . 204
Figure 2.3.4.1-1 Common causes versus special causes . . . . . . . . . . . . . . . . . . . . . . . . . . . . 205
Figure 2.3.4.1-2 Special causes mapping . . . . . . . . . . . . . . . . . . . . . . . . . . . . . . . . . . . . . . . . 206
Figure 2.3.4.1-3 Example of X bar-R chart . . . . . . . . . . . . . . . . . . . . . . . . . . . . . . . . . . . . . . . 207
Figure 2.3.4.1-4 CTQ tree . . . . . . . . . . . . . . . . . . . . . . . . . . . . . . . . . . . . . . . . . . . . . . . . . . . . . 208
Figure 2.3.4.2-1 Example of a scatter diagram . . . . . . . . . . . . . . . . . . . . . . . . . . . . . . . . . . . . 210
Table 2.3.4.2-1 Scatter diagram data . . . . . . . . . . . . . . . . . . . . . . . . . . . . . . . . . . . . . . . . . . . 211
Figure 2.3.4.2-2 Correlation examples from a scatter diagram . . . . . . . . . . . . . . . . . . . . . . 211
Figure 2.3.4.2-3 Example of a concentration diagram . . . . . . . . . . . . . . . . . . . . . . . . . . . . . 213
Figure 2.3.4.2-4 Example of the 1040EZ tax form showing where certain types of documentation errors occur . . . . . . . . . . . . . . . . . . . . . . . . . . . . . . . . . . . . . 214
Figure 2.3.5-1 Product development life cycle showing concurrent engineering versus traditional engineering . . . . . . . . . . . . . . . . . . . . . . . . . . . . . . . . . . . . . . . . . 216
H1403_Manos_pi_410.indd 14 5/25/12 11:32 AM
List of Figures and Tables xv
Figure 2.3.5-2 Fewer design changes and reduced product development time for the Japanese automobile . . . . . . . . . . . . . . . . . . . . . . . . . . . . . . . . . . . . . . . . . . . 216
Figure 2.3.5.2-1 House of Quality . . . . . . . . . . . . . . . . . . . . . . . . . . . . . . . . . . . . . . . . . . . . . . 219
Figure 2.3.5.2-2 Sequence of QFD matrices for product, part, and process planning . . . 221
Figure 2.3.5.2-3 Example of a simplified QFD matrix for a car door. . . . . . . . . . . . . . . . . 222
Figure 2.3.5.4-1 Breakthrough improvement . . . . . . . . . . . . . . . . . . . . . . . . . . . . . . . . . . . . . 224
Figure 2.3.5.4-2 Product life cycle . . . . . . . . . . . . . . . . . . . . . . . . . . . . . . . . . . . . . . . . . . . . . . 225
Figure 2.3.5.5-1 Effect of Cp against specification limits . . . . . . . . . . . . . . . . . . . . . . . . . . . . 232
Table 2.3.5.5-1 Correlation of Cp with sigma levels . . . . . . . . . . . . . . . . . . . . . . . . . . . . . . . 232
Figure 2.3.5.5-2 Quality loss function . . . . . . . . . . . . . . . . . . . . . . . . . . . . . . . . . . . . . . . . . . . 233
Figure 2.3.6.1-1 Kaizen in 10 steps . . . . . . . . . . . . . . . . . . . . . . . . . . . . . . . . . . . . . . . . . . . . . . 238
Figure 2.3.7.1-1 Example of a prevent device for poka-yoke . . . . . . . . . . . . . . . . . . . . . . . . 243
Figure 2.3.7.1-2 Example of a detect device for poka-yoke . . . . . . . . . . . . . . . . . . . . . . . . . 244
Figure 2.3.7.2-1 Breakdown of typical changeover time components . . . . . . . . . . . . . . . . 245
Figure 2.3.7.2-2 Four steps to reducing setups . . . . . . . . . . . . . . . . . . . . . . . . . . . . . . . . . . . 246
Figure 2.3.7.3-1 Simplified printed circuit board population process flow . . . . . . . . . . . . 247
Figure 2.3.7.4-1 Suggested right-sized equipment process flow . . . . . . . . . . . . . . . . . . . . . 249
Figure 2.3.7.4-2 “Process at a glance” sheet . . . . . . . . . . . . . . . . . . . . . . . . . . . . . . . . . . . . . . 250
Table 2.3.7.4-1 Example of right-sized equipment criteria for selection . . . . . . . . . . . . . 251
Figure 2.3.7.5-1 Example of part-quantity-process chart . . . . . . . . . . . . . . . . . . . . . . . . . . . 253
Figure 2.3.7.5-2 Example of a U-shaped cell layout . . . . . . . . . . . . . . . . . . . . . . . . . . . . . . . 254
Figure 2.3.7.5-3 Photo of a U-shaped cell layout . . . . . . . . . . . . . . . . . . . . . . . . . . . . . . . . . . 254
Figure 2.3.7.5-4 Example of a production output chart . . . . . . . . . . . . . . . . . . . . . . . . . . . . 255
Figure 2.3.7.7-1 Example of production and withdrawal kanbans . . . . . . . . . . . . . . . . . . . 258
Figure 2.3.8.1-1 Traditional supply chain . . . . . . . . . . . . . . . . . . . . . . . . . . . . . . . . . . . . . . . . 262
Figure 2.3.8.1-2 Example of supplier managed inventory . . . . . . . . . . . . . . . . . . . . . . . . . . 263
Figure 2.3.8.1-3 Example of supplier managed inventory based on customer pitch . . . . 264
Figure 2.3.8.2-1 Example of cross-docking . . . . . . . . . . . . . . . . . . . . . . . . . . . . . . . . . . . . . . . 265
Figure 2.3.9.1-1 Traditional material handling . . . . . . . . . . . . . . . . . . . . . . . . . . . . . . . . . . . 269
Table 2.3.9.1-1 Material handling index of liveliness . . . . . . . . . . . . . . . . . . . . . . . . . . . . . 270
Figure 2.3.9.1-2 Example of material handling index of liveliness . . . . . . . . . . . . . . . . . . . 271
Figure 2.3.9.1-3 Example of an internal milk run . . . . . . . . . . . . . . . . . . . . . . . . . . . . . . . . . 272
Figure 2.3.9.1-4 Example of a production line/process support material handling system . . . . . . . . . . . . . . . . . . . . . . . . . . . . . . . . . . . . . . . . . . . . . . . . . . . . . . . 272
Figure 2.3.9.2-1 Transversal order picking method . . . . . . . . . . . . . . . . . . . . . . . . . . . . . . . . 274
Figure 2.3.9.2-2 Midpoint order picking method . . . . . . . . . . . . . . . . . . . . . . . . . . . . . . . . . 274
Figure 2.3.9.2-3 Largest gap order picking method . . . . . . . . . . . . . . . . . . . . . . . . . . . . . . . 275
Module 3Figure 3.1.1-1 Management focus—traditional thinking versus systems thinking . . . 279
Figure 3.1.1.1-1 The systems-thinking organization . . . . . . . . . . . . . . . . . . . . . . . . . . . . . . . 280
Figure 3.1.1.3-1 Deming PDCA wheel . . . . . . . . . . . . . . . . . . . . . . . . . . . . . . . . . . . . . . . . . . 283
Figure 3.1.1.3-2 Leader standard work keeps the improvement loop closed . . . . . . . . . . 284
H1403_Manos_pi_410.indd 15 5/25/12 11:32 AM
xvi List of Figures and Tables
Table 3.1.2-1 Purpose statement examples . . . . . . . . . . . . . . . . . . . . . . . . . . . . . . . . . . . . 286
Figure 3.2.1-1 Enterprise thinking—organizational structure, spirit, and focus diagram . . . . . . . . . . . . . . . . . . . . . . . . . . . . . . . . . . . . . . . . . . . . . . . . . . . . . . 291
Figure 3.2.1.1-1 Office cells . . . . . . . . . . . . . . . . . . . . . . . . . . . . . . . . . . . . . . . . . . . . . . . . . . . . 293
Table 3.2.1.2-1 Box score example . . . . . . . . . . . . . . . . . . . . . . . . . . . . . . . . . . . . . . . . . . . . . 294
Table 3.2.1.4-1 Costing . . . . . . . . . . . . . . . . . . . . . . . . . . . . . . . . . . . . . . . . . . . . . . . . . . . . . . . 296
Figure 3.2.1.4-1 Example of center for excellence . . . . . . . . . . . . . . . . . . . . . . . . . . . . . . . . . 297
Table 3.2.2-1 Methods to create a strategic direction . . . . . . . . . . . . . . . . . . . . . . . . . . . . 298
Figure 3.2.2.5-1 X-matrix example . . . . . . . . . . . . . . . . . . . . . . . . . . . . . . . . . . . . . . . . . . . . . . 303
Table 3.2.2.5-1 Correlation symbols . . . . . . . . . . . . . . . . . . . . . . . . . . . . . . . . . . . . . . . . . . . . 304
Figure 3.2.2.5-2 Tree diagram example . . . . . . . . . . . . . . . . . . . . . . . . . . . . . . . . . . . . . . . . . . 304
Table 3.2.2.6-1 Communication plan example . . . . . . . . . . . . . . . . . . . . . . . . . . . . . . . . . . . 305
Figure 3.3.1-1 Sample A3 format. . . . . . . . . . . . . . . . . . . . . . . . . . . . . . . . . . . . . . . . . . . . . . 308
Figure 3.3.1-2 Sample A3 for knowledge capture . . . . . . . . . . . . . . . . . . . . . . . . . . . . . . . 308
Figure 3.3.1-3 Sample A3 for VOC with Instructions to complete . . . . . . . . . . . . . . . . . . 309
Figure 3.3.3-1 Cross-training matrix . . . . . . . . . . . . . . . . . . . . . . . . . . . . . . . . . . . . . . . . . . . 312
Module 4Table 4.2.1.5-1 Operational performance measure linkages . . . . . . . . . . . . . . . . . . . . . . . 330
Figure 4.2.1.5-1 Box score example . . . . . . . . . . . . . . . . . . . . . . . . . . . . . . . . . . . . . . . . . . . . . 332
Figure 4.2.1.6-1 VOC and VOP. . . . . . . . . . . . . . . . . . . . . . . . . . . . . . . . . . . . . . . . . . . . . . . . . 335
Table 4.2.1.6-1 Examples of VOC in lean applications . . . . . . . . . . . . . . . . . . . . . . . . . . . . 337
Figure 4.2.1.6-2 PDSA for VOC . . . . . . . . . . . . . . . . . . . . . . . . . . . . . . . . . . . . . . . . . . . . . . . . 338
Table 4.2.2-1 Example of goal with associated objectives . . . . . . . . . . . . . . . . . . . . . . . . 339
Figure 4.2.2-1 PDCA and goals . . . . . . . . . . . . . . . . . . . . . . . . . . . . . . . . . . . . . . . . . . . . . . . 340
Figure 4.3.2.2-1 Takt time–process cycle time chart . . . . . . . . . . . . . . . . . . . . . . . . . . . . . . . 352
Table 4.3.2.2-1 Overproduction or bottleneck . . . . . . . . . . . . . . . . . . . . . . . . . . . . . . . . . . . 353
Figure 4.3.3.4-1 A visual representation of OEE . . . . . . . . . . . . . . . . . . . . . . . . . . . . . . . . . . 362
Table 4.3.3.4-1 OEE by shift comparison . . . . . . . . . . . . . . . . . . . . . . . . . . . . . . . . . . . . . . . 364
Table 4.3.3.4-2 Average method of calculating value stream OEE . . . . . . . . . . . . . . . . . . 365
Table 4.3.3.4-3 Weighted average method of calculating value stream OEE . . . . . . . . . 365
Table 4.3.3.4-4 The Six Big Losses . . . . . . . . . . . . . . . . . . . . . . . . . . . . . . . . . . . . . . . . . . . . . 366
Table 4.3.3.4-5 Overall labor efficiency definitions . . . . . . . . . . . . . . . . . . . . . . . . . . . . . . . 367
Table 4.3.3.4-6 OLE example. . . . . . . . . . . . . . . . . . . . . . . . . . . . . . . . . . . . . . . . . . . . . . . . . . 368
Table 4.3.3.5-1 Example: customer demand of the assembly process for a single week . . . . . . . . . . . . . . . . . . . . . . . . . . . . . . . . . . . . . . . . . . . . . . . . . . . 370
Table 4.3.3.5-2 Example: total daily changeover time per day after standard scheduling . . . . . . . . . . . . . . . . . . . . . . . . . . . . . . . . . . . . . . . . . . . . . . . . . . . . 370
Table 4.3.3.5-3 Example: changeover times . . . . . . . . . . . . . . . . . . . . . . . . . . . . . . . . . . . . . 370
Table 4.3.3.5-4 Example: level schedule . . . . . . . . . . . . . . . . . . . . . . . . . . . . . . . . . . . . . . . . 371
Table 4.3.4.1-1 Lean measures associated with cash flow . . . . . . . . . . . . . . . . . . . . . . . . . 372
H1403_Manos_pi_410.indd 16 5/25/12 11:32 AM
xvii
ForewordRobert D. MillerExecutive Director
The Shingo Prize for Operational ExcellenceJon M. Huntsman School of Business
Utah State University
The Lean Handbook is a terrific compilation of sections written by practitio n-ers who bring their individual and unique experience and expertise to this body of knowledge. I appreciate the connections made with many of the
dimensions and principles identified in the Shingo model. We must each be on a journey of continuous improvement, which means we must be constantly looking for new perspectives and approaches to bring about personal and organizational improvement.
Anthony Manos is correct when he says that the most difficult and yet impor-tant work we will do with lean is to change the culture of the organization. For lean to be successful, the many tools outlined in this handbook must be supple-mented with an equally devoted effort to influence the mind- sets and behaviors of people in the organization. At the Shingo Prize we have learned that the best way to do this is to, as Stephen Covey would say, “begin with the end in mind.” In other words, while you are learning to use these great tools, you must also keep the deeper meaning, or the “why” behind the tools, very clear. The Lean Handbook can help each of us act our way into a new way of thinking, and then think our way into a new way of acting. By putting the wisdom of this handbook to work every day by every person and never taking your eyes off the prize—a new culture that is deeply embedded in the principles of lean—we will greatly increase the odds of a sustainable business transformation.
As you put this work into practice, you will recognize the shifting roles of leaders and managers in your organization. It is not enough for leaders to just keep doing what they have always done, nor is it enough for them to merely sup-port the work of others. Rather, leaders must lead the cultural transformation and build the principles behind all of these great tools into the mind- sets of their asso-ciates. Similarly, managers have to do more than participate in kaizen teams. The emerging role of managers is to focus on designing, aligning, and improving the systems of the business so that they drive ideal behaviors that cause people to change their thinking of what excellence really looks like.
Using The Lean Handbook as a roadmap will no doubt be a powerful tool in helping you avoid many of the mistakes made by others over the years. I invite you to visit http://www.shingoprize.org to see how the key points illustrated here support the Shingo model for operational excellence. My thanks to all of the contributing authors!
H1403_Manos_pi_410.indd 17 5/25/12 11:32 AM

H1403_Manos_pi_410.indd 18 5/25/12 11:32 AM
xix
Preface
WeLCoMe To the Lean handbookWhat a remarkable journey this has been. Working on this book has been a ter-rific experience. We have had the great pleasure of working with a number of wonderful and giving individuals. Lean practitioners are truly an amazing and unique family. The energy and willingness of the individuals who helped create this book are evidence of the great profession and network of people of which we take part. So many different points of view and applications of knowledge made for great discussions, contemplation, and collaboration. With so much knowledge and understanding, it was difficult to find a point at which to stop talking and start putting these discussions on paper. In the end, we believe this book embodies the Lean Body of Knowledge (BOK) in a way that is much like the lean journey—ever evolving and always adaptable.
Lean has been a culmination of multiple individuals, philosophies, systems, tools, and applications throughout history. The challenge has been that all these different contributions are found in different places, called different things, and applied in different manners—making it difficult for the lean practitioner to gain an understanding of lean at a level of its full body of knowledge without great effort, research, experience, and networking. While this book is not a substitute for the effort, research, experience, and networking every seasoned lean practitioner goes through, we hope it provides a sound starting point for those just beginning or expanding their knowledge of lean.
NoT aN exaM PreParaTioN MaNuaLFirst and foremost, this book is not a Lean Certification exam preparation manual. The Lean Bronze Certification exam questions are based on material from the five recommended reading books (see Appendix B, “Recommended Reading List for Lean Certification Exam Preparation”):
• Learning to See
• Lean Thinking
• Gemba Kaizen
• Lean Production Simplified
• Lean Hospitals
H1403_Manos_pi_410.indd 19 5/25/12 11:32 AM
xx Preface
Make no mistake—this book takes nothing away from the great lean works that have preceded it. As a matter of fact, we believe that this book complements and pays tribute to those works as being pieces of the larger Lean BOK. But that is exactly what they are—pieces. Our intent was to put these pieces together in a manner to provide a higher- level overview of the Lean BOK. We realized early on in the project that this task was not something we could do alone.
This handbook’s intention is to gather information related to the Lean BOK (see Appendix A, “Lean Certification Body of Knowledge”) into one source. This book will enhance your understanding of the BOK as a whole and give you a more holistic look at lean. As great as the five recommended reading books are, they were not written with the intent of covering all aspects of the Lean BOK individu-ally. Additionally, this book does not rehash the content of the five recommended reading books. What we have done is put together a book whose sole purpose is to embody the entire Lean BOK, section by section. This book is, by design, written at the Bronze Level for certification knowledge. This means that the weightings used in the Lean BOK for the Bronze Certification were considered for the depth and breadth of material considered for each rubric. Therefore, it is by no means all inclusive of every principle, system, and tool at every level of application related to lean.
By addressing the Lean BOK at the Bronze Level, this book provides a basic understanding of the lean principles, systems, and tools at a tactical level to drive improvements with measureable results. The intent is to revise the book over time to encompass the topics of the Silver Level (an integrated application on value stream transformations for lean leaders) and the Gold Level (for strate-gic application of lean across the entire enterprise, with emphasis on assets, sys-tems, processes, and people). Therefore, this book, much like a lean journey in an organization, will be adapted as the Lean BOK evolves and more knowledge is integrated.
Given that the intent of this book is not to rehash the certification reference books, we hope that this book serves as a good starting point for those practition-ers who want a holistic view of the Lean BOK, with links to many other lean refer-ences for greater detail and understanding. While there are many references, we tried to stay true to the terminology and applications discussed in the core books of the certification reading list.
One of the difficulties we faced in creating a book of this magnitude was how to structure it. While we could have structured it alphabetically by topic, organized it by case studies or by organizations, or arranged it by some other method, we wanted to stay true to the Lean BOK structure. While this structure does not allow for a nice flow from one topic to another for easier reading, the writing conforms to the Lean BOK and the Shingo Prize model. We thought that this would provide a traceable reference for those individuals and organizations utilizing those struc-tures for the pursuit of operational excellence.
When lean is applied in an organization, the knowledge of the processes and the generation of ideas do not come from the organization’s designated lean experts. They come from those who perform the work on a daily basis. We took the same approach with this book. It would have been easy for us to read all the books and then pull information from those books to create another book. But then it would have been just that—another book. We needed to take a lean approach with this book. So, just as you would create a team of individuals who perform the
H1403_Manos_pi_410.indd 20 5/25/12 11:32 AM
Preface xxi
work in a kaizen event, we assembled a team of individuals who perform the work and who apply lean in their organizations every day.
MaNy VoiCes aNd MaNy sTyLesWe were lucky to have some of the best minds in lean contribute to this endeavor (see “Contributing Authors and Editors”). There are many voices, many contribu-tors, many styles of writing, and more than one point of view. The contributing authors come from many different backgrounds. Such different life experiences weave a wonderful lean tapestry. This book is not just lean for manufacturing—or lean for service or lean for healthcare. The examples given in this book can fit any type of organization. We hope you find these different points of view helpful while finding your voice in lean.
It has been a pleasure to not only be authors and share our knowledge of lean but also be editors and work closely with others like us. The great thing about working with all these individuals was learning how they apply the same things we apply, but maybe just a little differently. These differences provided us a dif-ferent perspective on our version of lean and were wonderful opportunities to expand our personal lean knowledge base.
Coming together is a beginning. Keeping together is progress. Working together is success.
—Henry Ford
We wish you the best of luck and fair weather on your lean journey!
H1403_Manos_pi_410.indd 21 5/25/12 11:32 AM

H1403_Manos_pi_410.indd 22 5/25/12 11:32 AM
xxiii
acknowledgments
It would be nearly impossible to mention everyone who had an influence on the creation of this lean handbook, but we would like to make a few special mentions.First and foremost we would like to thank all the contributing authors, who
worked tirelessly to help construct and shape this handbook. Their willingness to share their knowledge and experience was exceptional. To learn more about these extraordinary lean thinkers, see “Contributing Authors.” A special acknowledg-ment goes to all the people and organizations that the contributing authors and editors have worked with over the years to help develop and deepen our under-standing of lean and influence us as we continue to learn more.
This handbook would not have been possible without the support of the Lean Enterprise Division (LED) of the American Society for Quality (ASQ) and the LED Leadership Team—Kiami Rogers (chair), Frank Murdock (chair-elect), and Tammy Miller (secretary). We would also like to thank George Alukal, founding member of the LED and the driving force behind lean’s becoming an integral part of ASQ and a resource for its members.
The Lean Certification is supported by the four alliance partners: the Society of Manufacturing Engineers (http://www.sme.org), the Association for Manufac-turing Excellence (http://www.ame.org), the Shingo Prize (http://www.shingo prize.org), and of course ASQ (http://www.asq.org).
We would like to thank Kris Nasiatka from the Society of Manufacturing Engi-neers (SME) for all her efforts in creating the Lean Certification and for her con-tinued support of the partner organizations and this lean handbook. Also from SME, Kelly Lacroix leads the Lean Certification Oversight and Appeals Commit-tee, which continually monitors and improves the certification process.
If it wasn’t for our friends Matt Meinholz and Paul O’Mara at ASQ Quality Press, this book never would have been completed. We appreciate their patience and advice while working on this endeavor.
Last, but not least, we would like to give our utmost gratitude to Robert Dame-lio. As a member volunteer, Robert not only was the driving force behind ASQ’s LED adopting the Lean BOK, but he also guided the certification initiative at ASQ. Without his tireless efforts, ASQ would not have been a partner member of the Lean Certification.
H1403_Manos_pi_410.indd 23 5/25/12 11:32 AM

H1403_Manos_pi_410.indd 24 5/25/12 11:32 AM

xxv
a Brief History of the Lean Certification Body of Knowledge
Kris Nasiatka, SME
HoW iT sTarTedThe publication of The Machine that Changed the World, in 1990, brought the concept of lean to the masses. It also provided opportunities for many different flavors of lean to be born. With that came a myriad of education, training, and consulting practices, each bringing its own version of lean to the market.
In 2001, members of the Society of Manufacturing Engineers (SME) and the Association for Manufacturing Excellence (AME), and constituents of the Shingo Prize came together and determined that some type of validation for professional practice of lean was necessary. There was a need to align practitioners with a com-mon foundation (fundamentals) of lean practice and, more importantly, provide a roadmap to support workforce development and training efforts. After a few stops and starts, development was under way in earnest in 2004.
The parties involved agreed that the Shingo Prize model should serve as the basis for the program’s Body of Knowledge (BOK). The initial BOK went deeply into evaluating lean practitioners’ job tasks. The model was modified to make it applicable to people and workforce development efforts versus being a corporate lean transformation model. The proposed Lean BOK was validated in a study in early 2005, thus launching version 2.0.
KaizeN BLiTz WeeKShortly after version 2.0 was launched, a core development committee was established. With the preliminary validation of the BOK in place, a straw man for program components was outlined. SME hosted a “blitz week” to expedite development of the program. Nearly 60 lean practitioners, representing a breadth of manufacturing industries, consulting practices, and academia, gathered for a week to develop the components of this new certification program. During the blitz, development teams were established to focus on exams, portfolios, and the mentoring requirements for this new program. Throughout the entire develop-ment process, nearly 200 lean practitioners were involved in the creation of this program not including the couple of thousands that participated in the study.
The first Bronze exam was offered to the public in March 2006. The Silver exam was available in June 2006, and the Gold exam was launched in December of that year. The formal Lean Certification Oversight and Appeals Committee was established and met for the first time in March 2006.
H1403_Manos_pi_410.indd 25 5/25/12 11:32 AM
xxvi A Brief History of the Lean Certification Body of Knowledge
uPdaTed VersioN oF THe BoKWith the program “live” for a year, a second BOK validation study was conducted. It was desired to structure the certification BOK similar to the Shingo Prize model. The Shingo Prize was restructuring its model, which created an opportunity for the certification program to validate proposed changes to the BOK received by certification candidates as well as the oversight body.
The validation study was completed in 2007. The Lean Certification Oversight and Appeals Committee used the findings to restructure the BOK and launched version 3.0 in 2008 (see Appendix A). Although the topics did not change, the BOK was reorganized for better flow and improved alignment of topics within each cat-egory. Each BOK validation study is structured in a way that derives a weighting factor for each section of the BOK. The weighting factors identify the percentage of exam coverage for each BOK area and help the committee identify priority areas for building the exam bank.
THe FuTure oF THe BoKValidation studies will be conducted every five to seven years. The studies are intended to verify that current topics are still relevant in contemporary practice of lean and to identify any new or emerging topics that should be added to the BOK.
H1403_Manos_pi_410.indd 26 5/25/12 11:32 AM
xxvii
This handbook is dedicated in loving memory to Wayne Paupst (1957–2010), past chairman of the Lean Enterprise Division (LED). In August 2010, Wayne lost a long battle with cancer. Wayne was a quality professional’s “quality
professional.” He never complained about his condition. In fact, many of us on the Leadership Team, which worked closely with Wayne, were not even aware of the severity of his condition. Wayne possessed a wonderful sense of humor and had a kind word for everyone. He was always ready with a joke, and always ready to laugh at jokes offered by others. His leadership, instruction, kindness, and humor will be missed by family and friends as well as organizations such as ASQ.
I first met Wayne at a meeting of the founders of the LED prior to the LED becoming a forum and subsequently a division. Wayne had been a member of ASQ since 1988. He had more than 25 years in the quality profession, holding posi-tions such as quality engineer, quality systems coordinator, inspector, and quality assurance manager. He had been instructing certification courses for the Lehigh Valley Section of ASQ since 1996 and also had provided instructional courses for many of the top companies in the Lehigh Valley as well. Wayne also held several ASQ certifications: Six Sigma Black Belt, Quality Engineer, Quality Manager, Qual-ity Auditor, Quality Technician, Quality Inspector, Process Analyst, and Quality Improvement Associate. It was during Wayne’s tenure as LED division chair that ASQ introduced the Lean Certification, in partnership with SME, AME, and the Shingo Prize organizations. I have no doubt that Wayne would have pursued obtaining the ASQ Lean Certification himself, as well as teaching and mentoring other lean professionals pursuing this certification. It is with great honor that we dedicate this handbook to Wayne.
special dedicationKiami Rogers
Chairperson, ASQ Lean Enterprise Division
H1403_Manos_pi_410.indd 27 5/25/12 11:32 AM

H1403_Manos_pi_410.indd 28 5/25/12 11:32 AM
xxix
The purpose of this handbook is to provide a reference guide for lean prin-ciples and methods. This handbook on its own is not intended to prepare one for the ASQ Lean Certification (in partnership with SME, AME, and
the Shingo Prize organizations). The user of this handbook is a lean professional who has some knowledge of and experience with lean principles and methods. Material from several lean practitioners with differing levels of disclosure of their experiences has been gathered to create this handbook and has been edited to be presented in a consistent and unified format.
With 6000 members worldwide, the ASQ Lean Enterprise Division (LED) is a global network of professionals helping individuals and organizations apply proven and leading- edge lean principles and practices to achieve dramatic results for personal and organizational success. Whether or not you are a member of the ASQ LED, we hope you find this handbook a useful guide in your lean journey.
PrologueKiami Rogers
Chairperson, ASQ Lean Enterprise Division
H1403_Manos_pi_410.indd 29 6/1/12 10:37 AM

H1403_Manos_pi_410.indd 30 5/25/12 11:32 AM
xxxi
This handbook was a large collaborative effort, and we would especially like to thank all the contributing authors, who shared their time and wisdom to help make this endeavor possible.
CoNTriBuTiNg auTHors
Christopher Abrey is a program manager with Northstar Aerospace in Bedford Park, Illinois. He earned a bachelor of engineering in manufacturing systems engi-neering from Coventry University, UK. He is a senior member of the Society of Manufacturing Engineers (SME) and a member of the Association of Manufactur-ing Excellence (AME). Christopher has more than 20 years of lean experience in manufacturing and recently completed the Lean Bronze Certification. He can be reached at [email protected].
Section
2.2.5. Total Productive Maintenance (including predictive)
Andy Carlino is cofounder and partner of the Lean Learning Center. In addition to over 20 years’ experience in real- world senior management, including president and COO, he has for the past 20 years been providing consulting, training, and coaching services from the boardroom to the shop floor to organizations across the globe. He has published numerous articles and is coauthor of The Hitchhiker’s Guide to Lean: Lessons from the Road. Andy is a frequent speaker for a variety of professional organizations and corporate conferences, including guest speaker for Clemson and Harvard University. He holds a BS in engineering and a BA in psy-chology and is a member of SME, SAE, AME, ASQ, and numerous other industry and professional associations.
Sections
1.2.1. Planning & Deployment
1.2.2. Create a Sense of Urgency
1.2.3. Modeling the Lean Principles, Values, Philosophies
1.2.7. Motivation, Empowerment & Involvement
Contributing authors and editors
H1403_Manos_pi_410.indd 31 5/25/12 11:32 AM
xxxii Contributing Authors and Editors
Adil Dalal is CEO of Pinnacle Process Solutions, Intl.; a keynote speaker; thought leader in lean, project management, and leadership; and author of The 12 Pillars of Project Excellence: A Lean Approach to Improving Project Results. He has earned MS degrees in engineering management and mechanical engineering. He is a Cer-tified Lean Bronze Professional, Certified Quality Engineer (CQE), Project Man-agement Professional (PMP), and Board Certified Executive Coach. He is the chair of ASQ’s Human Development & Leadership Division, and certification chair of the Lean Enterprise Division. He served on the Lean Certification Oversight and Appeals Committee. He can be reached at [email protected].
Sections
1. Cultural Enablers
1.1. Principles of Cultural Enablers
1.1.1. Respect for the Individual
4.3.5. Competitive Impact
Grace Duffy is president of Management and Performance Systems. She holds an MBA from Georgia State University and has coauthored numerous books: The Quality Improvement Handbook, Executive Guide to Improvement and Change, Executive Focus: Your Life and Career, The Public Health Quality Improvement Handbook, QFD and Lean Six Sigma for Public Health, Modular Kaizen: Dealing with Disruption, and Tools and Applications for Starting and Sustaining Healthy Teams. She is an ASQ Cer-tified Manager of Quality/Organizational Excellence (CMQ/OE), Improvement Associate, Auditor, Lean Six Sigma Master Black Belt (LSS MBB), and ASQ Fellow.
Section
2.2.8. Strategic Business Assessment
David S. Foxx is a senior manager and Champion of the Continuous Process Improvement Community of Practice at Deloitte Consulting. He earned an MBA at the University of Phoenix and a bachelor of science in industrial engineering at the University of Texas at El Paso. David is a leader in enterprise transformation and specializes in innovation, product, process, and service design. David pre-sented “Total Quality Design—An Imperative for Survival” at the Annual Quality Congress. He is a senior member of ASQ and a member of the ASQ Quality Press Standing Review Board, the Institute of Industrial Engineers (IIE), and the Inter-national Society of Six Sigma Professionals (ISSSP). His certifications include ASQ Certified Six Sigma Black Belt (CSSBB), LSS MBB, Lean Master, and Design and Innovation Master Black Belt. He can be reached at [email protected].
Sections
2.1.2.2. 7 Wastes (Muda), Fluctuation (Mura), and Overburden (Muri)
2.3.5. Product and Service Design
2.3.5.1. Concurrent Engineering
H1403_Manos_pi_410.indd 32 5/25/12 11:32 AM
Contributing Authors and Editors xxxiii
2.3.5.2. Quality Function Deployment
2.3.5.3. Product or Process Benchmarking
2.3.5.4. Design for Product Life Cycle (DFx)—Cradle to Cradle
2.3.5.5. Variety Reduction—Product and Component
2.3.5.6. Design for Manufacturability
4.3.2. Delivery
4.3.2.1. Takt Time
4.3.2.2. Cycle Time
4.3.2.3. Lead Time
Dr. Gwendolyn Galsworth is president and founder of Visual Thinking, a train-ing, research, and consulting firm, and the VTI/Visual-Lean Institute, which offers licensing and train- the-trainer in nine core visual workplace courses. Over some 30 years of hands- on implementations, Gwendolyn has nearly single- handedly created the models, concepts, and methods of workplace visuality that define visual’s distinct and powerful contribution to enterprise excellence—and to sus-tainable cultural and bottom- line results. Gwendolyn serves as a Shingo Prize examiner. She is the author of Visual Systems: Harnessing the Power of the Visual Workplace; Smart, Simple Design: Using Variety Effectiveness to Reduce Total Cost and Maximize Customer Selection; two Shingo award- winning books, Visual Workplace, Visual Thinking: Creating Enterprise Excellence through the Technologies of the Visual Workplace and Work That Makes Sense; and many DVDs. She can be reached at [email protected].
Section
2.2.1. Visual Workplace
Bruce Hamilton is president of the Greater Boston Manufacturing Partnership, headquartered at the University of Massachusetts Boston campus. He attended Bowdoin College and earned a BA from the University of Arizona. Bruce is the creator of Toast Kaizen and other lean training videos, and also coauthor with Pat Wardwell of the e2 Continuous Improvement System Manual. He posts weekly to his blog: http://www.oldleandude.org. Both a recipient of the Shingo Prize and an inductee into the Shingo Prize Academy, Bruce is also a Shingo Prize exam-iner and a member of the Shingo Prize Board of Governors. He can be reached at [email protected].
Sections (with Pat Wardwell)
2.1.2. Identification & Elimination of Barriers to Flow
2.1.2.1. Flow & the Economies of Flow
2.1.2.3. Connect & Align Value Added Work Fragments
2.1.2.4. Organize around Flow
H1403_Manos_pi_410.indd 33 5/25/12 11:32 AM
xxxiv Contributing Authors and Editors
2.1.2.5. Make End- to-End Flow Visible
2.1.2.6. Manage the Flow Visually
2.3.7.1. Mistake and Error Proofing (Poka Yoke)
2.3.7.4. Right Sized Equipment
2.3.7.5. Cellular Flow
John Kendrick is a principal with Fujitsu in Sunnyvale, California, and has more than 15 years of lean experience in manufacturing, finance, telecommunications, and healthcare. John holds a master of engineering degree in simulation and modeling from Arizona State University, a master of applied statistics from Penn State, and a master of business administration in finance from the University of Pittsburgh. He is a Certified Six Sigma Master Black Belt (CSS MBB) and a senior member of ASQ. He is also a CSSBB, Certified Reliability Engineer (CRE), Certified Software Quality Englineer (CSQE), and CMQ/OE and holds two Lean Certifications.
Sections
2.3.1. Work Flow Analysis
2.3.1.1. Flowcharting
2.3.1.2. Flow Analysis Charts
2.3.1.3. Value Stream Mapping
2.3.1.4. Takt Time Analysis
4.2.1. Measurement
4.2.1.1. Understand Interdependencies between Measures and Measurement Categories
4.2.1.2. Align Internal Measures with What Matters to Customers
4.2.1.3. Measure the Results from the “Whole” System
4.2.1.4. Measure Flow and Waste
4.2.3. Analysis—Understand What Moves the Dial on Measures
4.2.4. Reporting
4.2.4.1. Visible Feedback Real- Time
Matthew Maio is a quality manager at Raytheon IDS in White Sands, New Mexico. He earned bachelor’s degrees in business and computer science from the College of Santa Fe, New Mexico. He is the author of Quality Improvement Made Simple . . . and Fast! and coauthor of The Six Sigma Green Belt Handbook (both from ASQ Qual-ity Press). Matthew is a member of the International Test and Evaluation Associa-tion and the Directed Energy Professionals Society. He is a senior member of ASQ and past regional director (board member) and section chair of ASQ. He holds ASQ certification as a CQM/OE, CSSBB, Certified Six Sigma Green Belt (CSSGB),
H1403_Manos_pi_410.indd 34 5/25/12 11:32 AM
Contributing Authors and Editors xxxv
CSQE, and Certified Quality Auditor (CQA) and Defense Acquisition University Lean Six Sigma Yellow Belt (LSSYB) and Process Quality Management (PQM) certification/recognition. He can be reached at [email protected].
Sections
1.2.4. Message Deployment—Establishing Vision and Direction
1.2.5. Integrating Learning and Coaching
1.2.6. People Development—Education, Training & Coaching
1.2.8. Environmental Systems
1.2.9. Safety Systems
2.1.5.1. Quality at the Source
2.1.5.4. Multi- Process Handling
2.2.6. Standard Work
2.2.7. Built- in Feedback
2.2.15. Knowledge Transfer
2.3.7.3. One Piece Flow
2.3.7.4. Right Sized Equipment
2.3.7.6. Sensible Automation
2.3.7.8. Source Inspection
David Mann is principal at David Mann Lean Consulting. He is the Shingo Prize–winning author of Creating a Lean Culture: Tools to Sustain Lean Conversions (Pro-ductivity Press). David serves on the editorial board of AME’s publication, Target, on the management science faculty at the Fischer College of Business at Ohio State University, and as a Shingo Prize examiner. He earned his PhD in psychology from the University of Michigan. He can be reached at [email protected].
Sections
2.1.1. Process Focus
3.1.1.3. Closed- Loop Thinking to Assure Effective Feedback of Organizational Learning
Anthony Manos is a catalyst with Profero and lean champion at 5S Supply in Frankfort, Illinois. He earned an MBA in entrepreneurial studies from the Univer-sity of Illinois at Chicago. He is the coauthor of Lean Kaizen: A Practical Approach to Process Improvement (ASQ Quality Press), a senior member of ASQ, senior member of SME, cofounder and past chair of ASQ’s Lean Enterprise Division, and a mem-ber of the Lean Certification Oversight and Appeals Committee. He is Lean Bronze Certified. He can be reached at [email protected].
H1403_Manos_pi_410.indd 35 5/25/12 11:32 AM
xxxvi Contributing Authors and Editors
Sections
1.1.2. Humility
1.3.5. Coaching & Mentoring
2.2.1.1. 5S Standards and Discipline
3.2.2. Policy Deployment/Strategy Deployment
4.3.5.1. Customer Satisfaction
Brian H. Maskell is president of BMA in Cherry Hill, New Jersey, and St. Albans, Hertfordshire, England. He has an engineering degree from the University of Sussex, England. Brian is certified with the Chartered Institute of Management Accountants (CIMA) in London, the American Institute of Certified Public Accoun-tants (AICPA), and the Institute of Management Accountants (IMA). He is a Fel-low of the American Production and Inventory Control Society (APICS). Brian is the author of eight books, including Making the Numbers Count: The Accountant as Change Agent on the World Class Team (second edition) and Practical Lean Account-ing: A Proven System for Measuring and Managing the Lean Enterprise (second edi-tion). He can be reached at [email protected].
Section
4.2.1.5. Lean Accounting
Timothy F. McMahon is the founder of and a contributor to A Lean Journey Blog (http://aleanjourney.com). He has a BS in chemical engineering from the Univer-sity of Massachusetts and holds a Lean Certification and Six Sigma Black Belt from Central Connecticut State University. Tim is a member of the regional board of directors for AME and currently serves as the VP of program for northeast region. He can be reached at [email protected].
Sections
1.3.1. Cross Training
1.3.3. Instructional Goals
1.3.6. Leadership Development
1.3.7. Teamwork
1.3.8. Information Sharing (Yokoten)
1.3.9. Suggestion Systems
2.2.14. Pull System
2.3.6. Organizing for Improvement
2.3.6.1. Kaizen Blitz Events
2.3.7. Countermeasure Activities
2.3.7.1. Mistake and Error Proofing (Poka Yoke)
H1403_Manos_pi_410.indd 36 5/25/12 11:32 AM
Contributing Authors and Editors xxxvii
2.3.7.2. Quick Changeover/Setup Reduction (SMED)
2.3.7.3. One Piece Flow
2.3.7.4. Right Sized Equipment
2.3.7.5. Cellular Flow
2.3.7.7. Material Signals (Kanban)
Dr. Mark W. Morgan is the associate vice president for institutional effectiveness and research at Seminole State College of Florida. Mark earned his doctorate in educational leadership from the University of Florida and is a three- time exam-iner for the Malcolm Baldrige National Quality Award. Mark was an improve-ment consultant for Fortune 500 companies for more than 10 years and is the author of three books on measurement and performance improvement, including his latest, The Path to Profitable Measures: 10 Steps to Feedback That Fuels Performance (ASQ Quality Press).
Section
4.1. Principles of Business Results
Frank Murdock is senior process engineer at Plymouth Tube Company in West Monroe, Louisiana. He earned a BS in engineering science at Purdue University, an MS in applied mathematics at the University of Michigan, and an MS in indus-trial engineering at Wayne State University. Frank spent 28 years with the Ford Motor Company, 8 years as an independent consultant, and 6 years as an adjunct professor at Lawrence Technological University. A senior member of ASQ and an ASQ Certified Six Sigma Black Belt, Frank is chair- elect for the Lean Enterprise Division as well as chair of the ASQ Voice of the Customer Committee. He can be reached at [email protected].
Section
4.2.1.6. Voice of the Customer
Mike Osterling has been a lean management practitioner and leader since the mid-1990s and is the lead consultant at Osterling Consulting, a San Diego–based firm. He earned an MBA in international business at San Diego State University and a BS in production and operations management. Mike coauthored The Kaizen Event Planner: Achieving Rapid Improvement in Office, Service, and Technical Environ-ments. He is a certified trainer for the implementation of lean manufacturing (Uni-versity of Kentucky) and a Lean Six Sigma Black Belt (University of California San Diego). He is certified in production and inventory management (APICS). He can be reached at [email protected].
Sections
2.1.5. Jidoka
2.1.7. Seek Perfection
H1403_Manos_pi_410.indd 37 5/25/12 11:32 AM
xxxviii Contributing Authors and Editors
Robert (Bob) Petruska works as a performance improvement consultant in Char-lotte, North Carolina. He has a master of science degree in manufacturing systems from Southern Illinois University. Bob is a senior member of ASQ and a CSSBB. Bob is authoring a book titled Gemba Walks for Service Excellence: The Step- by-Step Guide for Identifying Service Delighters, to be published in 2012 by Productivity Press.
Sections
3.2.1. Enterprise Thinking
3.2.1.1. Organize around Flow
3.2.1.2. Integrated Business System and Improvement System
3.2.1.3. Reconcile Reporting System
3.2.1.4. Information Management
Govind Ramu is a senior manager for global quality systems for SunPower Cor-poration. Prior to this role, he was Six Sigma Master Black Belt for JDS Uniphase Corporation. Govind is a professional engineer (mechanical) from Ontario, Can-ada, and an ASQ Fellow. He holds six ASQ certifications. Govind has had articles published in Quality Progress and in the Six Sigma forum. He coauthored ASQ’s The Certified Six Sigma Green Belt Handbook, for which he received the ASQ Golden Quill Award in 2008. Additionally, Govind was a 2006 and 2011 examiner for the California Awards (CAPE) and a 2010 examiner for the Malcolm Baldrige Award. He can be reached at [email protected].
Sections
2.1.5.1. Quality at the Source
2.1.7.1. Incremental Continuous Improvement (Kaizen)
2.2.9. Continuous Improvement Process Methodology
2.2.9.1. PDCA
2.2.9.2. DMAIC
2.2.9.3. Problem Solving Storyboards
2.2.10. Quality Systems
2.2.11. Corrective Action System
2.3.3.3. Failure Mode and Effects Analysis
2.3.4. Presenting Variation Data
2.3.4.1. Statistical Process Control Charts
2.3.4.2. Scatter and Concentration Diagrams
2.3.5.2. Quality Function Deployment
2.3.5.4. Design for Product Life Cycle (DFx)—Cradle to Cradle
2.3.5.6. Design for Manufacturability
H1403_Manos_pi_410.indd 38 5/25/12 11:32 AM
Contributing Authors and Editors xxxix
Rama Shankar is the managing partner at Delta Management Associates in Glen-view, Illinois. She has a master’s degree in engineering management from North-western University and a master’s degree in materials management from Indian Institute of Materials Management, India. Rama is the author of Process Improve-ment Using Six Sigma: A DMAIC Guide (ASQ Quality Press). She is a senior member of ASQ and a past chair, section director, and training institute director of the ASQ Chicago Section. Rama is a past Malcolm Baldrige Award examiner, an ASQ CSSBB, and a CQA. She is also a certified trainer by NIST for lean.
Sections
2.1.5. Jidoka
2.1.5.1. Quality at the Source
2.1.5.2. No Defects Passed Forward
2.1.5.3. Separate Man from Machine
2.1.5.4. Multi- Process Handling
2.1.5.5. Self Detection of Errors to Prevent Defects
2.1.5.6. Stop and Fix
With Tim McMahon
1.3.2. Skills Assessment
1.3.4. On- the-Job Training
1.3.6. Leadership Development
1.3.7. Teamwork
With Govind Ramu
2.2.9.1. PDCA
2.2.9.2. DMAIC
2.2.9.3. Problem Solving Storyboards
2.2.11. Corrective Action System
2.2.11.1. Root Cause Analysis
2.2.12. Project Management
2.3.2. Data Collection and Presentation
2.3.2.1. Histograms
2.3.2.2. Pareto Charts
2.3.2.3. Check Sheets
2.3.3. Identify Root Cause
2.3.3.1. Cause & Effect Diagrams (Fishbone)
H1403_Manos_pi_410.indd 39 5/25/12 11:32 AM
xl Contributing Authors and Editors
2.3.3.2. 5-Whys
2.3.3.3. Failure Mode and Effects Analysis
2.3.4. Presenting Variation Data
2.3.4.1. Statistical Process Control Charts
2.3.4.2. Scatter and Concentration Diagrams
Gregg Stocker is an operational excellence advisor at Hess Corporation in Hous-ton, Texas. He earned an MBA from the University of Houston and a BA from Michigan State University. Gregg is the author of Avoiding the Corporate Death Spi-ral: Recognizing & Eliminating the Signs of Decline (ASQ Quality Press). He is a certi-fied purchasing manager from the Institute for Supply Management. He can be reached at [email protected].
Sections
2.2.4. 3P Production Process Preparation
2.2.13. Process Design
3.1.1. Systemic Thinking
3.1.2. Constancy of Purpose
3.1.3. Social Responsibility
4.2.2. Goal and Objective Setting
Chad Vincent is a lean manufacturing specialist with Greif in St. Louis, Missouri. He earned a BS in engineering management from Missouri University of Science and Technology. Chad is a senior member of ASQ and SME, and the current ASQ Lean Enterprise treasurer. He serves on the Lean Certification Oversight and Appeals Committee. Chad is a CQE, CRE, CMQ/OE, CSSBB, and Lean Bronze Certified. He can be reached at [email protected].
Sections
2.1. Principles of Continuous Process Improvement
2.1.2.2. 7 Wastes (Muda), Fluctuation (Mura), and Overburden (Muri) (with David Foxx)
2.1.5.1. Quality at the Source (with Govind Ramu and Mark Paulson)
2.1.5.3. Separate Man from Machine
2.1.6. Integrate Improvement with Work
2.1.7. Seek Perfection
2.2. Continuous Process Improvement Systems
2.2.2. Lot Size Reduction
2.2.3. Load Leveling
H1403_Manos_pi_410.indd 40 5/25/12 11:32 AM
Contributing Authors and Editors xli
2.2.4. 3P Production Process Preparation
2.2.10. Quality Systems
2.2.10.1. ISO and Other Standards
2.2.11. Corrective Action System
2.3. Continuous Process Improvement Techniques & Practices
2.3.1. Work Flow Analysis
2.3.1.1. Flowcharting (with John Kendrick)
2.3.1.2. Flow Analysis Charts (with John Kendrick)
2.3.1.3. Value Stream Mapping
2.3.1.4. Takt Time Analysis (with Matt Maio)
2.3.8. Supplier Processes External
2.3.8.1. Supplier Managed Inventory
2.3.8.2. Cross- Docking
2.3.8.3. Supplier Assessment and Feedback
2.3.8.4. Supplier Development
2.3.8.5. Supplier Benchmarking
2.3.8.6. Logistics
2.3.9. Supply Processes Internal
2.3.9.1. Material Handling
2.3.9.2. Warehousing
2.3.9.3. Planning and Scheduling
4.3. Key Lean Related Measures
4.3.1. Quality
4.3.1.1. Rework
4.3.1.2. First Pass Yield
4.3.3. Cost
4.3.3.1. Inventory Turns
4.3.3.2. Queue Time
4.3.3.3. Wait Time (delays)
4.3.3.4. Overall Equipment Effectiveness (OEE)
4.3.3.5. Changeover Time
4.3.4. Financial Impact
4.3.4.1. Cash Flow
H1403_Manos_pi_410.indd 41 5/25/12 11:32 AM
xlii Contributing Authors and Editors
Pat Wardwell is the chief operating officer at Greater Boston Manufacturing Part-nership in Boston, Massachusetts. She holds a BA from the University of Maine and an MBA from Bentley College. Pat is the coauthor of e2 Continuous Improve-ment System. Her accomplishments include SME Lean Gold Certified, past chair of the Lean Certification Oversight and Appeals Committee, Shingo Prize recipient and examiner, AME Manufacturing Excellence Awards committee member and examiner, AME Northeast Board of Directors, and member of SME Boston Chapter Leadership Committee. She can be reached at [email protected].
Sections (with Bruce Hamilton)
2.1.2. Identification & Elimination of Barriers to Flow
2.1.2.1. Flow & the Economies of Flow
2.1.2.3. Connect & Align Value Added Work Fragments
2.1.2.4. Organize around Flow
2.1.2.5. Make End- to-End Flow Visible
2.1.2.6. Manage the Flow Visually
2.3.7.1. Mistake and Error Proofing (Poka Yoke)
2.3.7.4. Right Sized Equipment
2.3.7.5. Cellular Flow
Jerry M. Wright, P.E., is the senior vice president of lean and enterprise excellence for DJO Global in Vista, California. He earned an MBA in 2002 from the University of Phoenix and is a registered professional engineer in the state of California. He is the annual international conference chair for AME for Chicago in 2012 and also a west region director for AME. He is also the chair of the So Cal Lean Network, an affiliation of more than 75 companies focused on lean and sharing in South-ern California, as well as a Shingo Prize examiner and a previous Baldrige Award examiner. He can be reached at [email protected].
Sections
3.3.1. A3
3.3.2. Catchball
3.3.3. Redeployment of Resources
ediTorsAnthony Manos is a catalyst with Profero, where he provides professional consult-ing services, implementation, coaching, and training for a wide variety of organi-zations (large and small, private and public) in many industries focusing on lean enterprise and lean healthcare. Tony has extensive knowledge of lean and quality in a wide range of work environments. He is trained and certified by the National
H1403_Manos_pi_410.indd 42 5/25/12 11:32 AM
Contributing Authors and Editors xliii
Institute for Standards and Technology (NIST) U.S. Department of Commerce in all elements of lean manufacturing. Tony also is a lean champion for 5S Supply.
Relying on his diverse knowledge of business, manufacturing techniques, and applications, Tony has assisted numerous clients in implementing a lean enterprise and lean healthcare. Over the past 10 years, he has helped over 150 companies in several aspects of lean implementation, including team building, standardized work, 5S workplace organization and visual workplace, quick changeover, plant layout, cellular, kanban, total productive maintenance, kaizen events, and hoshin planning. Tony is an internationally recognized speaker and expert on lean and presents at several conferences a year. As an ASQ faculty member, he teaches a two- day course in lean enterprise and a one- day course on kaizen. Tony is the past chair of the Lean Enterprise Division of ASQ. He is a senior member of SME and a member of AME. Tony is coauthor of the book Lean Kaizen: A Simplified Approach to Process Improvement and author of many articles on lean and its allied subjects. He serves as an ASQ representative to the Lean Certification Oversight and Appeals Committee. Tony is Lean Bronze Certified and was part of the original team to develop the Lean Certification.
Tony served in the US Navy nuclear propulsion program. He holds an MBA from the University of Illinois at Chicago.
Chad Vincent is a lean manufacturing specialist and corporate operational excel-lence team member with Greif, Inc. in St. Louis, Missouri, where he provides pro-fessional guidance, facilitates implementation, and coaches and trains personnel at manufacturing facilities on lean enterprise and operational excellence. Prior to Greif, he worked as a quality engineer in the medical device field and as a project engineer in the construction industry; he also has worked in management in the logistics and transportation industry.
Chad has served as a senior lead examiner and judge for the Governor’s Qual-ity Award (Arkansas’ equivalent of the Malcolm Baldrige National Quality Award) and is past president of the Leadership Arkansas Alumni Association Board of Directors. Chad is an advocate for ASQ’s Socially Responsible Organization (SRO) Initiative and a member of SME’s Lean to Green Committee. He has written arti-cles, such as “Back in Circulation” for Quality Progress, on the utilizing of lean to achieve socially responsible and environmentally favorable results within orga-nizations and on defining the 8 Green Wastes for environment, health, and safety (EHS) professionals to apply lean in their areas of expertise. He is a voting member of the US Technical Advisory Group (TAG) for the ISO 26000 Guidance for Social Responsibility.
Chad earned a BS in engineering management, specializing in quality engi-neering, from the Missouri University of Science and Technology, in Rolla, Mis-souri. He is a senior member of ASQ and SME, and is currently the ASQ Lean Enterprise treasurer and serves on the SME/AME/Shingo/ASQ Lean Certifi-cation Oversight and Appeals Committee. Chad is a CQE, CRE, CMQ/OE, and CSSBB, and he is Lean Bronze Certified.
H1403_Manos_pi_410.indd 43 5/25/12 11:32 AM

H1403_Manos_pi_410.indd 44 5/25/12 11:32 AM
1
Module 1Cultural Enablers
1.1. Principles of Cultural Enablers1.2. Processes for Cultural Enablers1.3. Cultural Enabler Techniques and Practices
Culture is the widening of the mind and the spirit.
—Jawaharlal Nehru
The first section of the Lean Body of Knowledge is dedicated to culture. Although lean is about the tools, it is more about creating a culture of people who truly believe in continuous improvement. This portion of the book focuses on what it takes to create, change, and lead an organizational culture into operational excel-lence. There is no lean without people. This section explores the importance of leading with humility, showing respect for people, having a well-crafted plan with a sense of urgency, and developing the people and leaders in your organization.
Module 1
H1403_Manos_pi_410.indd 1 5/25/12 11:32 AM
2
According to Pascal Dennis (2007, 145), author of Lean Production Simplified, “Intensity is the soul of lean production, and team members are its heart.” In other words, people are the most critical element of lean production,
and the culture the team members create is the major source of fuel required to propel lean systems forward in any organization.
In a vast majority of cases, the success or failure of any lean, Six Sigma, or other corporate initiative will depend on the people who execute it rather than on any equipment, consultant, software, or other tools and techniques. Thus, orga-nizations that consider people as the prime appreciating asset and invest ade-quate time, effort, and money in hiring and developing the right people will get unmatched results (Dalal 2011, 584).
What is a Culture?
A culture is the sum total of all behaviors, relationships, comprehension, and inter-actions that fuel overall alignment via collective thoughts, words, and actions.
What is a Lean Culture?
Lean is an approach to improve quality, increase productivity, reduce costs, and increase customer satisfaction by eliminating waste and creating value.
A lean culture is the sum total of all the lean tools, techniques, and knowledge that exist within an organization at the root level and that fuel the overall orga-nizational alignment via collective lean thoughts, words, and actions toward the elimination of waste and the creation of value.
Organizations that have a strong lean culture do two things:
1. They promote at least five key cultural enablers (safety, standards, leader-ship, empowerment, and collaboration), which allows the lean culture to exist
2. They build their business on the core fundamentals of respect for individuals
An Example of a Strong Lean Culture
The consistent growth, prosperity, innovation, and operational excellence of Toyota are clearly results of the Toyota Production System (TPS), which is built
1.1 Principles of Cultural Enablers
1.1
H1403_Manos_pi_410.indd 2 5/25/12 11:32 AM
1.1 Principles of Cultural Enablers 3
on the foundation of a strong and dynamic culture and sophisticated “human sys-tems” consisting of highly motivated and well- trained people in plants, dealer-ships, and offices around the globe. In Toyota Culture, authors Jeffrey Liker and Michael Hoseus (2008) explain Toyota’s four- stage process for building and keep-ing quality people: attract, develop, engage, and inspire. The “people-centric” cul-ture of Toyota is carefully designed by:
• Finding competent, able, and willing employees
• Beginning the training and socializing process as they hire the people
• Establishing and communicating key business performance indicators at every level of the organization
• Training the people to solve problems and continuously improve pro-cesses in their daily work
• Developing leaders who live and teach your company’s philosophy
• Rewarding top performers
• Offering help to those who are struggling (Liker and Hoseus 2008, 44)
What Is a Cultural Enabler?
Just as a sapling requires critical factors like the right soil, adequate sunlight, and water to survive and grow into a strong tree, culture requires factors that allow it to stabilize and pervade throughout the organization. These factors are known as cultural enablers.
Cultural enablers are critical to the people on the journey of building a culture of operational excellence within an organization.
What Constitutes as Cultural Enablers of a Lean Culture?
Cultural enablers of a lean culture include the basic principles of safety, standards, leadership, empowerment, and collaboration.
Basic Principles of safety
There are only two types of organizations: safe or lucky.Safety is the prime cultural enabler, as only safe environments can be pro-
ductive and profitable. Lean organizations believe that merely adhering to all requirements of the Occupational Safety and Health Administration (OSHA) is not sufficient in order to have a safe working environment.
The following two principles are engrained in the culture of lean organizations:
1. Safety is the responsibility of every employee within the organization
2. A proactive versus a reactive approach is required in order to create and maintain a clean, safe, ergonomic, and sustainable work environment
Lean organizations realize that to attain all- encompassing safety standards, they must focus on education and awareness in safety practices related to people’s health and wellness, and interface with people and equipment and environmental aspects.
1.1
H1403_Manos_pi_410.indd 3 5/25/12 11:32 AM
4 Module 1 Cultural Enablers
Personal Safety
Personal safety focuses on security and protection from accidents, injuries, fire hazards, equipment malfunction, and any other aspect threatening the health and well- being of every individual in the organization.
Fatigue Prevention
Fatigue results from a poorly designed workplace, work environment, tools, equip-ment, and policies and procedures. Practicing workplace ergonomics, which opti-mizes the comfort of employees while they are interacting with all the elements of their workplace, is the key to reducing fatigue and increasing employee efficiency.
Environmental Safety
Environmental safety involves reducing the carbon footprint of products and pro-cesses on the surrounding environment. It encompasses product and process design from cradle to grave, including use of environmentally conscious raw materials, supplies, and packaging materials requiring minimal transportation and minimal waste, along with proactive implementation of recycling or reuse programs.
Some top enablers for creating a culture of safety are the following:
• Focus of top leadership
• Organizational emphasis on safety
• Clearly defined organizational structure
• Clearly defined lines of authority and accountability
• Unambiguous communications
• Trust and engagement
• Ability of organization to learn from failures
• Safety training and sharing of lessons learned
Some top barriers for creating a culture of safety are the following:
• Lack of support from top leadership
• Minimal emphasis or pseudo- emphasis on safety
• A culture of blame and retribution
• Lack of training or sharing of lessons learned
Basic Principles of standards
Standards are baselines from which improvements can be easily measured. All standards related to safety, communications, operations, human resources, poli-cies, procedures, and tasks need to be standardized across the entire organization. Standardization is not static but dynamic and requires continuous improvement using the Plan- Do-Check-Act model of the Deming cycle (ASQ).
Taiichi Ohno is credited with saying, “Where there is no standard there can be no kaizen.” Thus, a standard is “the best known method/process/system at
1.1
H1403_Manos_pi_410.indd 4 5/25/12 11:32 AM
1.1 Principles of Cultural Enablers 5
a particular point of time” and is a dynamic point of reference that becomes the baseline for future improvements. Every continuous improvement activity must result in the establishment of a new standard. This “new standard” may require establishing a new standardized work sequence, recalculating takt times and establishing new inventory levels, updating visual work instructions, and setting new inspection or quality control standards.
According to Masaaki Imai (1997, 54–56), author of Gemba Kaizen, standards have the following key features:
• Represent the best, easiest, and safest way to do a job
• Offer the best way to preserve the know- how and expertise
• Provide a way to measure performance
• Show the relationship between cause and effect
• Provide a basis for both maintenance and improvement
• Provide objectives and indicate training goals
• Provide a basis for training
• Create a basis for audit or diagnosis
• Provide a means for preventing recurrence of errors and minimizing variability
Basic Principles of Leadership
Without support from the top leaders and executives, lean initiatives cannot sur-vive in an organization. The leader is not only required to support lean initiatives in good times but also required to show persistence and constancy of purpose dur-ing tough times. The leader needs to develop a clear vision for lean, communicate it effectively to his or her employees, and empower them to adopt it as their own mission. Thus, leadership is the key cultural enabler that determines whether lean is established as a culture in the organization.
Good leaders understand that in an environment of continuous improvement, failures are imminent. But rather than blame people for failures, they ask “why” five times, approach the problem, and create a plan to strengthen the people (Den-nis 2007, 130).
According to Dalal (2011, 471–85), there are three types of failures:
1. System level failures
2. Process level failures
3. Human level failures
Great lean leaders avoid focusing on the human level failures, as this would create an environment of fear, distrust, and a culture of risk aversion lacking creativity and innovation. Instead, great lean leaders:
• Focus on system failures (“why”)
• Spend more time to prevent the failure
1.1
H1403_Manos_pi_410.indd 5 6/1/12 10:38 AM
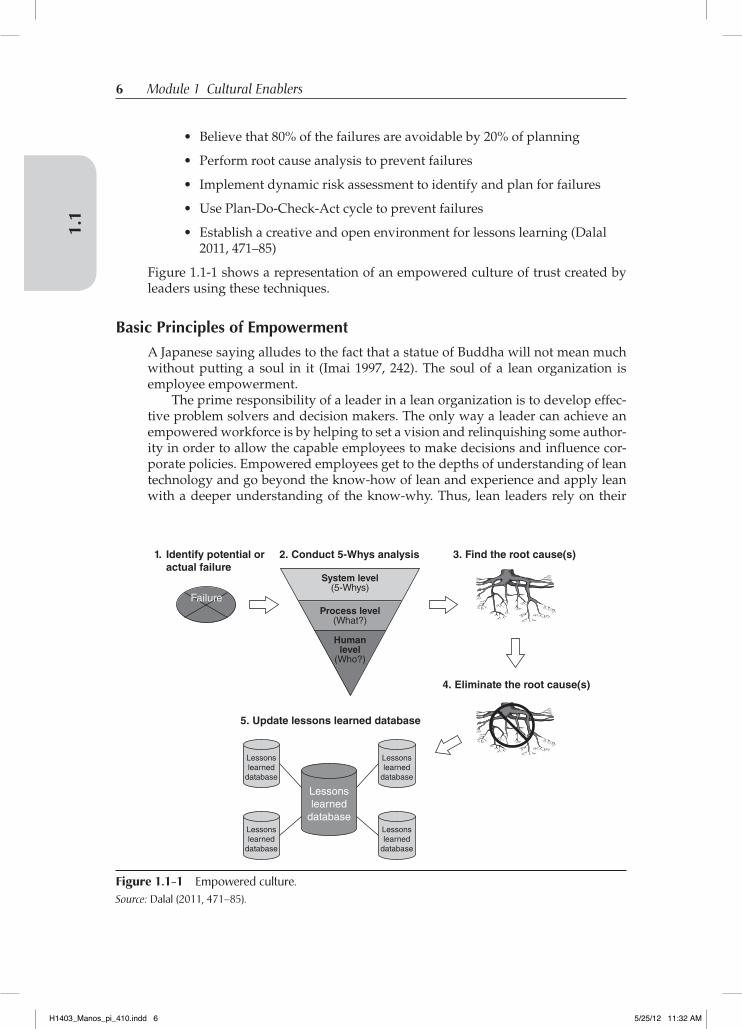
6 Module 1 Cultural Enablers
• Believe that 80% of the failures are avoidable by 20% of planning
• Perform root cause analysis to prevent failures
• Implement dynamic risk assessment to identify and plan for failures
• Use Plan- Do-Check-Act cycle to prevent failures
• Establish a creative and open environment for lessons learning (Dalal 2011, 471–85)
Figure 1.1-1 shows a representation of an empowered culture of trust created by leaders using these techniques.
Basic Principles of empowerment
A Japanese saying alludes to the fact that a statue of Buddha will not mean much without putting a soul in it (Imai 1997, 242). The soul of a lean organization is employee empowerment.
The prime responsibility of a leader in a lean organization is to develop effec-tive problem solvers and decision makers. The only way a leader can achieve an empowered workforce is by helping to set a vision and relinquishing some author-ity in order to allow the capable employees to make decisions and influence cor-porate policies. Empowered employees get to the depths of understanding of lean technology and go beyond the know- how of lean and experience and apply lean with a deeper understanding of the know- why. Thus, lean leaders rely on their
1.1
2. Conduct 5-Whys analysis 3. Find the root cause(s)1. Identify potential or actual failure
Failure
4. Eliminate the root cause(s)
5. Update lessons learned database
Lessonslearned
database
Lessonslearned
database
Lessonslearned
database
Lessonslearned
database
Lessonslearned
database
System level(5-Whys)
Process level(What?)
Humanlevel
(Who?)
Figure 1.1-1 Empowered culture.Source: Dalal (2011, 471–85).
H1403_Manos_pi_410.indd 6 5/25/12 11:32 AM
1.1 Principles of Cultural Enablers 7
empowered employees to optimize the benefits of lean initiatives, ensuring supe-rior levels of customer satisfaction.
Employee empowerment must be done in six steps:
Step 1: Leaders make a commitment to have an engaged workforce
Step 2: Roles and responsibilities are clearly defined
Step 3: Training is conducted for managers, supervisors, staff, and shop- floor personnel
Step 4: Training is conducted for all administrative and support staff
Step 5: A formal idea- suggestion or idea- sharing program that involves all employees is implemented
Step 6: Action is taken to assign responsibility and accountability
Basic Principles of Collaboration
The cultural enabler “collaboration” is the backbone of lean. Lean initiatives do not depend on the knowledge of one but achieve breakthrough results due to the deployment of the collective wisdom of many. In lean organizations, collaboration exists across:
• Various functions
• Different departments
• Staff and union workers—and even between executives and operators
Collaboration and partnerships extend beyond the four walls of the organization and include suppliers, contractors, and, in some cases, competitors.
By design, lean tools allow for a collaborative culture throughout the organiza-tion. Nemawashi, A3 form, kaizen events, and several other lean tools are designed for automatic collaboration.
1.1.1. resPeCT For THe iNdiViduaLOne of the most critical aspects of lean cultures is the inherent importance placed on valuing individuals and treating each individual with dignity.
In lean organizations, respect starts with the top leaders and permeates through-out the organization. However, “respect for every individual” does not end at the four walls of the organization; rather, it extends to all customers, suppliers, and stakeholders, including the community in which the organization does business.
Respect allows the lean culture to achieve the following goals:
• Create a culture of cohesive teamwork
• Create a culture of continuous improvement
• Increase employee involvement
• Empower employees
• Encourage diversity
1.1.1
H1403_Manos_pi_410.indd 7 5/25/12 11:32 AM
8 Module 1 Cultural Enablers
A key requirement and an underlying quality required by employees of lean orga-nizations is humility.
Leaders and employees all practice humility as a technique that allows the process of continuous improvement to go on via open collaboration. In lean cul-tures, everyone is open to learning from one another and to raising their game incrementally on a daily basis in order to generate superior value and increase customer satisfaction.
The key traits of a humble environment are as follows:
• An open learning environment
• People form a critical element of the value stream
• A long- term relationship based on mutual loyalty
• A mentor- mentee, sensei- student relationship throughout the organization
• Lack of discrimination throughout the organization and the entire sup-ply chain
Thus lean organizations and their leaders focus on operational excellence via a people- centric approach by ensuring an empowered, safe, and collaborative environment based on standards and a philosophy of a wholehearted pursuit of long- term excellence.
1.1.2. HuMiLiTy
Humility leads to strength and not to weakness. It is the highest form of self- respect to admit mistakes and to make amends for them.
—John J. McCloy
Humility ties in directly with respect for the individual (see Section 1.1.1, “Respect for the Individual”). Humility is considered the quality of being modest, unas-suming in attitude and behavior. It also can be taken as feeling or showing respect and deference toward other people. Don’t think of humility in the lean sense as being meek, shy, and timid or of lesser value. Of course, the opposite of being humble is being arrogant, overconfident, condescending, or egotistical or display-ing hubris. Humility is a principle that enables the people in your organization to learn, improve, and excel.
Consider two types of humility: personal humility and leading with humility. This approach helps us understand what it takes to develop our own personal style, along with the similarities and differences in leading people.
Personal Humility
Personal humility can be thought of as having pride (not boastful), self- respect, and dignity. These traits are created over the years with a commitment to integrity, honor, and pursuing lifelong learning. Being humble means that you understand
1.1.
2
H1403_Manos_pi_410.indd 8 5/25/12 11:32 AM
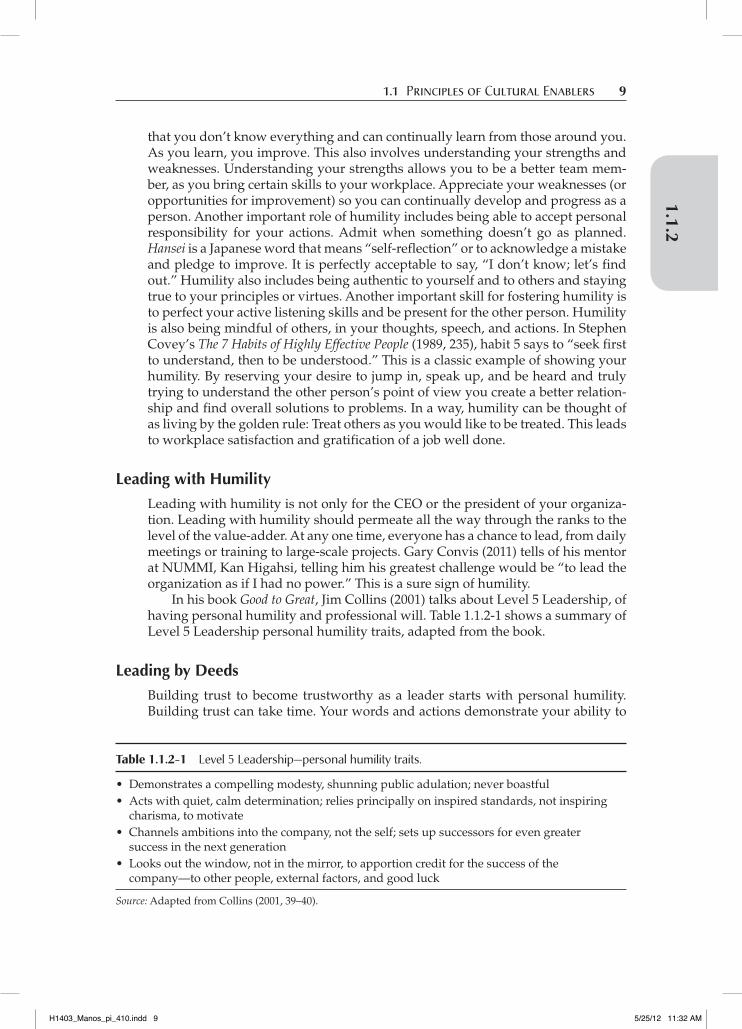
1.1 Principles of Cultural Enablers 9
that you don’t know everything and can continually learn from those around you. As you learn, you improve. This also involves understanding your strengths and weaknesses. Understanding your strengths allows you to be a better team mem-ber, as you bring certain skills to your workplace. Appreciate your weaknesses (or opportunities for improvement) so you can continually develop and progress as a person. Another important role of humility includes being able to accept personal responsibility for your actions. Admit when something doesn’t go as planned. Hansei is a Japanese word that means “self-reflection” or to acknowledge a mistake and pledge to improve. It is perfectly acceptable to say, “I don’t know; let’s find out.” Humility also includes being authentic to yourself and to others and staying true to your principles or virtues. Another important skill for fostering humility is to perfect your active listening skills and be present for the other person. Humility is also being mindful of others, in your thoughts, speech, and actions. In Stephen Covey’s The 7 Habits of Highly Effective People (1989, 235), habit 5 says to “seek first to understand, then to be understood.” This is a classic example of showing your humility. By reserving your desire to jump in, speak up, and be heard and truly trying to understand the other person’s point of view you create a better relation-ship and find overall solutions to problems. In a way, humility can be thought of as living by the golden rule: Treat others as you would like to be treated. This leads to workplace satisfaction and gratification of a job well done.
Leading with Humility
Leading with humility is not only for the CEO or the president of your organiza-tion. Leading with humility should permeate all the way through the ranks to the level of the value- adder. At any one time, everyone has a chance to lead, from daily meetings or training to large- scale projects. Gary Convis (2011) tells of his mentor at NUMMI, Kan Higahsi, telling him his greatest challenge would be “to lead the organization as if I had no power.” This is a sure sign of humility.
In his book Good to Great, Jim Collins (2001) talks about Level 5 Leadership, of having personal humility and professional will. Table 1.1.2-1 shows a summary of Level 5 Leadership personal humility traits, adapted from the book.
Leading by deeds
Building trust to become trustworthy as a leader starts with personal humility. Building trust can take time. Your words and actions demonstrate your ability to
1.1.2
Table 1.1.2-1 Level 5 Leadership—personal humility traits.
• Demonstrates a compelling modesty, shunning public adulation; never boastful• Acts with quiet, calm determination; relies principally on inspired standards, not inspiring
charisma, to motivate• Channels ambitions into the company, not the self; sets up successors for even greater
success in the next generation• Looks out the window, not in the mirror, to apportion credit for the success of the
company—to other people, external factors, and good luck
Source: Adapted from Collins (2001, 39–40).
H1403_Manos_pi_410.indd 9 5/25/12 11:32 AM
10 Module 1 Cultural Enablers
do what you say. An example of this is a leader who says that the customer comes first but then makes it difficult for the customer to contact him or her—making the customer search a website for a telephone number or navigate lengthy phone menus that lead nowhere. As a humble leader, you will need to know how to be patient in developing your people. While there are always deadlines, proper plan-ning, tapping into the creativity of your employees, and having the patience to stay the course will pay off dramatically as you create a more engaged workforce. Always make sure to give credit to others for their contributions to the success of the organization, and take personal responsibility for any letdowns. Learn how to shine the spotlight on others; let them shine in the eyes of the company. If you can learn how to talk to the CEO and the value- adding worker in the same way, you are developing the type of skills that will make you invaluable to your institution. As a leader, design your systems with respect and humility.
Dwight Davis (2011), associate vice president of Utah State University, on the topic of leading with humility, says, “Humility is a key element in building teams, unifying organizations, unleashing employee capabilities, optimizing relationships, designing systems of accountability and achieving a culture of discipline. Humil-ity simply enables individual and organizational learning and improvement.”
We come nearest to the great when we are great in humility.
—Rabindranath Tagore
reFereNCesASQ. “Project Planning and Implementing Tools.” http://asq.org/learn-about-quality/
project-planning-tools/overview/pdca-cycle.html.Collins, Jim. 2001. Good to Great. New York: Harper Business.Convis, Gary. 2011. “Lean Leadership: The Toyota Way.” Keynote speech at the AME confer-
ence, Dallas, Texas.Covey, Stephen. 1989. The 7 Habits of Highly Effective People. New York: Simon and Schuster.Dalal, Adil. 2011. The 12 Pillars of Project Excellence: A Lean Approach to Improving Project
Results. Boca Raton, FL: CRC Press.Davis, Dwight. 2011. “Lead with Humility, Respect Every Individual.” GembaWalk-
about blog, October 17. http://gembawalkabout.tumblr.com/post/11595991420/lead- with-humility-respect-every-individual.
Dennis, Pascal. 2007. Lean Production Simplified: A Plain- Language Guide to the World’s Most Powerful Production System. 2nd ed. New York: Productivity Press.
Imai, Masaaki. 1997. Gemba Kaizen: A Commonsense, Low- Cost Approach to Management. New York: McGraw- Hill.
Liker, Jeffrey, and Michael Hoseus. 2008. Toyota Culture: The Heart and Soul of the Toyota Way. New York: McGraw- Hill. http://www.lean.org/BookStore/ProductDetails.cfm? SelectedProductId=270.
1.1.
2
H1403_Manos_pi_410.indd 10 5/25/12 11:32 AM
395
Index
AAbnormality, recognizing, 66Accounting controls, 334Accounting processes simplified with lean
accounting, 334Actual work time (AWT), 350Adherence mechanism, 95–96Adjourning in team building, 38–39Aligned vs. nonaligned organization,
85, 86fAmerican Society for Quality (ASQ)
flowcharts and, procedure for creating, 171formal learning and, 19inspection defined by, 260Plan-Do-Check-Act model of the Deming
cycle, 4Quality Glossary, 260
Analysis. See also Work flow analysismeasurement systems in, 342–343root cause, 148–150standardized work analysis chart in, 126,
129f, 130takt time, 180–186, 181f
Analysis of variance (ANOVA), 342Andon
definition of, 387for visual feedback, 343for visual management, 255for visual representation of production/
process status, 97, 97fAndon board, 97, 97f, 387Arc, 152Area cleanliness, 24Arrangement, functional, 51Assets of organization, appreciation of, 375Association of Manufacturing Excellence
(AME), 19A3, 307–309
for automatic collaboration, 7
definition of, 387–388examples of, 309format of, 307–308, 308ffor knowledge capture, 308forigin of, 307problem solving storyboards and,
143–146, 144–146f, 282project reports and, 153, 306purpose of, 307, 309for VOC with instructions to complete, 309f
Automotive Industry Action Group (AIAG), 140, 199
Autonomation. See also Jidokacomponents of, 68, 68fdefinition of, 388in identifying and fixing defects, 78integrating with mistake-proofing, 75
Availability in OEE, 361Available time, planned, 360Average cost per unit, 372
BBalanced line. See Line balancingBalanced scorecard, 132–133Barker, Joel, 13–14, 22Batch-and-queue, 345, 388Batch production, 109, 114, 329Benchmarking
customer satisfaction and, 376product and process, 223supplier, 267–268
Bimodal distribution, 188, 189fBottleneck
cycle time and, 352–353definition of, 388identifying, 126reducing, 27
Box score, 294, 294tBox score reporting, 331–333, 332f
Page numbers followed by f or t refer to figures or tables, respectively.
H1403_Manos_pi_420.indd 395 6/4/12 9:09 AM
396 Index
Breakthrough continuous improvement (kaikaku), 82–83, 83f
Breakthrough improvement, 224, 224fBusiness Process Benchmarking (Camp), 267Business profitability, 375–378. See also
Customer satisfactionBusiness results, measuring, 313–378.
See also Measurement categories; Measurement systems
customer loyalty, 315–316customer value, 316–317normal vs. abnormal conditions, 317overview of, 313principles of, 314–322
CCambridge Advanced Learner’s Dictionary, 285Camp, Robert C., 267Capacity development, 307Capital redeployment, 311Cash flow, 371–373, 372tCatchball, 300, 309–310Cause and effect (CE) diagrams, 196–198Cells
definition of, 388office, 293f
Cellular flow, 253–255, 253fpart-quantity-process chart, 253fproduction output chart, 255fU-shaped cell layout, 254f
Center of excellence, 297Certification
determining, 33in formal learning, 19Lean Certification Body of Knowledge
Rubric Version 3.0, 380–384Lean Certification Exam preparation,
recommended reading for, 385–386Change agent, 388Change initiative, phases of, 21Changeover, 388Changeover time, 245f, 369–371, 370t, 371t, 388Checking, inadequate, 164, 165tCheck sheets, 194–195, 195fClear message/reliable fit, 23Closed-loop operation, 130Closed-loop thinking, 282–285
closing the loop, 283–284leader standard work in, 284–285, 284fPDCA cycle in, 282–283
Coaching. See also Leadershipcultural enabler techniques and, 33–36
learning and, integrating, 18–20vs. mentoring, 36, 36ton-the-job training tasks in, 35people development through, 20–21for performance, 37qualities of, 34tsports analogy for, 34tasks, 34–35
Collaboration, principles of, 7Collins, Jim, 9Commitment, level of, 285, 286Communication
barriers, 164, 165tfunctional, 51project status and, 153
Communication strategies, 302–305correlation symbols in, 302, 304fhoshin communication plan in, 305ftree diagram example of, 302, 304fX-matrix example of, 301–302, 303f
Communities of practice, 42Competitive impact measures, 373–378
assets of organization, 375business profitability, 375–378customer loyalty, 374–375guidelines for, 317–319
Complaints, customer satisfaction and, 377Computer-aided design (CAD), 217Concentration diagram, 212–214, 213f, 214f
creating, 212examples of, 195, 213–214, 213f, 214ftime dependencies, 213variable dependencies, 213
Concurrent engineering, 216–218, 217fConsensus in creating strategic
direction, 301Consistent lean enterprise culture, 277–312
A3 and, 307–309catchball and, 309–310constancy of purpose in, 285–289developing, processes for, 290–306enterprise thinking and, 290–297, 291foverview of, 277policy deployment/strategy deployment
and, 298–306principles of, 278–289redeployment of resources and, 310–312social responsibility in, 289systemic thinking in, 278–285techniques and practices in, 307–312
Constancy of purpose, 285–289customer value and, 288–289definition of, 285
H1403_Manos_pi_420.indd 396 6/4/12 9:09 AM
Index 397
level of commitment and, 285, 286PDCA cycle in, 287purpose statements and, 286, 286tresults and, 286–287waste elimination and, 287–288
Constraint, 388Constraints, theory of, 180, 393Contact method, 78Continuous flow
changeover and, 57communication and, 255definition of, 388in future state of value stream, 179in just-in-time, 61, 62product development, 217right-sized equipment and, 248, 249fsingle-piece, 348, 352
Continuous improvementbreakthrough (kaikaku), 82–83, 83fdefinition of, 388incremental (kaizen), 81–82, 81fquality at the source and, 73–74vs. reengineering, 137f
Continuous process improvementvs. breakthrough improvement, 137countermeasure activities in, 240–261data collection and presentation in,
186–195flow barriers in, identifying and
eliminating, 50–61implementing, 137–138improvement organization in, 235–240integrated improvement in, 79, 79tjidoka in, 68–79“just do it” approach to, 136just-in-time processing in, 61–62, 62fmethodology, 135–146overview of, 45–46PDCA cycle in, 138–140PDSA cycle in, 135, 138–140perfection in, seeking, 80–83, 83fprinciples of, 47–83process focus in, 47–50product and service design in,
215–235root cause in, identifying, 196–202scientific thinking in, 62–68storyboarding in, 143–146, 144f, 145f, 146fsupply processes external in, 261–269supply processes internal in, 269–276systems (See Continuous process
improvement systems)techniques and practices, 167–276
variation data in, presenting, 202–214work flow analysis in, 167–186
Continuous process improvement systems, 85–165
built-in feedback, 130–132continuous improvement process
methodology, 135–146corrective action system, 148–150knowledge transfer, 163–164load leveling, 110–114lot size reduction, 108–110, 109foverview of, 85–86process design, 154–160project management, 151–154pull system, 160–163quality systems, 147–148standard work, 124–130strategic business assessment, 132–135, 135t3P, 115–116total productive maintenance, 116–123visual workplace, 86–108
Control poka-yoke, 78Conversion costs, 372Convis, Gary, 9Corrective action system, 148–150Correlation symbols, 302, 304fCost accounting, 52, 296, 330. See also CostsCosting, 296tCost measures, 354–371
changeover time, 245f, 369–371, 370t, 371tguidelines for, 320inventory turns, 354–356overall equipment effectiveness, 359–369queue time, 356–358wait time, 358–359
Cost reduction, 68–69customer loyalty and, 374jidoka and, 68–69productivity and, 68–69quality and, 69
Costscalculating, making decisions without, 331lean measures, 354–371life-cycle, 225material, 372measuring (See Cost measures)product, 333reducing (See Cost reduction)service, 333target, 334target costing and, 334value stream, 296–297, 331, 333
Countermeasure, 240, 388
H1403_Manos_pi_420.indd 397 6/4/12 9:09 AM
398 Index
Countermeasure activities, 240–261cellular flow, 253–255material signals (kanban), 257–260, 258fmistake- and error-proofing (poka-yoke),
241–243one-piece flow, 246–248, 247fright-sized equipment, 248–252, 249fsensible automation, 256–257SMED, 243–246source inspection, 260–261
Covey, Stephen, 9Cp and Cpk, 231–232, 232fCredible message/reliable performance, 23Critical path, 153Critical path method (CPM), 153Critical to quality (CTQ)
characteristics, identification of, 207–208feedback loops and, 131, 131fin linking process measures with
customer expectations, 325in product and service design, 215in source inspection, 261tree, 207f, 208f
Cross-docking, 264–266, 265fCross-functional flowcharts, 111Cross-functional teams, 40Cross training, 27–29
bottlenecks and, reducing, 27employee development and, 28matrices, 311, 312fplans, creating, 28records, visual, 29
Cultural enabler, 1–44collaboration and, 7constituents of, 3culture and, definition of, 2definition of, 3empowerment and, 6–7, 6fhumility and, 8–10leadership and, 5–6lean culture and, 2–3overview of, 1processes (See Cultural enabler processes)respect and, 7–8safety and, 3–4standards, 4–5techniques and practices (See Cultural
enabler techniques and practices)Cultural enabler processes, 11–26
environmental systems, 23–25learning and coaching, 18–20message deployment, 17–18, 17fmodeling lean principles, values,
philosophies, 15–16
motivation, empowerment, involvement, 21–23
people development, 20–21planning and deployment, 11–12safety systems, 25–26urgency, creating sense of, 13–15
Cultural enabler techniques and practices, 27–44
coaching and mentoring, 33–36, 36tcross training, 27–29information sharing, 41–42instructional goals, 31–32leadership development, 36–38on-the-job training, 32–33skills assessment, 29–31suggestion systems, 42–44teamwork, 38–41
Culture, 2Current state, 176–177Customer loyalty, 374–375
business results and, measuring, 315–316
cost reduction and, 374customer delivery times, optimizing, 375external quality, optimizing, 374internal lead times, optimizing, 375internal quality, optimizing, 374
Customer satisfaction, 376–378benchmarking and, 376complaints and, 377customer’s point of view and,
understanding, 377goals and objectives in, setting, 341–342positive press and, 377repeat orders and, 377social media and, 377–378surveys and, 377using measurements and, 377Voice of the Customer and, 376
Customer valuebusiness results and, measuring, 316–317in constancy of purpose, 288–289lean accounting and, 334
Cycle, 389Cycle time
calculating, guidelines for, 320, 351–353chart, 352definition of, 347, 351, 389
DDalal, Adil, 5, 375Data collection and presentation, 186–195
check sheets in, 194–195, 195f
H1403_Manos_pi_420.indd 398 6/4/12 9:09 AM
Index 399
histograms in, 187–190Pareto charts in, 190–193, 192f, 193f
Davis, Dwight, 10Deeds, leading by, 9–10Defects
autonomation in identifying and fixing, 78
detecting errors to prevent, 77–78jidoka in reducing, 74, 346none passed forward, 74product, making, 56stop and fix, 78–79
Define-Measure-Analyze-Design- Verify, 135
Define-Measure-Analyze-Improve-Control (DMAIC), 135, 138, 140, 141–143, 141t
Delivery measures, 348–353actual work time, 350cycle time, 353lead time, 353takt awareness, 351takt time, 349–351
Deming, W. Edwards, 63, 135, 138, 139–140, 204, 282–283, 285. See also Plan-Do-Check-Act (PDCA)
Dennis, Pascal, 2, 65, 77, 280Design FMEA, 199–200, 201–202tDesign for Assembly (DFA), 225, 226Design for Cost (DFC), 225, 226Design for Disassembly (DFD), 225Design for Excellence (DFE), 217–218, 224Design for Green (DFG), 225, 226–227Design for Installation (DFI), 225Design for Lean (DfL), 215Design for Lean Six Sigma (DfLSS), 215Design for Logistics (DFL), 225Design for Manufacturing (DFM), 225,
233–235automatic assembly inspection in, 235definition of, 226designing parts with nonsymmetric
profiles in, 234ease of fabrication in, 234mistake-proofing principles in, 233reduction of number parts in, 234simplification of design in, 234standardization in, 234transportation and storage in, 234
Design for Poka-Yoke or Mistake-Proofing (DFP), 225
Design for Quality (DFQ), 225Design for Reliability (DFR), 225, 226Design for Reuse (DFU), 225Design for Safety (DFS), 225
Design for Test (DFT), 225Design for Warranty and Service
(DFW), 225Design for X (DFX), 215, 223–231
benefits of, 224breakthrough improvement, 224, 224fdefinitions of, 226elements of, 225–226life-cycle cost, 225, 225fmetrics to measure the effectiveness of,
230–231rolling out, strategy for, 230strategy, 230subject matter experts (SMEs) for, 230
Design for X (DFX) tools, 227–231Designing Stage Gate (Full Scale
Development Step), 229–230End of Life Stage Gate (Recycling
Step), 230interactions, 228list of, 227–228Manufacturing Stage Gate (Start of
Production Step), 230Opportunity Assessment Stage Gate
(Concept Step), 228Planning Stage Gate (Concept Step),
228–229Verification and Validation Stage Gate
(Full Scale Development Step), 230Design of experiment (DOE), 300Detect device, 243, 244fDirect observation, scientific thinking and,
66–68Discarded knowledge, 164, 165tDiscipline, 108Distribution, 188–189Dock-to-dock days, 372Downtime, 360–361Drill Deep and Wide (DDW), 150DROSS, 23Drucker, Peter, 285, 338, 374Dynamic give and take, 300–301Dynamic thinking, 281–282
EEarly in/early out, 23Economic order quantities (EOQ), 244Economies of flow, 51–52
cost accounting, 52functional arrangement, 51functional communication, 51specializing improvement and quality,
51–52
H1403_Manos_pi_420.indd 399 6/4/12 9:09 AM
400 Index
Education, 20–21in five phases of change, 21in lean principles, 326for lean transformation, 21LPO and KPO and, 235PDCA model in, 139people development through, 20–21three-step approach to, 22Voice of the Customer in, 337
8 Discipline (8D) methodology, 15080/20 rule, 190–191Electronic communication, 217Electronic kanban, 259Employee development, 28Empowerment, 21–23
achieving by engaging employees, 375in change initiative, 21cultural, 6, 6fin developing assets for competitive
impact, 375in improvement integrated with work, 79principles of, 6–7quality at the source and, 74steps in, 7visuality for creating, 92
Enlightenment in change initiative, 21Enrichment in change initiative, 21Enterprise thinking, 290–297, 291f
improvement system in, 294information management in, 296–297integrated business system in, 294organizing around flow in, 292–293reporting system in, reconciling, 294–296
Environmental safety, 4Environmental systems, 23–25
area cleanliness in, 24HVAC in, 24–25lighting in, 24
Equipment, right-sized. See Right-sized equipment
Equipment availability, 359, 360, 389Equipment effectiveness. See Overall
equipment effectiveness (OEE)Ergonomics
DFE and, 218DFX tools and, 228, 229movement and, 56point kaizen and, 235right-sized equipment criteria and, 249f,
251, 252work safety and, 25–26
Error detection, 389. See also Mistake- and error-proofing (poka-yoke)
Error-proofing. See Mistake- and error-proofing (poka-yoke)
Event lean, 12Experience in change initiative, 21Experiments
design of, 300Hawthorne Works, 23–24nested, 300
External feedback loop, 130–131External setup, 389Extrinsic motivation, 37
FFail-Safe Leadership (Martin and Mutchler), 17Failure mode, effects, and criticality analysis
(FMECA), 342Failure mode and effects analysis (FMEA),
198–203AIAG description of, 199constructing, 200, 201–202tDesign FMEA, 199–200, 201–202timplementing, 202influential factors determined by, 342Process FMEA, 199–200, 201–202t, 203fpurpose of, 199
Failures in time (FIT), 226Fatigue prevention, 4Faxbans, 259Feedback
andon for visual, 343built-in, 130–132loops, 130–132, 131frapid, 242real-time, visible, 343supplier assessment and, 266
FIFO (first-in, first-out), 389Financial impact measures, 371–373Financial reports for lean operations,
331–334. See also Reportingcalculating product cost, making
decisions without, 331closing the books, 333compliance with regulatory requirements,
333–334external reporting, 333inventory valuation, 333plain language financial statements, 331product costing, 333service costing, 333value stream costing, 331, 333
First pass yield (FPY), 346–348, 372, 389First-Question-Is-Free Rule, 94–95, 95f
H1403_Manos_pi_420.indd 400 6/4/12 9:09 AM
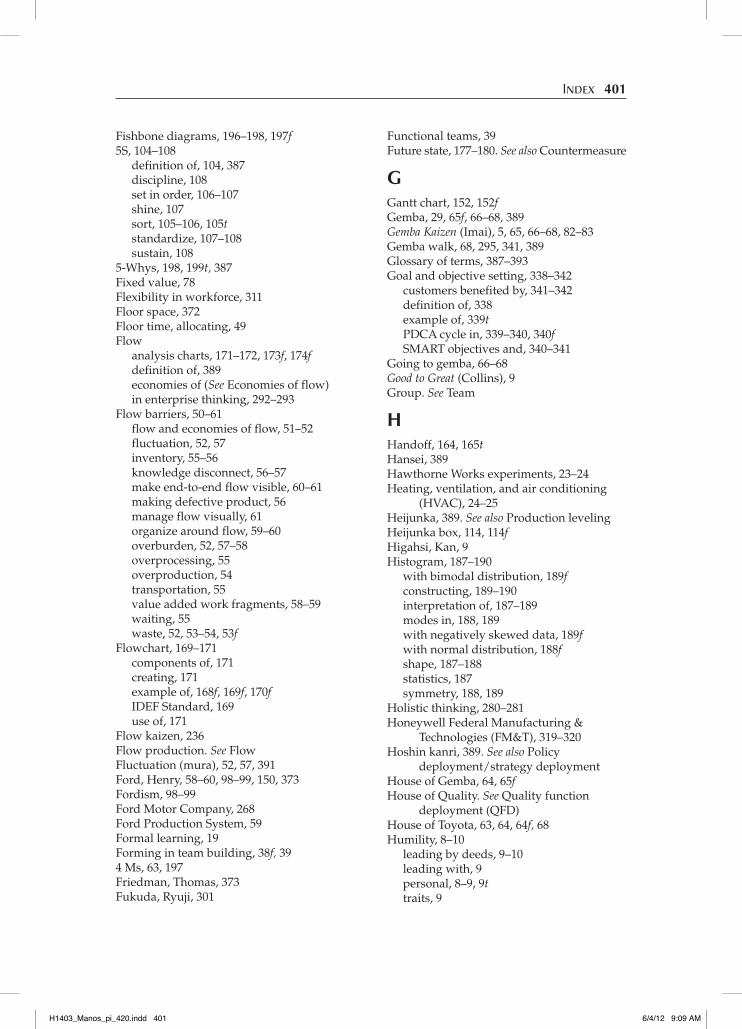
Index 401
Fishbone diagrams, 196–198, 197f5S, 104–108
definition of, 104, 387discipline, 108set in order, 106–107shine, 107sort, 105–106, 105tstandardize, 107–108sustain, 108
5-Whys, 198, 199t, 387Fixed value, 78Flexibility in workforce, 311Floor space, 372Floor time, allocating, 49Flow
analysis charts, 171–172, 173f, 174fdefinition of, 389economies of (See Economies of flow)in enterprise thinking, 292–293
Flow barriers, 50–61flow and economies of flow, 51–52fluctuation, 52, 57inventory, 55–56knowledge disconnect, 56–57make end-to-end flow visible, 60–61making defective product, 56manage flow visually, 61organize around flow, 59–60overburden, 52, 57–58overprocessing, 55overproduction, 54transportation, 55value added work fragments, 58–59waiting, 55waste, 52, 53–54, 53f
Flowchart, 169–171components of, 171creating, 171example of, 168f, 169f, 170fIDEF Standard, 169use of, 171
Flow kaizen, 236Flow production. See FlowFluctuation (mura), 52, 57, 391Ford, Henry, 58–60, 98–99, 150, 373Fordism, 98–99Ford Motor Company, 268Ford Production System, 59Formal learning, 19Forming in team building, 38f, 394 Ms, 63, 197Friedman, Thomas, 373Fukuda, Ryuji, 301
Functional teams, 39Future state, 177–180. See also Countermeasure
GGantt chart, 152, 152fGemba, 29, 65f, 66–68, 389Gemba Kaizen (Imai), 5, 65, 66–68, 82–83Gemba walk, 68, 295, 341, 389Glossary of terms, 387–393Goal and objective setting, 338–342
customers benefited by, 341–342definition of, 338example of, 339tPDCA cycle in, 339–340, 340fSMART objectives and, 340–341
Going to gemba, 66–68Good to Great (Collins), 9Group. See Team
HHandoff, 164, 165tHansei, 389Hawthorne Works experiments, 23–24Heating, ventilation, and air conditioning
(HVAC), 24–25Heijunka, 389. See also Production levelingHeijunka box, 114, 114fHigahsi, Kan, 9Histogram, 187–190
with bimodal distribution, 189fconstructing, 189–190interpretation of, 187–189modes in, 188, 189with negatively skewed data, 189fwith normal distribution, 188fshape, 187–188statistics, 187symmetry, 188, 189
Holistic thinking, 280–281Honeywell Federal Manufacturing &
Technologies (FM&T), 319–320Hoshin kanri, 389. See also Policy
deployment/strategy deploymentHouse of Gemba, 64, 65fHouse of Quality. See Quality function
deployment (QFD)House of Toyota, 63, 64, 64f, 68Humility, 8–10
leading by deeds, 9–10leading with, 9personal, 8–9, 9ttraits, 9
H1403_Manos_pi_420.indd 401 6/4/12 9:09 AM
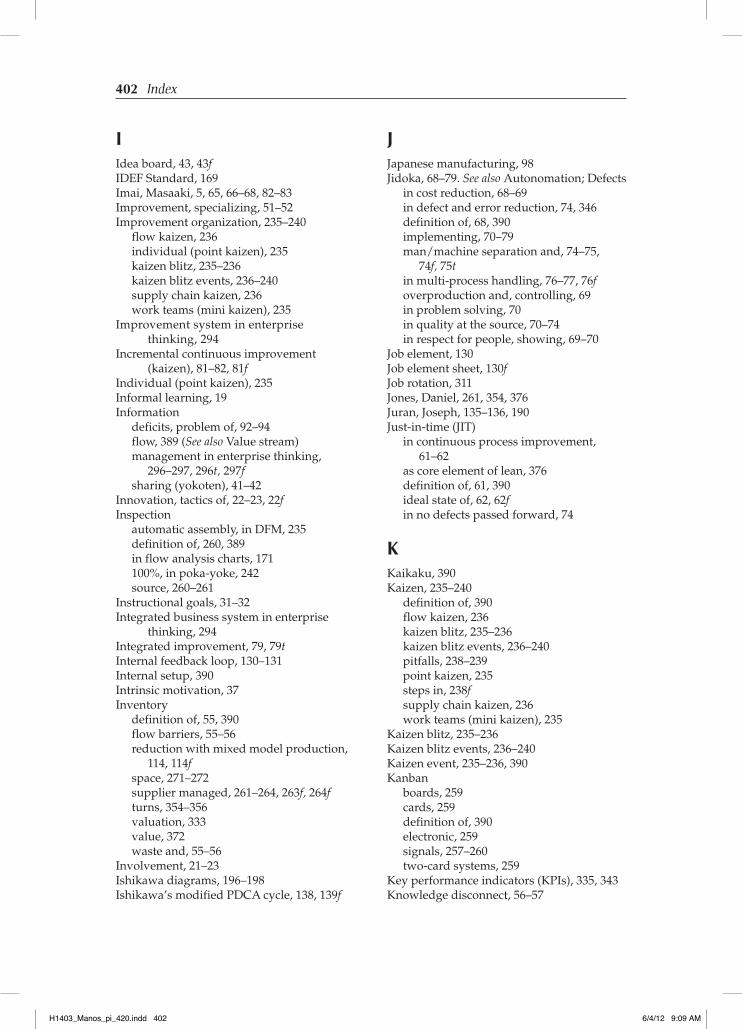
402 Index
IIdea board, 43, 43fIDEF Standard, 169Imai, Masaaki, 5, 65, 66–68, 82–83Improvement, specializing, 51–52Improvement organization, 235–240
flow kaizen, 236individual (point kaizen), 235kaizen blitz, 235–236kaizen blitz events, 236–240supply chain kaizen, 236work teams (mini kaizen), 235
Improvement system in enterprise thinking, 294
Incremental continuous improvement (kaizen), 81–82, 81f
Individual (point kaizen), 235Informal learning, 19Information
deficits, problem of, 92–94flow, 389 (See also Value stream)management in enterprise thinking,
296–297, 296t, 297fsharing (yokoten), 41–42
Innovation, tactics of, 22–23, 22fInspection
automatic assembly, in DFM, 235definition of, 260, 389in flow analysis charts, 171100%, in poka-yoke, 242source, 260–261
Instructional goals, 31–32Integrated business system in enterprise
thinking, 294Integrated improvement, 79, 79tInternal feedback loop, 130–131Internal setup, 390Intrinsic motivation, 37Inventory
definition of, 55, 390flow barriers, 55–56reduction with mixed model production,
114, 114fspace, 271–272supplier managed, 261–264, 263f, 264fturns, 354–356valuation, 333value, 372waste and, 55–56
Involvement, 21–23Ishikawa diagrams, 196–198Ishikawa’s modified PDCA cycle, 138, 139f
JJapanese manufacturing, 98Jidoka, 68–79. See also Autonomation; Defects
in cost reduction, 68–69in defect and error reduction, 74, 346definition of, 68, 390implementing, 70–79man/machine separation and, 74–75,
74f, 75tin multi-process handling, 76–77, 76foverproduction and, controlling, 69in problem solving, 70in quality at the source, 70–74in respect for people, showing, 69–70
Job element, 130Job element sheet, 130fJob rotation, 311Jones, Daniel, 261, 354, 376Juran, Joseph, 135–136, 190Just-in-time (JIT)
in continuous process improvement, 61–62
as core element of lean, 376definition of, 61, 390ideal state of, 62, 62fin no defects passed forward, 74
KKaikaku, 390Kaizen, 235–240
definition of, 390flow kaizen, 236kaizen blitz, 235–236kaizen blitz events, 236–240pitfalls, 238–239point kaizen, 235steps in, 238fsupply chain kaizen, 236work teams (mini kaizen), 235
Kaizen blitz, 235–236Kaizen blitz events, 236–240Kaizen event, 235–236, 390Kanban
boards, 259cards, 259definition of, 390electronic, 259signals, 257–260two-card systems, 259
Key performance indicators (KPIs), 335, 343Knowledge disconnect, 56–57
H1403_Manos_pi_420.indd 402 6/4/12 9:09 AM
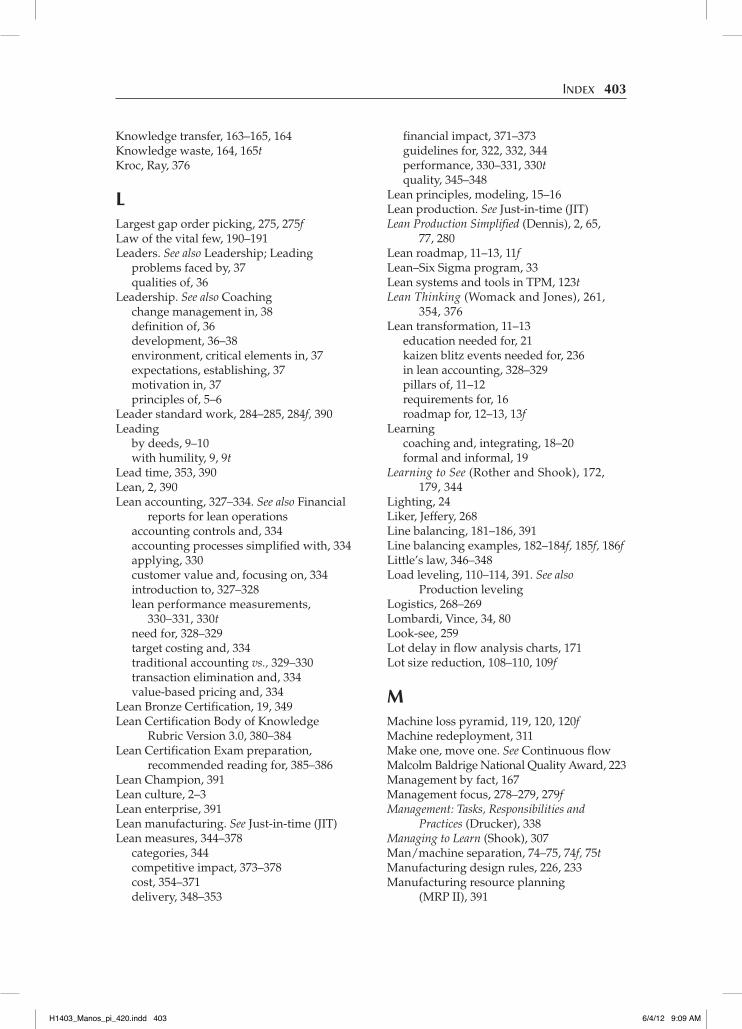
Index 403
Knowledge transfer, 163–165, 164Knowledge waste, 164, 165tKroc, Ray, 376
LLargest gap order picking, 275, 275fLaw of the vital few, 190–191Leaders. See also Leadership; Leading
problems faced by, 37qualities of, 36
Leadership. See also Coachingchange management in, 38definition of, 36development, 36–38environment, critical elements in, 37expectations, establishing, 37motivation in, 37principles of, 5–6
Leader standard work, 284–285, 284f, 390Leading
by deeds, 9–10with humility, 9, 9t
Lead time, 353, 390Lean, 2, 390Lean accounting, 327–334. See also Financial
reports for lean operationsaccounting controls and, 334accounting processes simplified with, 334applying, 330customer value and, focusing on, 334introduction to, 327–328lean performance measurements,
330–331, 330tneed for, 328–329target costing and, 334traditional accounting vs., 329–330transaction elimination and, 334value-based pricing and, 334
Lean Bronze Certification, 19, 349Lean Certification Body of Knowledge
Rubric Version 3.0, 380–384Lean Certification Exam preparation,
recommended reading for, 385–386Lean Champion, 391Lean culture, 2–3Lean enterprise, 391Lean manufacturing. See Just-in-time (JIT)Lean measures, 344–378
categories, 344competitive impact, 373–378cost, 354–371delivery, 348–353
financial impact, 371–373guidelines for, 322, 332, 344performance, 330–331, 330tquality, 345–348
Lean principles, modeling, 15–16Lean production. See Just-in-time (JIT)Lean Production Simplified (Dennis), 2, 65,
77, 280Lean roadmap, 11–13, 11fLean–Six Sigma program, 33Lean systems and tools in TPM, 123tLean Thinking (Womack and Jones), 261,
354, 376Lean transformation, 11–13
education needed for, 21kaizen blitz events needed for, 236in lean accounting, 328–329pillars of, 11–12requirements for, 16roadmap for, 12–13, 13f
Learningcoaching and, integrating, 18–20formal and informal, 19
Learning to See (Rother and Shook), 172, 179, 344
Lighting, 24Liker, Jeffery, 268Line balancing, 181–186, 391Line balancing examples, 182–184f, 185f, 186fLittle’s law, 346–348Load leveling, 110–114, 391. See also
Production levelingLogistics, 268–269Lombardi, Vince, 34, 80Look-see, 259Lot delay in flow analysis charts, 171Lot size reduction, 108–110, 109f
MMachine loss pyramid, 119, 120, 120fMachine redeployment, 311Make one, move one. See Continuous flowMalcolm Baldrige National Quality Award, 223Management by fact, 167Management focus, 278–279, 279fManagement: Tasks, Responsibilities and
Practices (Drucker), 338Managing to Learn (Shook), 307Man/machine separation, 74–75, 74f, 75tManufacturing design rules, 226, 233Manufacturing resource planning
(MRP II), 391
H1403_Manos_pi_420.indd 403 6/4/12 9:09 AM
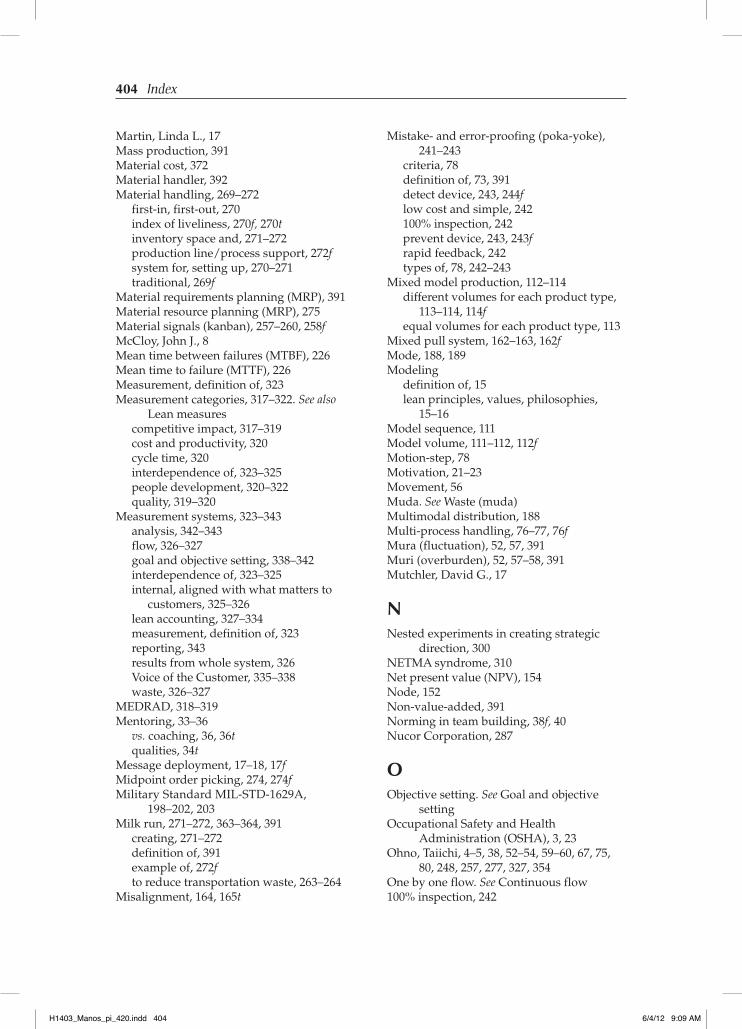
404 Index
Martin, Linda L., 17Mass production, 391Material cost, 372Material handler, 392Material handling, 269–272
first-in, first-out, 270index of liveliness, 270f, 270tinventory space and, 271–272production line/process support, 272fsystem for, setting up, 270–271traditional, 269f
Material requirements planning (MRP), 391Material resource planning (MRP), 275Material signals (kanban), 257–260, 258fMcCloy, John J., 8Mean time between failures (MTBF), 226Mean time to failure (MTTF), 226Measurement, definition of, 323Measurement categories, 317–322. See also
Lean measurescompetitive impact, 317–319cost and productivity, 320cycle time, 320interdependence of, 323–325people development, 320–322quality, 319–320
Measurement systems, 323–343analysis, 342–343flow, 326–327goal and objective setting, 338–342interdependence of, 323–325internal, aligned with what matters to
customers, 325–326lean accounting, 327–334measurement, definition of, 323reporting, 343results from whole system, 326Voice of the Customer, 335–338waste, 326–327
MEDRAD, 318–319Mentoring, 33–36
vs. coaching, 36, 36tqualities, 34t
Message deployment, 17–18, 17fMidpoint order picking, 274, 274fMilitary Standard MIL-STD-1629A,
198–202, 203Milk run, 271–272, 363–364, 391
creating, 271–272definition of, 391example of, 272fto reduce transportation waste, 263–264
Misalignment, 164, 165t
Mistake- and error-proofing (poka-yoke), 241–243
criteria, 78definition of, 73, 391detect device, 243, 244flow cost and simple, 242100% inspection, 242prevent device, 243, 243frapid feedback, 242types of, 78, 242–243
Mixed model production, 112–114different volumes for each product type,
113–114, 114fequal volumes for each product type, 113
Mixed pull system, 162–163, 162fMode, 188, 189Modeling
definition of, 15lean principles, values, philosophies,
15–16Model sequence, 111Model volume, 111–112, 112fMotion-step, 78Motivation, 21–23Movement, 56Muda. See Waste (muda)Multimodal distribution, 188Multi-process handling, 76–77, 76fMura (fluctuation), 52, 57, 391Muri (overburden), 52, 57–58, 391Mutchler, David G., 17
NNested experiments in creating strategic
direction, 300NETMA syndrome, 310Net present value (NPV), 154Node, 152Non-value-added, 391Norming in team building, 38f, 40Nucor Corporation, 287
OObjective setting. See Goal and objective
settingOccupational Safety and Health
Administration (OSHA), 3, 23Ohno, Taiichi, 4–5, 38, 52–54, 59–60, 67, 75,
80, 248, 257, 277, 327, 354One by one flow. See Continuous flow100% inspection, 242
H1403_Manos_pi_420.indd 404 6/4/12 9:09 AM
Index 405
One-piece flow, 246–248, 247f, 391. See also Continuous flow
One-touch exchange of die (OTED), 243On-the-job training (OJT), 32–33
certifications, determining, 33coaching tasks in, 35informal vs. formal, 19lessons learned post-training and,
conducting, 33post-training evaluation criteria and,
setting up, 33successful program of, considerations
for, 32trainer in, selecting and preparing, 32training materials for, developing, 32
On-time shipment, 372Open-loop operation, 130Organization, aligned vs. nonaligned, 85, 86fOverall equipment effectiveness (OEE),
359–369. See also Total productive maintenance (TPM)
availability in, 361calculations in, 359–360definition of, 359, 391example of, 368–369factors in, 359goals of, 364, 365loss categories, 118foverall labor effectiveness and, 365,
367–368tperformance and, 361–362planned available time and, 360planned downtime and, 360quality loss and, 362shift by comparison and, 364tshift in manufacturing facility and,
example of, 363Six Big Losses and, 119t, 365, 366, 366tunplanned downtime and, 360–361value stream and, 364, 365tvisual representation of, 362fwaterfall chart, 118f
Overall labor effectiveness (OLE), 365, 367, 368tOverburden (muri), 52, 57–58Overprocessing, 55Overproduction, 54
PPareto, Vilfredo, 190Pareto chart, 190–193
constructing, 191–193example of, 192f, 193f
Pareto principle, 190–191Part-quantity-process chart, 253fPatton, George S., 67Payback period, 154People development
in cultural enabler processes, 20–21measures, 320–322
Perfection, seeking, 80–83breakthrough continuous improvement
in, 82–83, 83fincremental continuous improvement in,
81–82, 81fPerformance
loss, 361measures, 330–331overall equipment effectiveness and,
361–362Performing in team building, 40Personal humility, 8–9Personal safety, 4Philosophies, modeling, 15–16Pictogram. See Concentration diagramPlan, establishing and implementing, 180Plan-Do-Check-Act (PDCA), 135, 138–140,
138f. See also Countermeasure activitiesact in, 300in A3, 307check in, 299in closed-loop thinking, 282–283in coaching, 35in constancy of purpose, 287in continuous improvement process
methodology, 138–140, 140tDeming’s model of, 4, 140f, 283fdo in, 299in education, 139goal and objective setting and, 339–340,
339t, 340fIshikawa’s modified, 138, 139fplan in, 299in policy deployment, 299–300in suggestion systems, 43, 43fwheel, 282–283
Plan-Do-Study-Act (PDSA)in continuous process improvement, 135,
138–140for Voice of the Customer, 336, 338f
Planned available time, 360Planned downtime, 360Planning and deployment, 11–13Planning in supply processes internal,
275–276Point kaizen, 235
H1403_Manos_pi_420.indd 405 6/4/12 9:09 AM
406 Index
Point-of-use storage (POUS), 252, 391Poka-yoke. See Mistake- and error-proofing
(poka-yoke)Policy deployment/strategy deployment,
298–306align strategies and execution in, 301–302communication strategies in, 302–305dynamic give and take in, 300–301forming consensus in, 301nested experiments in, 300resource deployment and allocation
in, 306scientific thinking in, 299–300
Positive press, customer satisfaction and, 377PQCDSM, 375Prevent device, 243, 243fProblem-solving teams, 39Process capability, 157, 157tProcess capacity, 157–159, 158tProcess delay in flow analysis charts, 171Process design, 154–160
in lean thinking, 160in prioritizing improvement efforts,
159, 160fprocess capability and, 157, 157tprocess capacity and, 157–159, 158tprocess stability and, 155–157, 156fin SIPOC, 154–155, 155fstreamlining and, 159
Process FMEA, 199–200, 201–202t, 203fProcess focus, 47–50
on floor time, allocating, 49importance of, 50lean mind-set and process vs. results
focus, 48foverview of, 48on process in operation, 49process measures in, 49–50
Processing in flow analysis charts, 171Process in operation, 49Process kaizen, 238Process lead time (PLT), 353Process measures, 49–50Process stability, 155–157, 156fProduct and service design, 215–235
benchmarking in, 223concurrent engineering in, 216–218, 216fDFM, 233–235DFX, 223–231QFD, 218–223variety reduction and, 231–233
Product development continuous flow (PDCF), 217
Product development process. See Design for X (DFX) tools
Product family, 175–176, 391Production (analysis) board, 392Production capacity chart, 126, 127fProduction leveling, 110–114, 110f
mixed model production, 112–114model sequence, 111model volume, 111–112, 112ftotal production volume, 111, 111f
Production output chart, 255fProduction smoothing. See Load levelingProductivity, 392Productivity measures, 320Product life cycle, design for. See Design
for X (DFX)Product safety, 25Profits, 372Program evaluation and review technique
(PERT), 152–153, 153fProject charter, 151Project management, 151–154
project charter in, 151project planning in, 151–153project results and, evaluating, 153–154project status and, communicating, 153requirements for, 151
Project planning, 151–153CPM, 153Gantt chart, 152, 152fPERT, 152–153, 153f
Project results, evaluating, 153–154Project status, communicating, 153Pull, 392Pull production, 257, 392Pull system, 160–163
mixed, 162–163, 162fsequential, 162, 162fsupermarket, 161, 161f
Purpose statements, 286, 286tPush, 392Push production, 108–109
QQuality, specializing, 51–52Quality at the source, 70–74
continuous improvement and, 73–74poka-yoke and, 73self-checks and, 72–73standard work and, 71–72successive checks and, 72visual management and, 73
H1403_Manos_pi_420.indd 406 6/4/12 9:09 AM
Index 407
Quality function deployment (QFD), 218–223, 219f, 221f, 222f
attic in, 220basement in, 221left wing in, 219–220living room in, 220practical challenges in, 222–223right wing in, 220–221roof in, 221–222
Quality loss function, 232, 233f, 362Quality loss in OEE, 362Quality management system (QMS), 200Quality measures, 345–348. See also
Customer loyaltyfirst pass yield, 346–348guidelines for, 319–320rework, 345–346
Quality systems, 147–148Quality Trilogy (Juran), 135–136, 136fQueue time, 356–358
calculating, 357definition of, 356, 392utilizing, 357–358
Quick changeover, 392Quick changeover/setup reduction,
243–246, 246fQuick kaizen, 235–236
RRapid kaizen, 235–236Reengineering vs. continuous
improvement, 137fRepeat orders, customer satisfaction and, 377Reporting. See also Financial reports for lean
operationsA3 project reports and, 153, 306box score, 331–333, 332fin enterprise thinking, 294–296measurement systems, 343
Resourcesdeployment and allocation of, 306manufacturing resource planning and, 391material resource planning and, 275redeployment of, 310–312
Respectfor people, showing, 69–70principles of, 7–8
Return on investment (ROI), 154, 256–257Revenue, 372Right-size, 392Right-sized equipment, 248–252, 249f
continuous flow and, 248
countermeasure activities and, 248–252ergonomics and, 251, 252process at a glance sheet, 250fselection criteria, 251–252t
Root cause, identifying, 196–202analysis for, 148–150cause and effect diagrams for, 196–1985-Whys for, 198, 199tFMEA for, 198–203, 201–202t
Root cause analysis (RCA), 148–150Rother, Mike, 172, 179, 344Runner, 392
SSafety
environmental, 4fatigue prevention, 4personal, 4principles of, 3–4product, 25systems, 25–26work, 25–26
Sales per person, 372Scatter diagram, 209–212, 210f, 211fScheduling in supply processes internal,
275–276Scientific thinking, 62–68
abnormality and, recognizing, 66direct observation and, 66–68example of, 63overview of, 62–63stability and, 63standardization and, 64–66strategic direction and, creating, 298t,
299–300Seemingly simple/small steps, 22Self-checks, 72–73Self-managed teams, 40Sensible automation, 241, 248, 249, 256–257Separation of man from machine, 109Sequential pull system, 162, 162fService design. See Product and service
designService family, 175–176Set in order, 106–1077 Habits of Highly Effective People, The
(Covey), 97 Wastes. See Waste (muda)Shadow board, 123, 392Shape, 187–188Shewhart, Walter A., 63, 135, 138, 204Shine, 107
H1403_Manos_pi_420.indd 407 6/4/12 9:09 AM
408 Index
Shingo, Shigeo, 47, 60, 72–73, 77–78, 171–172, 240, 243–246, 369
Shingo Prize, 19, 62Shingo Transformational Process, 45, 45fShook, John, 172, 179, 307, 344Single minute exchange of dies (SMED),
243–246, 369, 392Single-piece flow, 246–248, 247f, 326, 392Single point lessons, 73, 130Six Big Losses, 119t, 365, 366, 366tSix Sigma, 33, 135, 138, 140, 141–14360-minute board. See Production (analysis)
boardSkill matrix
competency levels and, 31fdefinition of, 29developing, 29–31example of, 30f
Skills assessment, 29–31SMART objectives, 340–341Sobek, Durward, 307Social media, customer satisfaction and,
377–378Social responsibility, 289Society of Manufacturing Engineers (SME),
19, 20Sort, 105–106Source inspection, 260–261Spaghetti diagram, 56, 130, 159f, 392Stability, scientific thinking and, 63Standardization, 64–66
definition of, 64, 392in Design for Manufacturing, 234scientific thinking and, 64–66
Standardize, 107–108Standardized work analysis chart, 126,
129f, 130Standardized work combination table,
126, 128fStandard operating procedures (SOPs), 111Standards, principles of, 4–5Standard work
in continuous process improvement systems, 124–130
definition of, 392job element sheet and, 130production capacity chart and, 126, 127fin quality at the source, 71–72resistance to, 125tstandardized work analysis chart and,
126, 129f, 130standardized work combination table
and, 126, 128f
Statistical process control (SPC) charts, 204–209
Stop and fix, 78–79Storage
in Design for Manufacturing, 234point-of-use, 252, 391
Storming in team building, 38–39Storyboards, 143–146, 144–146fStrategic business assessment, 132–135
balanced scorecard in, 132–133benefits of, 132measures useful for, 135torganizational data for, 133–135, 134f
Strategic directionconsensus in creating, 301scientific thinking and, creating, 298t,
299–300Strategy deployment. See Policy
deployment/strategy deploymentStreamlining, 159Subject matter experts (SMEs), 230Suboptimizing, 52, 268Successive checks, 72Suggestion systems, 42–44
components of, essential, 42–43PDCA cycle in, 43successful, key points in, 43–44
Supermarket pull system, 161, 161f, 393Supplier
assessment and feedback, 266benchmarking, 267–268development, 266–267managed inventory, 261–264, 263f, 264f
Supplier-Input-Process-Output-Customer (SIPOC), 111, 154–155, 155f
Supply chainkaizen, 236traditional, 262f
Supply processes external, 261–269benchmarking in, 267–268cross-docking in, 264–266, 265flogistics in, 268–269supplier assessment and feedback in, 266supplier development in, 266–267supplier managed inventory in, 261–264
Supply processes internal, 269–276material handling in, 269–272, 269fplanning and scheduling in, 275–276warehousing in, 272–275
Surveys, 377Sustain, 108Swim lane flowchart, 111Symmetry (skewness), 188, 189f
H1403_Manos_pi_420.indd 408 6/4/12 9:09 AM
Index 409
Systemic thinking, 278–285, 280fclosed-loop thinking and, 282–285dynamic thinking and, 281–282holistic thinking and, 280–281
TTacit knowledge, 164Tactics of Innovation (Barker), 13–14Tagore, Rabindranath, 10Taguchi, Genichi, 232Takt awareness, 351Takt time, 349–351
analysis, 180–186, 181fcalculating, 349–350definition of, 350, 393process cycle time chart, 352f, 353frules, 351
Target condition. See CountermeasureTarget costing, 334Taylor, Frederick W., 98Team
adjourning in, 39cross-functional, 40functional, 39vs. groups, 40tmeetings, 297members of, picking, 40–41problem-solving in, 39self-managed, 40team building in, four phases of, 38–39, 38fvirtual, 40work, 38–41
Theory of constraints, 180, 3933P (Production Process Preparation), 115–116Throughput, 347, 393Tolerance stacking, 232–233Total production volume, 111, 111fTotal productive maintenance (TPM),
116–123. See also Overall equipment effectiveness (OEE)
definition of, 393elements of, 117implementing, 121–123lean systems and tools, 123tmachine loss pyramid in, 119, 120, 120fnonproduction example in, 121overall equipment effectiveness in,
117–119, 118fproduction example in, 119–121techniques, 116
Toyoda, Akio, 33Toyoda, Kiichiro, 75, 148
Toyoda, Sakichi, 68, 257Toyota Production System. See Just-in-
time (JIT)Toyota Way, The (Liker), 268Training, 20–21. See also Cross training;
On-the-job training (OJT)Transaction elimination, 334Transportation
in Design for Manufacturing, 234in flow analysis charts, 171waste in, 55, 263–264
Transversal order picking, 273, 274fTree, critical to quality, 207f, 208fTree diagram, 302, 304fTRIZ (theory of inventive problem
solving), 224“True North” of lean, 80Tuckman, Bruce, 38–39Two-card kanban systems, 259
UUnderstanding A3 Thinking (Sobek), 307Unimodal distribution, 188Unplanned downtime, 360–361Upside yes/downside no, 22Uptime, 359, 360, 389Urgency, creating sense of, 13–15Useless information, 164, 165tU-shaped cell layout, 254f
VValue
customer (See Customer value)definition of, 393modeling, 15–16
Value-added, 393. See also Non-value-addedValue stream
definition of, 172, 393first pass yield in, 348in overall equipment effectiveness, 364, 365
Value stream mapping, 172–180components of, 178fof costs, 296–297, 331, 333of current state, 176–177definition of, 172, 393of future state, 177–180icons, 179fplan, establishing and implementing, 180of product or service family, 175–176steps in, 175fstructure of, 177f
H1403_Manos_pi_420.indd 409 6/4/12 9:09 AM
410 Index
Variation data, presenting, 202–214analysis tools compared with variation
and audience types, 204tcommon cause vs. special causes,
204–205, 205fconcentration diagram for, 212–214,
213f, 214fscatter diagram for, 209–212, 210f, 211fspecial causes mapping, 206fstatistical process control charts for,
204–209Western Electric Rules for, 205–206
Variety reduction, 231–233Cp and Cpk and, 231–232, 232fquality loss function and, 232, 233ftolerance stacking and, 232–233
Virtual teams, 40Visual devices
for preventing defects, 89ffor providing ease of access, 89ffor sharing work activities, 88ffor showing status, 88fvital information translated into, 87–89as voice of operations, 90–92
Visual information boards, 297Visual management, 73, 393Visual workplace, 86–108
adherence mechanism, 95–96at airport, 93f, 94fandon board, 97, 97fcolor coding for inventory locations in
warehouse, 101, 101fdefinition of, 87diagonal line identifying missing critical
documents, 102, 102fFirst-Question-Is-Free Rule, 94–95, 95f5S standards and discipline, 104–108floor bordering, 90, 90finformation deficits, problem of, 92–94kindergarten classroom visual
management, 96flabeling pharmaceuticals at pharmacy,
91, 91fLOTO tool, 102, 102f, 103fto manage addition of inspector and
manual cleaning operation, 98, 100fto manage files at a doctor’s office,
101, 101fto manage office supply inventory levels,
98, 99fto manage raw materials in warehouse,
98, 99f
to manage welding operation and steel cutting process, 98, 100f
to manage work-in-process, 98, 98fproduction hour-by-hour chart, 104tsafety signs, 102, 103ffor scrap separator, 92fstacklight in hospitals, 97, 98fstoplight concept, 96, 97ftooling sharpening visual workplace, 91, 91fvisual devices, as voice of operations, 90–92visual devices, vital information
translated into, 87–89Voice of the Customer (VOC)
in A3, 309for control, ineffectiveness of, 335in customer satisfaction, 376in customer value, 289definition of, 335in education, 337examples of, 337fimportance of, 336measurement systems in, 335–338PDSA cycle for, 336, 338fin quality function deployment, 218Voice of the Process and, 335, 335f
Voice of the Process (VOP)in quality function deployment, 218Voice of the Customer and, 335
Voluntary Protection Program (VPP), 23
WWaiting, 55, 164, 165tWait time (delays), 358–359Warehousing, 272–275
largest gap order picking, 275, 275fmidpoint order picking, 274, 274ftransversal order picking, 273, 274f
Warning poka-yoke, 78Waste (muda), 52, 53–57, 53f
defective product, making, 56definition of, 53, 393elimination, in constancy of purpose,
287–288inventory, 55–56knowledge disconnect, 56–57movement, 56overprocessing, 55overproduction, 547 Wastes, definition of, 52, 387transportation, 55, 263–264waiting, 55
H1403_Manos_pi_420.indd 410 6/4/12 9:09 AM
Index 411
Water spider, 392Western Electric Rules, 205–206Wishful thinking, 164, 165tWomack, James, 261, 354, 376Work flow, 169Work flow analysis, 167–186
definition of, 169flow analysis charts, 171–172flowcharting, 169–171points to remember with, 169takt time analysis, 180–186value stream mapping, 172–180
Work-in-process (WIP), 108, 126, 130, 347, 393
Work safety, 25–26Work teams (mini kaizen), 235World Is Flat, The (Friedman), 373Wrong tool, 164, 165t
XX-matrix, 301–302, 303f
YYokoten (information sharing), 41–42
H1403_Manos_pi_420.indd 411 6/4/12 9:09 AM

ASQ is…• More than 90,000 individuals and
700 companies in more than 100 countries
• The world’s largest organization dedicated to promoting quality
• A community of professionals striving to bring quality to their work and their lives
• The administrator of the Malcolm Baldrige National Quality Award
• A supporter of quality in all sectors including manufacturing, service, healthcare, government, and education
• YOU
Visit www.asq.org for more information.
Belong to the Quality Community!
Established in 1946, ASQ is a global community of quality experts in all fi elds and industries. ASQ is dedicated to the promotion and advancement of qualitytools, principles, and practices in the workplace and in the community.
The Society also serves as an advocate for quality. Its members have informed and advised the U.S. Congress, government agencies, state legislatures, and other groups and individuals worldwide on quality-related topics.
VisionBy making quality a global priority, an organizational imperative, and a personal ethic, ASQ becomes the community of choice for everyone who seeks quality technology, concepts, or tools to improve themselves and their world.
H1403_Manos_pi_420.indd 412 6/4/12 9:09 AM