The landscape of caesarean sections in low-resource settings · PDF fileWho is delivering by...
41
Improving health worldwide www.lshtm.ac.uk The landscape of caesarean sections in low-resource settings: Who, where, and why? Lenka Beňová Francesca L. Cavallaro Oona M.R. Campbell July 27 2017
Transcript of The landscape of caesarean sections in low-resource settings · PDF fileWho is delivering by...

Improving health worldwide www.lshtm.ac.uk
The landscape of caesarean sectionsin low-resource settings:
Who, where, and why?
Lenka Beňová
Francesca L. Cavallaro
Oona M.R. Campbell
July 27 2017
Improving health worldwide www.lshtm.ac.uk
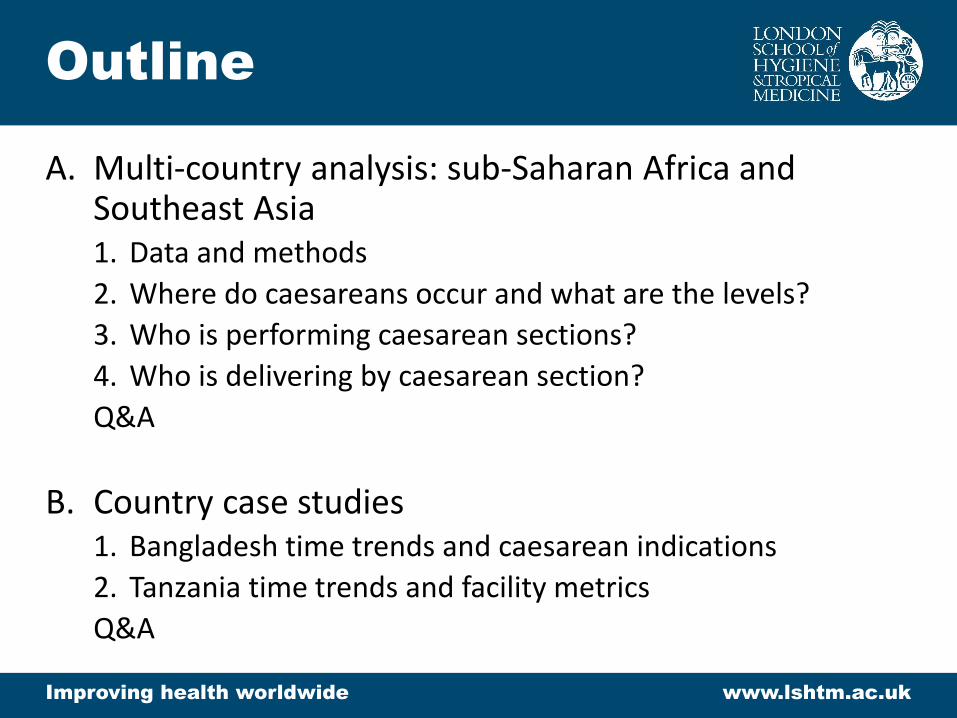
Outline
A. Multi-country analysis: sub-Saharan Africa and Southeast Asia1. Data and methods
2. Where do caesareans occur and what are the levels?
3. Who is performing caesarean sections?
4. Who is delivering by caesarean section?
Q&A
B. Country case studies1. Bangladesh time trends and caesarean indications
2. Tanzania time trends and facility metrics
Q&A

Improving health worldwide www.lshtm.ac.uk
Methods
• Nationally representative Demographic & Health Surveys
(2002-2016)
• Countries: 34 sub-Saharan Africa, 10 South/Southeast Asia
• Sample of women age 15-49
• Circumstances of most recent live birth in recall period
• Women’s self-report
• Maternal healthcare Markets Evaluation Team (MET) @ LSHTM standardised survey response options

Improving health worldwide www.lshtm.ac.uk
Three main questions
Malawi 2010
Was (NAME) delivered by caesarean, that is, did
they cut your belly open to take the baby out?
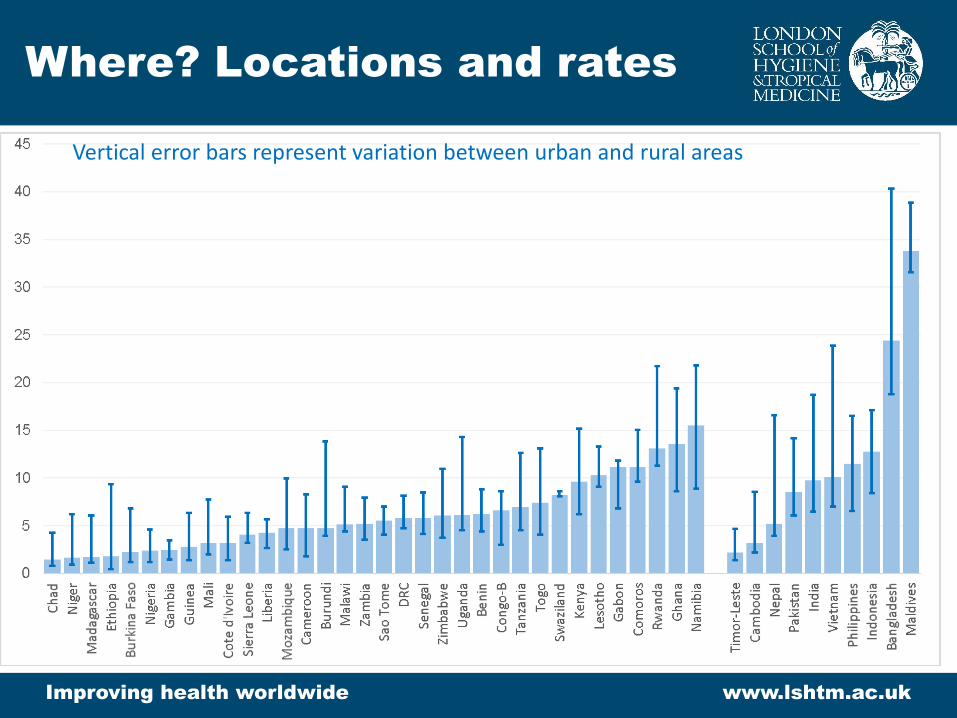
Where? Locations and rates
Improving health worldwide www.lshtm.ac.uk
Vertical error bars represent variation between urban and rural areas

Country rates
Improving health worldwide www.lshtm.ac.uk
Vertical error bars represent variation between urban and rural areasRed boxes highlight countries with ratio of urban/rural ≥ 4
Improving health worldwide www.lshtm.ac.uk
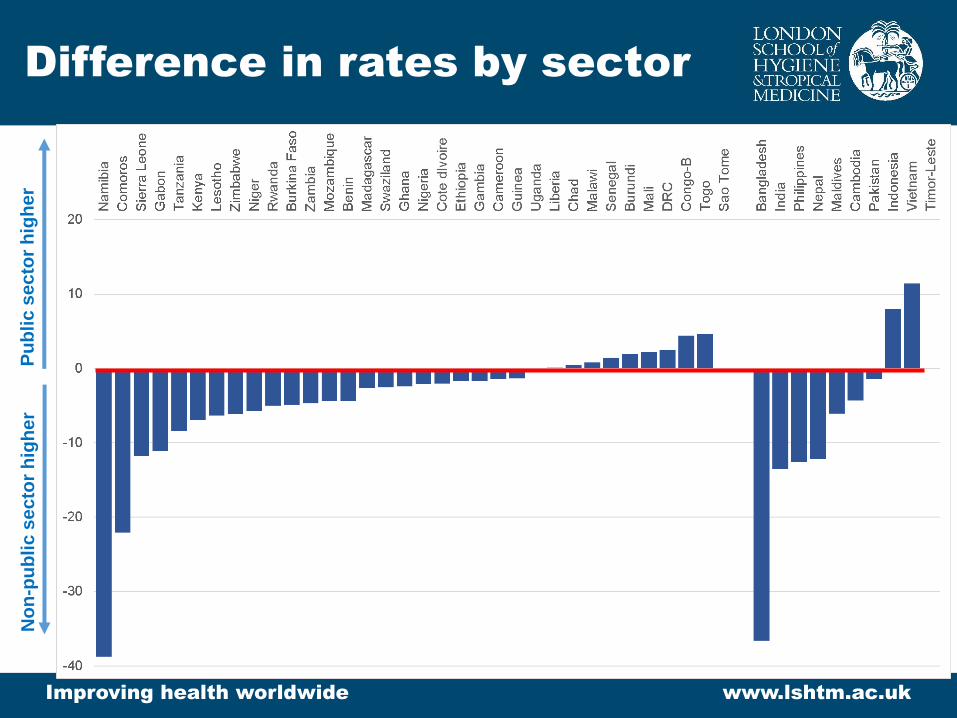
Difference in rates by sector
No
n-p
ub
lic
se
cto
r h
igh
er
Pu
bli
c s
ec
tor
hig
he
r

Improving health worldwide www.lshtm.ac.uk
Who performs caesarean
sections?
Distribution of caesarean sections by category of provider
Improving health worldwide www.lshtm.ac.uk
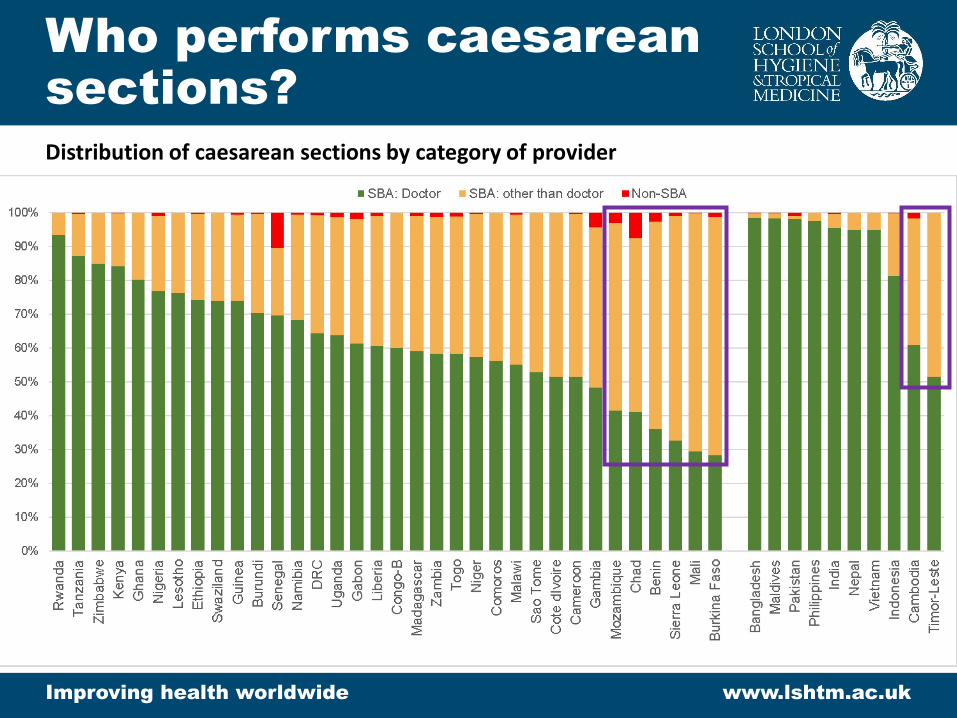
Distribution of caesarean sections by category of provider
Who performs caesarean
sections?

• Compared % with non-doctor SBA by facility ownership
• Sub-Saharan Africa (n=20):• 18 countries had a higher % of non-doctor SBA caesareans in public
compared to non-public facilities
Widest difference in Namibia: public (39%) and non-public (3%)
• In South/Southeast Asia (n=8):• Four countries had higher percentages in public
Widest difference in India: public (7%) and non-public (3%)
• Four countries in non-public facilities
Widest difference in Indonesia: public (10%) and non-public (23%)
Improving health worldwide www.lshtm.ac.uk
By sector:
Who performs csections?
Improving health worldwide www.lshtm.ac.uk
Who delivers by
caesarean section?
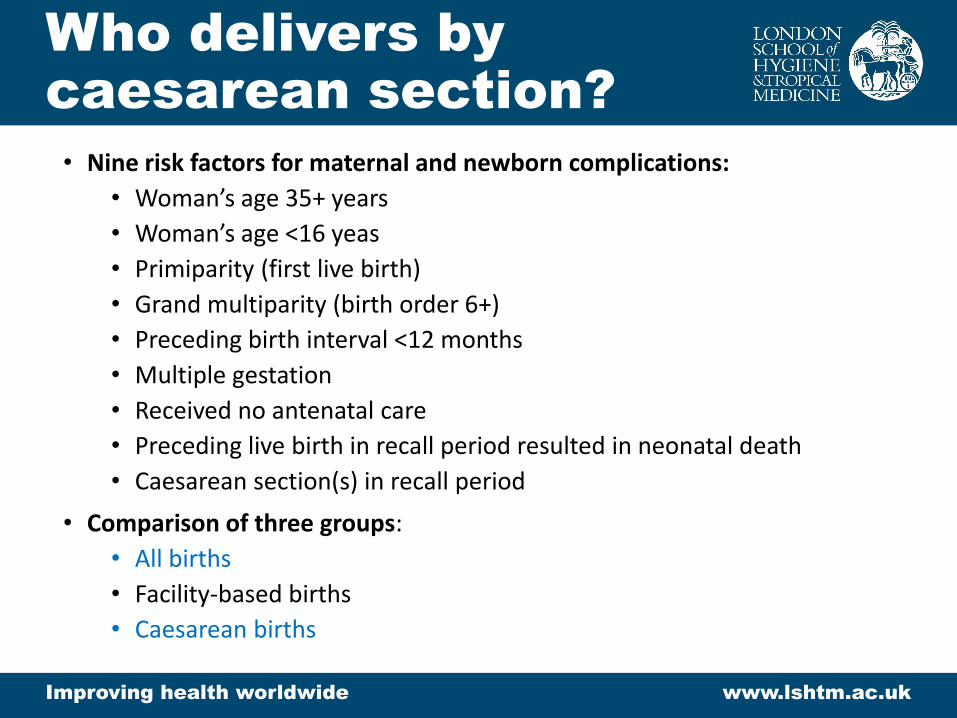
• Nine risk factors for maternal and newborn complications:
• Woman’s age 35+ years
• Woman’s age <16 yeas
• Primiparity (first live birth)
• Grand multiparity (birth order 6+)
• Preceding birth interval <12 months
• Multiple gestation
• Received no antenatal care
• Preceding live birth in recall period resulted in neonatal death
• Caesarean section(s) in recall period
• Comparison of three groups:
• All births
• Facility-based births
• Caesarean births
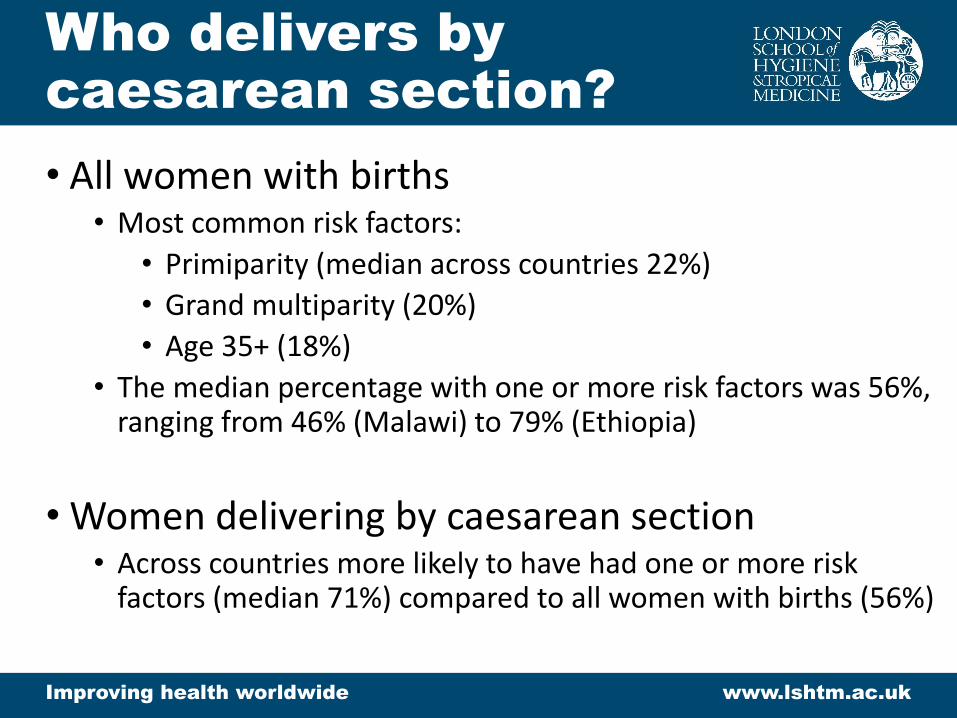
• All women with births• Most common risk factors:
• Primiparity (median across countries 22%)
• Grand multiparity (20%)
• Age 35+ (18%)
• The median percentage with one or more risk factors was 56%, ranging from 46% (Malawi) to 79% (Ethiopia)
• Women delivering by caesarean section• Across countries more likely to have had one or more risk
factors (median 71%) compared to all women with births (56%)
Improving health worldwide www.lshtm.ac.uk
Who delivers by
caesarean section?
Improving health worldwide www.lshtm.ac.uk
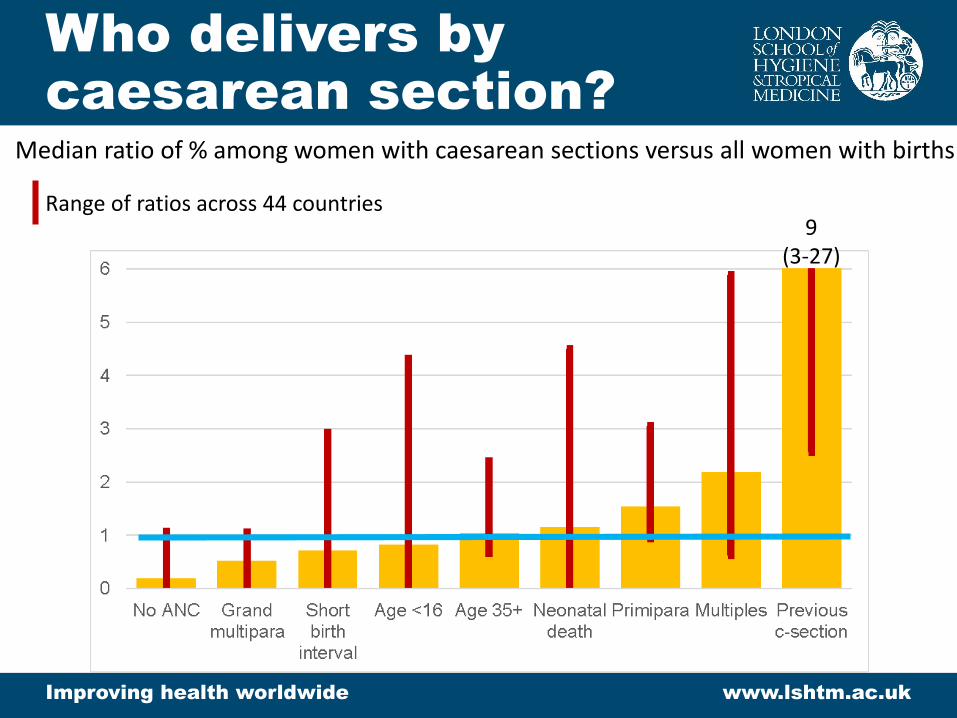
Median ratio of % among women with caesarean sections versus all women with births
Range of ratios across 44 countries9
(3-27)
Who delivers by
caesarean section?

Improving health worldwide www.lshtm.ac.uk
Who delivers by
caesarean section?
Ethiopia 2011

A. Multi-country analysis: sub-Saharan Africa and Southeast Asia1. Data and methods
2. Where do caesareans occur and what are the levels?
3. Who is performing caesarean sections?
4. Who is delivering by caesarean section?
Q&A
Discussion

Improving health worldwide www.lshtm.ac.uk
Bangladesh case study

Improving health worldwide www.lshtm.ac.uk
Trends over time
0
100,000
200,000
300,000
400,000
500,000
600,000
700,000
800,000
900,000
0%
10%
20%
30%
40%
50%
60%
2000
2001
2002
2003
2004
2005
2006
2007
2008
2009
2010
2011
2012
2013
2014
Bangladesh csection rates by residence (urban/rural)
Annual number of csections National csection rate
Urban 9.2%Rural 1.7%
Urban 14.1%Rural 2.4%
Urban 28.7%Rural 13.6%
Urban 40.3%Rural 18.8%

Trends over time
Improving health worldwide www.lshtm.ac.uk
0
100,000
200,000
300,000
400,000
500,000
600,000
700,000
800,000
900,000
0%
10%
20%
30%
40%
50%
60%
2000
2001
2002
2003
2004
2005
2006
2007
2008
2009
2010
2011
2012
2013
2014
Bangladesh csection rates by wealth (poorest/richest)
Annual number of csections National csection rate
Richest 12.3%Poorest 0.4%
Richest 19.1%Poorest 0.2%
Richest 40.9%Poorest 2.7%
Richest 54.1%Poorest 7.3%

Improving health worldwide www.lshtm.ac.uk
Key trends
• Facility deliveries increased from 10% in 2000 to 39% in 2014, and the private sector share of facility deliveries rose from 1/3 to 2/3
• Facility caesarean rate doubled from 33% to 63% (faster increase in private than public facilities)
• 99% of caesareans are performed by doctors

Improving health worldwide www.lshtm.ac.uk
DHS caesarean
questions

Improving health worldwide www.lshtm.ac.uk
Day and time of
caesareans
0
2
4
6
8
10
12
Sunday Monday Tuesday Wednesday Thursday Friday Saturday
% c
aesa
rean
s
0
2
4
6
8
10
12
Sunday Monday Tuesday Wednesday Thursday Friday Saturday
% c
aesa
rean
s
12am-9am 9am-6pm 6pm-12am
Public facilities
Non-public facilities

Improving health worldwide www.lshtm.ac.uk
Circumstances around
caesareans
• 71% of caesareans were first suggested by the doctor (22% by a family member, 7% by the woman)
• 98% of women were told the reason for the caesarean, when suggested by a doctor
• Mean length of stay = 6.7 days post-caesarean
• Mean cost = USD 261 (higher in non-public facilities), compared to USD 59 for vaginal delivery

Improving health worldwide www.lshtm.ac.uk
Reasons for caesareans
Reported reason for caesarean %
Other complications during delivery 32.7
Malpresentation 32.5
Failure to progress in labour 17.3
Previous caesarean section 15.4
Cord prolapsed 1.9
Multiple births 0.4
All caesareans
Timing of decision
Day of (%)Day before
(%)
Week
before (%)Earlier (%)
54.2 11.8 11.8 22.2
42.0 17.2 11.6 29.1
59.6 13.9 8.9 17.5
12.6 6.5 15.5 65.4
44.2 18.8 4.0 32.9
16.9 19.7 0.0 63.4
45.2 12.6 12.0 30.2
• Most women (69%) report a single reason for caesarean; 26% report two reasons (usually one of which is “other”)
Improving health worldwide www.lshtm.ac.uk
Key findings –
Bangladesh case study
• Much faster rise in caesarean rate among richest than poorest women, and in facility caesarean rate in non-public than public facilities
• Relatively low facility delivery rates and high caesarean rate in facilities
• Self-reported information – caution needed in interpretation, especially for reasons for caesarean
Improving health worldwide www.lshtm.ac.uk
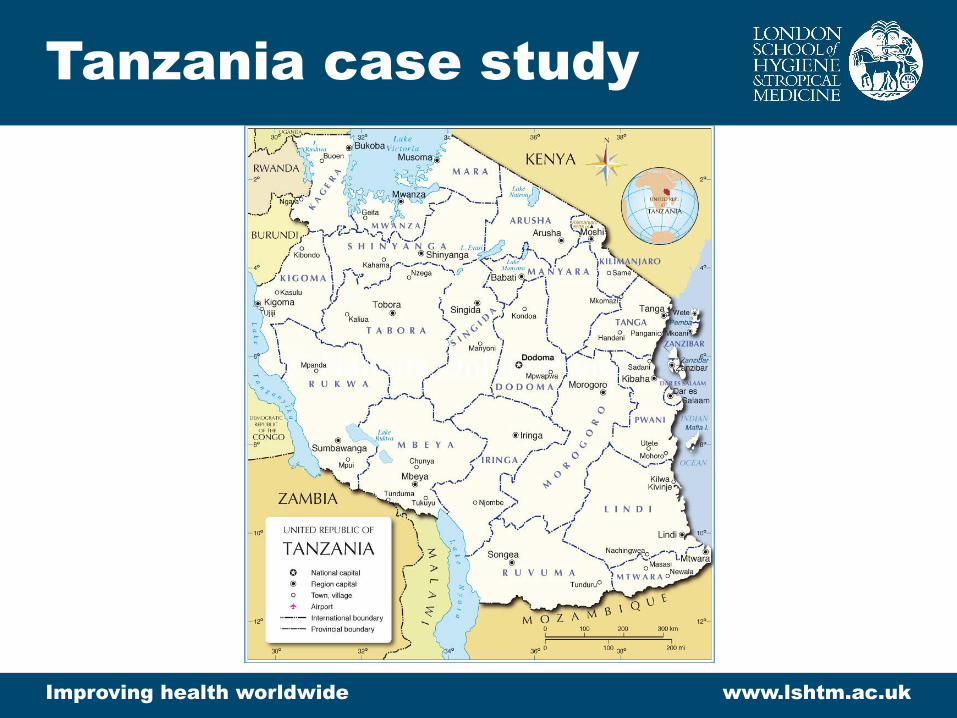
Tanzania case study

Improving health worldwide www.lshtm.ac.uk
Trends over time
0
20,000
40,000
60,000
80,000
100,000
120,000
140,000
160,000
0%
2%
4%
6%
8%
10%
12%
14%
16%
18%
20%
1996
1997
1998
1999
2000
2001
2002
2003
2004
2005
2006
2007
2008
2009
2010
2011
2012
2013
2014
2015
2016
Tanzania csection rates by residence (urban/rural)
Annual number of csections National csection rate
Urban 4.9%Rural 1.6%
Urban 7.2%Rural 2.6%
Urban 8.1%Rural 2.9%
Urban 10.2%Rural 4.0%
Urban 12.6%Rural 4.5%
Improving health worldwide www.lshtm.ac.uk
Trends over time
0
20,000
40,000
60,000
80,000
100,000
120,000
140,000
160,000
0%
2%
4%
6%
8%
10%
12%
14%
16%
18%
20%
1996
1997
1998
1999
2000
2001
2002
2003
2004
2005
2006
2007
2008
2009
2010
2011
2012
2013
2014
2015
2016
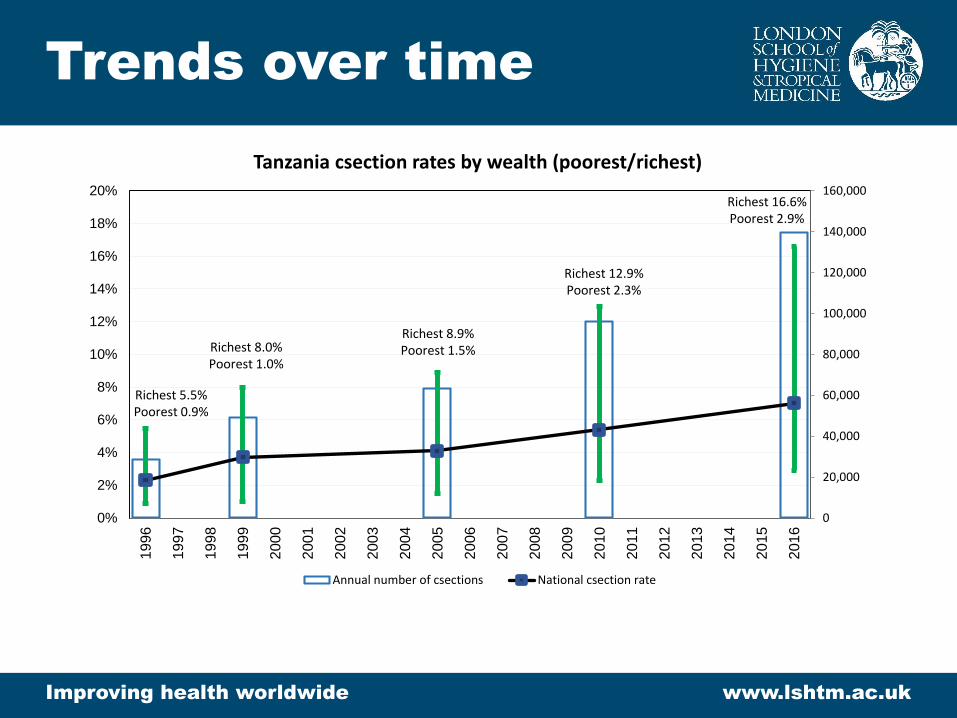
Tanzania csection rates by wealth (poorest/richest)
Annual number of csections National csection rate
Richest 5.5%Poorest 0.9%
Richest 8.0%Poorest 1.0%
Richest 8.9%Poorest 1.5%
Richest 12.9%Poorest 2.3%
Richest 16.6%Poorest 2.9%
Improving health worldwide www.lshtm.ac.uk
Key trends
• Facility delivery rate increased from 50% in 1996 to 68% in 2015-16
• Facility caesarean rate doubled from 4.7% to 10.3%, faster increase in private sector facilities
• One fifth of facility births occur in private facilities
• 10-14% of caesareans are performed by provider other than doctor/AMO

Improving health worldwide www.lshtm.ac.uk
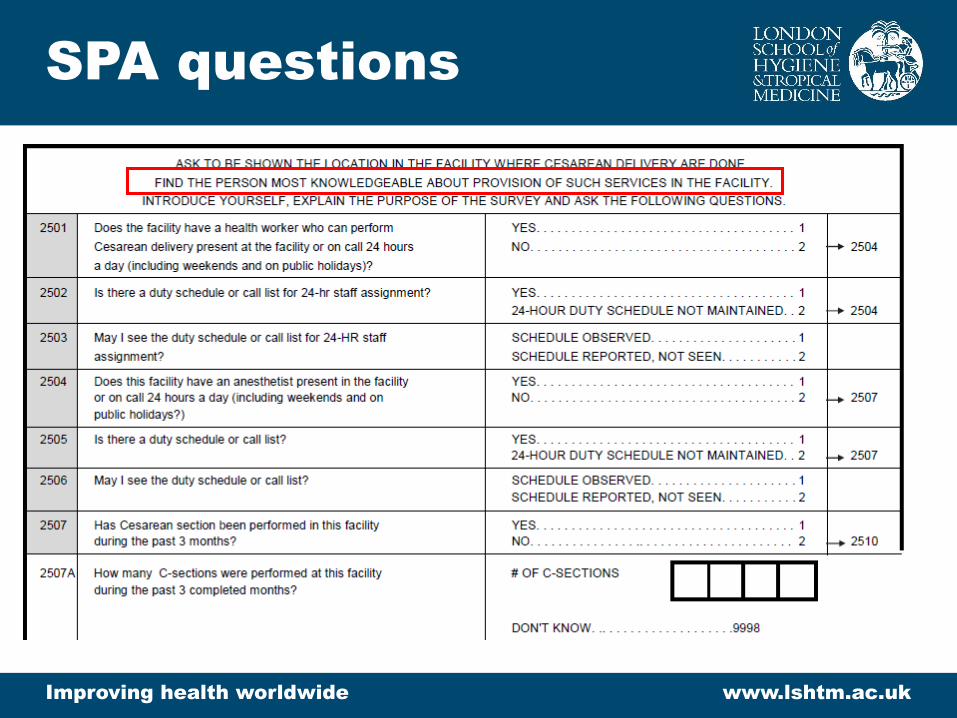
SPA methodology
• Service Provision Assessments (SPA) are nationally representative surveys of health facilities (public, private for-profit, FBO, parastatal)• Infrastructure
• Equipment
• Staffing
• “Does this facility offer any of the following client services?”
Improving health worldwide www.lshtm.ac.uk
SPA questions

Improving health worldwide www.lshtm.ac.uk
Facility type and sector
65.53.8
25.8
5.0
Public hospital
Private hospital
FBO hospital
Health centres
35.6
10.326.6
27.5
Facilities reporting to provide caesareans Caesareans
Improving health worldwide www.lshtm.ac.uk
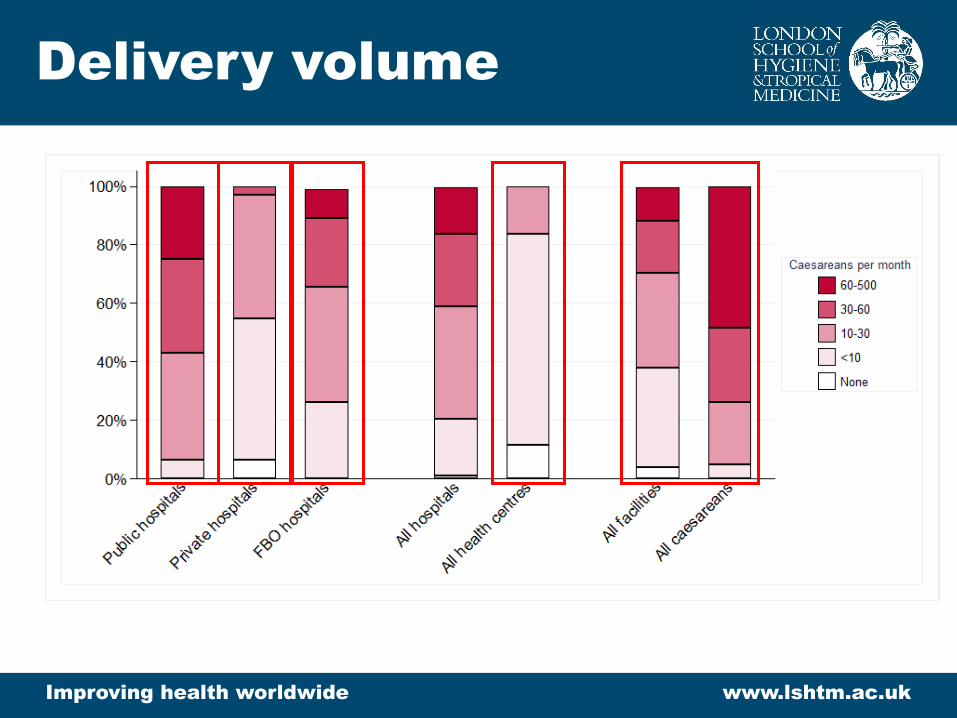
Delivery volume

Improving health worldwide www.lshtm.ac.uk
Staffing &
infrastructure
Facilities reporting to provide caesareans
Full-time doctor (%)
Full-time anaesthetist
(%)
24hr provider and
anaesthetist (%)
Piped water and
consistent electricity (%)
All CEmOCsignal
functions (%)
All general anaesthesia equipment
(%)
Public hospital 112 94 79 86 59 55 34
Private hospital 31 94 90 74 55 26 61
FBO hospital 84 81 92 88 37 41 66
All hospitals 227 89 85 85 50 46 49
All health centres 44 54 84 44 34 19 30
Overall (facilities) 271 79 85 74 46 38 44
Overall (caesareans) - 92 87 91 49 62 46

Improving health worldwide www.lshtm.ac.uk
Minimum readiness
criteria
0%
20%
40%
60%
80%
100%
CEm
OC fa
cilities
All ho
spita
ls
Facilit
ies
>=3c
s/m
th
All fa
cilities
All ca
esar
eans
All 3
2
1
None
Readiness criteria
Minimum readiness criteria: - Piped water into facility and consistent electricity- All general anaesthesia equipment available- 24hr caesarean provider and anaesthetist rota

Improving health worldwide www.lshtm.ac.uk
Minimum readiness by
zone
Percent facilities meeting 3 minimum criteria Percent caesareans in facilities meeting 3 minimum criteria

Improving health worldwide www.lshtm.ac.uk
Key findings – Tanzania
case study
• Over 90% of caesareans in Tanzania are conducted in public or faith-based organisation hospitals
• Half of caesareans are done in high volume facilities, 5% are done in facilities with less than 10 caesareans per month
• Only 25% of caesareans are done in facilities meeting 3 minimum readiness criteria
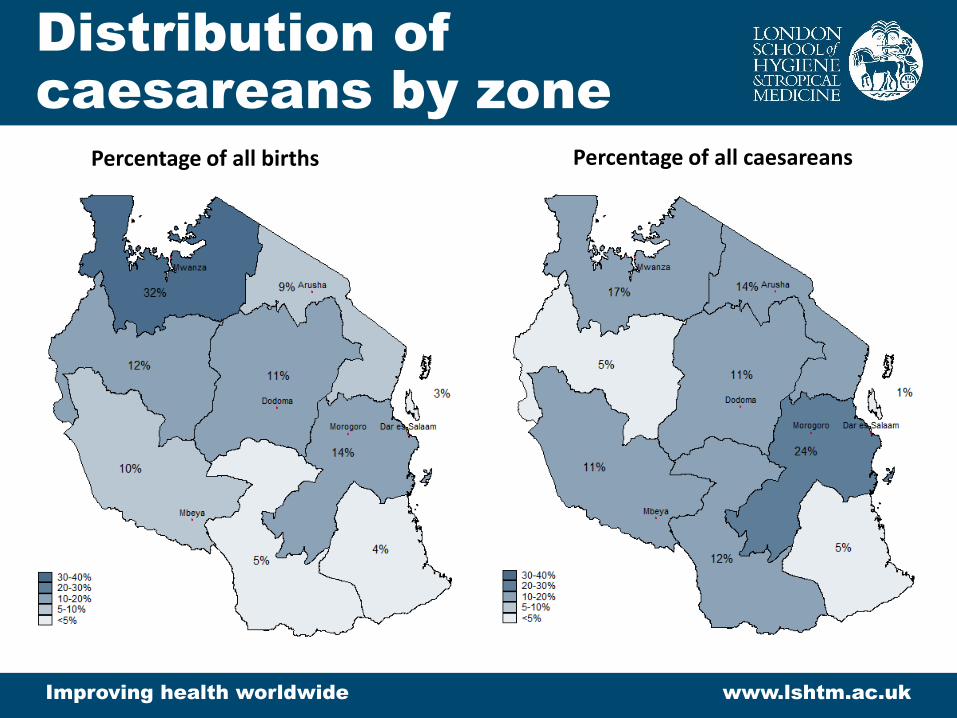
• Service readiness varies across facility types and geographical zones

B. Country case studies1. Bangladesh time trends and caesarean indications
2. Tanzania time trends and facility metrics
Q&A
Discussion
Additional slides
Discussion

Improving health worldwide www.lshtm.ac.uk
Reasons for caesareans
Reported reason for caesarean N (%)
Cord prolapsed 1.9
Failure to progress in labour 17.3
Other complications during delivery 32.7
Less pressure on baby's brain 6.3
Pre-eclampsia 2.4
Malpresentation 32.5
Premature baby 2.1
Diabetes 0.6
Convenience 9.4
Avoid labour pain 7.0
Multiple births 0.4
Previous caesarean section 15.4
Other 4.4
All caesareans
Timing of decision
Day of (%)Day before
(%)
Week
before (%)Earlier (%)
44.2 18.8 4.0 32.9
59.6 13.9 8.9 17.5
54.2 11.8 11.8 22.2
61.9 10.5 5.8 21.8
37.5 11.6 11.2 39.8
42.0 17.2 11.6 29.1
41.6 6.7 2.8 48.9
6.4 0.0 22.7 70.9
45.3 1.9 12.8 40.0
40.1 13.3 14.8 31.9
16.9 19.7 0.0 63.4
12.6 6.5 15.5 65.4
44.8 6.4 37.5 11.3
45.2 12.6 12.0 30.2
Improving health worldwide www.lshtm.ac.uk
Distribution of
caesareans by zone
Percentage of all births Percentage of all caesareans

Improving health worldwide www.lshtm.ac.uk
Providers of delivery
and surgical care
Qualification N %
generalist medical doctor 103 9.91
specialist medical doctor 42 4.04
assistant medical officer 210 20.21
clinical officer 180 17.32
assistant clinical officer 44 4.23
registered nurse 130 12.51
enrolled nurse 197 18.96
nurse assistant/attendant 123 11.84
laboratory technologist 1 0.1
laboratory technician 2 0.19
laboratory assistant 2 0.19
other 5 0.48
Among providers interviewed, qualification of providers reporting to provide delivery care and surgery [no survey weights/not representative of all providers]