The Kinetics and Mechanism of Reduction of Electron · PDF file · 2003-01-20The...
10
THE JOURNAL OF BIOLOGICAL CHEMWCRY Vol. 248, No. 17, Issue of September 10, pp. 6095-6103, 1973 Printed in U.S.A. The Kinetics and Mechanism of Reduction of Electron Transfer Proteins and Other Compounds of Biological Interest by Dithionite* (Received for publication, May 3, 1973) DAVID 0. LAMBETH~ AND GRAHAM PALMERS From the Biophysics Research Division, Institute of Science and Technology, and Department of Biological Chemistry, University of Michigan, Ann Arbor, Michigan 48105 SUMMARY The kinetics of the reduction by dithionite of several bio- chemically interesting substances has been investigated under anaerobic conditions by stopped flow spectrophotom- etry at pH 8.0 and 25”. Solutions of sodium dithionite were prepared and standardized by titration against lumiflavin 3-acetate in the absence of oxygen. Under pseudo-first order conditions (dithionite in excess) the reactions of spinach ferredoxin, horse metmyoglobin, lumitlavin 3-acetate, horse heart ferricytochrome c, and spinach plastocyanin conform to first order kinetics for several half-lives. Dependence of the observed pseudo-first order rate constant (kobs) on the dithionite concentration is described by the equation, kobs = a[SzO 42-p, where a = 8.6, 100, and 960 M-‘/~ s-r for ferre- doxin, metmyoglobin, and lumiflavin j-acetate, respectively. These results support a mechanism involving SO, as the kinetically important reducing species. With cytochome c and plastocyanin, the dependence of kobs on dithionite con- centration is described by the equation, kobs = u[S~O~~--]~/~ + b[S2042-], where a and b are 1450 M-r” s-r and 1.5 X lo4 M-l s-r in the case of cytochrome c and 1100 M-Ii2 s-l and 1.35 X lo5 M-l s-l in the case of plastocyanin. These two proteins apparently react with both SO,- and S204*-. Anal- ysis of the reaction of cytochrome c with dithionite in the presence of oxygen gave an estimated rate constant of 47 M-l” s-l for the oxygen-dithionite reaction. The rate con- stant of the reaction of ferricyanide with Sz042- is 1.4 X lo5 M-l S-l. Evidence is presented that ferricyanide also reacts rapidly with SO2 . When dithionite reacts with excess ferricytochome c, lumifiavin 3-acetate, or oxygen, the reaction rate is virtually independent of the oxidant concentration and a limiting first order rate constant of 1.7 SF is approached in each case. This rate constant has been assigned to the monomerization * This investigation was supported by Research Grant GM 12176 from the National Institutes of Health. Some of this work was presented at the Federation of American Societies for Ex- perimental Biology Meetings in Atlantic City, New Jersey, April, 1973. $ National Institutes of Health Postdoctoral Fellow (GM 52029). 5 To whom correspondence and reprint requests should be addressed. rate of SZO~~-, and its temperature dependence gives an activation energy of 24.1 Cal per mole for the dissociation of S20b2-. Determination of the equilibrium constant (K) for the reaction S2042- =: 2S02- by electron paramagnetic resonance spectroscopy has given a value of 1.4 =I= 0.4 X 10eg M. Dividing the above listed values of a by K1’2 gives the absolute rate constants for the reactions between SOZ- and oxidants. Sodium dithionite is the most versatile, powerful, and widely used reducing agent available to biochemists. Representative uses of dithionite arc found in the preparation of the reduced state of purified enzymes, electron transfer proteins, and co- factors; in the depletion of solutions of dissolved oxygen when studying the kinetics of dissociation of oxyhemoglobin; in the recording of the optical spectra of reduced oxidation-reduction components in mitochondria or whole cell suspensions; and in the study of the purified nitrogenase system where dithionite is used as a source of reducing equivalents and in maintaining the anaerobiosis necessary for the stability of the nitrogenase sys- tem. Despite this large variety of uses, there exists considerable ignorance concerning the mode of action of this reagent, a situa- tion due in part to the difficulty in preparing stable standardized solutions. The recent development of techniques for the prep- aration and analysis of reagents under a carefully controlled anaerobic atmosphere (cj. Refs. 1-3) has now made it possible to remedy this situation. Based on the finding that the rate of reaction of sodium di- thionite with both the fully oxidized and the semiquinone forms of flavodoxin is proportional to [SZO~~-]“~, Mayhew and Massey (4) have concluded that SOZ can serve as the reducing species in dithionite solutions. Their evidence favors the interpreta- tion (4) that flavodoxin is reduced by successive l-electron trans- fers from SOz-, rather than a 2-electron transfer from S2O42-. We have subsequently undertaken a kinetic study of the reaction of dithionite with a variety of proteins and biochemically rel- evant compounds, which are capable of participating in electron transfer reactions, in order to assess the relative importance of the dimcr and monomer forms of dithionite as reducing species. 6095 by guest on May 12, 2018 http://www.jbc.org/ Downloaded from
Transcript of The Kinetics and Mechanism of Reduction of Electron · PDF file · 2003-01-20The...

THE JOURNAL OF BIOLOGICAL CHEMWCRY Vol. 248, No. 17, Issue of September 10, pp. 6095-6103, 1973
Printed in U.S.A.
The Kinetics and Mechanism of Reduction of Electron Transfer
Proteins and Other Compounds of Biological
Interest by Dithionite*
(Received for publication, May 3, 1973)
DAVID 0. LAMBETH~ AND GRAHAM PALMERS
From the Biophysics Research Division, Institute of Science and Technology, and Department of Biological Chemistry, University of Michigan, Ann Arbor, Michigan 48105
SUMMARY
The kinetics of the reduction by dithionite of several bio- chemically interesting substances has been investigated under anaerobic conditions by stopped flow spectrophotom- etry at pH 8.0 and 25”. Solutions of sodium dithionite were prepared and standardized by titration against lumiflavin 3-acetate in the absence of oxygen. Under pseudo-first order conditions (dithionite in excess) the reactions of spinach ferredoxin, horse metmyoglobin, lumitlavin 3-acetate, horse heart ferricytochrome c, and spinach plastocyanin conform to first order kinetics for several half-lives. Dependence of the observed pseudo-first order rate constant (kobs) on the dithionite concentration is described by the equation, kobs = a[SzO 42-p, where a = 8.6, 100, and 960 M-‘/~ s-r for ferre- doxin, metmyoglobin, and lumiflavin j-acetate, respectively. These results support a mechanism involving SO, as the kinetically important reducing species. With cytochome c and plastocyanin, the dependence of kobs on dithionite con- centration is described by the equation, kobs = u[S~O~~--]~/~ + b[S2042-], where a and b are 1450 M-r” s-r and 1.5 X lo4 M-l s-r in the case of cytochrome c and 1100 M-Ii2 s-l and 1.35 X lo5 M-l s-l in the case of plastocyanin. These two proteins apparently react with both SO,- and S204*-. Anal- ysis of the reaction of cytochrome c with dithionite in the presence of oxygen gave an estimated rate constant of 47 M-l” s-l for the oxygen-dithionite reaction. The rate con- stant of the reaction of ferricyanide with Sz042- is 1.4 X lo5 M-l S-l. Evidence is presented that ferricyanide also reacts rapidly with SO2 .
When dithionite reacts with excess ferricytochome c, lumifiavin 3-acetate, or oxygen, the reaction rate is virtually independent of the oxidant concentration and a limiting first order rate constant of 1.7 SF is approached in each case. This rate constant has been assigned to the monomerization
* This investigation was supported by Research Grant GM 12176 from the National Institutes of Health. Some of this work was presented at the Federation of American Societies for Ex- perimental Biology Meetings in Atlantic City, New Jersey, April, 1973.
$ National Institutes of Health Postdoctoral Fellow (GM 52029).
5 To whom correspondence and reprint requests should be addressed.
rate of SZO~~-, and its temperature dependence gives an activation energy of 24.1 Cal per mole for the dissociation of S20b2-. Determination of the equilibrium constant (K) for the reaction S2042- =: 2S02- by electron paramagnetic resonance spectroscopy has given a value of 1.4 =I= 0.4 X 10eg M. Dividing the above listed values of a by K1’2 gives the absolute rate constants for the reactions between SOZ- and oxidants.
Sodium dithionite is the most versatile, powerful, and widely used reducing agent available to biochemists. Representative uses of dithionite arc found in the preparation of the reduced state of purified enzymes, electron transfer proteins, and co- factors; in the depletion of solutions of dissolved oxygen when studying the kinetics of dissociation of oxyhemoglobin; in the recording of the optical spectra of reduced oxidation-reduction components in mitochondria or whole cell suspensions; and in the study of the purified nitrogenase system where dithionite is used as a source of reducing equivalents and in maintaining the anaerobiosis necessary for the stability of the nitrogenase sys- tem. Despite this large variety of uses, there exists considerable ignorance concerning the mode of action of this reagent, a situa- tion due in part to the difficulty in preparing stable standardized solutions. The recent development of techniques for the prep- aration and analysis of reagents under a carefully controlled anaerobic atmosphere (cj. Refs. 1-3) has now made it possible to remedy this situation.
Based on the finding that the rate of reaction of sodium di- thionite with both the fully oxidized and the semiquinone forms of flavodoxin is proportional to [SZO~~-]“~, Mayhew and Massey (4) have concluded that SOZ can serve as the reducing species in dithionite solutions. Their evidence favors the interpreta- tion (4) that flavodoxin is reduced by successive l-electron trans- fers from SOz-, rather than a 2-electron transfer from S2O42-. We have subsequently undertaken a kinetic study of the reaction of dithionite with a variety of proteins and biochemically rel- evant compounds, which are capable of participating in electron transfer reactions, in order to assess the relative importance of the dimcr and monomer forms of dithionite as reducing species.
6095
by guest on May 12, 2018
http://ww
w.jbc.org/
Dow
nloaded from
6096
It is our hope that the results of these investigations will provide a general basis for an understanding of the reactivity of di- thionite so that its future use as a tool in biochemical research can be more rationally exploited.
EXPERIMEKTAL PROCEDURE
ilBaterials
The sources of the substances used were as follows: horse heart ferricytochrome c, type VI, and equine muscle myoglobin, type I, Sigma Chemical Co.; sodium dithionite, Hardman and Holdman (Manchester, England) ; potassium ferricyanide, J. T. Baker Chemical Co. ; tetrasodium pyrophosphate, Fisher Sci- entific Co. Spinach ferredoxin was purified according to the procedure of Petering and Palmer (5). Spinach plastocyanin was prepared by the method of PlesniEar and Bendall (6) except that the final chromatography on a DEAE-column was replaced by a step involving chromatography on Sephadex G-100. Super- oxide dismutase was prepared according to the method of hlcCord and Fridovich (7). Ferredoxins from M~C~OCOCCUS lactilyticus and Clostridium pasteurianum were generous gifts from Dr. Robert Mathews. Lumiflavin a-acetate was a gift from Dr. Sandro Ghisla. Other compounds were of the highest purity commercially available. All materials were used without further purification and all solutions were prepared in glass- distilled water.
Methods
Preparation of Anaerobic Xolutions-Unless noted otherwise, all solutions were prepared in 20 mM sodium pyrophosphate buffer containing 0.25 M l;aCl and titrated to pH 8.0 with dilute HCl. Solutions in glass tonometers were made anaerobic by equilibrating the liquid phase at least six times with an atmos- phere of nitrogen gas purified by passage over hot copper turn- ings. The oxygen concentration of the nitrogen treated in this way was reduced to less than 0.1 ppm. Failure to remove thoroughly oxygen from solutions of cyt cl’I1 or lumiflavin re- sult.ed in a lag phase in t.he kinetics observed by the stopped flow technique. The lag phase was most apparent at low di- thionite concentrations.
Preparation and Standardization of Dithionite Solutions- Dithionite solutions were prepared either by placing a weighed quantity of solid material in the side arm of a glass tonometer and then dissolving in 40 ml of oxygen-free buffer or by loading a modified Hamilton Gas-Tite syringe (1) with a more con- centrated solution prepared under anaerobic conditions and diluting an aliquot of this solution into 40 ml of oxygen-free buffer (1). Dithionite solutions were standardized by anaerobic spectrophotometric titration against lumiflavin a-acetate ac- cording to the method of Burleigh et al. (l), except that the titration cell used by them (see Fig. 1 of Ref. 1) was modified as follows. The upper portion of the side arm containing the rubber septum, 19/22 standard taper joint, and gas flow lock was removed and replaced with a standard l-mm bore stopcock fitted with a male 7/25 standard taper joint. Preparation for an anaerobic titration proceeded as follows. The titration cell containing the flavin solution was attached, by means of the stopcock on the main arm of the cell and a very short length of butyl rubber tubing, to the anaerobic train. The flavin solution rvas carefully purged of oxygen. Then with purified nitrogen gas flowing rapidly through the titration cell and out the stopcock
1 The abbreviations used are: cyt ~111, horse heart ferricyto- chrome c; kobs, observed first order rate constant.
on the side arm, the 20-gauge needle of the Hamilton syringe was lowered until the components of the 7/25 joint made a gas- tight seal. The stopcock to the anaerobic train was then closed and the titration proceeded as described by Burleigh et al. (1). The tonometer used for dithionite solutions in the stopped flow
experiments also had a l-mm stopcock and a 7/25 male joint. With nitrogen gas flowing through the tonometer, the modified syringe could be attached, filled with dithionite solution, and then removed from the tonometer and attached to the titration cell as described above. Samples of dithionite solutions re- moved from the tonometer before and after stopped flow ex- periments routinely showed (within %5’%) the same concen- tration by titration, thus demonstrating the stability of the dithionite solutions and validating the sampling and titration procedures. Dithionite solutions varying widely in concen- tration could be titrated by the use of an appropriate volume and concentration of lumiflavin a-acetate solution in the titra- tion cell. It was found empirically that the concentrations of strong solutions of dithionite ( 210 mM, 40 ml of solution) could be calculated directly from the weight of solid dithionite used, assuming a molecular weight of 174 and 92% purity. All di- thionite solutions were used within 3 hours after preparation but were stable for several days.
Stopped Flow Xpectrophotometry-The concentrations of var- ious oxidants were determined spectrophotometrically in a Zeiss DMR 21 recording spectrophotometer using the following ex- tinction coefficients: cytochrome c, AA:::-,, = 20.5 rnM+ cm-l (8) ; spinach ferredoxin, AJ20 = 9.4 mM-1 cm-1 (9) ; azide deriv- ative of horse heart metmyoglobin, As40 = 11.2 MM-’ cm-l (10) ; lumiflavin a-acetate, AA$ie4d6_ox = 11.3 mM-’ cm-l (4) ; ferricya- nide, Akz’J = 1.02 mM-’ cm-l (11). The stopped flow instrument used is basically the one described by Ballou (la), but which has been modified as follows. All valves, connecting tubes, and the mixer-observation module are submerged in a water bath which is closed to the atmosphere by sheets of Plexiglas and aluminum. The water bath is continuously purged with nitrogen gas while circulation and temperature control are maintained by a Lauda KS/RD water circulator. Connection of glass tonometers fitted with male Luer tips occurs through holes in the Plexiglas directly above three-way Hamilton valves. These valves inter- connect the tonometers, l-ml Hamilton Gas-Tite syringes used as storage syringes, and the tubes leading to the mixer-observa- tion module.
A 250-watt tungsten-iodide lamp is used as the light source. Purification of the light source is achieved with a Jarrell-Ash 82-410 monochromator and by inserting the following filters be- tween the monochromator and observation cell: 470 to 570 nm, Kodak infrared rejection filter; 390 to 470 nm, Kodak infrared rejection filter plus Corning No. 5030 filter; and 315 to 360 nm, Corion 330 nm filter.
Voltage signals from an EM1 9592B photomultiplier tube (S-10 response) are converted to absorbances by means of an electronic circuit which includes a Philbrick-Nexus model 4350 logarithmic amplifier from Teledyne. Signals from this circuit are stored in a Varian C-1024 time average computer used as a fast recorder. Single absorbance traces from the Varian C-1024 computer are then read on a model 7035B Hewlett- Packard X-Y recorder. Plots testing for first order behavior are obtained by feeding the signal stored in the Varian C-1024 com- puter through a circuit containing an Analog Devices model 755P logarithmic amplifier. The output of this circuit is also displayed on the X-Y recorder. The stopped flow instrument has a measured dead-time of 1.3 ms and a 2-cm path length.
by guest on May 12, 2018
http://ww
w.jbc.org/
Dow
nloaded from

6097
Plots of kobs against the concentration of reactant in excess were
0 12 used to determine the order of the reaction with respect to the 7 reactant in excess.
Y 0 IO
6 Measurement of X02- Concentration by EPR-Dithionite solu-
5 g 0.08
tions were prepared in a tonometer under rigorously anaerobic
:: 5 conditions and then transferred anaerobically into an evacuated
9 006 flat cell. Q 4
The flat cell was connected to the tonometer by means
’ 004 B of a 7/25 standard taper glass joint. Aliquots of dithionite
3% solutions less than 20 mM in concentration were standardized bp
002 I titration against lumiflavin 3-acetate. The concentrations of ’ : SO, in standardized solutions were determined by double in-
0 I tegration of the room temperature radical signal and comparison
with the intensity of a spectrophotometrically standardized 0 solution of nitrosyl disulfonate (Aldrich) dissolved in 0.02 N
0 4 6 12 16 20 24 28 32 NaOH (13). The spectra of dithionite and nitrosyl disulfonate
TIME. msee solutions were recorded in the same aqueous ?lat” cell.
FIG. 1. The reduction of 4.5~~ cytochrome c by 5.45 mM sodium dithionite. The data shown are a readout from the Varian C-1024 Theory computer onto an X-Y recorder of the change in absorbance with time at 550 nm. The trace between Points A and B show the In view of the known equilibrium between the dimer and
changes in absorbance during flow. At Point B, flow stops and monomer species of dithionite (14, 15), there are two basic mech-
the absorbance increases (downward deflection) with time. The One involves log plot was generated by first biasing the “infinite time” voltage
anisms for the reduction of oxidants by dithionite.
of the absorbance curve to give 0 mv and then feeding the S20J2-, the other SOZ- as the reducing species. Only in cert,ain
absorbance signal through a second circuit containing a logarith- limiting cases will the mechanisms be easily studied experi-
mic amplifier. After flow stops, the log plot is linear, for more mentally. These cases are tabulated in Table I.
than four half-lives. From the slope of the log plot, a half-time of Case 1. Xz042- as the Reducing Species-The mechanism can 3.53 ms is calculated, which corresponds to an observed first order rate constant (kobs) of 196 s-1. The steps seen in the tracings are
be formally written as:
a result of the Varian C-1024 computer recording information in h discrete voltages on the vertical scale and discrete channels on the
szoz- + A - S?Od; + A- (1)
horizontal scale. With maximum sensitivity settings, the mini- mum vertical step is 0.0003 optical density and minimum channel- &O*- + A 122 SzOe + A- (2) width is 0.25 ms. The over-all instrumental time constant is <0.2 ms. This system is classified by Frost and Pearson (16) as com-
TABLE I
Kinetic restrictions for reactions of dithionite (Equations I to 4)
Restrictions
Case Reducing species kobs Kinetics for reaction of limiting reagent
Concentrations Rate constants -I-
la f&0,2- A > 10IS,O,z-] k2 >> k, or kl << ks First order
b [SzO?l > 51Al ka << kl First order
C k3,0,2-l > 5[A] kz L k, Mixed zero and first order
2a so,- [S,O,z-l > 5lAl 2k-31602-I >> k,[A] First order
b [A] > lO[P~0,~-1 kbjA] >> 2k-;[SOz-] First order
C [Wa2-1 > 5[Al kr[A] >> 2k-3[S02-] Mixed zero and first order
Sixty-hertz noise normally corresponds to less than 0.001 ab-
sorbance, peak to peak. A complete description of the instru-
ment and associated electronics will be published separately.2 Unless noted otherwise, all kinetic experiments were con-
ducted at 25.0 f O.l”, spectral band widths of 3 nm were used,
and concentrations after mixing are given in the figure legends. Reactants were mixed in a ratio of 1: 1 by volume.
Analysis of Stopped Flow Data-Experiments were generally
designed to give pseudo-first order kinetics by having one
reactant at least 5-fold in excess. Checks for first order behavior were obtained by observing the linearity of the semilogarithmic plots of A absorbancy versus time obtained as described in the legend to Fig. 1. From the half-life, the pseudo-first order rate constant was obtained by the relationship Kobs = 0.693/tllz.
2 D. P. Ballou, D. Lambeth, G. Ford, B. Hosein, and G. Palmer, manuscript in preparation.
petitive, consecutive second order reaction. In the above scheme, E&O,- is a formal designation for the product of reaction (I). It would be expected to be a very reactive species and should rapidly reduce A as shown in Reaction 2 or rapidly re-form S2O42- either by a disproportionation reaction or by decom- posing to SO2 and SOZ with the latter species re-forming S,Oz-. The kinetics summarized in Cases la to c of Table I readily follows from the discussion of Frost and Pearson (16).
Case 9. XOZ as Reducing Species-The following equations represent the reduct’ion mechanism :
SO%- + A -f% SO, + A- (4)
The respective rate equations for the reactants are:
by guest on May 12, 2018
http://ww
w.jbc.org/
Dow
nloaded from

6098
d[S2042-I - ~ = k&,O4~-I - k-JS02-12
dt
d[SO2-I ~ = 2k3[s2042-j - 2k-~S011* - kJS0~-1lAl dt
(6)
Applying the steady state approximation to Equation 6 and . .
rearrangmg gives
2kalSzO42-1 = [SO,] (2k-3[S02-I + kr[A])
There are two useful limiting cases for Equation 8:
(8)
Pa) 2/c-3 [SO,] >> ka [A]
The k,[A] term in Equation 8 can now be neglected, which means that the dithionite dimer-monomer equilibrium is not perturbed by reaction of A with SO,. Solution of Equation 8 for [SOS-] and substitution into Equation 7 gives
4Al --= dt
kJ-C1Q&042-]1’2 [A] (9)
where li is the equilibrium constant for the dimer-monomer equilibrium. When [Sn042-] . is m sufficient excess to give pseudo- first order kinetics, A will react following first order kinetics, and
k ohs = kq fw [&OF11’2 (10)
Therefore, a plot of k&s against [S2042-]1’2 will be a straight line passing through the origin with a slope of k4K112, and the value of lcq can be obtained from an independently determined value of the equilibrium constant. It should be noted that the in- equality required for Case 2a holds most rigorously at high [S20,z-]/[S] ratios:
c3) kq [A] >> 2k-3 [SO,-]
The 2kJSOZ-] term in Equation 8 can now be neglected. Solv- ing for SO?- and substituting the resulting expression into Equa- tion 7 gives
dl-41 dt
- %[SLh-I (11)
Thus, the rate of reaction is first order with respect to the S2O42- concentration and zero order in A concentration, and the mono- merization rate of dithionite is the rate-limiting step. When A is in excess, dithionite will disappear in a first order process with a rate constant of kS which will be independent of the actual con- centration of A.
Considering Case 2c with dithionite in sufficient excess to give pseudo-first, order conditions, the [SO11 term of the rate con- stant inequality is essentially constant since the dithionite con- centration will not change significantly during the reaction. However, the assumed inequality must break down during the course of the reaction as the concentration of A approaches zero. Therefore, the expected kinetics of A disappearance will be zero order at the beginning of the reaction with a gradual change toward first order as the reaction nears completion (Case 2~).
Reconsidering Cases 2a and 2b of Table I, we wish to em- phasize that the restrictive inequalities for the rate constants are a combined function of [A], [SO,], k-3, and kd. It is readily seen that for any given oxidant, A, Case 2a kinetics will be ob- served if the [S204*--]/[A] ratio is raised sufficiently high, and
Case 2b kinetics if the ratio is sufficiently low. The transition from Case 2a to Case 2b merely involves a change in the rate- limiting step from lc4 to k3.
RESULTS
Reduction of Ferredoxin, Metmyoglobin, and Lumiflavin S- Acetate with Dithionite: Pseudo-first Order Conditions with Di- thionite in Excess-The reduction of spinach ferredoxin,z horse metmyoglobin, and lumiflavin 3-acetate by excess dithionite was studied over a wide range of dithionite concentrations at 25’. Semilogarithmic plots of the data showed that the reactions conformed to first order kinetics for more than three half-lives. Plots of kobs against [S2042-]1’2 were linear and extrapolated through the origin in each case (Fig. 2, A to C). From the slopes of the plots, the rate constants are 8.6, 100, and 960 M-l”
s-l for ferredoxin, metmyoglobin, and lumiflavin a-acetate, respectively. Thus, the observed kinetics is consistent with that of Case 2a and it is concluded that SOZ- is the effective reducing species under these conditions.
Rate constants of 11 M-1i2s-1 and 19 M-I/~ s-l were obtained for the reduction of ii!l. lactilyticus and C. pasteurianum ferredoxins by pseudo-first order concentrations of dithionite. In contrast to spinach ferredoxin, the first order plots showed noticeable, although slight, curvature by the end of one half-life. Since these proteins have two reducing sites, this may indicate that the two sites in these proteins are not reduced at the same rate. However, plots of k&s (obtained from the initial slope of the first order plots) against [S2042-]*‘2 were linear and extrapolated through the origin as was observed for spinach ferredoxin (Fig. 2A). The similarity of the rate constants for spinach and bac- terial ferredoxins is remarkable as the structures of the active sites of these proteins are quite different (17, 18).
Reduction of Ferricytochrome c and Ylastocyanin by Excess Dithionite-Both the reduction of cyt cnl and spinach plas- tocyanin4 accurately follow first order kinetics for at least four half-lives when the concentration of dithionite is at least 5-fold in excess. However, a linear relationship was not observed when k& was plotted against [S204*-] or against [SZ042-]“Z with the former plot showing downward and the latter upward cur- vature. Fig. 3 shows a plot of k&s against [S2042-]1’2 for cyt cnl and Fig. 4 shows a plot of k&s against [S2042-] for plas- tocyanin. In both cases, the data are fitted by equations of the form
kobs = a[S204”]“2 + b[S*042-] (12).
where a and b are 1.45 X lo3 M-l” s-l and 1.5 and lo4 M-I se1 in the case of cyt clI1, and 1.1 X lo3 M-I/~ s-r and 1.35 X lo5 M-I
s-l for plastocyanin. The points in Figs. 3 and 4 represent actual experimental data whereas the smooth curves are calculated from the respective forms of Equation 12. These results suggest that both SO, and SsO42- are reducing species for cyt cnl and plas- tocyanin at the concentrations of dithionite used. However, it will be noted that the b term of Equation 12 will become in- creasingly important as the dithionite concentration is increased since, for example, doubling the S204*- concentration increases the S02- concentration by a factor of only 1.414.
It is uncertain whether the linear portion of Fig. 3 extrapolates through the origin. However, an examination of Equations 7 and 8 shows that a breakdown of the inequality on which Case 2a
3 The experiments with spinach ferredoxin were done in col- laboration with Barbara Hosein.
4 The experiments with spinach plastocyanin were done in collaboration with Kathy Blessing.
by guest on May 12, 2018
http://ww
w.jbc.org/
Dow
nloaded from

6099
I I I I I I I
0 002 004 006 008 010 0.12 0.14 c
[S,0~2]“2. M”’
J I.14
FIG. 2. The dependence of kabs on the square root of the dithio- nite concentration for the reactions of ferredoxin, metmyoglobin, and lumiflavin a-acetate with sodium dithionite. A, ferredoxin concentration, 20 PM; dithionite concentration varied from 66 pM
to 21.8 mM; observations at 420 nm. B, horse metmyoglobin con-
2:
2(
I: T
P
a x0
IC
:
jO-
X3-
50-
)O-
io-
I I I I I I 0.01 0 02 003 004 0.05 0.06 0.07 0.00 C
[S,Oi*]“*, M”*
FIG. 3. k,,bs plotted against the square root of the dithionite concentration for the reaction of cyt crrr with dithionite. Cyt $11 concentration, 4.5 PM; dithionite concentration varied from 19.5 ,AVI to 7.5 mM; observations at 550 nm. The points shown represent actual experimental data. The curve shown is drawn for the equation kobs = 1450 M- 1’2 S-l [s&42-] 1’2 + 15,000 M-’ S-*
[s2042-1.
is based may occur as the dithionite concentration is lowered, resulting in downward curvature near the origin of plots of [ s2o.P11’2 versus kobs even though pseudo-first order conditions are maintained.
C
150-
Lumiflovin-3-Acetate
50 i
/ d' 005 0.10 0.15 ,
[S20~2]"2, M”’
centration, 11.5 to 13 PM; sodium dithionite varied from 19.5 PM
to 16.2 mM; observations at 562 nm. C, lumiflavin 3-acetate con- centration, 9 to 10 FM; dithionite concentration varied from 0.225 to 21.9 mM; observations at 446 nm.
2oc
16C
7
ii 12c H
2
8C
Spinach Plastocyanin
I I I I I I 0.2 0.4 0.6 0.8 1.0 1.2
[S20d2]. mM
FIG. 4. kobs plotted against the dithionite concentration for the reaction of 5.5 MM spinach plastocyanin with dithionite; observa- tions at 597 nm. The points shown are the observed rate con- stants. The cu,rve is drawn to fit the equation kobs = 1100 M-l”
S-l [s~o~2-]“2 + 1.35 x lo6 M-’ S-l [s&d*].
Reaction of Dithionite with Excess Oxygen, LumiJlavin S-Acetate, and Ferricytochrome c-The results of the reaction of oxygen, lumiflavin 3-acetate, and cyt cnl with substoichiometric con- centrations of dithionite are shown in Fig. 5, where the reciprocals of the observed rate constants are plotted against the reciprocals
by guest on May 12, 2018
http://ww
w.jbc.org/
Dow
nloaded from
6100
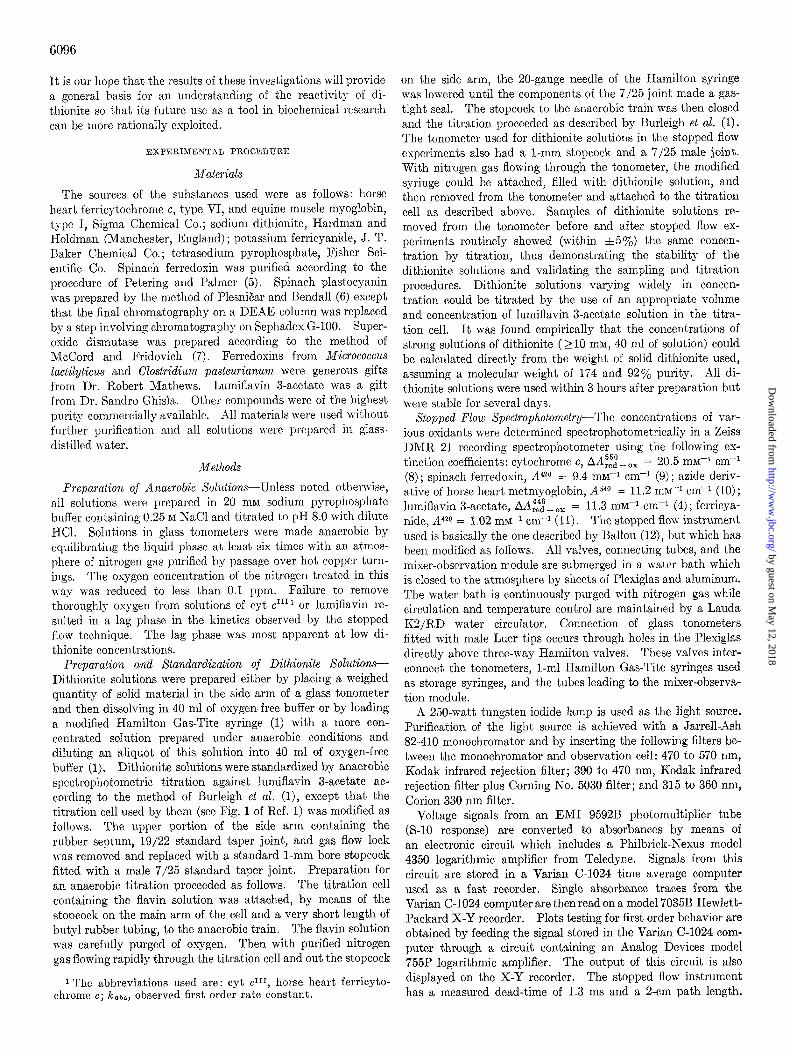
of the oxidant concentrations. As can be seen in Fig. 5, varying the initial oxygen concentration from 14.5 to 145 times the initial dithionite concentration has very little effect on the rate con- stant. First order kinetics was observed at all oxygen con- centrations for two or more half-lives. Extrapolation of the plot in Fig. 5 to infinite oxygen concentration gives a limiting rate constant of 1.7 s-i.
An extrapolation of the data for the reactions of lumiflavin 3- acetate and cyt crrl with dithionite (Fig. 5) also gives the same limiting rate constant. The first order plots were linear except n-hen the initial concentration of oxidant and dithionite were approximately equal. It will be noted from Equation 12 that t.he [S2O42-] term will not make a significant contribution to kobs for cyt cr” reduction at the dithionite concentration used. Thus, the kinetic results shown in Fig. 5 are in accordance with Case 2b, which predicts that !&,bs will be independent of the nature of the oxidant or its concentration and will be equivalent to the first order rate constant for the monomerization of di- thionite. The value for k3 is, therefore, 1.7 s-i at 25”.
The Effect of Temperature on &-From a study of the reaction
of oxygen with dithionite in 0.1 N NaOH at 37” Morello et al. (19) concluded that the monomerization rate constant for di- thionite was 42.5 s-i. Fig. 6 shows, in the form of an Arrhenius plot, the temperature dependence of k&s for the reaction of
dithionite with oxygen in 0.1 N NaOH. That the monomeriza- tion rate was indeed being measured is supported by the ob-
servations that over the temperature range studied, dithionite disappearance followed first order kinetics and kobs was virtually
independent of the oxygen concentration (0.13 mM or 0.65 mM).
L 0” 0
Y
l Cytochrome C A Lumiflavin -3-Acetate 0 Oxygen
1: 0 100 200
[OXIDANT]-‘, mM-’
D
FIG. 5. The rate of reaction of excess oxidant with dithionite. The data are plotted as the reciprocal of the observed first order rate constants versus the reciprocal of oxidant concentration. 0, molecular oxygen as oxidant. The concentration of dithionite after mixing was 4.5 pM. Solutions of buffer were equilibrated at atmospheric pressure with oxygen-nitrogen mixtures containing 10, 20; 50 and 100% oxygen to give oxygen concentrations (after mixing in stopped flow instrument) of 0.65,0.13,0.32, and 0.65 mM. The reaction of dithionite was followed directly at 320 nm, using a 6-nm band width. .A, lumiflavin a-acetate as oxidant. The concentration of dithionite after mixing was 1.7 MM. Lumiflavin a-acetate was varied from 10 PM to lO&p~. The reactions were monitored by following the absorbance of lumiflavin 3-acetate at 446 nm. l . cvt crir as oxidant. Initial concentration of dithio- nite was 0.6 1;. Cyt clI1 concentration was varied from 3.6 pM to 35 ,UM. The reduction of cyt c III was monitored at 418 nm or 550
FIG. 7. The dependence of k&s on the concentration of reactant in excess for the reaction of ferricyanide with dithionite. The data shown were obtained by reacting 8 PM dithionite with fer- ricyanide in concentrations ranging from 31.5 to 500 P&I. The
nm. reactions were followed at 420 nm.
k&s at 25” is still 1.7 s-i, the same monomerization rate obtained at pH 8.0 at that temperature. The monomerization rate at 37.5” is 8.6 s-l. From the slope of Fig. 6, an activation energy of 24.1 Cal per mole is obtained for the monomerization of di- thionite.
Reaction of Fe&cyanide with Dithionite-Fig. 7 shoa-s clearly
I I I I I 0.0030 0.0032 0.0034 0.t
(T. “K)-’
)36
FIG. 6. Dependence of the monomerization rate of dithionite on temperature. Dithionite solutions were prepared under anaero- bic conditions in 0.1 N NaOH. Solutions of 0.1 N NaOH were equilibrated at room temperature and atmospheric pressure with either air or pure oxygen to give dissolved oxygen concentrations after mixing of 0.13 and 0.65 mM, respectively. The reaction between dithionite and oxygen was followed by stopped flow spectrophotometry at 320 nm, using a 6-nm band width. The temperature range is from 10 to 45”, and the initial postmixing concentrations of dithionite are 10 or 50 .uM.
FERRICYANIDE. mM
by guest on May 12, 2018
http://ww
w.jbc.org/
Dow
nloaded from

6101
0 14, I
012- w z” Q OIO- 2 s 0.08 - m Q Q
004-
0 16 32 48 64 SO 96 112 128 144 160 176 TIME. msec
FIG. 8. The effect of oxygen and superoxide dismutase on the reduction of cyt crrr by dithionite. The concentrations were: 4.8 PM cyt $1, 0.36 mM dithionite, 0.13 mM oxygen (Curves A and B), and 1.25 X lo-’ M superoxide dismutase (Curves A and C) . Oxygen and superoxide dismutase, when present, were included in the tonometer containing cyt clI1. Curve C, replotted on the same time scale as A and B to better indicate the relative rates, shows the reduction of cyt clIr in anaerobic buffer, and the presence of superoxide dismutase has no effect. The reduction of cyt err* was followed at 550 nm.
that kobs greatly exceeds 1.7 s-l for the reaction of ferricyanide with dithionite under conditions where ferricyanide is in excess. The reactions follow first order kinetics for at least three half- lives when the ferricyanide concentration is sufficiently high to give pseudo-first order conditions. From the slope of Fig. 7, a rate constant of 1.4 x lo5 M-' se1 is obtained. Therefore, the kinetics under these conditions fits Case la, indicating that SZ04” is an effective reducing species. However, reduction of ferricyanide may also be occurring by the monomer pathway (Case Zb), which would give a contribution of up to 1.7 s-’ to kobs, resulting in a slight overestimation of the true second order rate constant for the reaction between S20d2- and ferricyanide.
Study of the reaction of ferricyanide with excess dithionite was complicated by the relatively low absorbance of ferricyanide and its fast reaction with dithionite. Thus, it was practical to study the reaction of 50 pM ferricyanide with concentrations of dithionite less than 1 mM. The reaction of approximately stoi- chiometric concentrations of dithionite and ferricyanide rather closely followed first order kinetics. When the initial concen- tration of dithionite was increased to a level sufficient to give pseudo-first order conditions, the observed reaction kinetics was between zero and first order. These observations are qualita- tively consistent with SO1 being a rapidly reacting species and Case 2b or 2c kinetics are superimposed on Case lb kinetics.
Reaction of Cytochrome c with Dithionite in Presence of Oxygen- Greenwood and Palmer (20) have shown that the reaction of
‘I1 cyt c with dithionite in the presence of oxygen can give biphasic kinetics in which the reduction of cyt clI1 in the second phase is remarkably rapid. An explanation of the observed kinetics can now be given.
Fig. 8, Curve B, shows the time course of the reaction when 4.8 pM cyt clI1 containing 0.13 MM oxygen is mixed with 0.195 mM dithionite (concentrations are those after mixing). The reaction is biphasic and the onset of the second phase occurs very rapidly. When 1.25 X 10-T M superoxide dismutase is included (Curve A), the rate of reduction of cyt clI1 in the first phase is slower, the second phase begins later, and its extent is greater. Under anaerobic conditions (Fig. 8C), the reduction of cyt crrr occurs much more rapidly, only one phase is seen, and superoxide dismutase is without effect.
These observations can be rationalized in terms of the fol- lowing set! of equations:
k3 s*o42- F 2501
k--a (3)
ka so*- + cyt c1rr - so* + cyt err (13)
so1 + 02 -J% so2 + a- (14) kx 2Hf + 202 -----+ HzOz + 02 (15) km
02- + cyt cm - 02 + cyt err (16) First, it is assumed that the forward rate of Reaction 3 is the
over-all rate-limiting step. In the absence of oxygen (Fig. 8C), all of the SOz made available by that reaction can cause reduc- tion of cyt clI1, as shown in Equation 13. However, in the presence of oxygen, a large proportion of the SOZ produced reacts with O2 according to Equation 14, resulting in an ap- parent inhibition of cyt clI1 reduction (Fig. 8B). The observed rate of cyt clI1 reduction that is observed in Phase 1, Curve B, reflects both the ability of cyt clI1 to compete with oxygen for SOz and the rate of reduction of cyt clI1 by 02- according to Equation 16. The latter process explains the apparent auto- catalysis in Phase 1, Curve B, since the concentration of 02 would be increasing during that time. The onset of the second phase occurs as the oxygen concentration is depleted and the reaction mixture becomes anaerobic. Then the SO1 produced by monomerization will rapidly reduce the remaining cyt clI1 at a rate comparable to that observed in Fig. 8C. Superoxide dis- mutase catalyzes Reaction 15, which over the time span of cyt clI1 reduction undoubtedly proceeds to a great extent even in the absence of the dismutase. The consequences of the catal- ysis can be predicted to be a decrease in the rate of cyt clI1 reduc- tion in the first phase as the “steady state” 02- concentration is decreased and a delay in the onset of the fast phase. The latter effect arises because superoxide dismutase increases the amount of oxygen that accepts 2 electrons (to form H,OJ rather than 1 electron (to form 01) and it thus takes longer to use up the available oxygen.
Additional observations support the proposed mechanism. When the oxygen concentration (0.13 mM) was greater than the dithionite concentration (0.06 mM), only the slow phase was seen, and full reduction of cyt clI1 did not occur, presumably because too much of the 02 dismutes before it reduces cyt cnl. The addition of superoxide dismutase to this system resulted in an even smaller amount of cyt c ‘I1 being reduced because of the elimination of Reaction 16. Increasing the concentration of dithionite above that shown in Fig. 8 increased the rate of both phases and increased the amount of cyt clI1 reduced in the second phase at the expense of that in the first phase.
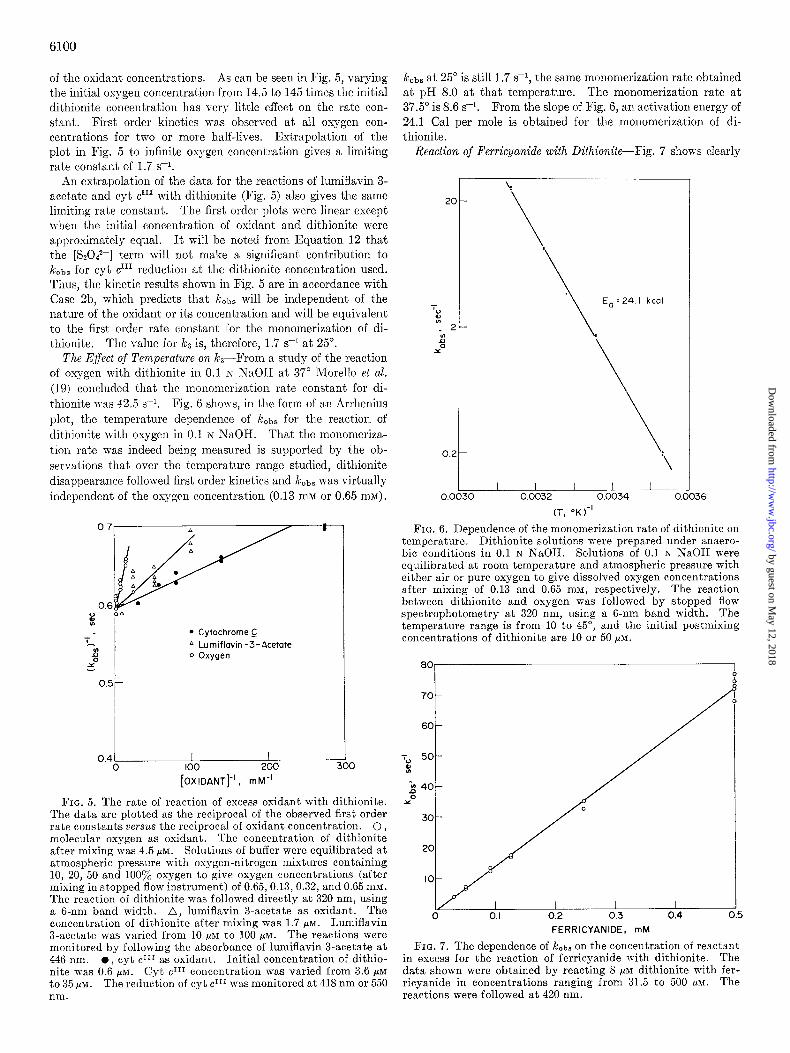
The ratio of the initial rate of cyt clI1 reduction under anaerobic conditions versus the rate in the presence of oxygen plus super- oxide dismutase is plotted in Fig. 9 as a function of dithionite concentration. This ratio increases as the initial dithionite concentration is lowered, probably due to less reduction of cyt clI1 by the dimer pathway (Equation 12) and by diminishing Reaction 16 when oxygen and superoxide dismutase are present. The ratio obtained by extrapolating the data to zero dithionite concentration is 8.7. Assuming that this ratio is a direct reflec- tion of the initial concentrations of cyt clI1 and oxygen and their respective rate constants for reaction with SO1, the following expression is obtained:
k&yt cl”l[SOzl 8’7 = k&yt c”‘][SO~-1 - k~~[O~l~SO~-l (17)
Solution of the equation gives k14 = 1.3 X lo6 Mm1 s-l.
by guest on May 12, 2018
http://ww
w.jbc.org/
Dow
nloaded from
6102
I I I 0 0. I 0.9 0.3 0.4
[S,Oifl, mM
FIG. 9. Plot showing the dependence on dithionite concentra- tion of the ratio of the initial rates of reduction of cyt errI in the absence and presence of 0.13 m&r oxygen + 1.25 X lo-’ M super- oxide dismutase. Conditions of the reactions are as indicated in the legend to Fig. 8. The extrapolated value at zero dithionite is taken as the best value of the relative rates and has been used to calculate the rate constant for the reaction between 02 and dithio- nite as described in the text.
TABLE II
Determination by EPR of the equilibrium constant between monomer and dimer forms of dithionite
Buffer
20 mM sodium pyrophosphate, pH 8.0, containing 0.25 M Nacl.. . . . . .
20 mM sodium pyrophosphate, pH 8.0, containing 0.25 M NaCl .
20 miu sodium pyrophosphate, pH 8.0, containing 0.25 M Nacl. .
50 m&f sodium phosphate, pH 7.25, 0.30 M NaCl . .
0.10 M sodium pyrophosphate, pH 8.3. 50 ml1 sodium borate, pH 9.5, con-
taining 0.35 M NaCl.. . . . . . . . .
0.24 M sodium glycinate, pH 10.4. L-
24 M
0.96 0.98
8.2 3.4 1.4
84 12 1.7
9.2 2.8 0.85 9.7 3.8 1.5
8.3 2.9 1.0 8.4 3.5 1.5
109K
M
1.0
Equilibrium Constant for Dithionite Monomerization-Dimeriza-
tion Reaction-The concentration of radical ions present in di- thionite solutions’ was determined under conditions closely ap- proximating those used in the stopped flow experiments. The results are shown in Table II. A reasonable value for the equi- librium constant (K) of the reaction in pyrophosphate buffer, pH 8.0, is 1.4 =t 0.4 x lo-” M. This value can be used in the expression lcobs = k4 P? [Sz042-]1’Z to determine the true second order rate constant for the reaction between oxidant and SOz. These rate const,ants are included in the tabulation in Table III.
DISCUSSION
From the results, it can be generally concluded that SO, is a more reactive species than Ss042-. For example, even in the case of plastocyanin where SzO42- was the primary reducing agent, the relative second order rate constants for the reactions of SO1 and Sz04+ with plastocyanin is greater than 100 : 1 (Table III). The relatively slow reaction of some substances with dithionite, e.g. ferredoxin and metmyoglobin, is due in part to the low concentration of SOz- in equilibrium with S2O42- (less than 1% of the dimer concentration for most dit.hionite con- centrations used).
In a study of the reduction of bacterial flavodoxin by
TABLE III
Rate constants for reaction of SO*- and 8~04~ with oxidanta
Oxidant
Spinach ferredoxin. . . Horse metmyoglobin, pH
8.0. . . . . . . . . Lumiflavin 3-acetate. . . Horse ferricytochrome c.. Oxygen . . . . . . Ferricyanide. . . . Spinach plastocyanin . . .
Monomer (so%-)
@h g3 M-1 s-1c
8.6 2.3 X lo5
100 2.7 X 10⁶ 960 2.6 X 10’
1450 3.9 x 10⁷ 47 1.3 x 10⁶
1100 2.9 x 10’
1.5 x 10⁴
1.4 x 10⁶ 1.35 x 10⁶
Q Ionic strength = 0.41 throughout. b Listed rate constants are equivalent to the quantity, k4KlIz, in
Equation 10. c Equivalent to the quantity kq, in Equation 10.
dithionite, Mayhew and Massey (4) found that the rates of reduction of both oxidized flavodoxin to the semiquinone form and the semiquinone to fully reduced flavodoxin showed a square root dependence on the dithionit,e concentration. They in- terpreted these results as indicating that reduction from the fully oxidized to the fully reduced forms occurs by successive l-electron transfers from SOZ. Using conditions where dis- proportionation of the semiquinone was not significant, they found that reduction of the semiquinone occurred with a rate constant a few orders of magnitude faster than reduction of the fully oxidized species. Our results for lumiflavin 3-acetate and oxygen suggest that, in general, oxidants which may accept 2 electrons usually react with dithionite through l-electron trans- fers. We were unable to observe a detectable buildup of semi- quinone during the reduction of lumiflavin 3-acetate which may be due to semiquinone rapidly accepting an electron from a second SOS-, or rapidly disproportionating to form oxidized and reduced flavins (21). In a previous study of the reaction of flavin mononucleotide with dithionite, Burn and O’Rrien (22) observed that the rate of flavin reduction becomes inde- pendent of flavin concentration as the ilavin concentration is increased. As an alternative to their interpretations (see Ref. 22), we propose that dithionite monomerization is becoming rate-limiting, and the intermediate that they observed is a charge transfer complex between oxidized and reduced flavin (23) rather than a semiquinone.
The finding that the reaction of oxygen with dithionite is, under certain conditions, independent of oxygen concentration and limited by a rate constant of 1.7 s-l also provides evidence that oxygen reacts with SO%- in a l-electron transfer reaction. Since Hz02 is the end product (3), 02 must rapidly react either through a disproportionation reaction or directly with a second SOz-. A previous finding that the rate law for the oxygen- dithionite reaction was first order in oxygen (24) may have been fortuitous as the dissolution and diffusion of oxygen may have been rate-limiting (see Ref. 19). Morello et al. (19) concluded that the monomerization rate of dithionite at 37” in 0.1 x NaOH was 42.5 s-i, a value somewhat higher than we found. Although they state that the reaction was first order, they make the puz- zling statement that the first order rate constant decreases with time (Ref. 19, Fig. 5). The limiting value of the rate constant approaches the value of 8.5 s-l we found at 37.5”. The results de- scribed in this paper re-emphasize the point that the reaction of dithionite with oxygen is rapid and leads to the formation of 01
by guest on May 12, 2018
http://ww
w.jbc.org/
Dow
nloaded from

and HzOz. The concentration of these species may easily exceed 0.1 rnl\l under normal conditions where solutions are in equi- librium with air and an example of the complication that can result is shown in Fig. 8. A good practice is to use the min- imum amount of dithionite necessary and, where possible, carry out the reactions under anaerobic conditions.
From the room temperature values of kS and the equilibrium constant for the reaction between the dimer and monomer forms, a value of 1.2 X log M-* s-l is calculated for ?Q, the rate con- stant for the dimerization of SOz. This value is about a factor of six lower than the value estimated by Hayon et al. (25) based on flash photolysis experiments. Since we believe that kS is firmly established by our experiments and our value for the equilibrium constant agrees within a factor of 2 with the value of 6 X lo-lo reported previously (15, 26), we would suggest that the reported value for the dimerization rate constant is too high. Possibly Hayon et al. (26) were observing a transient species other than SOZ.
The kinetics of the reaction of dithionite with oxidants is complex, being dependent on both the relative and absolute concentration of reactants. Thus, with cyt cnl and substoi- chiometric concentrations of dithionite, the rate of reduction is limited by the monomerization rate of dithionite resulting in zero order dependence on the cyt clI1 concentration and first order dependence on dithionite concentration. Virtually all of the cyt c ‘I1 is reduced by SOZ-. As the dithionite concentration is increased to give pseudo-first order conditions, the order of the reaction approaches half order in dithionite and first order in cyt cnl. Still higher concentrations do not affect the order with respect to cyt clI1, but the order with respect to dithionite approaches 1. This is interpreted as being due to reactivity with the S2042- species which becomes increasingly important at higher concentrations. Obviously, caution must be exercised in extrapolating the kinetic results to concentrations outside of the range for which they were established.
For over 50 years, dithionite has been routinely used by bio- chemists as a reducing agent, with little regard as to its mech- anism of action. We have now shown that SOZ- is generally a very important reducing species, in spite of its low equilibrium concentrat’ion and regardless of whether the oxidant will accept 1 or 2 electrons. Under certain conditions, the rate of mono- merization of dithionite limits the rate of reduction. Rec- ognition of these factors will permit the biochemist to use this reagent more intelligently as a tool for investigating biological materials.
Ackno&edgments-Dr. David Ballou has been immensely helpful with the technical details of stopped flow spec-
6103
trophotometry. The authors thank Drs. Stephen Mayhew and Vincent Massey for valuable discussions and for sharing the results of their work prior to publication. The expert technical assistance of Mrs. Jennifer Chen is gratefully acknowledged.
1.
2.
3. 4.
5.
6.
7.
8.
9.
10.
11.
12.
13. 14.
15.
16.
17.
18.
19.
20.
21.
22.
23.
24.
25.
26.
REFERENCES
BURLEIGH, B. D., JR., FOUST, G. P., AND WILLLIMS, C. H., JR. (1969) Anal. Biochem. 27, 536-544
FOUST, G. P., BURLEIGH, B. D., JR., MAYHEW, S. G., WILLIAMS, C. H., JR., AND MASSEY, V. (1969) Anal. Biochem. 27, 530- 535
DIXON, M. (1971) Biochim. Biophys. Acta 226, 241-258 MAYHEVI, S. G., AND MASSEY, V. (1973) B&hem. Biophys.
Acta, in press PETERING, D. H., BND PALMER, G. (1970) Arch. Biochem. Bio-
phys. 141, 456-464 PLESNIEAR, M., AND B~ND~LL, D. S. (1970) Biochim. Biophys.
Acta 216, 192-199 MCCORD, J. M., AND FRIDOVICH, I. (1969) J. Biol. Chem. 244,
6049-6055 MARGOLIASH, E., AND WALASEK, 0. F. (1967) Methods Enzymol.
10,339-348 PETERING, D. H. (1969) Ph.D. dissertation, University of
Michigan, Ann Arbor SCHELER, W., SCHOFFA, G., AND JUNG, F. (1957) Biochem. 2.
329, 232-246 SCHELLENBERG, K. A., AND HELLBRMAN, L. (1958) J. Biol.
Chem. 231, 547-556 BALLOU, D. P. (1971) Ph.D. dissertation, University of Michi-
gan, Ann Arbor PALMER, G. (1967) Methods Enzymol. 10, 594-609 RINKER, R. G., GORDON, T. P., MASON, D. M., AND CORCORaN,
W. H. (1959) J. Phys. Chem. 63, 302 BURLAMACCHI, L., CASINI, G., FAGIOLI, O., AND TIEZZI, E.
(1967) Ric. Sci. 37, 97-99 FROST, A. A., AND PEARSON, R. G. (1961) Kinetics and Mecha-
nism, 2nd Ed, pp. 178-184, John Wiley & Sons, New York CARTER, C. W., JR., KRAUT, J., FREER, S. T., ALDEN, R. A.,
SIEKER, L. C., ADMAN, E., AND JENS*>N, L. H. (1972) Proc. Nat. Acad. Sci. U. S. A. 69, 3526-3529
DUNHAM, W. R., PALMER, G., SANDS, IL H., AND BEARDEN, A. J. (1971) Biochim. Biophys. Acta 253, 373384
MORELLO, J. A., CR.iW, M. R., CONSTANTINE, H. P., .~ND FORSTER, R. E. (1964) J. Appl. Physiol. 19, 522-525
GREZN~OOD, C., AND PALMER, G. (1965) J. Viol. Chem. 240, 3660-3663
BIRMAN, B. G., AND TOLLIN, G. (1972) Biochemistry 11, 4760- 4765
BURN, G. P., ~WD O’BRIEN, J. R. P. (1959) Biochim. Biophys. Acta 31, 328-335
GIBSON, Q. H., MASSXY, V., .ZND ATHERTON, N. M. (1962) Biochem. J. 86, 369-383
RINI~ER, R,. G., GORDON, T. P., MASON, D. M., SAKAIDA, R. R., AND CORCOR~N, W. H. (1960) J. Phys. Chem. 64,573-581
HAYON, E., TREININ, A., AND WILF, J. (1972) J. Am. Chem. sot. 94, 47-57
LYNN, S., RINKER, R. G., AND CORCOR~N, W. H. (1964) J. Phys. Chem. 68, 2363
by guest on May 12, 2018
http://ww
w.jbc.org/
Dow
nloaded from

David O. Lambeth and Graham PalmerOther Compounds of Biological Interest by Dithionite
The Kinetics and Mechanism of Reduction of Electron Transfer Proteins and
1973, 248:6095-6103.J. Biol. Chem.
http://www.jbc.org/content/248/17/6095Access the most updated version of this article at
Alerts:
When a correction for this article is posted•
When this article is cited•
to choose from all of JBC's e-mail alertsClick here
http://www.jbc.org/content/248/17/6095.full.html#ref-list-1
This article cites 0 references, 0 of which can be accessed free at
by guest on May 12, 2018
http://ww
w.jbc.org/
Dow
nloaded from