
The Key to Improving Quality and Patient...
74
© Copyright, The Joint Commission Joint Commission Accreditation How to Improve the Customer Experience: The Key to Improving Quality and Patient Safety Julia S. Finken, BSN, MBA, CPHQ, CSSBB Associate Director The Joint Commission
Transcript of The Key to Improving Quality and Patient...

© Copyright, The Joint Commission
Joint Commission Accreditation
How to Improve the Customer Experience:
The Key to Improving Quality and Patient Safety
Julia S. Finken, BSN, MBA, CPHQ, CSSBB
Associate Director
The Joint Commission

Join audio:• Choose “Mic & Speakers” to use
VoIP• Choose “Telephone” and dial using
the information provided
Questions/Comments:• Submit questions and comments via
the Questions panel.
Note: Today’s presentation is beingrecorded and will be posted on theJoint Commission website.
Your Participation
GoToWebinar Housekeeping
2

© Copyright, The Joint Commission
Joint Commission Accreditation
How to Improve the Customer Experience:
The Key to Improving Quality and Patient Safety
Julia S. Finken, BSN, MBA, CPHQ, CSSBB
Associate Director
The Joint Commission

Objectives
• Identify 3 Key Components of an Exceptional Customer Experience
• Describe the Link Between a Superior Customer Experience and Quality and Patient Safety
• Name 3 Key Tools Utilized to Improve the Customer Experience
4
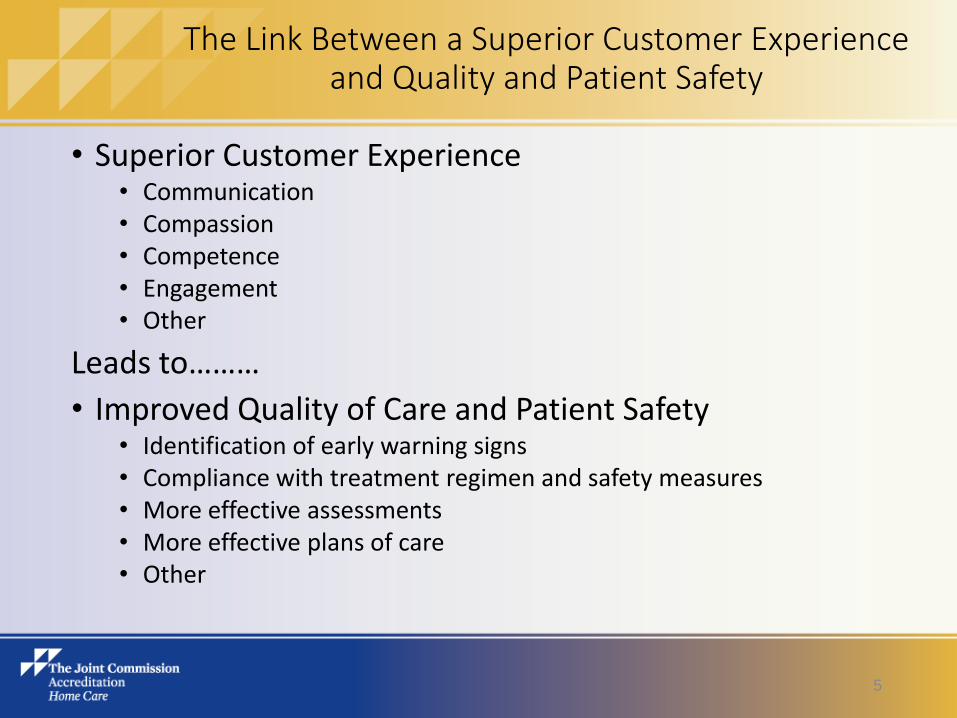
The Link Between a Superior Customer Experience and Quality and Patient Safety
• Superior Customer Experience• Communication• Compassion• Competence• Engagement• Other
Leads to………
• Improved Quality of Care and Patient Safety• Identification of early warning signs• Compliance with treatment regimen and safety measures• More effective assessments• More effective plans of care• Other
5

Why Patient Perception of Care Matters
• Improved Clinical Outcomes
• Improved Patient Safety
• Improved Financial Performance
• Improved Staff Recruitment and Retention
• Improved performance on publicly reported measures
• HHCAHPS
• other
6

Key Drivers to Improve the Customer Experience
• Focus on High Reliability
• Zero Defect, Culture of Trust
• Balancing Care with maintaining Dignity and Self-Determination
• Engage Patients in Care Decisions
• Listen to and Act on the Voice of the Customer
• Compassionate Care
• Efficient and Effective Systems Implemented with a Smile
• Eliminate Waste and Focus on Value Added Services
7

Role of Culture and Strategy in Improving the Customer Experience
• Culture Eats Strategy for Lunch but both are Critical
8

Create a Culture of Safety and Quality
• Leaders create this culture by fostering:• Team work
• Open Communication
• Ongoing Learning
• A Focus on Systems and Processes
• All team members focus on maintaining excellence in performance to deliver safe, high quality care, supported by key performance excellence systems.
9

Transforming the Patient Experience
• Service Assessment
• Leadership Commitment
• Service Protocols
• Constant Focus on Service Protocols
• Performance Accountability
• Recognize/Reward
10
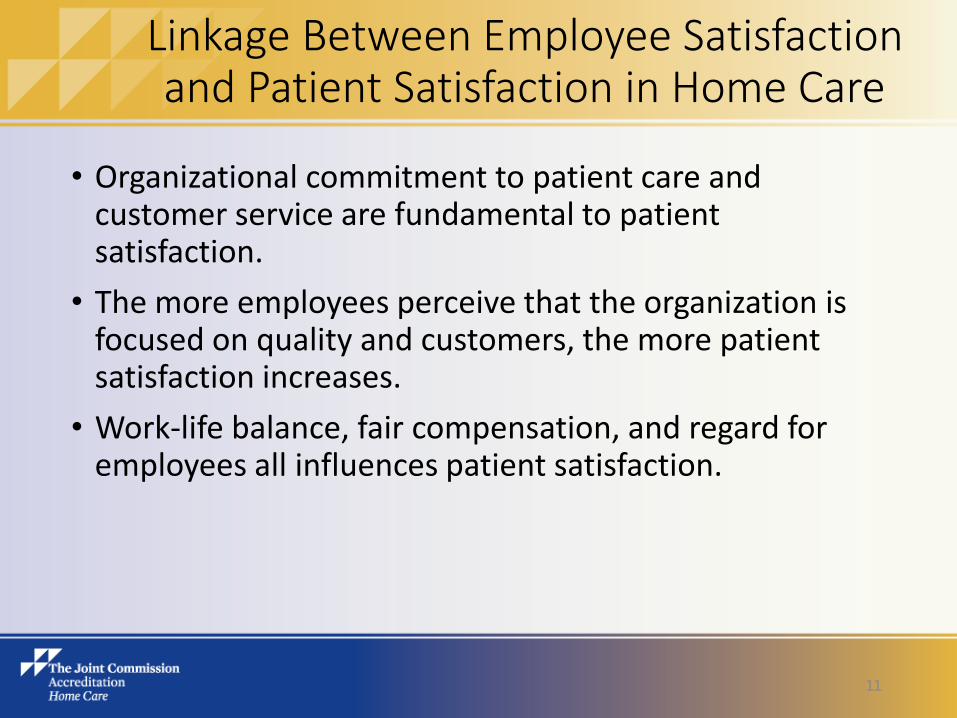
Linkage Between Employee Satisfaction and Patient Satisfaction in Home Care
• Organizational commitment to patient care and customer service are fundamental to patient satisfaction.
• The more employees perceive that the organization is focused on quality and customers, the more patient satisfaction increases.
• Work-life balance, fair compensation, and regard for employees all influences patient satisfaction.
11
Patient Satisfaction and the Health Care Journey
• What reduced satisfaction was something few companies manage—cumulative experiences across multiple touchpoints and in multiple channels over time.
• More Touchpoints – More Complexity
12

Patient Loyalty
• Loyal Patients• High Confidence in Provider
• High Worked Together
• High Concerns for Worries
• Non-Loyal Patients• Low Confidence in Provider
• Low Worked Together
• Low Courtesy
• Low Listens Carefully
13

Effective Strategies to Engage Leaders in the Patient Experience
• Create a Framework for Success
• Senior leadership, including leaders at the C-suite level, must create a foundation on which the patient experience at their organizations can flourish.
• Leaders must:
• Create focus and define the strategy.
• Get crystal clear on the current reality.
• Raise service awareness
• Promote consistent service delivery.
• Engage in service recovery
• Define the senior leader’s role.
• Define the director and manager roles.
14
Effective Strategies to Engage Staff and Change Behavior
• Planning
• Communication• Expectations
• Accountability
• Using Data
• Changing Performance• The Power of Transparency
• Staffing
15

The Chicken or the Egg?
• Improved Employee Satisfaction Drives Improved Patient Satisfaction in Home Care and/or….
• Improved Patient Satisfaction Drives Improved Employee Satisfaction in Home Care
16

Effective Strategies for Patient Engagement
• Ask patients/families for input
• Act on input
• Ask patients/families for feedback
• Communicate, Communicate, Communicate• Open Notes Initiative
• Establish and maintain a relationship with demonstrated respect, empathy, trust, skill……
• Determine shared/complementary Goals
17
Patient Advisory Council
• Integrated into Advisory Board or separate• Be sure it is interactive and information and advice is
obtained from Patients
• Make sure to obtain feedback on patient’s expectations
• Include Patient Advocates and Care Managers as representatives of patients
• Be sure to provide council with actions taken based on their input
18

Caregivers Perception of Care and Engagement Matters
• Caregiver may be the Primary Consumer of your Services
• Engage the Caregiver as you would Engage the Patient
• Caregiver Needs May Be in Excess to Patient Needs
19
Improvement in Clinical Care Leads to Improve Patient Perception of Care
• Pain Management
• Improvement in Functional Status*
• Social Interaction• Pet Therapy
• Respectful Treatment
• Ask “What can I do to improve your care?”
20

Effective Pain Management and the Improvements in Patient Outcomes and Satisfaction
• Overall increase in HCAHPS Patient Satisfaction Score with improvement in pain management
• VBP-Patients more likely to be dissatisfied if lack of validation or negative clinician attitudes regarding patient pain experience
• Effective Strategies• Effective analgesics• Interdisciplinary Practice• Evidence Based Approach
21

Always Events
• Always Events are aspects of the patient experience that are so important to patients and families that healthcare providers must perform them consistently for every patient, every time.
• Important
• Evidenced Based
• Measurable
• Affordable and Sustainable
22
The Little Things Matter
• Informing Patients/Families of the Schedule
• Continuity of Staff
• Asking for Input/Feedback
• Arriving on Time
• Respecting Patient’s Environment
• Explaining Care
• Asking for Permission
• Saying Thank You
23
The Imperative of Healthcare Communication: A Relationship Model
• The Impact of Communication on the Patient Perception of Care and Quality Outcomes
• Relationship Centered Communication• Relationship Establishment
• Relationship Development
• Relationship Engagement
24

Impact of Technology on the Patient’s Perception of Care
• Affords more frequent interaction at a lower cost
• Can be seen by patient as “cold” contact-take mitigating actions
• Enhances provider communication, coordination of care, and transitions of care
25

Finding the Heart of Healthcare
• Compassionate Care
• Patient Perception of Caring Behaviors
• Professional Knowledge and Skill
• Responding when needed and without being prompted
• Doing extra little things
• Following Through
• Taking Care of Patient Needs
• Nurse Perception of Caring Behaviors
• Teaching
• Listening
• Supporting
26

Compassion Improves Quality of Care and Bottom Line
• Compassion and Competence-the customer desires and deserves both
27

Case Study: Cleveland Clinic
• Identifying the Opportunity
• Leading the Change
• Publicly Acknowledging the Problem
• Understanding Patient Needs
• Making Everyone a Caregiver
• Embedding Changes
• Setting Patients Expectations
28
Performance Improvement Tool Box to Improve the Customer Experience
29
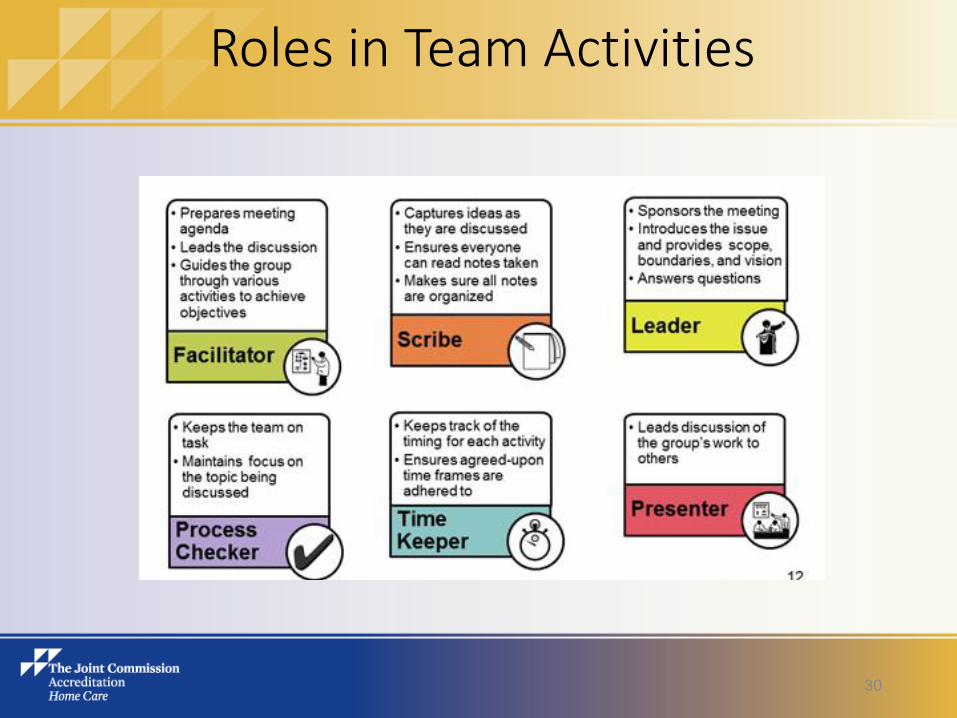
Roles in Team Activities
30
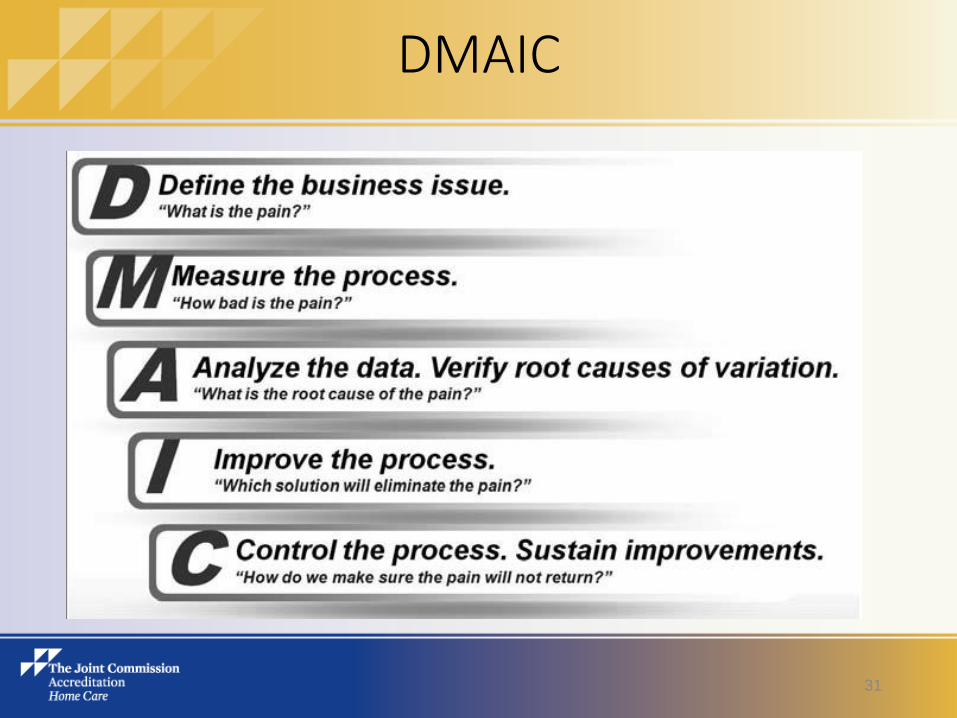
DMAIC
31

Define
• Define the problem and identify opportunities for Improvement
• Goals
• Scope
• Business Case
• Specify what customers value
32

Key Questions and Key RPI Tools
Key Questions RPI Tools
Cri
tica
l P
ath
What is the problem? 15 Words; Charter
Why is it important?
Who is the customer?
Threats and Opportunities; 3D; Charter
What is the project scope? Includes/Excludes; Charter
What does the customer want?
What is critical to quality?
Voice of Customer; Critical to Quality; Quality Function Deployment; Survey Design; Kano Model
What is the goal? SMART; More Of/Less Of; Charter
What are you going to improve?
By how much are you going to improve it?
By when are you going to improve it?
SMART; Charter
Who are your key stakeholders?
Who will be on the project team
ARMI; Charter
What is the project time line? WWW; Charter
What does the current state look like? SIPOC Process Map
33

Tips to Avoid Potential Pitfalls
• Narrow problem/opportunity definition
• Clear project scope (includes/excludes)
• Broad definition of customers/stakeholders
• Inclusive project team (<=10)
• Champion/Detractor
• Measurable Goal
• Defined Team Member Roles
34
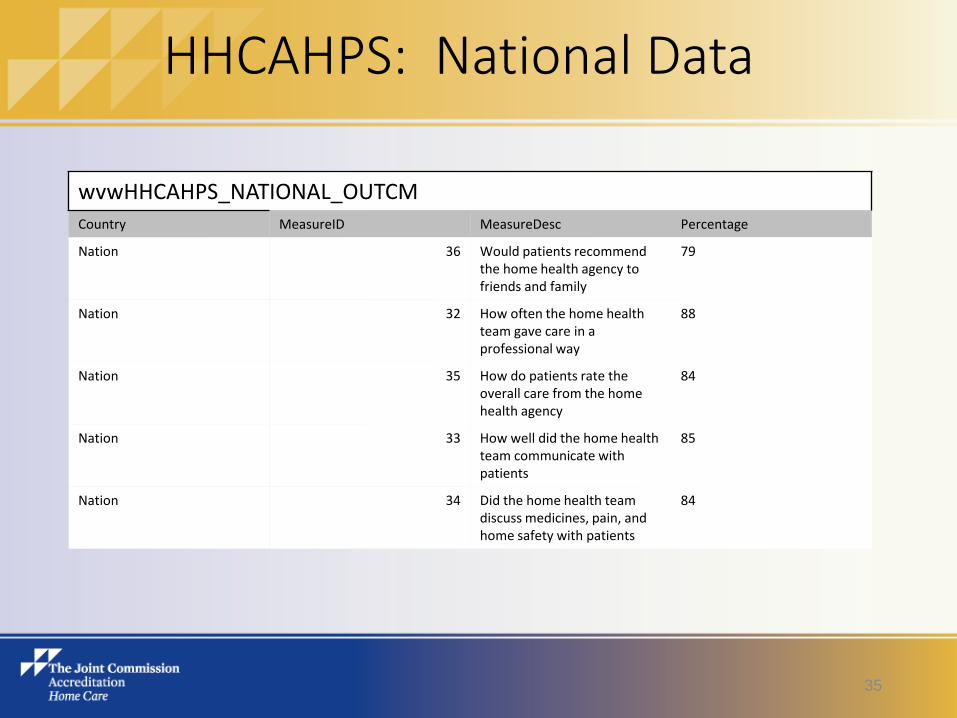
HHCAHPS: National Data
wvwHHCAHPS_NATIONAL_OUTCMCountry MeasureID MeasureDesc Percentage
Nation 36 Would patients recommend the home health agency to friends and family
79
Nation 32 How often the home health team gave care in a professional way
88
Nation 35 How do patients rate the overall care from the home health agency
84
Nation 33 How well did the home health team communicate with patients
85
Nation 34 Did the home health team discuss medicines, pain, and home safety with patients
84
35

HHCAHPS: State Data
• State DatawwwHHCAHPS_STATE_OUTCM
State MeasureID MeasureDesc Percentage
MD 33 How well did the home health team communicate with patients
85
MD 32 How often the home health team gave care in a professional way
87
MD 36 Would patients recommend the home health agency to friends and family
76
MD 35 How do patients rate the overall care from the home health agency
82
MD 34 Did the home health team discuss medicines, pain, and home safety with patients
82
36

HHCAHPS: Agency Data
vwHHCAHPS_MSR_PRVDR_XWLK
ProviderName MeasureID MeasureDesc Percentage
XYZ 33 How well did the home health team communicate with patients
77
XYZ 32 How often the home health team gave care in a professional way
79
XYZ 36 Would patients recommend the home health agency to friends and family
72
XYZ 35 How do patients rate the overall care from the home health agency
82
XYZ 34 Did the home health team discuss medicines, pain, and home safety with patients
82
37

Example Charter
XYZ Home Care
Performance Improvement Project Charter
Improvement in HHCAHPS Score: Communication Between Providers and Patients
I. Project Mission: To improve the agency HHCAHPS score for “How well did the home health team
communicate with patients?”
II. Reason for Action: There is an opportunity to improve the agency HHCAHPS score for “How well did the
home health team communicate with patients?” The agency’s score is below both the National and State scores.
III. Sponsors:
a. Susie Smith, Administrator
b. Tom Marcus, Medical Director
IV. Team Leader:
a. Tim Turner, RPT
V. Team Facilitator:
a. Barbara Tennyson
VI. Scribe:
a. Marc Jacobs, MSW
VII. Timekeeper/Process Checker
a. Julie Abbott
VIII. Team Members:
a. John Jones, MD
b. Carol Thomason, DOPCS
c. Wendy Cluggr, RN
d. Tim Turner, RPT
e. Maggie Franklin, CHHA
f. Paul Pierce, ST
g. Julie Abbott, Scheduler
h. Tina Boyle, OT
i. Marc Jacobs, MSW
j. Laura Evans, Supervisor
k. Jesse Mohr, Team Assistant
l. Robert Cordara, LVN
IX. Meeting Frequency, Interval and Duration:
a. Meet Q.O.W x 10 meetings
b. Meeting length of 90 minutes
X. Meeting Location:
a. Meeting Location is XYZ Home Care, Conference Room 100
XI. Project Deliverables:
a. The agency HHCAHPS score for “How well did the home health team communicate with patients?” will
increase from 77 to 81 by March 31, 2016.
XII. Measures:
a. Agency HHCAHPS score for “How well did the home health team communicate with patients?” = 81
XIII. Reporting:
a. The Team Leader will report to the Administrator and Medical Director at least monthly and as needed or
requested.
38

Charter Mission and Reason for Action
• Project Mission: To improve the agency HHCAHPS score for “How well did the home health team communicate with patients?”
• Reason for Action: There is an opportunity to improve the agency HHCAHPS score for “How well did the home health team communicate with patients?” The agency’s score is below both the National and State scores.
39

Team
• Sponsors:
• Susie Smith, Administrator
• Tom Marcus, Medical Director
• Team Leader:
• Tim Turner, RPT
• Team Facilitator:
• Barbara Tennyson
• Scribe:
• Marc Jacobs, RN
• Timekeeper/Process Checker
• Julie Abbott
• Team Members:
• John Jones, MD
• Carol Thomason, DOPCS
• Wendy Clugger, RN
• Tim Turner, RPT
• Maggie Franklin, CHHA
• Paul Pierce, ST
• Julie Abbott, Scheduler
• Tina Boyle, OT
• Marc Jacobs, MSW
• Laura Evans, Supervisor
• Jesse Mohr, Team Assistant
• Robert Cordara, LVN
40
Logistics
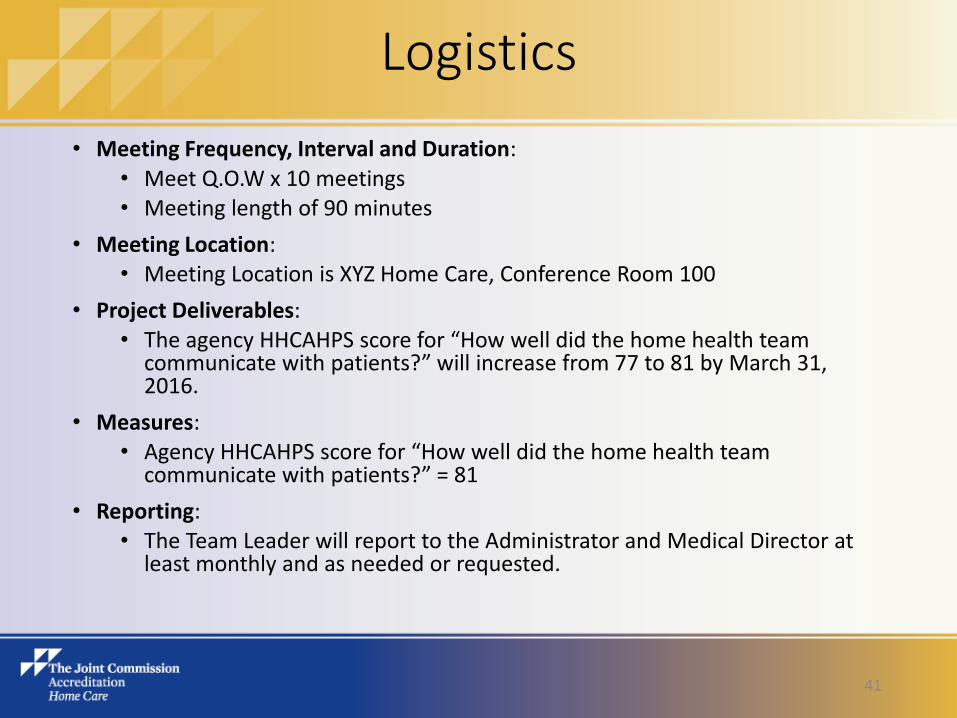
• Meeting Frequency, Interval and Duration:• Meet Q.O.W x 10 meetings• Meeting length of 90 minutes
• Meeting Location:• Meeting Location is XYZ Home Care, Conference Room 100
• Project Deliverables:• The agency HHCAHPS score for “How well did the home health team
communicate with patients?” will increase from 77 to 81 by March 31, 2016.
• Measures:• Agency HHCAHPS score for “How well did the home health team
communicate with patients?” = 81
• Reporting:• The Team Leader will report to the Administrator and Medical Director at
least monthly and as needed or requested.
41
Example ARMI
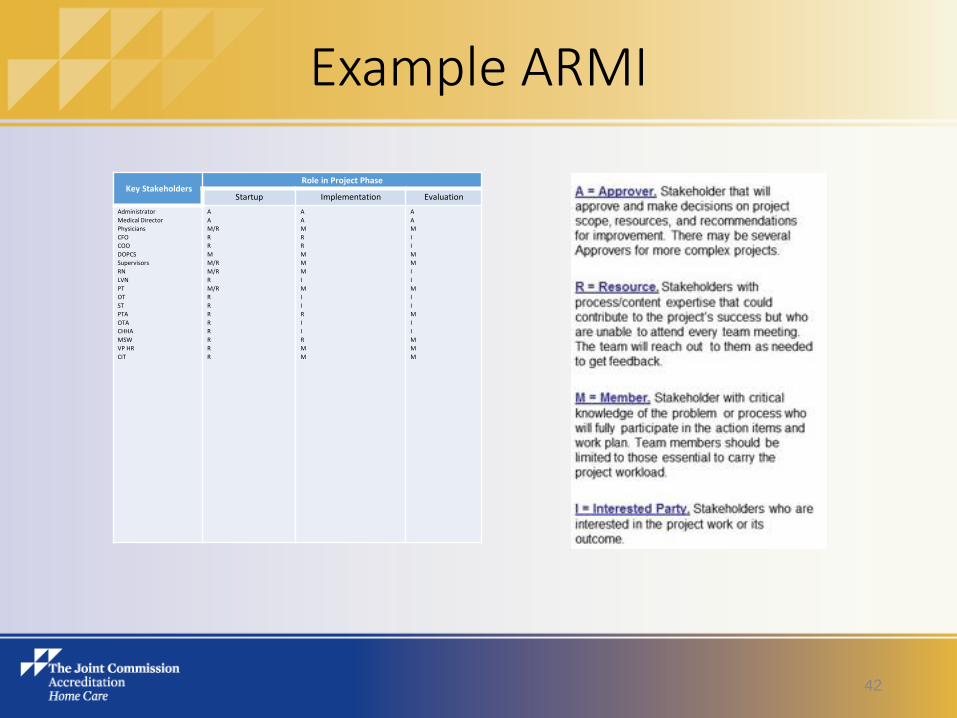
Key StakeholdersRole in Project Phase
Startup Implementation Evaluation
Administrator
Medical Director
Physicians
CFO
COO
DOPCS
Supervisors
RN
LVN
PT
OT
ST
PTA
OTA
CHHA
MSW
VP HR
CIT
A
A
M/R
R
R
M
M/R
M/R
R
M/R
R
R
R
R
R
R
R
R
A
A
M
R
R
M
M
M
I
M
I
I
R
I
I
R
M
M
A
A
M
I
I
M
M
I
I
M
I
I
M
I
I
M
M
M
42

Measure
• Determine current performance level (baseline) and the capability of the process to meet customer expectations.
• Identify all steps and inputs in the value stream
• Identify potential causes and drivers
• Gather and qualify the data
43

Key Questions and Key RPI Tools Key Questions RPI Tools
Qua
lity
What inputs have the biggest effect on the things that are critical to quality for the customer?
Cause and Effect Matrix
What could go wrong with these key inputs?
What are the probable causes for this?
Process Failure Mode and Effects Analysis
What are you going to measure?
How are you going to measure it?
How accurate and reliable is the data?
Data Collection Plan; Measurement System Analysis
Key Questions Tools
Criti
cal P
ath
What is your baseline performance?
Statistical Process Control Chart; Process Capability
How are you going to communicate your progress to key stakeholders?
Dashboard; Communication Plan; Stakeholder Analysis
Where should you focus change management efforts?
Change Management Profile; Stakeholder Analysis
Key Questions Tools
Prod
uctiv
ity
What is the complete flow of your process?
What areas should be focused on?
Value Stream Map; Spaghetti Diagram; Gamba Walk
What could go wrong within your focus areas?
What are the probable causes for this?
Process Failure Mode and Effects Analysis
Can your process meet customer demand? Takt Time
What are you going to measure?
How are you going to measure it?
How accurate and reliable is the data?
Data Collection Plan; Measurement System Analysis
44

Tips to Avoid Potential Pitfalls
• Gather comprehensive information regarding the process (Team, Sensing Sessions, VOC, other)
• What steps have value and where are the bottlenecks
• Establish baseline performance
• Data definition includes what, how, when
• Best Data not Perfect Data
• Communicate
45

HHCAHPS Baseline Comparative Data
Would patientsrecommend the
home healthagency to friends
and family
How often thehome health
team gave care ina professional
way
How do patientsrate the overallcare from thehome health
agency
How well did thehome health
teamcommunicatewith patients
Did the homehealth team
discussmedicines, pain,and home safety
with patients
36 32 35 33 34
HHCAPS : Baseline Data Agency Percentage 72 79 82 77 82
HHCAPS : Baseline Data State Percentage 76 87 82 85 82
HHCAPS : Baseline Data National Percentage 79 88 84 85 84
50
55
60
65
70
75
80
85
90
95
100
Pe
rce
nta
ge
Score
HHCAHPS Baseline Data
46

HHCAHPS Composite Data Drill Down
• Care of Patients-• Q19: How often did home health providers from this agency treat
you with courtesy and respect? 70
• Communications Between Providers and Patients –• Q15: How often did the home health providers from this agency
keep you informed about when they would arrive at your home? 69
• Q17 How often did home health providers from this agency explain things in a way that was easy to understand? 71
• Q18: How often did home health providers from this agency listen carefully to you? 68
47

Brainstorm: Behaviors That Demonstrate Active Listening
• Smile
• Eye Contact
• Posture (lean in or tilt)
• Mirroring
• Attentive
• Positive Reinforcement
• Remembering
• Questioning
• Reflection
• Summarization
48

Voice of the Customer
• Obtain feedback from the Customer regarding what Behaviors have the most impact in conveying that staff are listening carefully to the customer
• Survey
49

Example Data Collection Plan
Performance
Measures
Operational
Definition
Data Source
and Location
Sample Size Who Will
Collect the
Data
Where will
Data be
Collected
How will Data Be
Collected
Other Data that
Should be Collected
at the Same Time
Listen Carefully =
90
How often did
home health
providers
listen
carefully to
you?
Survey
Instrument
“Behaviors
that
Demonstrate
Careful
(Active)
Listening
N=50
Surveys:
Purposive
Sampling,
between
dates of
9/1/15
through
9/30/15
PI Team
Members
Home Visits IPAD Survey at
completion of
the Home Visit
Discipline
Employee Name
Years with agency
Employee Age
50

Analyze
• Use the data to investigate cause and effect relationships, drill down potential root causes, and validate the root causes that have the greatest impact on current performance level
• Identify root causes of waste, variation, and defects
• Distill the data• Focus on and verify root causes and drivers
• Quantify impacts (technical and business)
51

Key Questions and Key RPI Tools
Key Questions RPI Tools
Qu
alit
y
What does the data show o Statistical Significance? o Practical Significance?
Graphical Tools (e.g. Pareto Chart, Histogram); Statistical Tools (e.g. 2-sample t-test, Regression)
Key Questions Tools
Cri
tica
l Pat
h
What are the validated root causes? Hypothesis Test
How are you going to communicate your findings to key stakeholders?
Dashboard; Communication Plan; Stakeholder Analysis
Key Questions Tools
Pro
du
ctiv
ity
What does the data show? o Statistical significance? o Practical Significance?
Graphical Tools (e.g. Pareto Chart, Histogram); Statistical Tools (e.g. 2-sample t-test, Regression)
52

Tips to Avoid Potential Pitfalls
• Statistical Significance vs. Practical Data – Avoid Paralysis
• Verify Root Causes
• Communicate Findings
53

Example Pareto
Eye Contact Attentive QuestioningSummarizatio
nSmile Posture
PositiveReinforcement
Remembering Mirroring Reflection
Frequency 34 33 31 29 19 17 13 12 9 8
Cumulative % 17% 33% 48% 62% 71% 80% 86% 92% 96% 100%
0%
10%
20%
30%
40%
50%
60%
70%
80%
90%
100%
0
5
10
15
20
25
30
35
40Pareto Chart
Frequency Cumulative %
54
Example Communication Plan
55

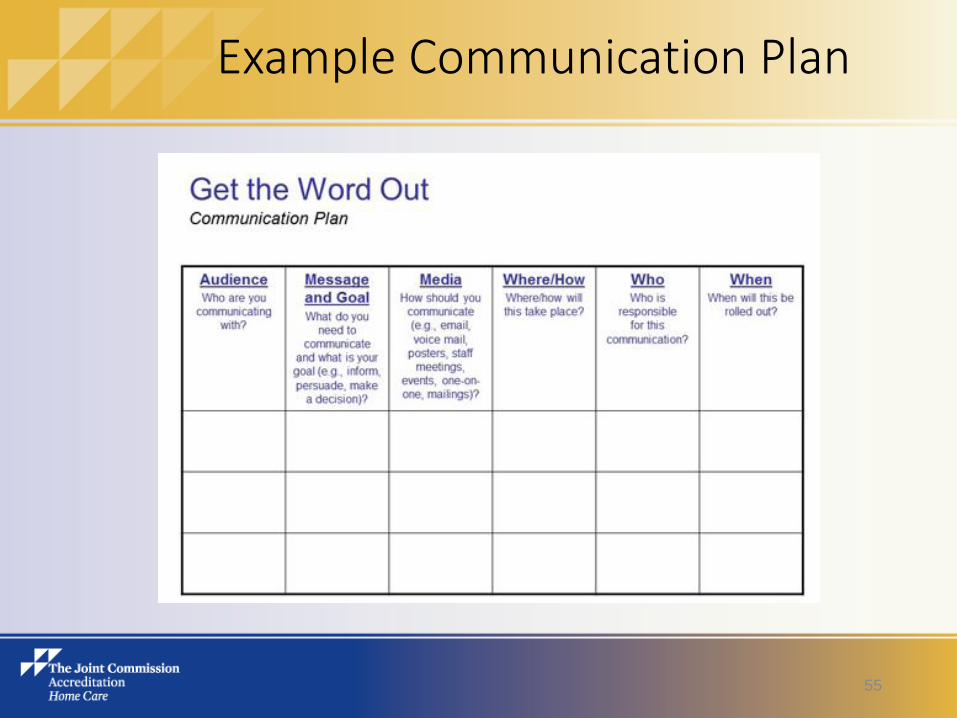
Example Communication PlanAudience Message/Goal Media Where/How Who When
Leadership Overview of Project Meeting
Monthly Leadership
Forum
Administrator/Medica
l Director
10/1/15
PI/Compliance Staff Overview of Project
Expectations
Meeting
Monthly Meeting Marc Jacobs RN, 10/17/15
Supervisors Overview of Project
Expectations
Actions
Meeting
Weekly Supervisor
Meeting
Laura Evans,
Supervisor
10/15/15
Provider Staff Overview of Project
Expectations
Actions
Meeting
Newsletter
Screensaver
Letter
Special Meeting Tim Turner, RPT Multiple Meetings:
10/20/15
10/22/15
10/24/15
10/28/15
Administrative
Support Staff
Overview of Project Meeting
Newsletter
Monthly Meeting Julie Abbott,
Scheduler
11/21/15
Clinical Support Staff Overview of Project Meeting
Newsletter
Monthly Staff
Meeting
Jesse Mohr, Team
Assistant
11/19/15
Board Overview of Project Email
Letter
Newsletter
Quarterly Board
Meeting
Administrator/Medica
l Director
10/1/15
Customers Overview of Project Email Carol Thomason,
DOPCS
11/30/15
Physicians Overview of Project Email
Letter
Medical Director 11/30/15
56

Communication Plan
• Overview of Project:
• Opportunity
• Measures
• Goals
• Findings
• Strategies
• Expectations:
• Attend Mandatory Education on Communication Skills
• Exhibit at least 6 Top Active Listening Behaviors during every visit
• 90%+ score on Written Competency
• 90% + score on observation
• 90% + individual staff score on Q18 in HHCAHPS Source Data q month
• Actions
• Provide Mandatory Education on Communication Skills
• Provide Video and Feedback for Simulated Home Visits
• Administer Written Competency Exam
• Administer Observed Competency
• Collect, Aggregate and Analyze Q18 HHCAHPS Source Data q week
• Post Q18 HHCAHPS Source Data weekly publicly
• Provide remedial Mandatory Education, Simulation, Observation and Testing
• Recognize and Reward Staff who meet and exceed goals
• Implement Coaching and Counseling as necessary
• Incorporate Expectations into job descriptions and performance appraisal
57

Improve
• Develop (design) and understand improvement options
• Select the best solution targeted to address validated root cause(s)
• Pilot the solution, document results
• Stabilize the process and eliminate or reduce waste, variation, and defects.
58
Key Questions and Key RPI Tools
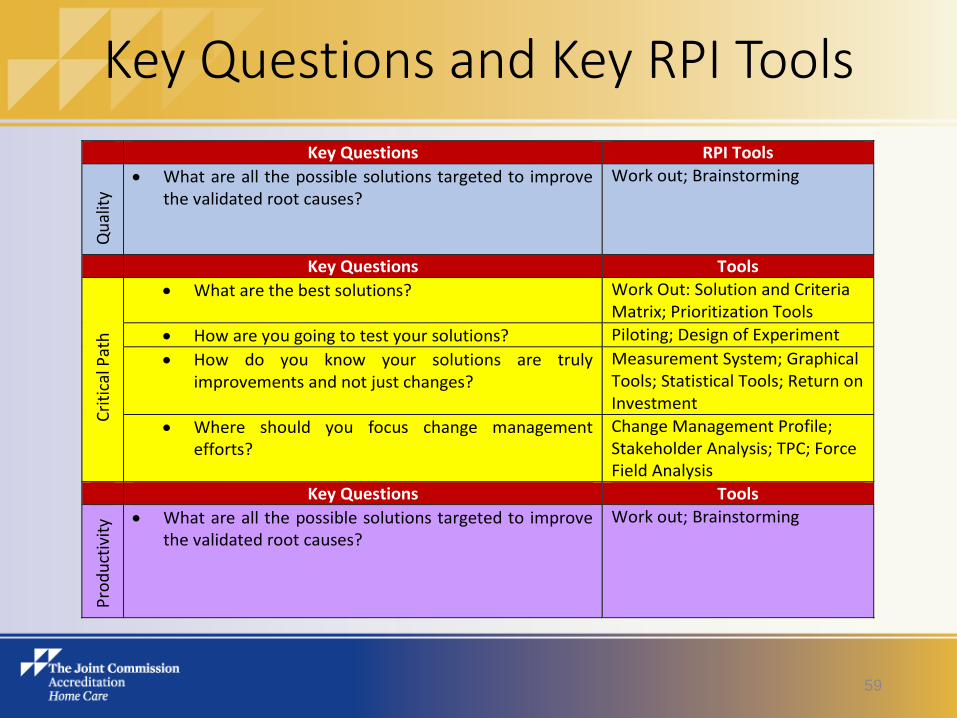
Key Questions RPI Tools
Qu
alit
y
What are all the possible solutions targeted to improve the validated root causes?
Work out; Brainstorming
Key Questions Tools
Cri
tica
l Pat
h
What are the best solutions? Work Out: Solution and Criteria Matrix; Prioritization Tools
How are you going to test your solutions? Piloting; Design of Experiment
How do you know your solutions are truly improvements and not just changes?
Measurement System; Graphical Tools; Statistical Tools; Return on Investment
Where should you focus change management efforts?
Change Management Profile; Stakeholder Analysis; TPC; Force Field Analysis
Key Questions Tools
Pro
du
ctiv
ity What are all the possible solutions targeted to improve
the validated root causes?
Work out; Brainstorming
59

Tips to Avoid Potential Pitfalls
• Anticipate Barriers and develop plan
• Utilize Peers to Communicate
• Ensure Champion and Detractor are involved in solution and communication
• Measure improvement
• Iterative process until goals achieved
• Sustain improvement before broadening
60

Example Work Out
What Who When
Communication Plan Carol DOPCS/Tim RPT 9/1/15
Provide Mandatory Education on Communication Skills Carol/Education Coordinator 12/1/15 – 12/8/15
Provide Video and Feedback for Simulated Home Visits Laura Supervisor/Marc MSW 12/8/15 – 12/15/15
Administer Written Competency Exam Education Coordinator 12/15/15 – 12/18/15
Administer Observed Competency Education Coordinator/PI Team members RN, MSW, PT, OT, ST 12/15/15 – 12/18/15
Collect, Aggregate and Analyze Q18 HHCAHPS Source Data q week PI/Compliance Staff 1/8/16, 1/15/16, 1/23/15, 1/30/15
2/8/16, 2/15/16, 2/23/15, 2/30/15
3/8/16, 3/15/16, 3/23/15, 3/30/15
Post Q18 HHCAHPS Source Data weekly data publicly PI/Compliance Staff Weekly within 2 days of data completion
Provide remedial Mandatory Education, Simulation, Observation
and Testing
Carol/Education Coordinator Weekly 1/8/16 – 3/31/16
Recognize and Reward Staff who meet and exceed goals Administrator/Medical Director Weekly (at end of each week) 1/8/16 – 3/31/16
Implement Coaching and Counseling as necessary Supervisors Weekly 1/8/16 – 3/31/16
Incorporate Expectations into job descriptions and performance
appraisal
HR Specialist/Carol 1/1/16
Work Out Plan
61

Control
• Develop control plans and standardized procedures to ensure that improvements are monitored and sustained.
• Scale improvements
• Document and spread the learning
62
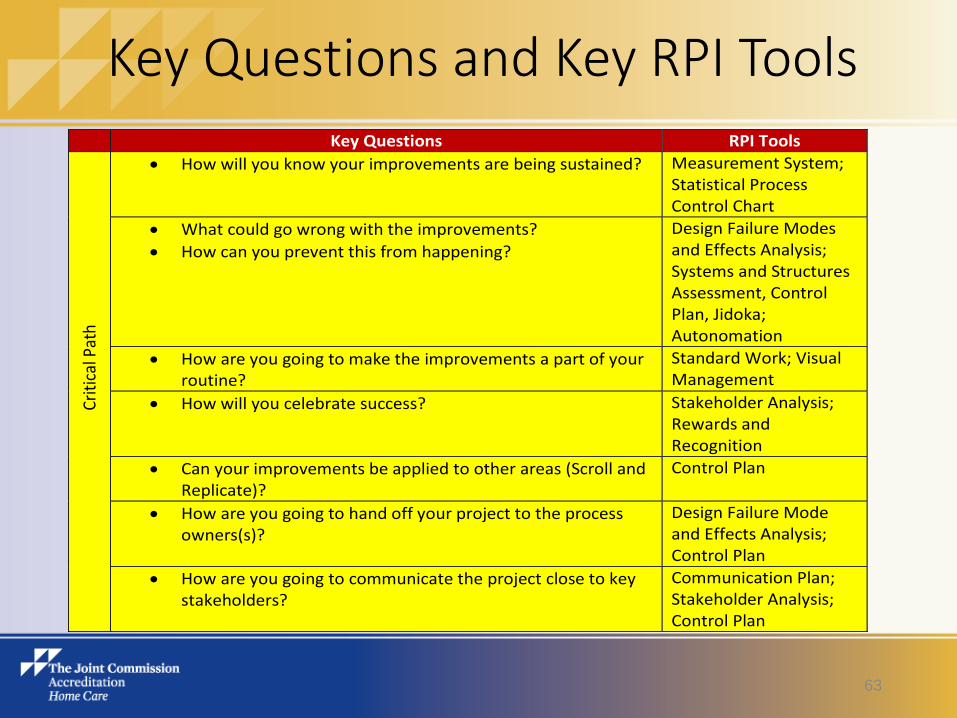
Key Questions and Key RPI Tools Key Questions RPI Tools
Crit
ical
Pat
h
How will you know your improvements are being sustained? Measurement System; Statistical Process Control Chart
What could go wrong with the improvements?
How can you prevent this from happening?
Design Failure Modes and Effects Analysis; Systems and Structures Assessment, Control Plan, Jidoka; Autonomation
How are you going to make the improvements a part of your routine?
Standard Work; Visual Management
How will you celebrate success? Stakeholder Analysis; Rewards and Recognition
Can your improvements be applied to other areas (Scroll and Replicate)?
Control Plan
How are you going to hand off your project to the process owners(s)?
Design Failure Mode and Effects Analysis; Control Plan
How are you going to communicate the project close to key stakeholders?
Communication Plan; Stakeholder Analysis; Control Plan
63

Tips to Avoid Potential Pitfalls
• Ongoing measurement at defined intervals
• Define triggers to indicate improvement is not being sustained
• Standardize work where possible
• Implement Fail safe strategies where possible
• Celebrate, Reward and Recognize
• Hand-off project to process owners
64

Example Control Chart: HHCAHPS – Q18 Listen Carefully
77.00
78.00
79.00
80.00
81.00
82.00
83.00
84.00
85.00
86.00
87.00
Wk 1 Wk 2 Wk 3 Wk 4 Wk 5 Wk 6 Wk 7 Wk 8 Wk 9 Wk 10 Wk 11 Wk 12
Control Chart
Score Mean UCL LCL
65
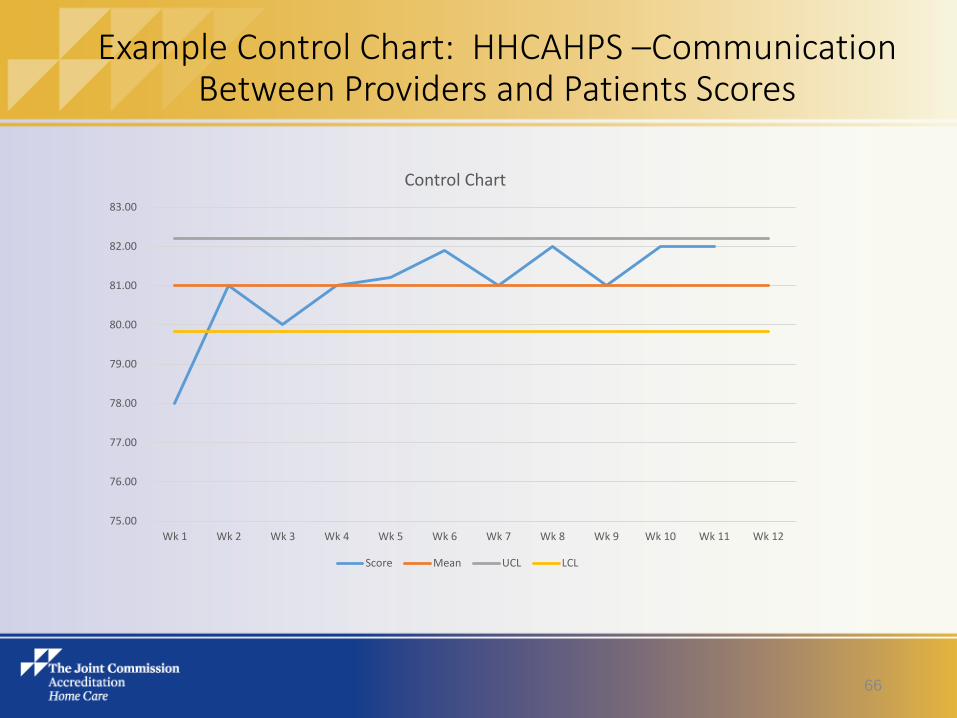
Example Control Chart: HHCAHPS –Communication Between Providers and Patients Scores
75.00
76.00
77.00
78.00
79.00
80.00
81.00
82.00
83.00
Wk 1 Wk 2 Wk 3 Wk 4 Wk 5 Wk 6 Wk 7 Wk 8 Wk 9 Wk 10 Wk 11 Wk 12
Control Chart
Score Mean UCL LCL
66

Example Dashboard
• Control Chart: HHCAHPS – Q18 Listen Carefully
• HHCAHPS –Communication Between Providers and Patients Scores
74.00
76.00
78.00
80.00
82.00
84.00
Wk 1 Wk 2 Wk 3 Wk 4 Wk 5 Wk 6 Wk 7 Wk 8 Wk 9 Wk 10 Wk 11 Wk 12
Control Chart
Score Mean UCL LCL
76.0078.0080.0082.0084.0086.0088.00
Wk 1 Wk 2 Wk 3 Wk 4 Wk 5 Wk 6 Wk 7 Wk 8 Wk 9 Wk 10 Wk 11 Wk 12
Control Chart
Score Mean UCL LCL
67

Example Rewards and Recognition
• By Organization, By Team, By Individual
• Post Data Weekly
• Reward Monthly
• Announce Publicly
• Encourage High Achievers to work with Peers to Improve Performance
68

Next Steps
• Continue PI Iterative Process to Improve Communication Between Providers and Patients
• Q17 How often did home health providers from this agency explain things in a way that was easy to understand? 71
• Q15: How often did the home health providers from this agency keep you informed about when they would arrive at your home? 69
Q19: How often did home health providers from this agency treat you with courtesy and respect? 70
69

Questions
70

• Please continue to submit your
text questions and comments
using the Questions Panel
Note: Today’s presentation is being
recorded and will be posted on the
Joint Commission website.
Attendee Participation
Submitting Your Questions
71
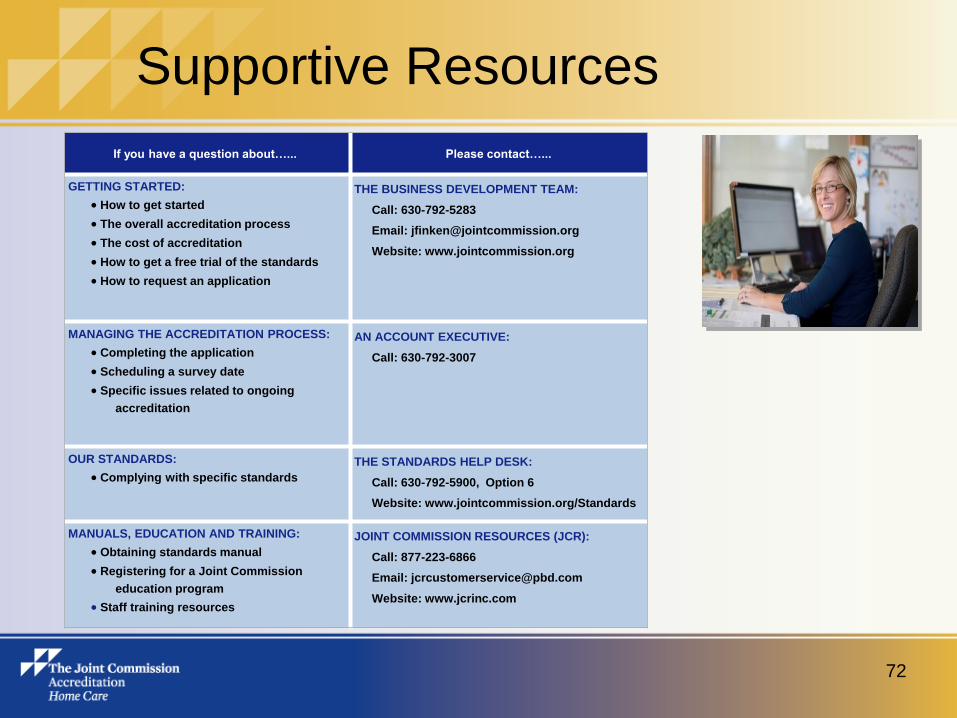
Supportive Resources
If you have a question about…... Please contact…...
GETTING STARTED:
How to get started
The overall accreditation process
The cost of accreditation
How to get a free trial of the standards
How to request an application
THE BUSINESS DEVELOPMENT TEAM:
Call: 630-792-5283
Email: [email protected]
Website: www.jointcommission.org
MANAGING THE ACCREDITATION PROCESS:
Completing the application
Scheduling a survey date
Specific issues related to ongoing
accreditation
AN ACCOUNT EXECUTIVE:
Call: 630-792-3007
OUR STANDARDS:
Complying with specific standards
THE STANDARDS HELP DESK:
Call: 630-792-5900, Option 6
Website: www.jointcommission.org/Standards
MANUALS, EDUCATION AND TRAINING:
Obtaining standards manual
Registering for a Joint Commission
education program
Staff training resources
JOINT COMMISSION RESOURCES (JCR):
Call: 877-223-6866
Email: [email protected]
Website: www.jcrinc.com
72

Home Care Team Contacts
Standards Interpretation Help Desk: 630-792-5900
Joint Commission Resources: 877-223-6866 or www.jcrinc.com
Brenda Lamberti, BS
Business Development Specialist
630-792-5252 or
Joint Commission Home Care Program
Help Desk: 630-792-5070 or [email protected]
www.jointcommission.org/accreditation/home_care.aspx
Margherita Labson
BSN, MSHSA, CPHQ, CCM, CGB
Executive Director
630-792-5284 or
Julia Finken
BSN, MBA, CPHQ, CSSBB
Associate Director
630-792-5283 or

74


![Water Music [HWV 348-350] - Free-scores.com · Title: Water Music [HWV 348-350] Author: Haendel, Georg Friedrich - Arranger: Josiah Pittman (1816-1886) - Publisher: London: Augener,](https://static.fdocuments.in/doc/165x107/5b8ff2d609d3f2691f8d54e2/water-music-hwv-348-350-free-title-water-music-hwv-348-350-author-haendel.jpg)


![Suite in G minor, VI. Passacaglia [HWV 432]](https://static.fdocuments.in/doc/165x107/6181cbe254202762f8248f3b/suite-in-g-minor-vi-passacaglia-hwv-432.jpg)


![709 ' # '6& *#7 & 8cdn.intechopen.com/pdfs-wm/47646.pdf · &kdswhu $owhuqdwlyh8vhvri&dylwdwlqj-hwv-rvÜ*loehuwr'doiuÜ)lokr 0dldud3huhlud$vvlvdqg $qd,qÜv%ruul*hqryh] $gglwlrqdolqirupdwlrqlvdydlodeohdwwkhhqgriwkhfkdswhu](https://static.fdocuments.in/doc/165x107/5ac006687f8b9a213f8b7e6d/709-6-7-8cdn-owhuqdwlyh8vhvridylwdwlqj-hwv-rvloehuwrdoiulokr-0dldud3huhludvvlvdqg.jpg)