THE KCP LIMITED CEMENT UNIT-II, RAMAKRISHNAPURAM
34
22 nd National Award for “Excellence in Energy Management 2021” 24 – 27 th August 2021 THE KCP LIMITED CEMENT UNIT-II, RAMAKRISHNAPURAM Leader V.MADHUSUDANA RAO PLANT HEAD Team Member P KISHORE- Sr.DGM-MECHANICAL P RAMANA REDDY-AGM-EHS R VARAPRASADA RAO-AGM-E&I AVRG BHAVANARAYANA-AGM-QC T SAMBA SIVA RAO-SR.MGR-PROCESS
Transcript of THE KCP LIMITED CEMENT UNIT-II, RAMAKRISHNAPURAM

22nd National Award for “Excellence in Energy Management 2021” 24 – 27th August 2021
THE KCP LIMITED CEMENT UNIT-II, RAMAKRISHNAPURAM
Leader
V.MADHUSUDANA RAOPLANT HEAD
Team MemberP KISHORE- Sr.DGM-MECHANICALP RAMANA REDDY-AGM-EHSR VARAPRASADA RAO-AGM-E&IAVRG BHAVANARAYANA-AGM-QCT SAMBA SIVA RAO-SR.MGR-PROCESS

GROUP COMPANIES OF KCP
THE K C P LIMITED, CEMENT UNIT-I MACHERLA – 0.8 MTPA
SUGAR PLANT, VIETNAM – 6000 TPD
HEAVY ENGINEERING, THIRUVOTTIYUR BUILDING MATERILS, MUKTYALA
HOTEL MERCURE KCP, HYDERABAD
THE K C P LIMITED, CEMENT UNIT-II MUKTYALA – 3.52 MTPA

THERMAL POWER PLANT,MUKTYALA – 1X18 MW
SOLAR POWER PLANT, MUKTYALA – 1.15 MW
HYDEL POWER PLANT, NEKARIKALLU – 8.25 MW
WIND POWER, THIRUNELVELI – 3.25 MW
WHR – 9.0 MW SOLAR – 4 X 1.15 MW
TOTAL – 13.6 MW UNDER EXECUTION
GROUP COMPANIES OF KCP
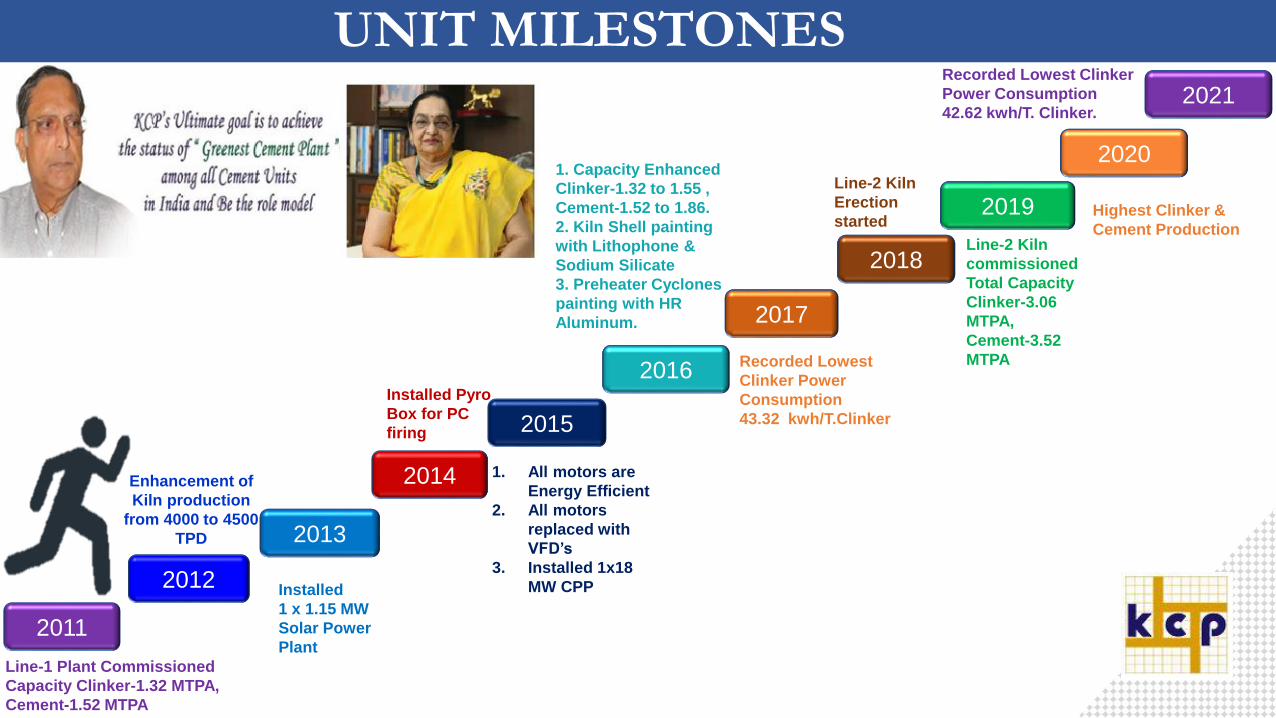
UNIT MILESTONES
2011
Line-1 Plant Commissioned
Capacity Clinker-1.32 MTPA,
Cement-1.52 MTPA
Recorded Lowest
Clinker Power
Consumption
43.32 kwh/T.Clinker
Installed
1 x 1.15 MW
Solar Power
Plant
1. All motors are
Energy Efficient
2. All motors
replaced with
VFD’s
3. Installed 1x18
MW CPP
1. Capacity Enhanced
Clinker-1.32 to 1.55 ,
Cement-1.52 to 1.86.
2. Kiln Shell painting
with Lithophone &
Sodium Silicate
3. Preheater Cyclones
painting with HR
Aluminum.
2013
2014
2015
2016
2017
2018
Installed Pyro
Box for PC
firing
Line-2 Kiln
Erection
started
Line-2 Kiln
commissioned
Total Capacity
Clinker-3.06
MTPA,
Cement-3.52
MTPA
2019
2012
Enhancement of
Kiln production
from 4000 to 4500
TPD
2020
Highest Clinker &
Cement Production
2021Recorded Lowest Clinker
Power Consumption
42.62 kwh/T. Clinker.

CCR
LOESCHE LM-
53.3+3 C/S
Co
nsiste
nt Q
uality
Robotic lab
PSC3-103.12 T
KCP’S STATE OF ART TECHNOLOGYL
ow
Ele
ctr
ical
Lo
w T
herm
al
Lo
w E
missio
ns
CEMENT UNIT-II

Impact of COVID-19
Covid-19 has impacted the entire universe and we too have no exemption from
that. We were forced to face some confrontations in the following areas due to
Novel Virus Covid-19 .
Fly ash absorption has come down by 3 % due to non-availability of fly ash – as
NTPC was under lockdown during first quarter of the year
Quality of fly ash is not up to the mark and hence consumed more energy to
maintain the standard specifications.
Due to shortage of migrated manpower, preventive maintenance has differed
frequently from the schedule and leads to loss of production and hence more
power consumption.
Disruptions in supply chain management leads to non-availability of required
material and leads to loss of production and hence more power consumption.
Forced to use OPC in place of PPC and hence more energy consumption.
Our Production schedules have been hampered and disrupted due to Covid-19
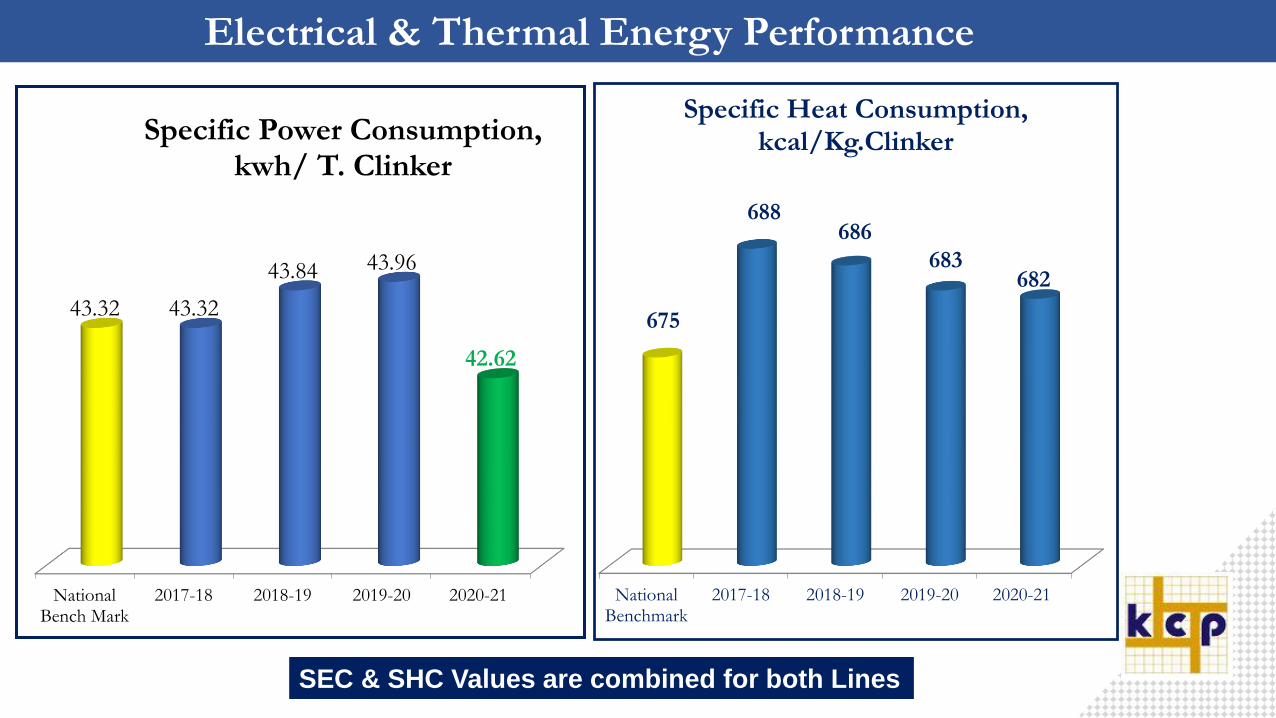
NationalBenchmark
2017-18 2018-19 2019-20 2020-21
675
688686
683682
Specific Heat Consumption,kcal/Kg.Clinker
Electrical & Thermal Energy Performance
SEC & SHC Values are combined for both Lines
NationalBench Mark
2017-18 2018-19 2019-20 2020-21
43.32 43.32
43.84 43.96
42.62
Specific Power Consumption,kwh/ T. Clinker

NationalBenchmark
2017-18 2018-19 2019-20 2020-21
63.92
67.63
65.82
64.56
65.69
Overall Specific Power Consumption, kwh/T.Cement
Energy Performance in Last 4 years
(OPC:PPC:RHPC)
(62:34:2)
SEC Values are combined for both Lines
2017-18 2018-19 2019-20 2020-21
30.5928.09
25.27 25.68
OPC Specific Power Consumption,
kwh/T.Cement
SEC increased due to the impact of Novel Virus Covid-19 & Increased RHPC Production
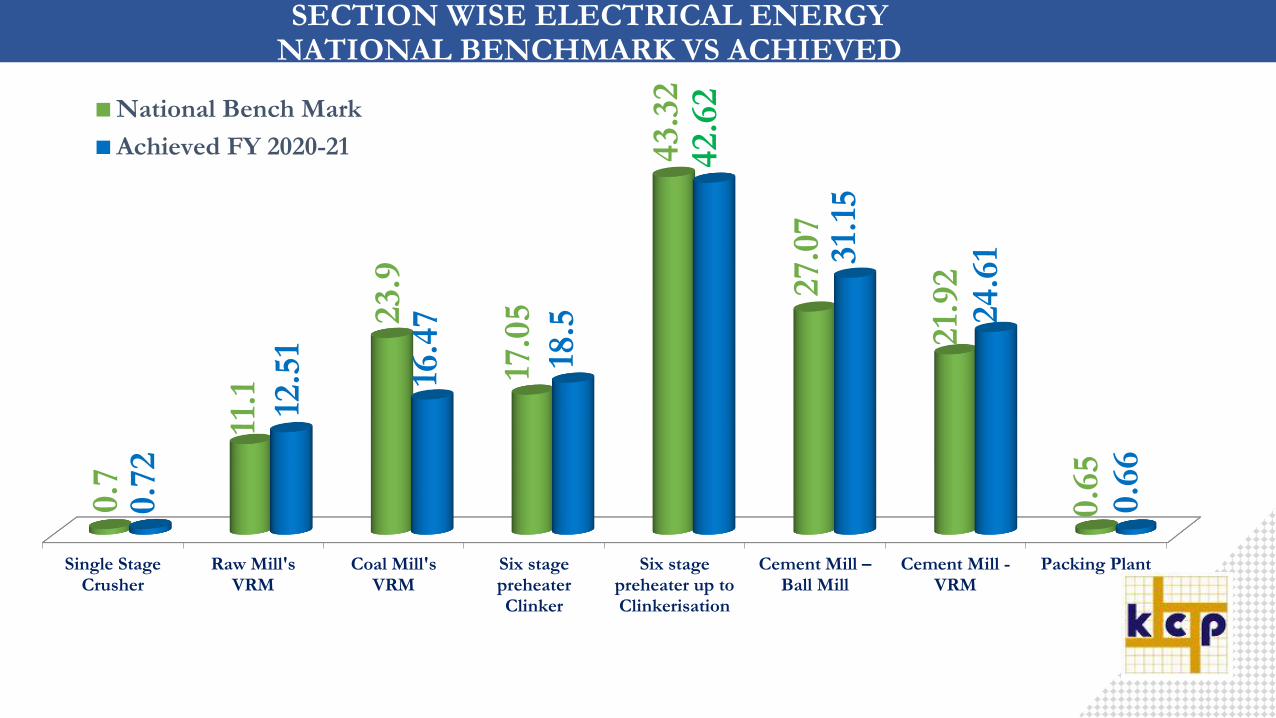
Single StageCrusher
Raw Mill'sVRM
Coal Mill'sVRM
Six stagepreheaterClinker
Six stagepreheater up toClinkerisation
Cement Mill –Ball Mill
Cement Mill -VRM
Packing Plant
0.7
11.1
23.9
17.0
5
43.3
2
27.0
7
21.
92
0.6
5
0.7
2
12.5
1
16.4
7
18.5
42.6
2
31.
15
24.6
1
0.6
6
National Bench Mark
Achieved FY 2020-21
SECTION WISE ELECTRICAL ENERGY NATIONAL BENCHMARK VS ACHIEVED
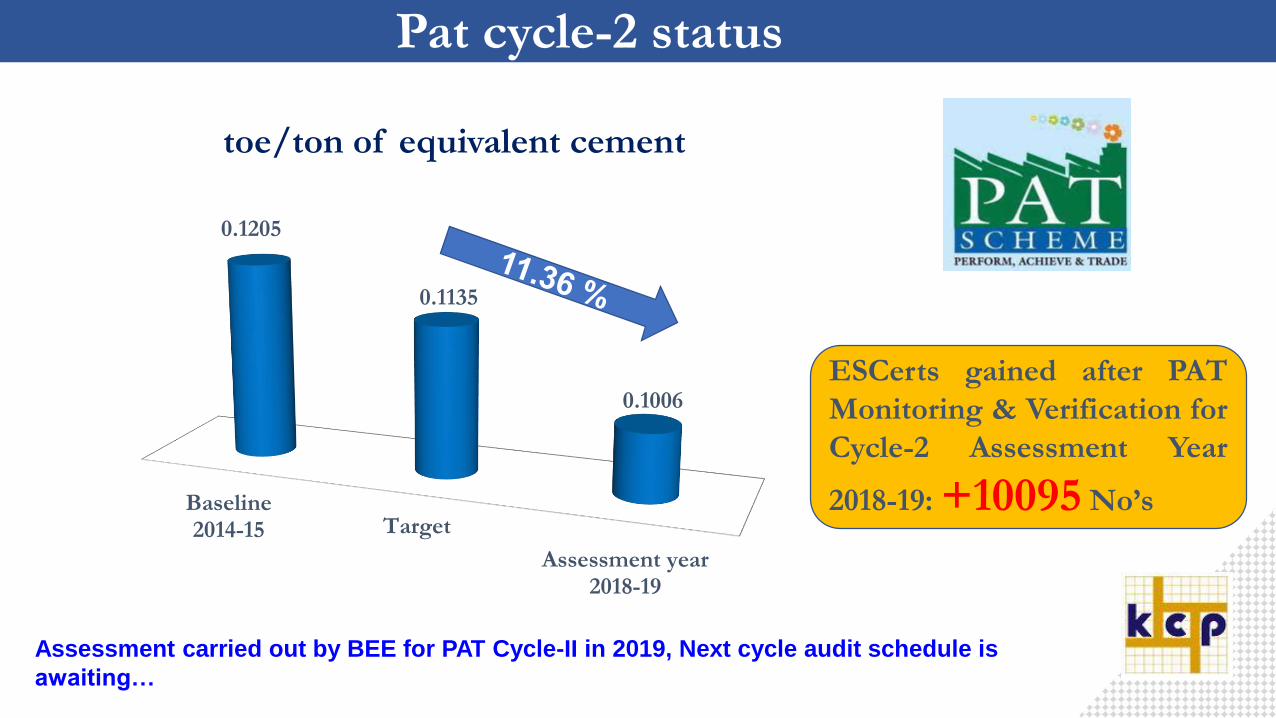
Pat cycle-2 status
Baseline2014-15 Target
Assessment year2018-19
0.1205
0.1135
0.1006
toe/ton of equivalent cement
ESCerts gained after PAT
Monitoring & Verification for
Cycle-2 Assessment Year
2018-19: +10095 No’s
Assessment carried out by BEE for PAT Cycle-II in 2019, Next cycle audit schedule is
awaiting…

11
Road map for achieving Target Electrical energy
2020-21
65.69 kwh/T of
Cement
2022-23
Target 60.69 kwh/T
of Cement
2
1
ESP-2 to Cement mill-3 hot air duct
1.5 kwh/T of Cement
Coal Mill-2 ducting modification
with pre-collector arrangement
3.0 kwh/T of material
Enhancement of CM-2 Production With Mix
of Grinding Aid 0.5 Kwh/T of Cement
3

12
Road map for achieving Target Thermal energy
682 kcal/Kg
Clinker
Target to achieve
National
Benchmark 675
kcal/Kg Clinker
2
1Preheater Cyclones
painting with HR
Aluminizing
3 kcal/Kg Clinker
Usage of AFR
2kcal/Kg Clinker3
Optimization of Split Kiln Feed
and PC firing at Preheater
2 kcal/Kg Clinker

S.No Project Estimated
Investment,
Rs. Crores
Target Payback,
Months
1 Line-2 Preheater HR Aluminizing 0.9 2021 24
2 Arrangement of AFR Feeding System (Carbon Black, Plastic Waste, Wooden Chips, Bio Mass)
4.0 2022 24
3 Installation of 9.0 MW Waste Heat Recovery for Line-2 Kiln
50.0 2022 48
4 Installation of 4x1.15 MW Solar Power Plant
20.0 2022 85
Long Term Vision on Energy Efficiency

Energy Conservation ProjectsDetail Unit 2018-19 2019-20 2020-21 Over All
(FY 18, 19, 20)
Total no.of Encon Projects Nos. 15 14 13 42
Encon Projects with Nil Investments
Nos. 7 7 8 22
Total Investment made Rs.Lakhs 127.98 176.86 16.4 321.24
Total Savings made Rs.Lakhs 191.62 103.64 232.3 527.56
Electrical Energy Saved Lakh Units 25.84 8.73 39.89 74.46
Rs.Lakhs 140.62 81.44 215.45 437.51
Thermal Energy Saved Tons of Coal 470 343 284.02 1093
Rs.Lakhs 51 22.2 16.64 90
Impact on SEC KWH/Ton of Cement
65.82 64.56 65.69 Slight increase is due to Impact of COVID-19 pandemic
Kcal/ Kg of Clinker 686 683 682

Energy Saving Projects Implemented in 2020-2021
S.No Energy Saving Project Energy Saving, Rs.
Lakhs/Annum
Investment,Rs/Lakhs
PaybackMonths
No Investment
1 Reduction Of Dam Ring Height In Cement Mill-3 85.5 0 0
2 Extension Of Raw Mill-2 Grit Cone Feed Chute 23.3 0 0
3 Optimization Of Cement Silos Vent Bag Filter Fans Operation
2.1 0 0
4 Raw mill-2 water spray system pipe line modification 0.8 0 0
5 Reduction in False Air at Raw Mill-2 Circuit 7.8 0 0
6 Removal of damper for Cement mill-3, Rawmill-1 Fan by reducing the damper losses
5.5 0 0
7 Raw Mill-2 , Coal Mill-2 Fan Inlet Duct Modification 8.9 0 0
8 Coal Truck tippler modification 3.82 0 0

Energy Saving Projects Implemented in 2020-2021
S.No Energy Saving Project Energy Saving, Rs. Lakhs/Annum
Investment,Rs/Lakhs
Payback,Months
With Investment
9 Optimizing Kiln operation by conducting Heat Balance, Mass Balance and by Operating Kiln in PXP mode
145 15.0 2
10 Replacement of 70W SV lamp with 40W LED light for plant lighting - 100 Fixtures
1.1 1.6 18
11 Replacement of 4x14W T5 with 36W LED Panel Light for Fall Celling - 30 Fixtures
0.2 0.04 28
Total 284.02 16.64
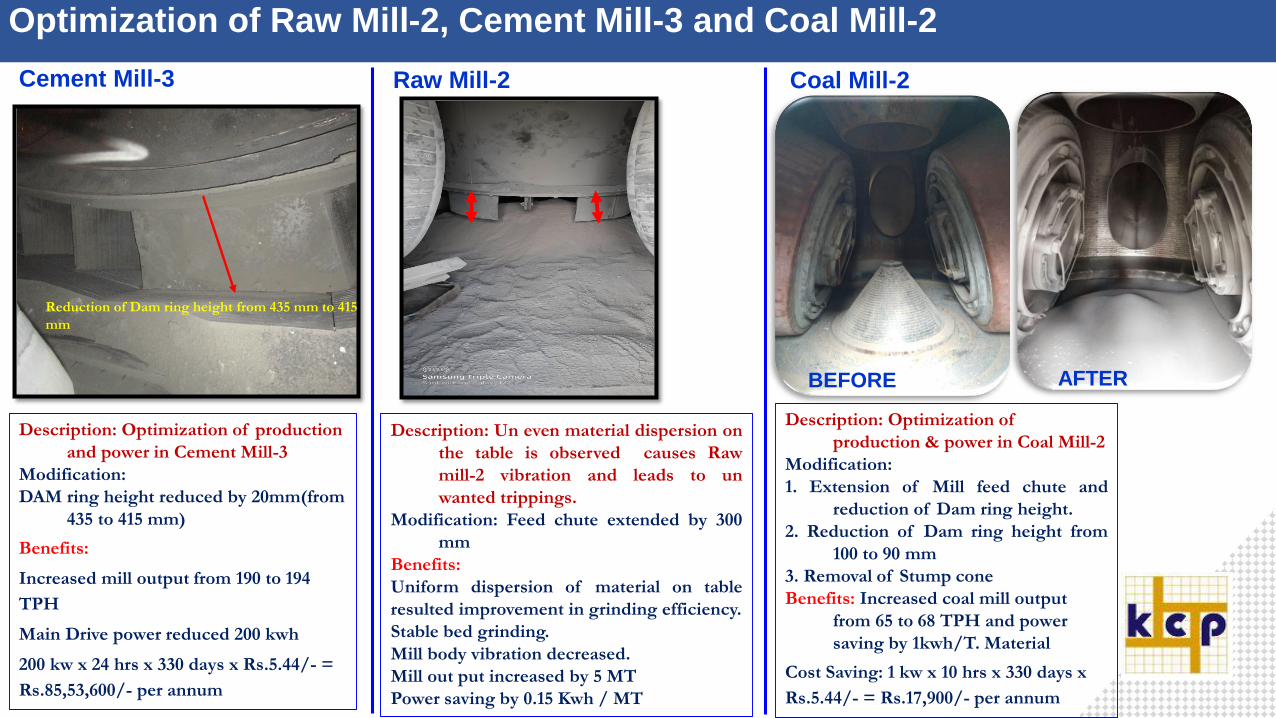
Reduction of Dam ring height from 435 mm to 415
mm
Optimization of Raw Mill-2, Cement Mill-3 and Coal Mill-2
Description: Optimization of production
and power in Cement Mill-3
Modification:
DAM ring height reduced by 20mm(from
435 to 415 mm)
Benefits:
Increased mill output from 190 to 194
TPH
Main Drive power reduced 200 kwh
200 kw x 24 hrs x 330 days x Rs.5.44/- =
Rs.85,53,600/- per annum
Description: Un even material dispersion on
the table is observed causes Raw
mill-2 vibration and leads to un
wanted trippings.
Modification: Feed chute extended by 300
mm
Benefits:
Uniform dispersion of material on table
resulted improvement in grinding efficiency.
Stable bed grinding.
Mill body vibration decreased.
Mill out put increased by 5 MT
Power saving by 0.15 Kwh / MT
BEFORE AFTER
Description: Optimization of
production & power in Coal Mill-2
Modification:
1. Extension of Mill feed chute and
reduction of Dam ring height.
2. Reduction of Dam ring height from
100 to 90 mm
3. Removal of Stump cone
Benefits: Increased coal mill output
from 65 to 68 TPH and power
saving by 1kwh/T. Material
Cost Saving: 1 kw x 10 hrs x 330 days x
Rs.5.44/- = Rs.17,900/- per annum
Cement Mill-3 Raw Mill-2 Coal Mill-2

Removal of dampers at Cement Mill-3, Raw Mill-1 and Cooler ESP-2 Fans inlet to reduce the pressure losses
AfterBefore
Investment: Zero (in house modification) Total Savings: 17 kwh in terms of Rs.6,99,810 /- annum
Cement Mill-3
AfterBefore
Raw Mill-1Savings:7 kwh in terms of Rs.2,72,160/- Savings: 6 kwh in terms of Rs.2,33,250/-
Savings: 5 kwh in terms of Rs.1,94,400/-Cooler ESP-2

Savings: Avoided Usage Of 130PC Machine, for removal of partial quantity of coal.
Thermal Energy Savings:
Diesel saving approx. 20 Liters per Day. Cost Saving: Rs:6.5 Lac per annum.
Before Modification Hydraulic Truck Tippler No Load Lifting
Pressure =38kg/Cm2
Lifting Load=38ton.
HTU Load Lifting Pressure= 155-180kg/Cm2
Tippler Angle = 55deg
After Modification Hydraulic Truck Tippler No Load Lifting
Pressure =30kg/Cm2
Lifting Load=50 ton.
HTU Load Lifting Pressure= 155-180kg/Cm2
Tippler Angle = 45deg
Work:-
Coal Truck Tippler Hydraulic Cylinders 2no’s
Position Changed Up to 200mm Towards Lifting
Side
INNOVATIVE PROJECT: Coal Truck Tippler Modification

Coal Truck Tippler Modification:
MAKE = JAYPEE ENGINEERING&HYDAULIC EQUIPMENT.CO.LTD
MODEL = 40T HTU
HYDRAULIC CYLINDER BORE = 250DIA
PISTON STOKE LENGTH = 1420
Before Modification After Modification

UTILIZATION OF RENEWABLE ENERGY
1.15 MW Solar Power Plant
Hydel Power Plant Wind Power
1.15 MW Solar Power
8.25 MW Hydel Power
3.25 MW Wind Power
Total Renewable Energy
• 12.65 MW
0
50
100
150
2018-19 2019-20 2020-21
16 16 15.8
21
35
126
Solar
Hydel
Consumption in Lac KWH

Solar Energy UtilizationSolar Street lights
Solar Water Heaters for Colony – 150 Flats
Solar Water Pump at Mango Garden
INVESTMENT MADE: 8.5 LAKHSSAVING: 5.2 LAKHS/ANNUM
Solar Fencing around the Residential Colony
INVESTMENT MADE: 6.0 LAKHSSAVING: 1.0 LAKHS/ANNUM
INVESTMENT MADE: 5.0 LAKHSSAVING: 1.2 LAKHS/ANNUM
INVESTMENT MADE: 1.2 LAKHS
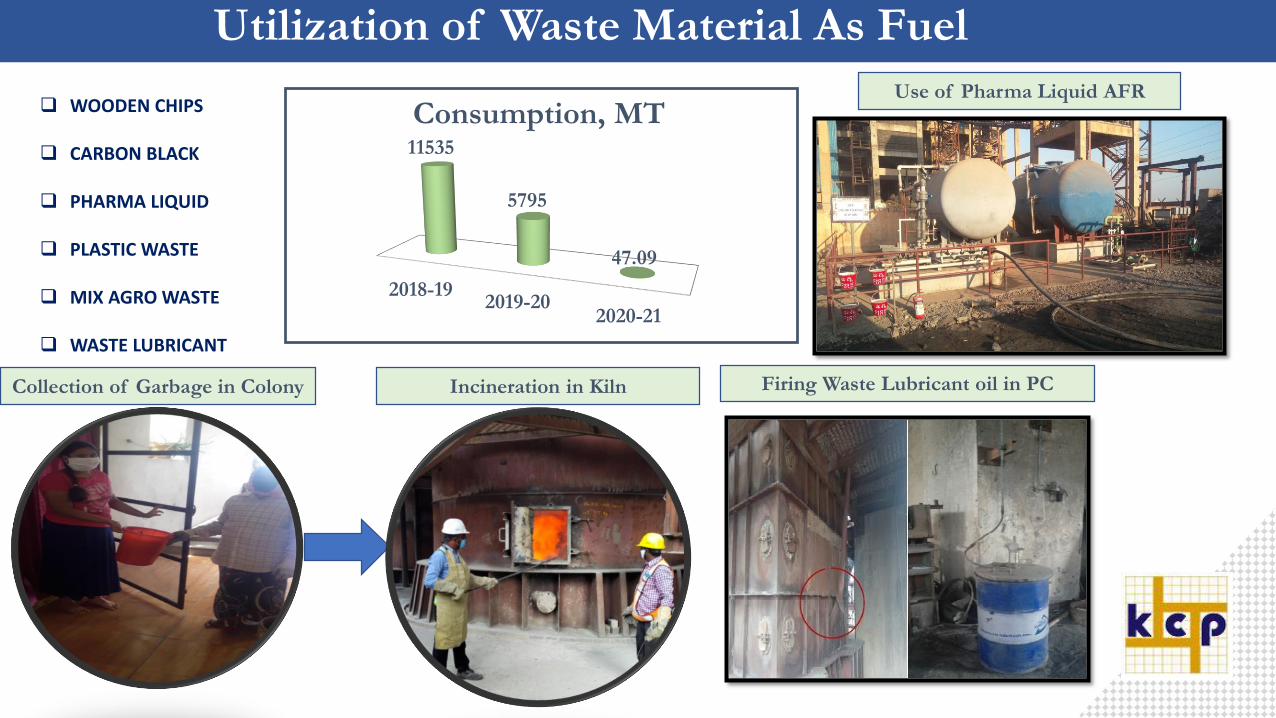
Utilization of Waste Material As Fuel
WOODEN CHIPS
CARBON BLACK
PHARMA LIQUID
PLASTIC WASTE
MIX AGRO WASTE
WASTE LUBRICANT
2018-192019-20
2020-21
11535
5795
47.09
Consumption, MT
Collection of Garbage in Colony Incineration in Kiln
Use of Pharma Liquid AFR
Firing Waste Lubricant oil in PC
Learning from CII Awards ...
• To bring in recognition to the Organisation through uniqueinnovative practices.
• Creating platform for sharing of knowledge which takes tosustainable growth through optimum utilization of resources,diversified Quality Products, Processes and Services for all ourStakeholders.
• Understand the Industry best and implement the same in ourOrganisation.
• Creating a competitive edge amongst the industries through rightperson is assigned for the right job and that they grow andcontribute towards organizational excellence
• Employee engagement & belongingness increased
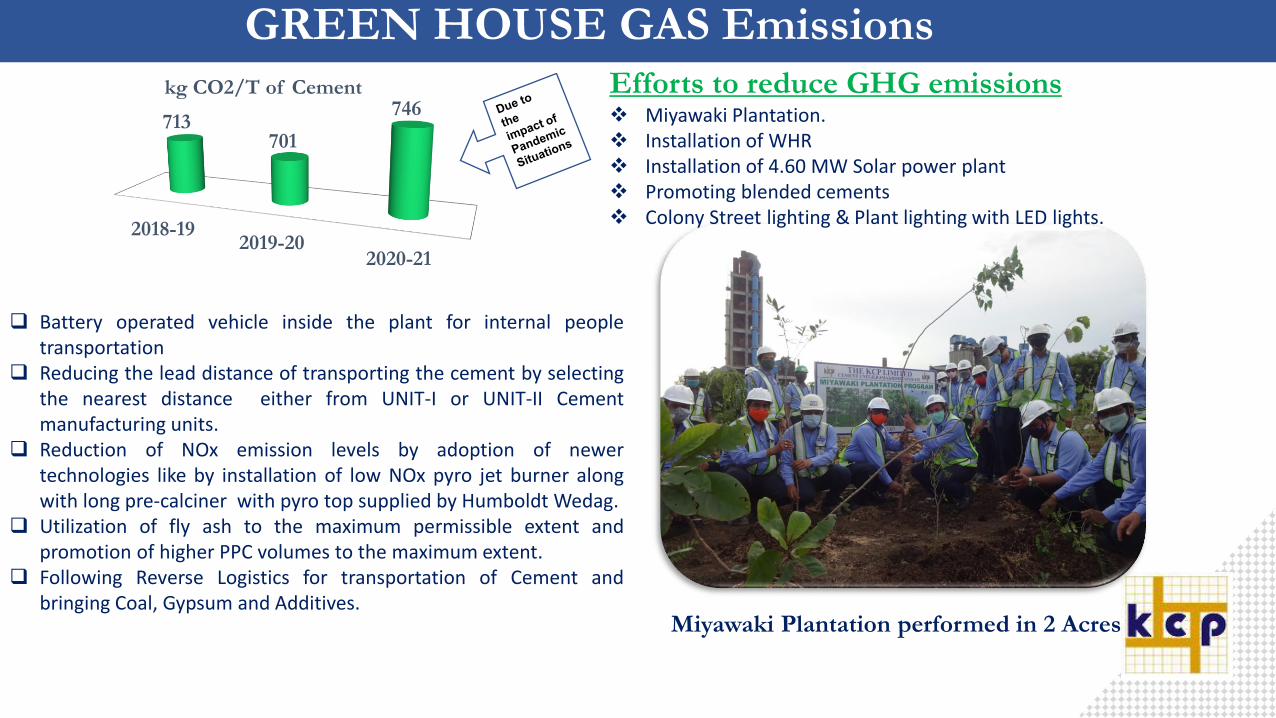
GREEN HOUSE GAS Emissions
2018-192019-20
2020-21
713701
746kg CO2/T of Cement
Battery operated vehicle inside the plant for internal peopletransportation
Reducing the lead distance of transporting the cement by selectingthe nearest distance either from UNIT-I or UNIT-II Cementmanufacturing units.
Reduction of NOx emission levels by adoption of newertechnologies like by installation of low NOx pyro jet burner alongwith long pre-calciner with pyro top supplied by Humboldt Wedag.
Utilization of fly ash to the maximum permissible extent andpromotion of higher PPC volumes to the maximum extent.
Following Reverse Logistics for transportation of Cement andbringing Coal, Gypsum and Additives.
Miyawaki Plantation performed in 2 Acres
Efforts to reduce GHG emissions Miyawaki Plantation. Installation of WHR Installation of 4.60 MW Solar power plant Promoting blended cements Colony Street lighting & Plant lighting with LED lights.

Green supply chainGreen Supply Chain Implementations:1. Creating awareness on Environmental Impacts.
2. Rethinking of material requirements and consumption for sustainability.
3. Reducing the use of hazardous material.
4. Improved energy efficiency Materials Purchase.
5. Reducing the pollution and noise levels and using recycled materials and recycling waste.
6. Customer preference.
7. Continuously compliance the environmental regulations.
Manufacturing of fly ash based pavers, Hallow & Concrete bricks
Capacity: 20,000 – 25,000 no’s per day ( Investment: Rs. 2.0 cores.)
The fly ash & Bed material generated in CPP are being used for the
manufacturing of Hallow bricks, Concrete solid bricks & Colored Pavers.
Recycling of CPP waste neutralization water to Cement Plant for equipment
process & Cooling to avoid scaling in Pipe lines.`

Before: All bag filter fans in DOL Operation
After: Installed 22 No’s VFD s for all the bag filter fans
Switch over 3 Star Rating AC
5 Star Inverter Rating150 No’s LED Lights
3 Star Rating5 Star Rating
FTL Lights
Green supply chain Best Practices
Before: IE2 Motor After: IE3 Motor
Initiatives:
100% safety on roads as voice enabled GPS is installed which
alerts the driver on possible risk.
Ship more cement covering more distance than before.
Better planning is ensured by the company with its stakeholders
- transporter, dealer, trucker and society.
Vehicle service center.

Daily Energy Monitoring Report
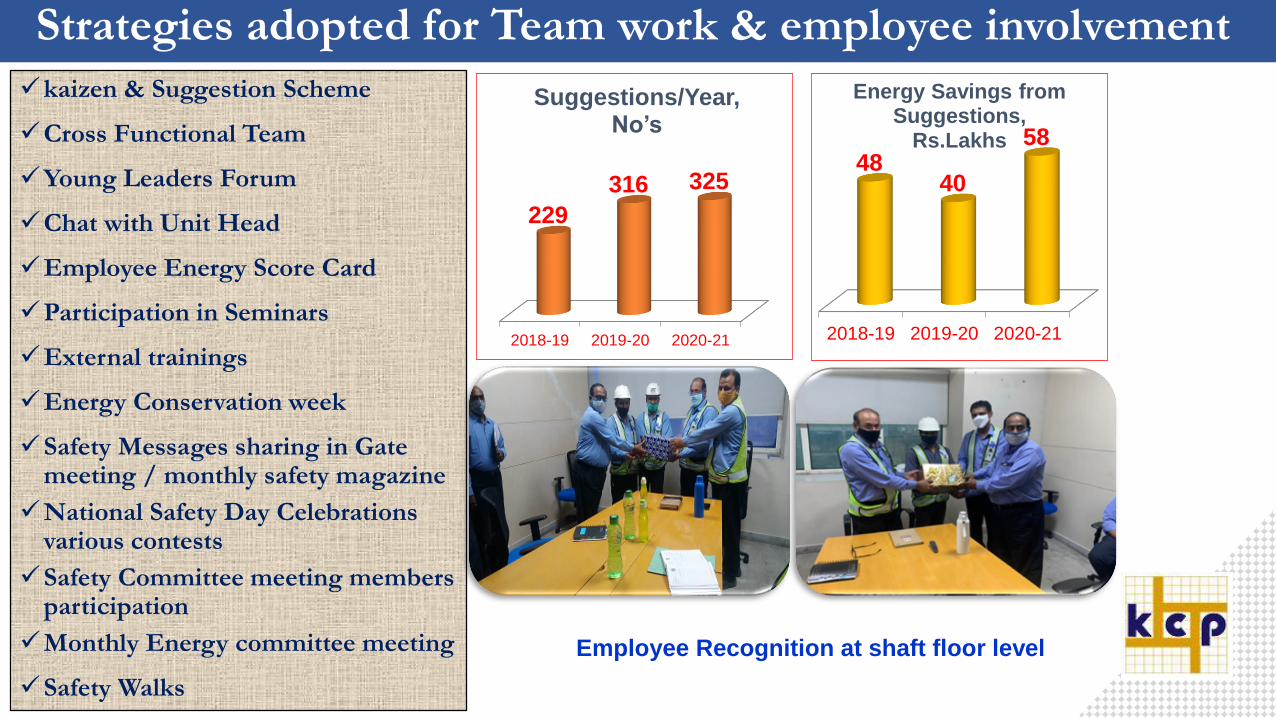
Strategies adopted for Team work & employee involvement
kaizen & Suggestion Scheme
Cross Functional Team
Young Leaders Forum
Chat with Unit Head
Employee Energy Score Card
Participation in Seminars
External trainings
Energy Conservation week
Safety Messages sharing in Gate meeting / monthly safety magazine
National Safety Day Celebrations various contests
Safety Committee meeting members participation
Monthly Energy committee meeting
Safety Walks
2018-19 2019-20 2020-21
229
316 325
Suggestions/Year, No’s
2018-19 2019-20 2020-21
4840
58
Energy Savings from Suggestions,
Rs.Lakhs
Employee Recognition at shaft floor level

Energy Scorecard for Monitoring the performance of major Equipment's by the team
members
ENERGY TEAM RESPONSIBILITIES
S.N
O.DESCRIPTION SEC NAME
TARGET ACTUAL
FY 20-21
1 LS CRUSHER Kwh/Ton of Lime Stone Y.SUBBARAO 0.73 0.72
2 RAW MILL-1 Kwh/Ton of Raw meal M.SATYANARAYANA 12.00 12.36
3 RAW MILL-2 Kwh/Ton of Raw meal Y.KISHORE BABU 12.50 12.56
4 KILN-1 Kwh/Ton of Clinker P NARASIMHA RAO 19.00 18.95
5 KILN-2 Kwh/Ton of Clinker J V S GUNNAIAH RAJU 19.00 18.29
6 COAL MILL-1 Kwh/Ton of Coal M.INNA REDDY 14.50 15.12
7 COAL MILL-2 Kwh/Ton of Coal E RAMU 18.00 17.14
8 CEMENT MILL-1 Kwh/Ton of Cement P.SRINIVASARA RAO 26.00 31.64
9 CEMENT MILL-2 Kwh/Ton of Cement CH SURESH REEDY 26.00 30.97
10 CEMENT MILL-3 Kwh/Ton of Cement CH V RAMARAJU 24.50 24.61
11 PACKING PLANTS Kwh/Ton of Cement P BIXAM & N S RAJU 0.70 0.66
12 UTILITIES Kwh/Ton of Clinker G.MALLESH 1.6 1.29
13 SERVICES Kwh/Ton of Cement MD.RAHIM 2.0 1.52
14HEAT CONSUMPTION
KCal/Kg of Clinker T SAMBASIVA RAO 675 682
15 EXPLOSIVE ENERGY Tons/Kg of Explosive P.RAMAKRISHNA 8.12 8.43
Focus for the Energy Efficiency
Daily Monitoring
Trainings
Innovative Modifications
Periodical upgradation of new
technological equipment's

Integrated Management System
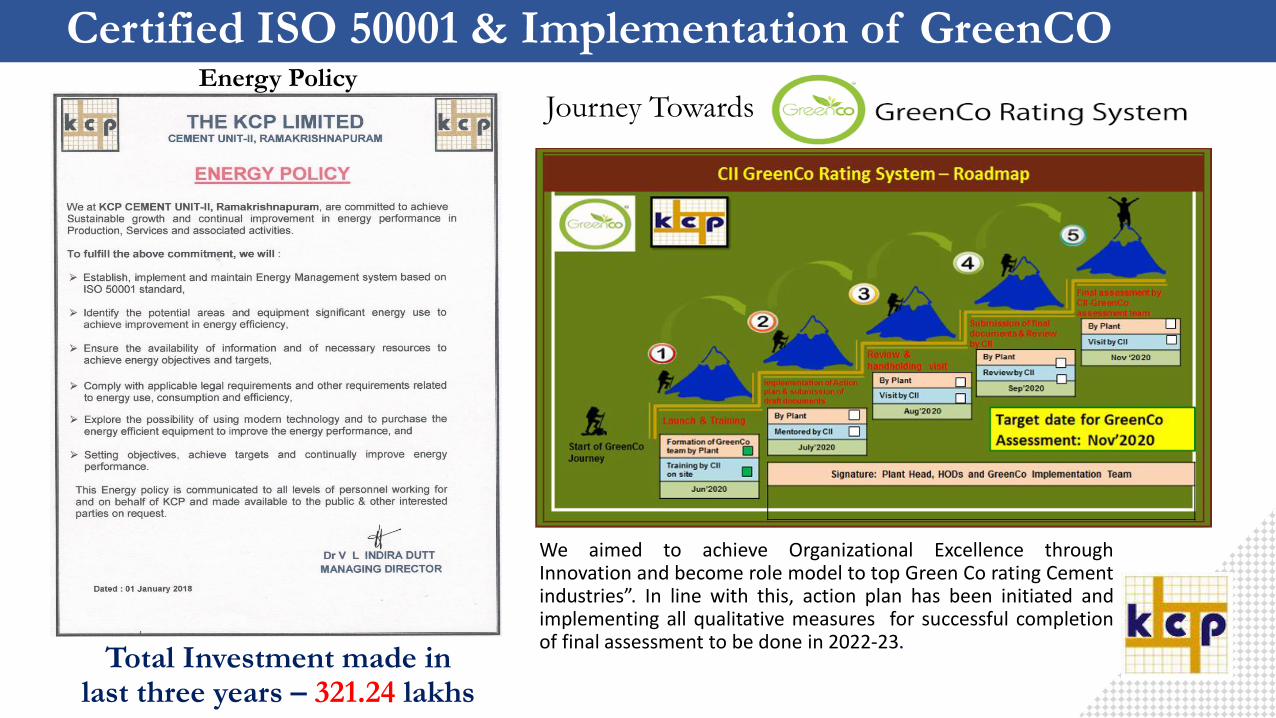
Certified ISO 50001 & Implementation of GreenCOEnergy Policy
Total Investment made in last three years – 321.24 lakhs
We aimed to achieve Organizational Excellence throughInnovation and become role model to top Green Co rating Cementindustries”. In line with this, action plan has been initiated andimplementing all qualitative measures for successful completionof final assessment to be done in 2022-23.
Journey Towards

Awards Received as on:
2020: 5 Star for Excellence in EHS practices
2020: National Award for Excellence in water Management
2020: Bagged First Place in Sectorial and Sustainability, in
recognition of best practices in Environment, Health & Safety.
2020: National Excellence Energy Efficient in Energy Management
2019: 5 Star for Excellence in EHS practices
2019: Excellence in Sustainability by Manufacturing Today
2019: National Excellence Energy Efficient in Energy Management
2018: National Energy Efficient in Energy Management
2017: National Excellent Energy Efficient in Energy Management
2016: National Energy Efficient in Energy Management
2016: 3 Star for Appreciation in EHS practices
2015: National Excellent Energy Efficient in Energy Management
2015: Most useful Presentation Award
2014: National Excellent Energy Efficient in Energy Management
2014: National Energy Conservation Award (BEE) in Cement
Sector by Government of India, Ministry of Power
2018-19: NCB-Excellence in the field of Energy and Environment
2017-18: NCB-Excellence in the field of Energy and Environment
2016-17: NCB-Best Electrical Energy Performance Award
2014-15: NCB-Best Electrical Energy Performance Award
2013-14: NCB-Best Electrical Energy Performance Award
THE KCP LIMITED CEMENT UNIT-II - MUKTYALA

Contact Details:
Sri.V.Madhusudana Rao
Vice President-Operations
Email: [email protected]
Ph.No:08654-296006/7/8