The Kaleidoscope of Impact: same data, different perspectives, constantly changing
18
THE KALEIDOSCOPE OF IMPACT @charlierapple @chemconnector @joellemasciulli @kglibrarian
-
Upload
kudos-innovations-ltd -
Category
Education
-
view
330 -
download
0
Transcript of The Kaleidoscope of Impact: same data, different perspectives, constantly changing

THE KALEIDOSCOPE OF IMPACT
@charlierapple @chemconnector@joellemasciulli @kglibrarian

2
ARCS:
many
parties
Librarians
Impact
Publishers
Research development,
communication, planning,
support, etc.
Funders
Scientists
Scholars
In understanding
impact, do these
parties need different
data in separate silos,
or can the same core
data serve multiple
audiences?

3
LIKELIHOOD THAT WE WILL
MANAGE TO COVER TODAY
Um,
optimisticNo problem!
Key
questions
we’re
asking
What
technical
infrastructure
is required?What
business
cases need
to be
made?
What data
can answer
these
questions?
What
questions do
they have?
Who cares
about
impact?

Antony
Williams
VP Strategic
Development
Royal
Society of
Chemistry
Karen
Gutzman
Impact and
Evaluation
Librarian
Galter Health
Sciences
Library
Northwestern
University
Joelle
Masciulli
Head of
Content
Strategy
Thomson
Reuters
Charlie
Rapple
Co-Founder
Kudos
Today’s
panel
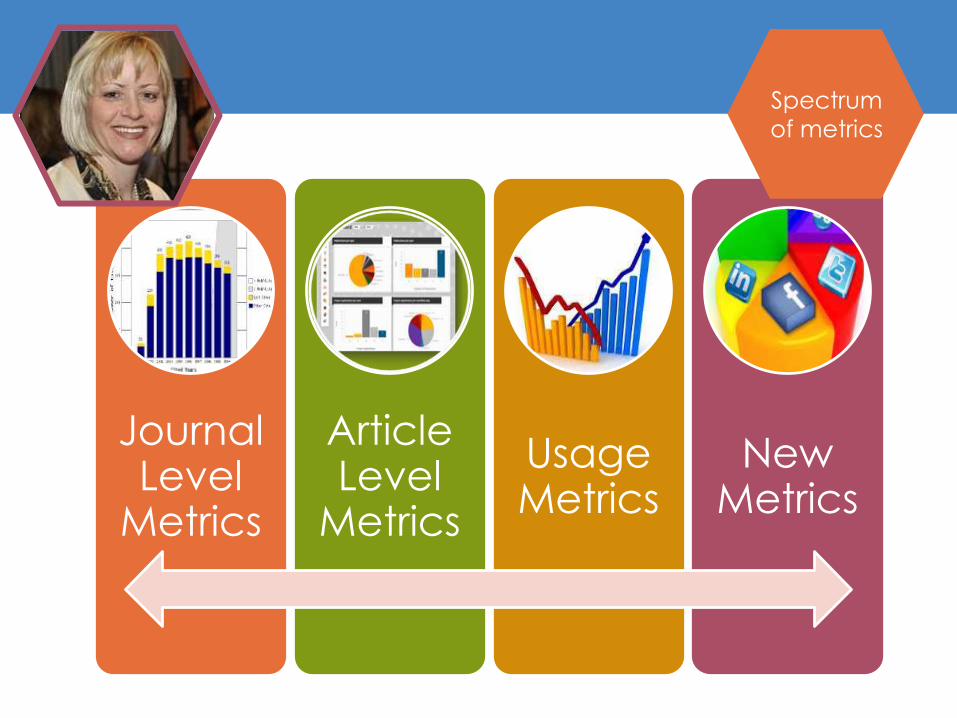
Journal Level
Metrics
Article Level
Metrics
Usage Metrics
New Metrics
Spectrum
of metrics

http://galter.
northwestern.edu/
Request-Services-and-
Materials/metrics-
and-impact-
core-mic
Managing or tracking
publications
Maintaining an impactful
online identity
Measuring or assessing research
impact by discipline
Communicating research impact to audiences
Metrics
and
Impact
Core
Icons made by Freepik from www.flaticon.com
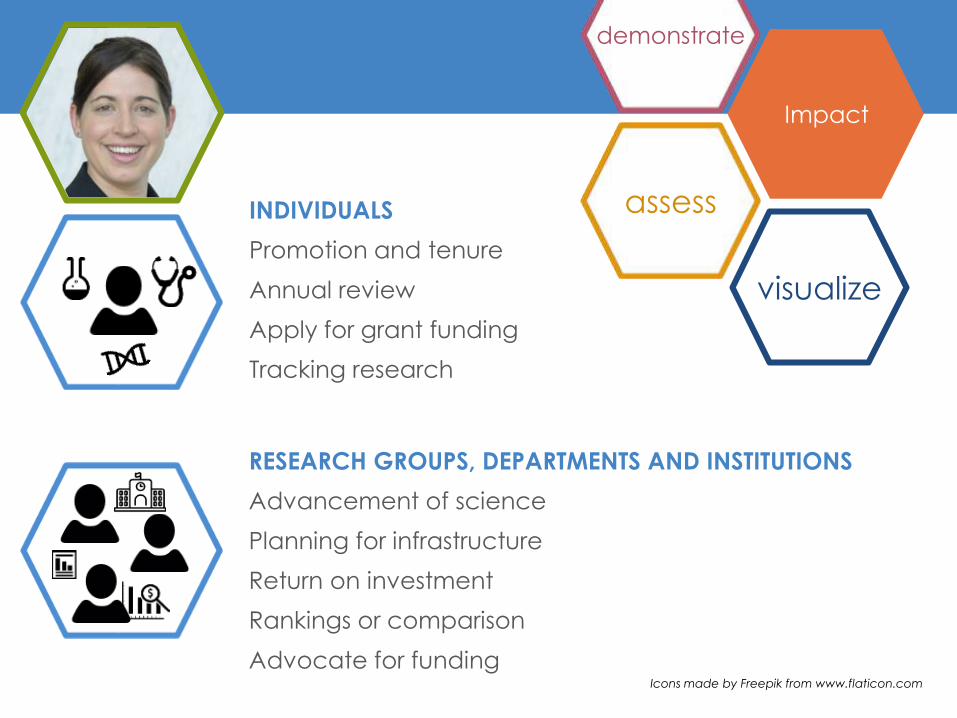
visualize
assess
demonstrate
Impact
INDIVIDUALS
Promotion and tenure
Annual review
Apply for grant funding
Tracking research
RESEARCH GROUPS, DEPARTMENTS AND INSTITUTIONS
Advancement of science
Planning for infrastructure
Return on investment
Rankings or comparison
Advocate for funding

8
SECTION C: CONTRIBUTIONS TO SCIENCE
List 5 most significant contributions to science
Historical background
Central findings
Influence of the findings on the progress of science
Specific role in described work
Reference up to 4 peer-reviewed publications or
other non-publication research products such as:
Audio or video products
Patents
Data and research materials
Databases
Why the change?
Allow researchers to highlight their accomplishments better by
including more objects of scholarly productivity
Give researchers involved in team science an opportunity to
describe their roles in collaborative projects
NIH announcement 12/5/14: http://grants.nih.gov/grants/guide/notice-files/NOT-OD-
15-032.html
Galter Guide by Pamela Shaw:
https://galter.northwestern.edu/
guides-and-tutorials/creating-nih-
biosketches-with-sciencv-and-my-
bibliography
Icons made by Freepik from www.flaticon.com
Example:
NIH
biosketch
Educational curricula
Instruments or equipment models
Protocols
Software, and more

9
Becker Madel:https://becker.wustl.
edu/impact-assessment/model
Icons made by Freepik from www.flaticon.com
STRATEGIESfor enhancing the
impact of research
INFORMATION
RESOURCES
Becker model image by Robert Altman
Becker
Model350+ OUTPUTS
AND INDICATORS
OF IMPACTAdvancement of knowledge
Clinical implementation
Community benefit
Legislation and policy
Economic benefit

USEFUL DATA IS …TransparentAccessible
High in quality
Accurate
Relevant
Understandable…
MANY SOURCES AVAILABLE… Scopus (from Elsevier)
Web of Science (from Thomson Reuters )
Google Scholar
Northwestern Scholars (from Elsevier)
Journal Citation Reports (from Thomson Reuters)Altmetric
and more…
Data
and
sources

11
Interest
in
metrics
data
I am more interested in platforms to
share my work – the data reports on
whether take it
To see who’s talking or linking to my work
The numbers do not represent me as a
better scientist – only a more visible one.

12
Data I
search
for…
Article citations are of
primary interest – not the
count but the papers
referencing me
Social network discussions
about my publications,
presentations and projects

Data
from…M
ANY
PLACES

14
I use
the
data
for…
Seeing who is following/discussing my work
To establish connections and collaborations
To encourage others to use social networks
For me both qualitative or quantitative data represent my efforts to share information

15
My
Greatest
Impact
Is
Missed!!!
ChemSpider
database with
>40,000 unique
users/day looking at
>34 million
chemicals
The only measure is
1 publication, 129
citations

16
Publisher /
Society
Perspective
We want to help generate awareness
for a scientist’s publications – drive traffic
Awareness influences citations (and
journal impact factor)
Education of the chemistry community
in terms of altmetrics, tools and fresh
measures of impact

17
Key
questions
we’re
asking
What
technical
infrastructure
is required?What
business
cases need
to be
made?
What data
can answer
these
questions?
What
questions do
they have?
Who cares
about
impact?

@charlierapple
@joellemasciulli