The Jsf Stovl Performance Process From Small-scale Database to Flight Test Demonstration 2002_6002...
25
THE JSF STOVL PERFORMANCE PROCESS- FROM SMALL-SCALE DATABASE TO FLIGHT TEST DEMONSTRATION Kevin M. McCarthy, JSF Program Office/Naval Air Systems Command This material is declared a work of the US Government and is not subject to copyright protection in the United States. STOPC- short takeoff performance code T- thrust TS- thrust split, core nozzle thrust/ lift fan thrust Abstract T2- temperature at engine face This paper discusses the STOVL performance calculation process that was executed during the Joint Strike Fighter Concept Demonstration Phase. It includes a discussion of the performance methods themselves and the inputs required to run them. The X-32B and X-35B STOVL Concept Demonstrator Aircraft are used as case studies. Lessons learned from the development of their STOVL performance related databases are discussed. The pre-flight test STOVL performance calculations are compared with the flight test demonstrated performance. To the extent possible, the paper provides a comparison between the small- scale and full-scale STOVL database elements, such as hot gas ingestion and propulsion induced aerodynamics. This background, along with the experiences of other predecessor programs, will provide the point-of- departure for STOVL performance estimates during the JSF System Development and Demonstration (SDD) Phase, as well as performance estimates for any future STOVL aircraft development programs. Veq- velocity calculated form dynamic pressure VLPC- vertical landing performance code VTOL- vertical takeoff and landing Z- distance downstream of nozzle exit Z/De- distance downstream divided by the diameter of an equivalent circular nozzle ∆D/T- propulsion induced drag / thrust ∆L/T- propulsion induced lift loss / thrust ∆PM/T- propulsion induced pitching moment / thrust Introduction Jetborne and semi-jetborne analytical performance methods were at the conceptual design level at the start of the DARPA/Navy ASTOVL Common Affordable Lightweight Fighter Program. Traditionally, a substantial amount of excess thrust was maintained to provide for acceptable performance and controllability characteristics. Detailed individual contributors to STOVL performance, and the variation of these contributors with aircraft height and/or attitude were not necessarily quantified. Given the relative lack of experience with STOVL aircraft, as compared with conventional takeoff and carrier-based aircraft, it is not surprising that analytical performance methods were less mature as well. While more detailed STOVL performance methods did exist, they were organic to the contractors designing and/or manufacturing STOVL aircraft. They were tailored towards best representing the specific configuration of interest to that contractor. The highly configuration specific nature of the STOVL flowfield, and therefore the impact of the flowfield on the aircraft performance and control characteristics, limited the appropriateness of any of these methods towards modeling other configurations of interest. Nomenclature ACS- aircraft control system (X-32B) Cp- (Local pressure-ambient pressure)/(exit pressure- ambient pressure) cg- center of gravity D –drag DTCOTA- parameter defining circumferential thermal distortion GW- gross weight HGI- hot gas ingestion IGE- In ground effect ITF- Integrated Test Force L- lift LSPM- large-scale powered model M- pitching moment The JSF technical team developed two STOVL performance methodologies, one to examine vertical mode performance and one to examine short takeoff, short landing and transition mode performance. Both of the methods are capable of representing all STOVL lift system configurations, allowing configurations with up to 10 independent nozzles/effectors to be modeled. The model flexibility of these in-house methodologies was important, as it ensured a consistent level of fidelity in evaluating varying configurations. N1- Compressor Speed, rev/min OGE- out of ground effect PLA- power lever angle P T - total pressure PT/P0- total pressure/ambient pressure Q/Q exit - dynamic pressure/dynamic pressure at jet exit RF MG - reaction force of main gear RF NG - reaction force of nose gear RIT- Rotor inlet temperature, deg F STO- short takeoff Page 1 AIAA-2002-6002 Approved for Public Release 2002 Biennial International Powered Lift Conference and Exhibit 5-7 November 2002, Williamsburg, Virginia AIAA 2002-6002 This material is declared a work of the U.S. Government and is not subject to copyright protection in the United States.
-
Upload
spazsinbad -
Category
Documents
-
view
218 -
download
0
Transcript of The Jsf Stovl Performance Process From Small-scale Database to Flight Test Demonstration 2002_6002...

THE JSF STOVL PERFORMANCE PROCESS- FROM SMALL-SCALE DATABASE TO FLIGHT TEST DEMONSTRATION
Kevin M. McCarthy, JSF Program Office/Naval Air Systems Command
This material is declared a work of the US Government and is not subject to copyright protection in the United States.
STOPC- short takeoff performance code T- thrust TS- thrust split, core nozzle thrust/ lift fan thrust
Abstract T2- temperature at engine face This paper discusses the STOVL performance calculation process that was executed during the Joint Strike Fighter Concept Demonstration Phase. It includes a discussion of the performance methods themselves and the inputs required to run them. The X-32B and X-35B STOVL Concept Demonstrator Aircraft are used as case studies. Lessons learned from the development of their STOVL performance related databases are discussed. The pre-flight test STOVL performance calculations are compared with the flight test demonstrated performance. To the extent possible, the paper provides a comparison between the small-scale and full-scale STOVL database elements, such as hot gas ingestion and propulsion induced aerodynamics. This background, along with the experiences of other predecessor programs, will provide the point-of-departure for STOVL performance estimates during the JSF System Development and Demonstration (SDD) Phase, as well as performance estimates for any future STOVL aircraft development programs.
Veq- velocity calculated form dynamic pressure VLPC- vertical landing performance code VTOL- vertical takeoff and landing Z- distance downstream of nozzle exit Z/De- distance downstream divided by the diameter of an equivalent circular nozzle ∆D/T- propulsion induced drag / thrust ∆L/T- propulsion induced lift loss / thrust ∆PM/T- propulsion induced pitching moment / thrust
Introduction Jetborne and semi-jetborne analytical performance methods were at the conceptual design level at the start of the DARPA/Navy ASTOVL Common Affordable Lightweight Fighter Program. Traditionally, a substantial amount of excess thrust was maintained to provide for acceptable performance and controllability characteristics. Detailed individual contributors to STOVL performance, and the variation of these contributors with aircraft height and/or attitude were not necessarily quantified. Given the relative lack of experience with STOVL aircraft, as compared with conventional takeoff and carrier-based aircraft, it is not surprising that analytical performance methods were less mature as well. While more detailed STOVL performance methods did exist, they were organic to the contractors designing and/or manufacturing STOVL aircraft. They were tailored towards best representing the specific configuration of interest to that contractor. The highly configuration specific nature of the STOVL flowfield, and therefore the impact of the flowfield on the aircraft performance and control characteristics, limited the appropriateness of any of these methods towards modeling other configurations of interest.
Nomenclature
ACS- aircraft control system (X-32B) Cp- (Local pressure-ambient pressure)/(exit pressure-ambient pressure) cg- center of gravity D –drag DTCOTA- parameter defining circumferential thermal distortion GW- gross weight HGI- hot gas ingestion IGE- In ground effect ITF- Integrated Test Force L- lift LSPM- large-scale powered model M- pitching moment The JSF technical team developed two STOVL
performance methodologies, one to examine vertical mode performance and one to examine short takeoff, short landing and transition mode performance. Both of the methods are capable of representing all STOVL lift system configurations, allowing configurations with up to 10 independent nozzles/effectors to be modeled. The model flexibility of these in-house methodologies was important, as it ensured a consistent level of fidelity in evaluating varying configurations.
N1- Compressor Speed, rev/min OGE- out of ground effect PLA- power lever angle PT- total pressure PT/P0- total pressure/ambient pressure Q/Qexit- dynamic pressure/dynamic pressure at jet exit RFMG- reaction force of main gear RFNG- reaction force of nose gear RIT- Rotor inlet temperature, deg F STO- short takeoff
Page 1
AIAA-2002-6002 Approved for Public Release
2002 Biennial International Powered Lift Conference and Exhibit5-7 November 2002, Williamsburg, Virginia
AIAA 2002-6002
This material is declared a work of the U.S. Government and is not subject to copyright protection in the United States.
Phillip
Text Box
http://pdf.aiaa.org/downloads/2002/CDReadyMBIPL02_686/2002_6002.pdf?CFID=3062772&CFTOKEN=60190979&jsessionid=8c3081cc2ed2274d1857TR

Section I: General Discussion JSF personnel aggressively sought opportunities to validate the models during their development, including a survey of legacy STOVL aircraft. The most obvious candidate aircraft was the AV-8B aircraft. To the extent possible, a performance model for the AV-8B was developed; however, the relevant details on database elements were not available. The AV-8B results agreed reasonably well with demonstrated performance; however, the assumptions required to develop the inputs made this exercise more of a calibration than a validation. The numerous other jet lift STOVL predecessor programs were even less rigorously documented than the AV-8B/Harrier family; therefore, they were even less suitable for model validation. The X-32B and X-35B aircraft would represent the first real opportunity for an end-to-end check of the models.
Two methodologies, one for vertical mode performance, and one for flat deck and ski jump short takeoff performance will be summarized. An overview of these methods, and how they fit into other in-house Government analyses, is provided in Reference 1. This reference is from the beginning of CDP, but is consistent with the current implementation. The general discussion section also discusses the database elements that are inputs to the methods. The section concludes with a discussion of facilities and instrumentation that were common for both X-32B and X-35B. Performance Predictive Codes: Both the vertical mode and short takeoff models are physics based, and rely on analytical or test derived database elements. The Government performance methods discussed here were complementary to the contractor methods, which were specific to the configuration being developed. These methods were provided to the contractors for comment and their use as desired, and represented the tools used for Government assessments of STOVL performance and basing suitability. As the DARPA/Navy ASTOVL Common Affordable Lightweight Fighter program was absorbed into the Joint Advanced Strike Technology (JAST) Program and eventually into the JSF Program, the methodologies evolved and matured to meet the evolving need. They represent the primary Government analytical tools to assess jetborne and semi-jetborne performance today, and for the foreseeable future.
To maximize confidence in the small-scale databases that the simulation and performance models were derived from, the JSF Program Office conducted a suite of full-scale tests to establish that the small-scale models properly represented key aspects of the STOVL flowfield. These activities, which will be discussed in detail later, provided the maximum possible assurance in the STOVL database prior to flight test. The JSF Program Director established flight safety as the top priority of the X-32B and X-35B flight test program early on, and maintained that focus until the end of the phase. To support development and safe flight test of the X-32B and X-35B, the JSF program focused substantial resources on a comprehensive small-scale database of propulsion-induced aerodynamic characteristics and hot gas ingestion (HGI) characteristics. The most suitable facilities available internationally and the best-established test techniques were used. Additionally, facilities were enhanced and test techniques and practices were further developed to advance the state-of-the art in STOVL database testing. The extensive airframe contractor small-scale test programs were complemented with Government and Pratt & Whitney full-scale outwash and plume survey testing. The broad scope of both programs was critical to ensure a high confidence STOVL database in support of the flight clearances for the X-32B and X-35B aircraft.
VLPC Overview: The Vertical Landing Performance Code (VLPC) calculates vertical landing, vertical landing waveoff, vertical takeoff and hover performance. It is a three-degree-of-freedom (DOF) code, with the ability to maintain longitudinal trim via multiple user specified nozzle scheduling and/or control schemes. If desired, it will calculate maximum vertical landing performance weight for a specified nominal and maximum rate of descent. Alternately, it will calculate maximum rate of descent or minimum waveoff height for a given vertical landing weight. Figure 1 illustrates key aspects of the code. On the left is a list of the inputs required to run the code. All inputs are tabular format, with linear interpolation and extrapolation employed as required. For maximum confidence results, the database should be broad enough to minimize extrapolation and with sufficient data density in non-linear regions to allow representative interpolation. The specific inputs, and sources for the data will be discussed in greater detail in subsequent sections of the paper.
This paper is organized in three major sections. The Section I is a general discussion, which provides an overview of the performance process and database elements, which are common elements to both the X-32B and the X-35B. Sections II and III provide discussion specific to each individual aircraft.
Page 2
AIAA-2002-6002 Approved for Public Release

InputsConfiguration Geometry &
Center of Gravity
Maneuver Definition
HGI Characteristics
Propulsion Induced Aero
Lift loss PitchingMoment
Control Allowance
Lift System Temperature Lapse
“Installed” Thrust
50 40 30 20 10 0
Extended Gear Height, ft
Thrust or
GW,lbs
(for V LAND/WAVEOFF/VTO)
Initial Static Trim
HGI Temp Rise
HGI Thrust Loss
Longitudinal Trim
Propulsion Induced Lift Loss
Propulsion Induced Moment
Control Allowance
Adjust by Height/Time Step
Initial Height/Time
Output
Figure 1. VLPC Logic
The center of Figure 1 summarizes the calculation scheme. Fundamentally, at each altitude during the maneuver, the code calculates each of the elements of performance, with the aircraft longitudinal trim re-examined at each step. Initially, static trim is calculated, considering the input nozzle locations, thrust levels per nozzle and aircraft center of gravity vs. weight characteristics. The first effect examined is Hot Gas Ingestion (HGI), which is calculated from the table(s) of temperature rise due to HGI, and the lift system thrust lapse with temperature characteristics. The code then re-examines longitudinal trim, as the thrust loss due to HGI may have affected it. Next, the thrust loss and moment change due to propulsion induced aerodynamics are calculated. Again, the aircraft is re-trimmed, to capture the impact of propulsion induced pitching moment. Finally, the thrust loss associated with the control allowance is considered. Once each of these effects has been considered, the result is the maximum net vertical force, which is equal to the maximum performance weight available at that height and rate of descent/climb. The aircraft is moved to the next height, which is calculated based on the rate of descent and the size of the user specified time step. The calculations are repeated at each altitude during the maneuver. If modeling a vertical landing, the code allows for a thrust deficit. It calculates the fall-out increase in rate of descent up to the user specified maximum rate of descent. If excess thrust is present, the throttle is reduced to match the desired rate of descent. The output is illustrated on the right of Figure 1. It is an illustration of the relative contribution of each phenomenon to the vertical mode performance. Starting at the top and working down is the “performance side” of the lift budget. These are the losses associated with trim, HGI, propulsion induced lift loss and control allowance. Starting from the bottom is the “weight side” of the lift budget, which
includes the operating weight and the desired payload. For the example in Figure 1, a vertical landing, the area between the performance build-down and the weight build-up represents performance margin, which is available at all points other than the critical condition in the maneuver. STOPC Overview: The Short Take Off Performance Code (STOPC) is used to calculate shipboard, including both flat deck and ski jump, and land based short takeoff (STO) and short landing performance. It is also used for transition mode performance estimates. The code can be operated as either a two-DOF or three-DOF code. Figure 2 summarizes the features of STOPC. On the left is a list of the inputs required to run the code. All inputs are tabular format, with linear interpolation and extrapolation employed as required. As with VLPC, the database should be assembled to minimize interpolation and extrapolation error.
250 350 450 550 650 750Deck Roll - ft
TOGW - lbs
STO/SKI JUMP
InputsConfiguration Geometry &
Center of Gravity
STO Technique Definition
Propulsion Induced Aero
Lift loss PitchingMoment
Control Scheme
“Power-Off” Aerodynamic Characteristics
“Installed” Thrust
Constraints
LD
T
∆L/T
∆D/T M
∆PM/Tc
RFMG RFNG
Engine/Nozzle thrust is applied at the location of each nozzle centroid
Figure 2. STOPC Logic
STOPC calculates all longitudinal and normal forces, and longitudinal moments acting on the aircraft. The figure in the center of Figure 2 reflects the forces that are considered. STOPC then calculates the resulting aircraft dynamics (longitudinal, vertical and angular accelerations) at that time step. This is similar in concept to VLPC, but more difficult to describe in detail due to the additional complexity of the calculation associated with control positions, nozzle angles and airspeed variation throughout the maneuver. The inputs are similar to VLPC, although much additional scope is required for STO operations. For example, the installed thrust inputs must capture varying nozzle angles for each nozzle, and varying airspeed effects. Additionally, ram drag tables are input in addition to the gross thrust inputs. As with installed thrust, the propulsion induced aerodynamics tables must reflect nozzle angle, aircraft attitude and airspeed effects, as well as the impact of aerodynamic control surface position. Propulsion induced aero tables are provided for in-ground-effect (IGE) (used during deck
Page 3
AIAA-2002-6002 Approved for Public Release

run and at rotation) and out of ground effect (used once clear of the deck edge and during fly-out). HGI is not considered in STO analysis. Power-off aerodynamics tables, both IGE and out-of-ground effect (OGE), are required, again as a function of aircraft attitude and aerodynamic control surface position. If using the three-DOF option, different aircraft rotation and longitudinal moment trim techniques can be examined. Examples include aerodynamic, thrust modulation, thrust vectoring or a combination of these three. The STO technique is specified as an initial position for nozzle angles and aerodynamic control surface positions, as well as a deviation in these parameters as a function of time, distance or airspeed. Constraints on the calculation, such as maximum center of gravity (cg) sink and/or minimum longitudinal acceleration for example, can be specified as well. Fixing any two of: a) takeoff gross weight, b) deck run or c) wind over deck, STOPC can optimize for the third parameter. The STO deck run starts at brake release, which typically occurs at the maximum thrust that the brakes can hold. This is an input. The engine spool-up characteristics from this throttle setting to maximum power are considered during the acceleration portion of the deck run. Weight on main and nose gear is calculated, and must be monitored to maintain adequate deck handling characteristics. The code can represent both flat deck, typical of current generation US Navy ships, as well as any geometry of ski jump. Ski jumps are currently used by the navies of two of the JSF international participants, the UK and Italy. The code can be run with hard gear or with a gear dynamic model. The output is both tabular and graphical time history type values for all parameters. A typical product of STO analysis is the gross weight verses deck run chart, represented by the cartoon on the right side of Figure 2. Database elements: The first input to the STOVL performance process is the traditional installed aircraft thrust. The descriptor “traditional” is used to note that the thrust level considers the traditional installation effects of inlet pressure recovery and nozzle performance, as well as customer bleed and power extraction. It does not include STOVL unique installation effects, which are accounted for separately. The source for the traditional installed performance data is an analytical engine model. These models were calibrated with measured engine stand data, from lift system development testing, as well as acceptance test data for the specific lift system hardware used in flight test. The inlet pressure recovery and nozzle performance data used to derive installation effects
came from a variety of dedicated inlet and nozzle performance testing. Another input derived from the analytical engine deck is the engine temperature lapse characteristic. These data are used to calculate installed thrust loss due to increased inlet temperatures. Throttle transient performance is also used to model spool-up at the initiation of a vertical takeoff, a waveoff or a short takeoff deck run. The next input to the performance methods is the aircraft HGI characteristics. These data reflect temperature rise in the inlet due to re-ingestion of exhaust or exhaust contaminated flows. This phenomenon, primarily a consideration during vertical operations, is highly configuration specific. For a given configuration, it is influenced by aircraft height above the deck, wind speed and direction, aircraft attitude and control inputs. The source of the HGI data is small-scale, dynamic model test data. As indicated by broad, small-scale test experience, corroborated with in service operational experience, HGI is a very unsteady phenomenon. For a fixed configuration, aircraft attitude and wind condition, there can still be significant variation in measured inlet temperature rise levels between multiple landings. As such, during the test, numerous landings for each configuration and wind condition are made. For performance calculations, the mean of all landings is used to define the thrust loss due to HGI. For engine stall margin analysis, which is influenced by thermal distortion level, the peak distortion from all landings tested is used. Propulsion induced aerodynamic characteristics are the next considered parameter. These data characterize the influence of the jets on the aerodynamic characteristics of the configuration. These effects are highly configuration specific. Tables to capture pure hover and the desired headwind/crosswind envelope of interest are used for the vertical landing performance. Additional tables to address characteristics during IGE and OGE transition are used for flat deck and ski jump short takeoff, as well as transition analyses. The source for these data are small-scale test data, with a small-scale to large-scale correction applied. As both performance methods are three-degree of freedom analyses, propulsion induced lift, propulsion induced drag and propulsion induced pitching moment are the inputs used. The small-scale powered model tests that the propulsion induced effects were derived from typically measure rolling and yawing moment data as well, which are used in the six-DOF simulation.
Page 4
AIAA-2002-6002 Approved for Public Release
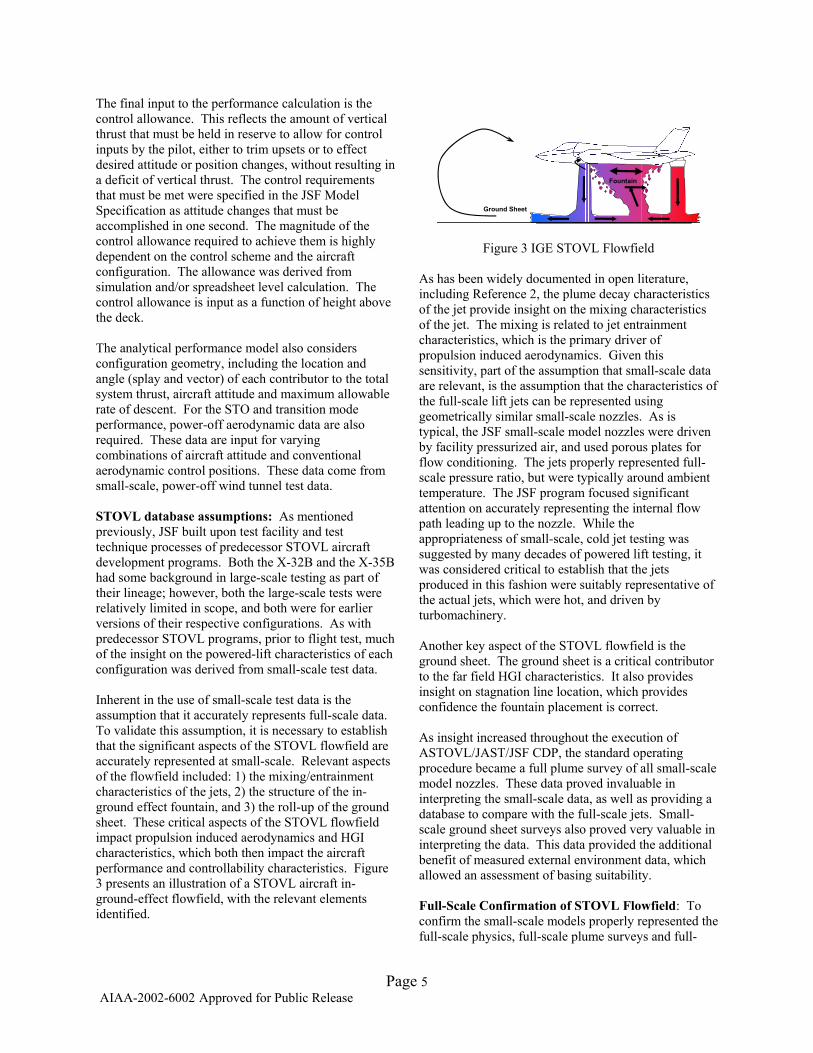
The final input to the performance calculation is the control allowance. This reflects the amount of vertical thrust that must be held in reserve to allow for control inputs by the pilot, either to trim upsets or to effect desired attitude or position changes, without resulting in a deficit of vertical thrust. The control requirements that must be met were specified in the JSF Model Specification as attitude changes that must be accomplished in one second. The magnitude of the control allowance required to achieve them is highly dependent on the control scheme and the aircraft configuration. The allowance was derived from simulation and/or spreadsheet level calculation. The control allowance is input as a function of height above the deck.
Ground Sheet
Fountain
Figure 3 IGE STOVL Flowfield
As has been widely documented in open literature, including Reference 2, the plume decay characteristics of the jet provide insight on the mixing characteristics of the jet. The mixing is related to jet entrainment characteristics, which is the primary driver of propulsion induced aerodynamics. Given this sensitivity, part of the assumption that small-scale data are relevant, is the assumption that the characteristics of the full-scale lift jets can be represented using geometrically similar small-scale nozzles. As is typical, the JSF small-scale model nozzles were driven by facility pressurized air, and used porous plates for flow conditioning. The jets properly represented full-scale pressure ratio, but were typically around ambient temperature. The JSF program focused significant attention on accurately representing the internal flow path leading up to the nozzle. While the appropriateness of small-scale, cold jet testing was suggested by many decades of powered lift testing, it was considered critical to establish that the jets produced in this fashion were suitably representative of the actual jets, which were hot, and driven by turbomachinery.
The analytical performance model also considers configuration geometry, including the location and angle (splay and vector) of each contributor to the total system thrust, aircraft attitude and maximum allowable rate of descent. For the STO and transition mode performance, power-off aerodynamic data are also required. These data are input for varying combinations of aircraft attitude and conventional aerodynamic control positions. These data come from small-scale, power-off wind tunnel test data. STOVL database assumptions: As mentioned previously, JSF built upon test facility and test technique processes of predecessor STOVL aircraft development programs. Both the X-32B and the X-35B had some background in large-scale testing as part of their lineage; however, both the large-scale tests were relatively limited in scope, and both were for earlier versions of their respective configurations. As with predecessor STOVL programs, prior to flight test, much of the insight on the powered-lift characteristics of each configuration was derived from small-scale test data.
Another key aspect of the STOVL flowfield is the ground sheet. The ground sheet is a critical contributor to the far field HGI characteristics. It also provides insight on stagnation line location, which provides confidence the fountain placement is correct.
Inherent in the use of small-scale test data is the assumption that it accurately represents full-scale data. To validate this assumption, it is necessary to establish that the significant aspects of the STOVL flowfield are accurately represented at small-scale. Relevant aspects of the flowfield included: 1) the mixing/entrainment characteristics of the jets, 2) the structure of the in-ground effect fountain, and 3) the roll-up of the ground sheet. These critical aspects of the STOVL flowfield impact propulsion induced aerodynamics and HGI characteristics, which both then impact the aircraft performance and controllability characteristics. Figure 3 presents an illustration of a STOVL aircraft in-ground-effect flowfield, with the relevant elements identified.
As insight increased throughout the execution of ASTOVL/JAST/JSF CDP, the standard operating procedure became a full plume survey of all small-scale model nozzles. These data proved invaluable in interpreting the small-scale data, as well as providing a database to compare with the full-scale jets. Small-scale ground sheet surveys also proved very valuable in interpreting the data. This data provided the additional benefit of measured external environment data, which allowed an assessment of basing suitability. Full-Scale Confirmation of STOVL Flowfield: To confirm the small-scale models properly represented the full-scale physics, full-scale plume surveys and full-
Page 5
AIAA-2002-6002 Approved for Public Release
scale outwash surveys were conducted for both the X-32B and X-35B lift systems. Confirming similarity in plume characteristics between the small-scale and actual jets gives confidence that the jet mixing characteristics and the pressure distribution across the jet is adequately represented. These characteristics are critical to the both OGE propulsion induced lift loss and proper orientation of the fountain when entering ground effect. Confirming the full-scale ground sheet is similar to small-scale completes the picture by providing confidence in far field phenomena. The results of the plume surveys and outwash surveys will be summarized in the X-32B and X-35B specific sections.
Methodology Summary: JSF Program management understood the risks associated with STOVL development flight test. To take every step to reduce them, a comprehensive full-scale test program was undertaken to validate the small-scale test data that were used in the simulation and performance estimates. This was accomplished through the use of full-scale surveys of the jet plumes and the ground sheet, and comparison of these items with the small-scale model characteristics. Despite these efforts, the key to a safe flight test program is the structure of the test program itself. The JSF flight test programs progressed from areas of the airspeed envelope that had relatively large performance and control margins into areas with reduced margins. The databases previously discussed, which fed the performance codes as well as the six-degree of freedom simulation, were critical assets for characterizing regions of concern. The technical community, led by the flight test team, established a broad set of continuation criteria that were continuously monitored during the conduct of the test program. A discussion of the techniques employed during the X-32B flight test program is contained in Reference 3. Reference 4 highlights the X-35B flight test program. While the specific execution of the X-32B and X-35B test programs differed, the philosophy employed was consistent. Instrumentation/Facilities Overview: This discussion relates to specialized facilities and instrumentation developed for both X-32B and X-35B. The site chosen for the full-scale testing was the “C” outdoor test area at Pratt & Whitney, West Palm Beach, Florida. Two functionally similar test stands were used, one for the X-32B lift system testing and one for the X-35B lift system testing. The test stands, in which the uninstalled propulsion system was mounted approximately 22 ft above the ground, were already key assets being used for the engine and lift system
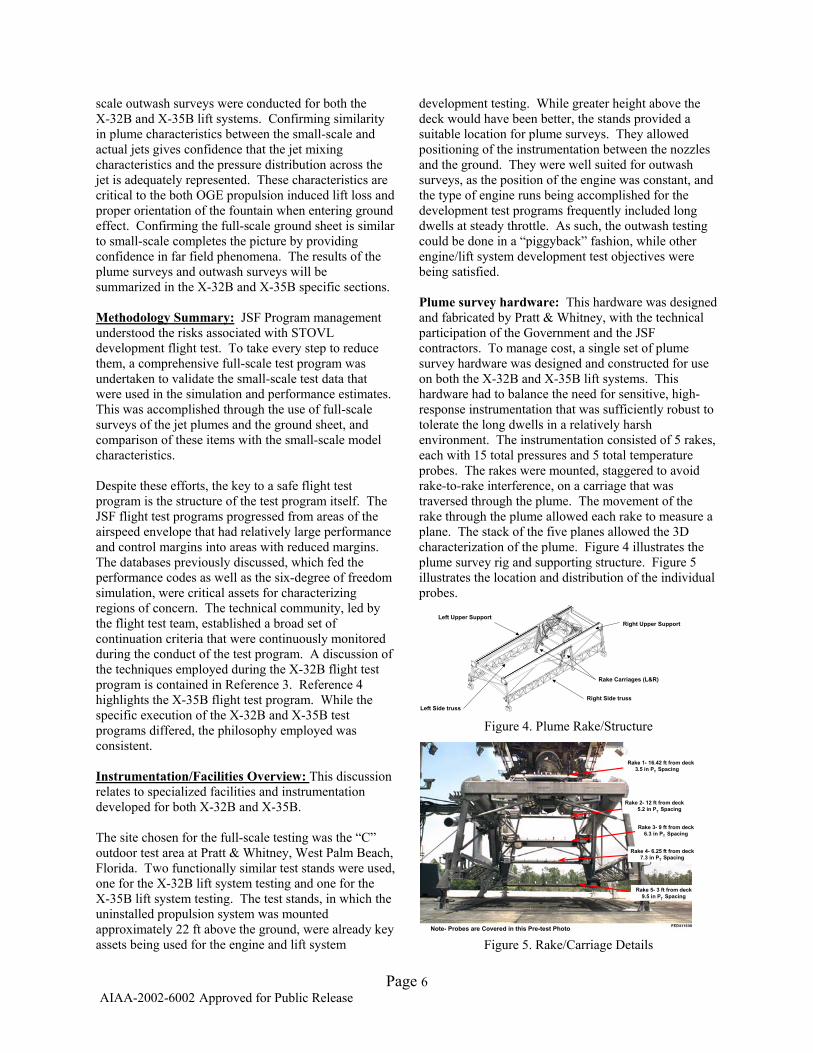
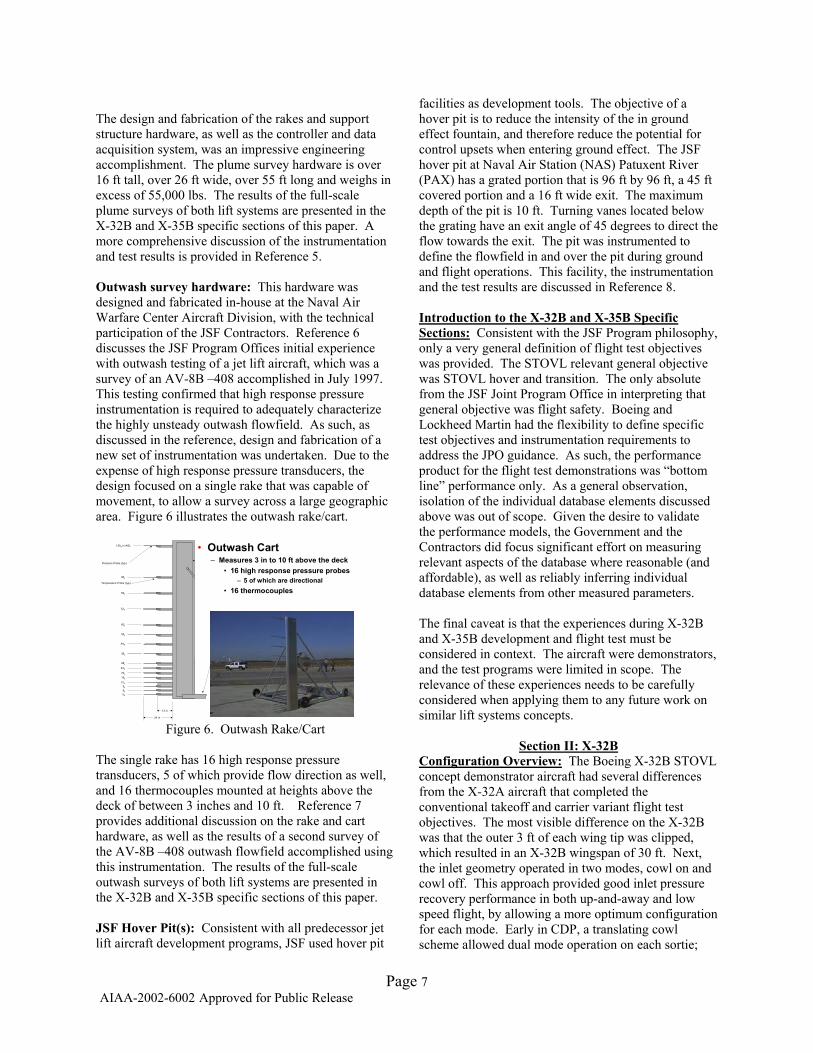
development testing. While greater height above the deck would have been better, the stands provided a suitable location for plume surveys. They allowed positioning of the instrumentation between the nozzles and the ground. They were well suited for outwash surveys, as the position of the engine was constant, and the type of engine runs being accomplished for the development test programs frequently included long dwells at steady throttle. As such, the outwash testing could be done in a “piggyback” fashion, while other engine/lift system development test objectives were being satisfied. Plume survey hardware: This hardware was designed and fabricated by Pratt & Whitney, with the technical participation of the Government and the JSF contractors. To manage cost, a single set of plume survey hardware was designed and constructed for use on both the X-32B and X-35B lift systems. This hardware had to balance the need for sensitive, high-response instrumentation that was sufficiently robust to tolerate the long dwells in a relatively harsh environment. The instrumentation consisted of 5 rakes, each with 15 total pressures and 5 total temperature probes. The rakes were mounted, staggered to avoid rake-to-rake interference, on a carriage that was traversed through the plume. The movement of the rake through the plume allowed each rake to measure a plane. The stack of the five planes allowed the 3D characterization of the plume. Figure 4 illustrates the plume survey rig and supporting structure. Figure 5 illustrates the location and distribution of the individual probes.
Right Side trussLeft Side truss
Left Upper SupportRight Upper Support
Rake Carriages (L&R)
Figure 4. Plume Rake/Structure
Note- Probes are Covered in this Pre-test Photo
Rake 1- 16.42 ft from deck3.5 in PT Spacing
Rake 2- 12 ft from deck 5.2 in PT Spacing
Rake 3- 9 ft from deck6.3 in PT Spacing
Rake 4- 6.25 ft from deck7.3 in PT Spacing
Rake 5- 3 ft from deck9.5 in PT Spacing
Figure 5. Rake/Carriage Details
Page 6
AIAA-2002-6002 Approved for Public Release
The design and fabrication of the rakes and support structure hardware, as well as the controller and data acquisition system, was an impressive engineering accomplishment. The plume survey hardware is over 16 ft tall, over 26 ft wide, over 55 ft long and weighs in excess of 55,000 lbs. The results of the full-scale plume surveys of both lift systems are presented in the X-32B and X-35B specific sections of this paper. A more comprehensive discussion of the instrumentation and test results is provided in Reference 5. Outwash survey hardware: This hardware was designed and fabricated in-house at the Naval Air Warfare Center Aircraft Division, with the technical participation of the JSF Contractors. Reference 6 discusses the JSF Program Offices initial experience with outwash testing of a jet lift aircraft, which was a survey of an AV-8B –408 accomplished in July 1997. This testing confirmed that high response pressure instrumentation is required to adequately characterize the highly unsteady outwash flowfield. As such, as discussed in the reference, design and fabrication of a new set of instrumentation was undertaken. Due to the expense of high response pressure transducers, the design focused on a single rake that was capable of movement, to allow a survey across a large geographic area. Figure 6 illustrates the outwash rake/cart.
28p
36p
445t
52p
60p
725t
84p
96p
1205t in-AGL
20p
125t
6p
16p
9p
35t
245t
Pressure Probe (typ.)
Temperature Probe (typ.)
Support Structures
Rake Body
Transducer Cover
12 in
24 in
Outwash Cart– Measures 3 in to 10 ft above the deck
• 16 high response pressure probes– 5 of which are directional
• 16 thermocouples
•
Figure 6. Outwash Rake/Cart The single rake has 16 high response pressure transducers, 5 of which provide flow direction as well, and 16 thermocouples mounted at heights above the deck of between 3 inches and 10 ft. Reference 7 provides additional discussion on the rake and cart hardware, as well as the results of a second survey of the AV-8B –408 outwash flowfield accomplished using this instrumentation. The results of the full-scale outwash surveys of both lift systems are presented in the X-32B and X-35B specific sections of this paper. JSF Hover Pit(s): Consistent with all predecessor jet lift aircraft development programs, JSF used hover pit
facilities as development tools. The objective of a hover pit is to reduce the intensity of the in ground effect fountain, and therefore reduce the potential for control upsets when entering ground effect. The JSF hover pit at Naval Air Station (NAS) Patuxent River (PAX) has a grated portion that is 96 ft by 96 ft, a 45 ft covered portion and a 16 ft wide exit. The maximum depth of the pit is 10 ft. Turning vanes located below the grating have an exit angle of 45 degrees to direct the flow towards the exit. The pit was instrumented to define the flowfield in and over the pit during ground and flight operations. This facility, the instrumentation and the test results are discussed in Reference 8.
Introduction to the X-32B and X-35B Specific Sections: Consistent with the JSF Program philosophy, only a very general definition of flight test objectives was provided. The STOVL relevant general objective was STOVL hover and transition. The only absolute from the JSF Joint Program Office in interpreting that general objective was flight safety. Boeing and Lockheed Martin had the flexibility to define specific test objectives and instrumentation requirements to address the JPO guidance. As such, the performance product for the flight test demonstrations was “bottom line” performance only. As a general observation, isolation of the individual database elements discussed above was out of scope. Given the desire to validate the performance models, the Government and the Contractors did focus significant effort on measuring relevant aspects of the database where reasonable (and affordable), as well as reliably inferring individual database elements from other measured parameters. The final caveat is that the experiences during X-32B and X-35B development and flight test must be considered in context. The aircraft were demonstrators, and the test programs were limited in scope. The relevance of these experiences needs to be carefully considered when applying them to any future work on similar lift systems concepts.
Section II: X-32B
Page 7
AIAA-2002-6002 Approved for Public Release
Configuration Overview: The Boeing X-32B STOVL concept demonstrator aircraft had several differences from the X-32A aircraft that completed the conventional takeoff and carrier variant flight test objectives. The most visible difference on the X-32B was that the outer 3 ft of each wing tip was clipped, which resulted in an X-32B wingspan of 30 ft. Next, the inlet geometry operated in two modes, cowl on and cowl off. This approach provided good inlet pressure recovery performance in both up-and-away and low speed flight, by allowing a more optimum configuration for each mode. Early in CDP, a translating cowl scheme allowed dual mode operation on each sortie;

however, at the time of X-32B flight test, the cowl was simply removed for hover and low speed STOVL mode flights. The X-32B was capable of being operated in STOVL mode with the “up-and-away” inlet configuration, but at reduced throttle settings. The last and most significant difference was incorporation of the direct lift system. An illustration of the lift system and its relationship to the aircraft is presented in Figure 7.
The jetscreen managed HGI by controlling the forward penetration of the high temperature, high-pressure lift nozzle ground sheet directly in front of the aircraft. This helped reduce far field HGI. Additionally, the jetscreen minimized forward movement of the fountain during IGE operations, which resulted in reduced near field HGI. As such, the jetscreen system managed hot flow in the vicinity of the engine inlet across the aircraft height envelope.
LiftNozzles
Vertical Lift and Pitch Control
Jet Screens
RollNozzles
Pitch/YawNozzles
Fwd PitchNozzles
Yaw Nozzles(flow left or right)
Yaw Control Roll Control
Roll Nozzles(flow up or down)
Figure 7. X-32B Lift System/ACS
Inevitably, the aircraft configuration evolves as the design matures during the configuration definition process. As small-scale testing typically occurs early in the program, configuration differences between the model and full-scale aircraft must be considered when comparing the data. In the case if the X-32B, the STOVL relevant configuration changes were:
1) addition of a cascade in the lateral jetscreen exit,
2) removal of the translating cowl from the main inlet when configured for hover/low speed STOVL flight
3) addition of the forward pitch nozzles to the ACS.
The outer mold line of the X-32B, as well as the lift nozzle geometry, remained very consistent throughout CDP.
The X-32B direct lift system featured two main lift nozzles located near the aircraft center of gravity (cg), which provided about 80% of the total vertical thrust. Control in jetborne mode was provided by an attitude control system (ACS), with nozzles distributed around the aircraft as illustrated in Figure 7. The X-32B lift system either operated in STOVL mode, with flow out the lift nozzles and ACS system, or in CTOL mode with flow out the cruise nozzle. The flow switch between the two modes was accomplished in either 1 second or 3 seconds, depending on the maneuver that was being conducted. The 1 second flow switch was used for performance critical maneuvers, such as STOs. The 3 second switch was used for in flight transitions.
The weight critical nature of a direct lift system with a fixed lift system thrust resulted in considerable attention to aircraft weight and cg during the X-32B configuration evolution process. To minimize weight growth, Boeing removed unnecessary functionality from the aircraft as required to offset weight increases in critical systems. X-32B STOVL Database: An extensive database was assembled to support safe conduct of the X-32B flight test program. This included about 3,700 hours of up-and-away wind tunnel testing (both X-32A/C and X-32B variants). Of particular interest to the STOVL test program, is over 2,300 hours of propulsion induced aerodynamic and HGI testing.
Given some of the X-32B configuration features, such as a low mounted inlet, the configuration has an inherent tendency to have relatively high levels of HGI. Boeing was aware of this, and focused significant resources on quantifying and managing HGI. The two-part jetscreen system, located forward of the lift nozzles, is the primary HGI control device. It is comprised of two components, an axial screen and a lateral screen, oriented in a “T” shape. The jetscreen was also a key component of the ACS, providing aircraft pitch control in conjunction with the aft pitch nozzles. The jetscreen system used fan bypass flow, and flowed continuously when in STOVL thrust mode. The mass flow of the lateral jetscreen was modulated to meet aircraft pitch trim requirements. The other ACS nozzles flowed only when required for attitude control.
Page 8
AIAA-2002-6002 Approved for Public Release
There are two parameters of interest regarding HGI. The first parameter is the mean temperature rise across the engine face, which is an input to the performance methods. For each individual dynamic landing tested, over a small time step, the average temperature rise at the engine face is calculated from 40-45 high response thermocouples evenly distributed across the engine face. This face average temperature rise is applied at the average aircraft height above the deck during the time step. Multiple landings are accomplished, and the mean of the multiple landings at each height above the
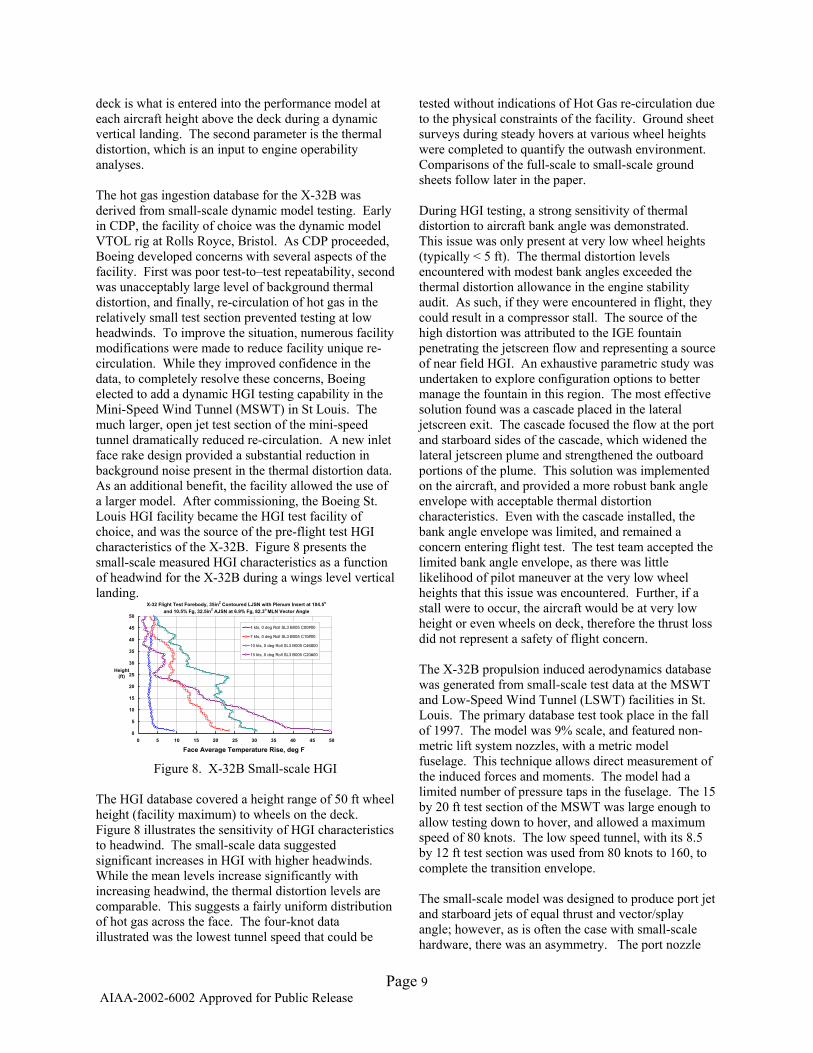
deck is what is entered into the performance model at each aircraft height above the deck during a dynamic vertical landing. The second parameter is the thermal distortion, which is an input to engine operability analyses. The hot gas ingestion database for the X-32B was derived from small-scale dynamic model testing. Early in CDP, the facility of choice was the dynamic model VTOL rig at Rolls Royce, Bristol. As CDP proceeded, Boeing developed concerns with several aspects of the facility. First was poor test-to–test repeatability, second was unacceptably large level of background thermal distortion, and finally, re-circulation of hot gas in the relatively small test section prevented testing at low headwinds. To improve the situation, numerous facility modifications were made to reduce facility unique re-circulation. While they improved confidence in the data, to completely resolve these concerns, Boeing elected to add a dynamic HGI testing capability in the Mini-Speed Wind Tunnel (MSWT) in St Louis. The much larger, open jet test section of the mini-speed tunnel dramatically reduced re-circulation. A new inlet face rake design provided a substantial reduction in background noise present in the thermal distortion data. As an additional benefit, the facility allowed the use of a larger model. After commissioning, the Boeing St. Louis HGI facility became the HGI test facility of choice, and was the source of the pre-flight test HGI characteristics of the X-32B. Figure 8 presents the small-scale measured HGI characteristics as a function of headwind for the X-32B during a wings level vertical landing.
X-32 Flight Test Forebody, 35in2 Contoured LJSN with Plenum Insert at 104.5o
and 10.5% Fg, 32.5in2 AJSN at 6.9% Fg, 82.3o MLN Vector Angle
0
5
10
15
20
25
30
35
40
45
50
0 5 10 15 20 25 30 35 40 45 50TTHGI (oF)
Height(ft)
4 kts, 0 deg Roll SL3 B005 C00#00
7 kts, 0 deg Roll SL3 B005 C10#00
10 kts, 0 deg Roll SL3 B005 C46#00
15 kts, 0 deg Roll SL3 B005 C20#00
Face Average Temperature Rise, deg F Figure 8. X-32B Small-scale HGI
The HGI database covered a height range of 50 ft wheel height (facility maximum) to wheels on the deck. Figure 8 illustrates the sensitivity of HGI characteristics to headwind. The small-scale data suggested significant increases in HGI with higher headwinds. While the mean levels increase significantly with increasing headwind, the thermal distortion levels are comparable. This suggests a fairly uniform distribution of hot gas across the face. The four-knot data illustrated was the lowest tunnel speed that could be
tested without indications of Hot Gas re-circulation due to the physical constraints of the facility. Ground sheet surveys during steady hovers at various wheel heights were completed to quantify the outwash environment. Comparisons of the full-scale to small-scale ground sheets follow later in the paper. During HGI testing, a strong sensitivity of thermal distortion to aircraft bank angle was demonstrated. This issue was only present at very low wheel heights (typically < 5 ft). The thermal distortion levels encountered with modest bank angles exceeded the thermal distortion allowance in the engine stability audit. As such, if they were encountered in flight, they could result in a compressor stall. The source of the high distortion was attributed to the IGE fountain penetrating the jetscreen flow and representing a source of near field HGI. An exhaustive parametric study was undertaken to explore configuration options to better manage the fountain in this region. The most effective solution found was a cascade placed in the lateral jetscreen exit. The cascade focused the flow at the port and starboard sides of the cascade, which widened the lateral jetscreen plume and strengthened the outboard portions of the plume. This solution was implemented on the aircraft, and provided a more robust bank angle envelope with acceptable thermal distortion characteristics. Even with the cascade installed, the bank angle envelope was limited, and remained a concern entering flight test. The test team accepted the limited bank angle envelope, as there was little likelihood of pilot maneuver at the very low wheel heights that this issue was encountered. Further, if a stall were to occur, the aircraft would be at very low height or even wheels on deck, therefore the thrust loss did not represent a safety of flight concern. The X-32B propulsion induced aerodynamics database was generated from small-scale test data at the MSWT and Low-Speed Wind Tunnel (LSWT) facilities in St. Louis. The primary database test took place in the fall of 1997. The model was 9% scale, and featured non-metric lift system nozzles, with a metric model fuselage. This technique allows direct measurement of the induced forces and moments. The model had a limited number of pressure taps in the fuselage. The 15 by 20 ft test section of the MSWT was large enough to allow testing down to hover, and allowed a maximum speed of 80 knots. The low speed tunnel, with its 8.5 by 12 ft test section was used from 80 knots to 160, to complete the transition envelope.
Page 9
AIAA-2002-6002 Approved for Public Release
The small-scale model was designed to produce port jet and starboard jets of equal thrust and vector/splay angle; however, as is often the case with small-scale hardware, there was an asymmetry. The port nozzle

was stronger than the starboard nozzle; therefore a 1° roll angle was required for rolling moment trim in hover. Paint flow visualization in the model lift nozzles illustrated that asymmetric separation around the port and starboard nozzle turns resulted in the asymmetric thrust. Late in the test, the source for the asymmetry was traced to the hole pattern in the porous plate. The porous plate was located in the plenum, just upstream of final 90-degree turn to the nozzle exits. It appears that the hole pattern resulted in a non-uniform velocity distribution into the nozzles, which caused the asymmetric separation around the nozzle turns. When a circular pattern porous plate, of equal porosity was used, the asymmetry was significantly reduced.
Figure 10 is for an IGE hover (1 ft wheel height) with the wings level. This is not an operationally relevant hover height, but the resulting groundsheet illustrates the major characteristics of the X-32B IGE flowfield. The interaction between the jetscreen flow and the lift nozzle flow is evident in the stagnation lines at approximately ± 45 degrees off the aircraft nose. This illustrates the effectiveness of the jetscreen in managing the forward penetration of the lift nozzle flow with the wings level in ground effect. A similar characteristic is evident in the aft quadrants, as a result of the interaction between the aft pitch nozzle of the ACS and the lift nozzle flow. Similar testing was accomplished at varying aircraft hover heights as well. The overall ground sheet structure did not change significantly in the forward quadrants. In the aft quadrants, the pitch nozzle did not penetrate the lift nozzle ground sheet at higher aircraft wheel heights; therefore the aft stagnation lines evident in Figure 10 are not present at higher heights. These small-scale outwash data were used for comparisons with full-scale data when it became available.
Figure 9 presents representative hover propulsion induced lift loss and pitching moment data for the baseline X-32B configuration in a zero knot headwind.
X-32 Induced Lift Characteristics
0
5
10
15
20
25
30
35
40
45
-0.07 -0.06 -0.05 -0.04 -0.03 -0.02 -0.01 0
Delta Lift / Thrust
MLG
Hei
ght (
ft)
Run 256 - Baseline
X-32 Induced Pitching Moment Characteristics
0
5
10
15
20
25
30
35
40
45
0.00 0.02 0.04 0.06 0.08 0.10 0.12 0.14 0.16 0.18 0.20
Delta Pitching Moment / (Thrust * De)
MLG
Hei
ght (
ft)
Run 256 - Baseline
Full-scale outwash surveys of the X-32B lift system were completed on an un-installed X-32B lift system, development test asset FX652, mounted on the C-14 test stand at Pratt & Whitney in West Palm Beach, Florida. The objectives of this test were twofold; 1) to confirm coarse flowfield characteristics were properly represented by the small-scale model, and 2) to provide increased confidence aircraft outwash data for basing suitability assessments. Figure 11 is a photograph illustrating the rake/cart installation at the C area.
Figure 9. X-32B Propulsion Induced Aero These data show the increase in lift loss anticipated as the aircraft enters ground effect. This type of data is input to the performance model for numerous wind conditions to calculate anticipated hover and vertical landing performance in the X-32B operational wind envelope. Much additional propulsion induced aerodynamics data is input as a function of nozzle angle, aircraft attitude, airspeed and height (IGE or OGE) to support STO and transition mode performance estimates.
Given the awareness of the importance of the STOVL flowfield on the propulsion induced aerodynamics and HGI characteristics, flow visualization and ground sheet surveys were conducted as part of both tests. An illustration of the outwash footprint from the small-scale powered model presented in Figure 10. Figure 11. Outwash Cart near C-14 Stand
Hmlg = 1’ Alpha = 7.5°Lift Nozzles = 77°L.E. Flaps = 20°T.E. Flaps = 30°LIDs = 11”
Vmax (kt)
VmaxV=0
10
17
24
31
38
45
52
59
66
73
8045°
FlowVis
60’50’ 70’Radius
The lift system is visible in the upper left corner. The engine centerline was about 22 ft above the deck, which placed the lift nozzle exit just over 19 feet high. The testing was accomplished as “piggyback” to other development test objectives. The instrumentation used was the outwash cart/rake discussed earlier in the paper. The Government outwash test team conducted the test, with the assistance of the Pratt & Whitney test team and Boeing technical specialists. The surveys were
Page 10
AIAA-2002-6002 Approved for Public Release
Figure 10. X-32B IGE Outwash Flowfield
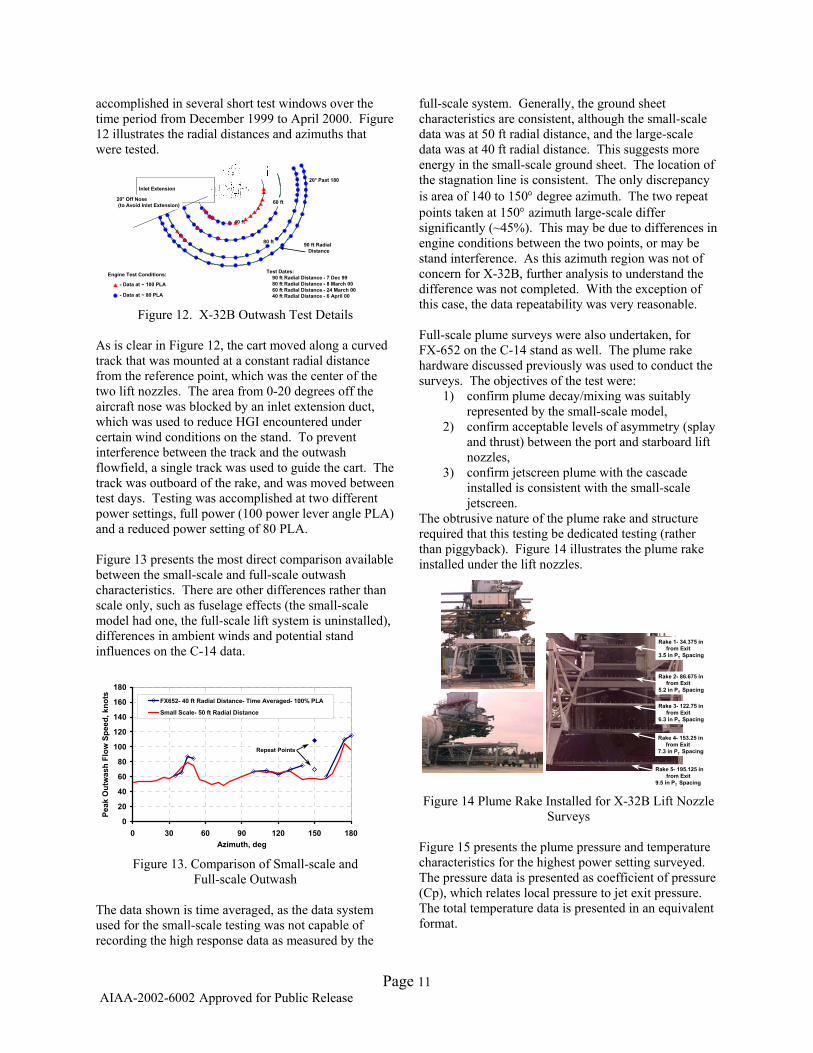
accomplished in several short test windows over the time period from December 1999 to April 2000. Figure 12 illustrates the radial distances and azimuths that were tested.
Test Dates:90 ft Radial Distance - 7 Dec 9980 ft Radial Distance - 8 March 0060 ft Radial Distance - 24 March 0040 ft Radial Distance - 6 April 00- Data at ~ 80 PLA
- Data at ~ 100 PLA
Engine Test Conditions:
Inlet Extension
90 ft RadialDistance
20° Past 180
20° Off Nose(to Avoid Inlet Extension)
80 ft
60 ft
40 ft
Figure 12. X-32B Outwash Test Details
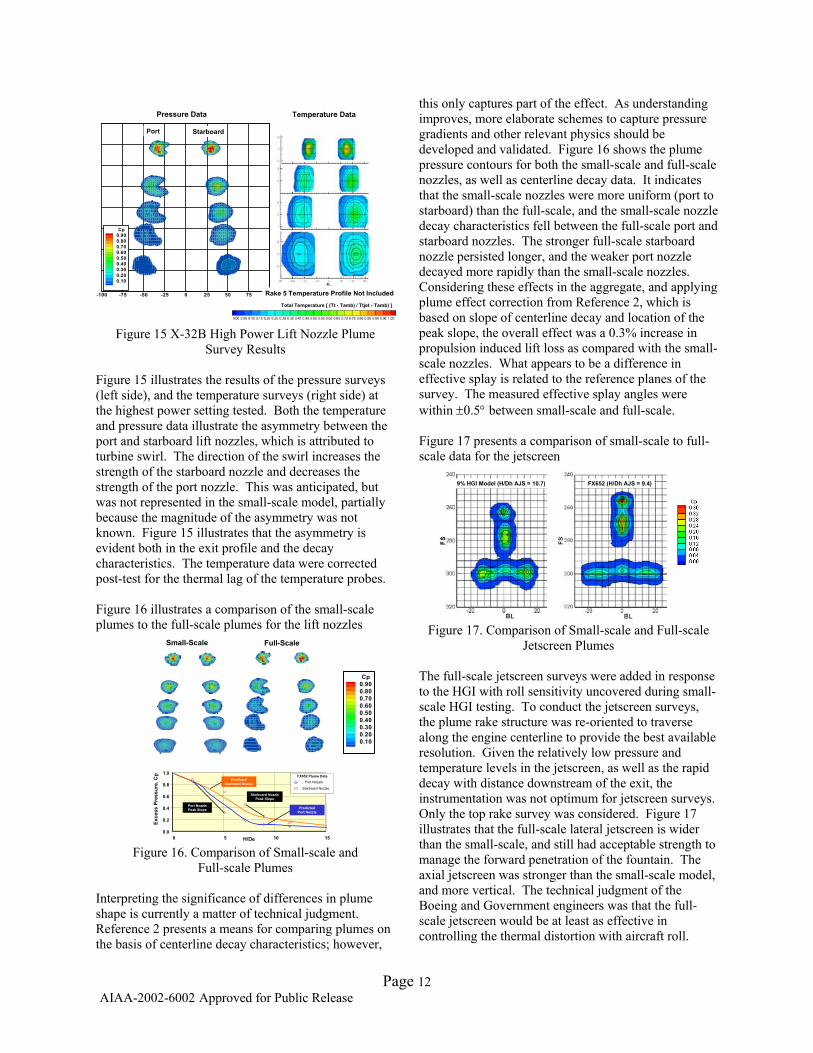
As is clear in Figure 12, the cart moved along a curved track that was mounted at a constant radial distance from the reference point, which was the center of the two lift nozzles. The area from 0-20 degrees off the aircraft nose was blocked by an inlet extension duct, which was used to reduce HGI encountered under certain wind conditions on the stand. To prevent interference between the track and the outwash flowfield, a single track was used to guide the cart. The track was outboard of the rake, and was moved between test days. Testing was accomplished at two different power settings, full power (100 power lever angle PLA) and a reduced power setting of 80 PLA. Figure 13 presents the most direct comparison available between the small-scale and full-scale outwash characteristics. There are other differences rather than scale only, such as fuselage effects (the small-scale model had one, the full-scale lift system is uninstalled), differences in ambient winds and potential stand influences on the C-14 data.
0
20
40
60
80
100
120
140
160
180
0 30 60 90 120 150 180Azimuth, deg
Peak
Out
was
h Fl
ow S
peed
, kno
ts FX652- 40 ft Radial Distance- Time Averaged- 100% PLA
Small Scale- 50 ft Radial Distance
Repeat Points
Figure 13. Comparison of Small-scale and
Full-scale Outwash
The data shown is time averaged, as the data system used for the small-scale testing was not capable of recording the high response data as measured by the
full-scale system. Generally, the ground sheet characteristics are consistent, although the small-scale data was at 50 ft radial distance, and the large-scale data was at 40 ft radial distance. This suggests more energy in the small-scale ground sheet. The location of the stagnation line is consistent. The only discrepancy is area of 140 to 150° degree azimuth. The two repeat points taken at 150° azimuth large-scale differ significantly (~45%). This may be due to differences in engine conditions between the two points, or may be stand interference. As this azimuth region was not of concern for X-32B, further analysis to understand the difference was not completed. With the exception of this case, the data repeatability was very reasonable. Full-scale plume surveys were also undertaken, for FX-652 on the C-14 stand as well. The plume rake hardware discussed previously was used to conduct the surveys. The objectives of the test were:
1) confirm plume decay/mixing was suitably represented by the small-scale model,
2) confirm acceptable levels of asymmetry (splay and thrust) between the port and starboard lift nozzles,
3) confirm jetscreen plume with the cascade installed is consistent with the small-scale jetscreen.
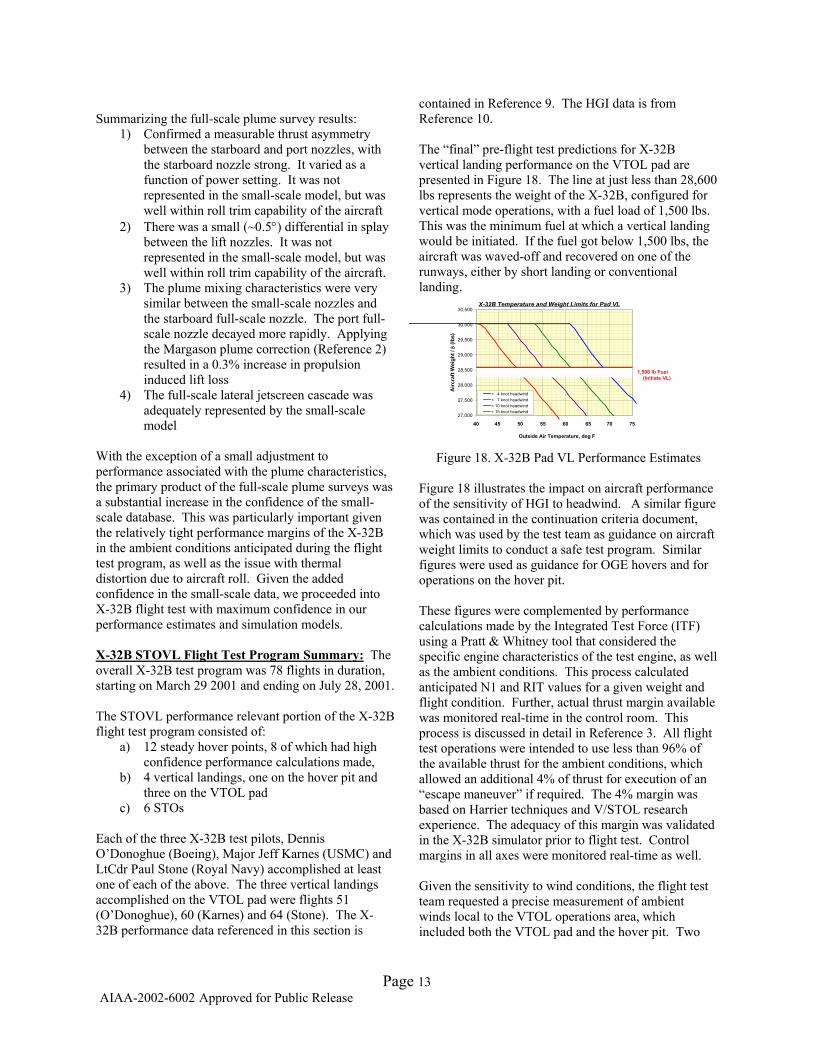
The obtrusive nature of the plume rake and structure required that this testing be dedicated testing (rather than piggyback). Figure 14 illustrates the plume rake installed under the lift nozzles.
Rake 1- 34.375 infrom Exit
3.5 in PT Spacing
Rake 2- 86.675 infrom Exit
5.2 in PT Spacing
Rake 3- 122.75 infrom Exit
6.3 in PT Spacing
Rake 4- 153.25 infrom Exit
7.3 in PT Spacing
Rake 5- 195.125 infrom Exit
9.5 in PT Spacing Figure 14 Plume Rake Installed for X-32B Lift Nozzle
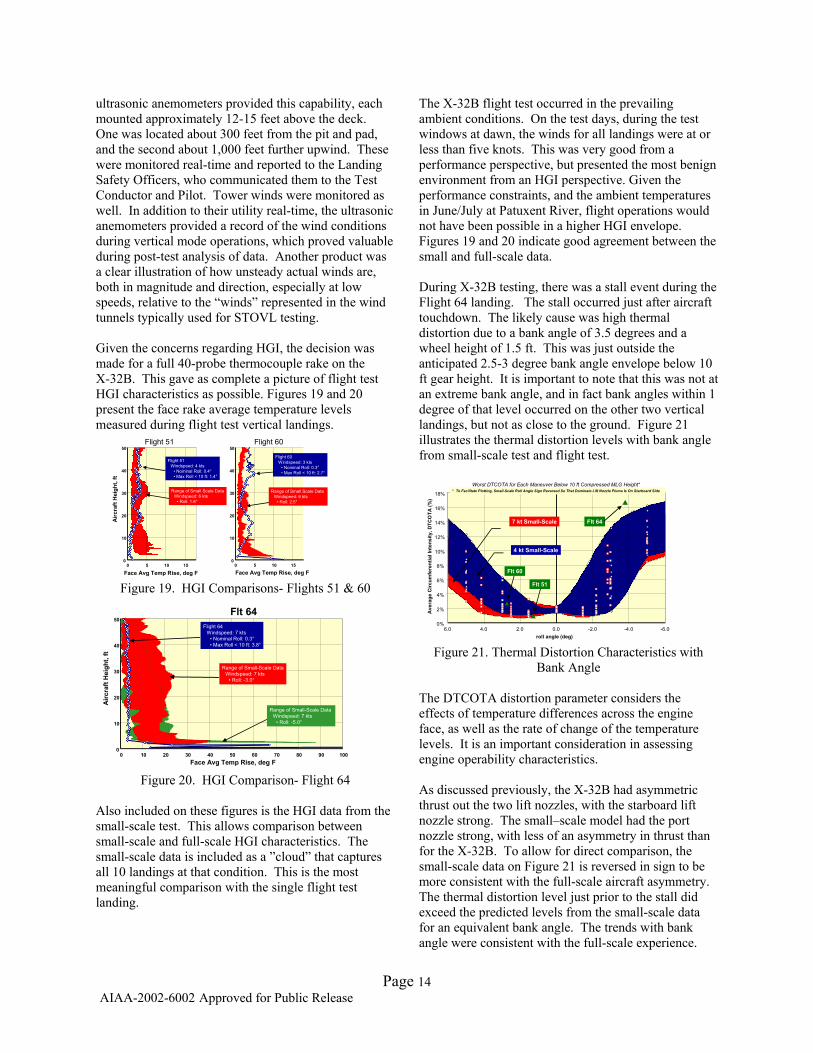
Surveys Figure 15 presents the plume pressure and temperature characteristics for the highest power setting surveyed. The pressure data is presented as coefficient of pressure (Cp), which relates local pressure to jet exit pressure. The total temperature data is presented in an equivalent format.
Page 11
AIAA-2002-6002 Approved for Public Release
Total Temperature [ (Tt - Tamb) / Ttjet - Tamb) ]
-100 -75 -50 -25 0 25 50 75 100
Cp0.900.800.700.600.500.400.300.200.10
Rake 5 Temperature Profile Not Included
Port Starboard
Pressure Data Temperature Data
Figure 15 X-32B High Power Lift Nozzle Plume
Survey Results Figure 15 illustrates the results of the pressure surveys (left side), and the temperature surveys (right side) at the highest power setting tested. Both the temperature and pressure data illustrate the asymmetry between the port and starboard lift nozzles, which is attributed to turbine swirl. The direction of the swirl increases the strength of the starboard nozzle and decreases the strength of the port nozzle. This was anticipated, but was not represented in the small-scale model, partially because the magnitude of the asymmetry was not known. Figure 15 illustrates that the asymmetry is evident both in the exit profile and the decay characteristics. The temperature data were corrected post-test for the thermal lag of the temperature probes. Figure 16 illustrates a comparison of the small-scale plumes to the full-scale plumes for the lift nozzles
0.0
0.2
0.4
0.6
0.8
1.0
0 5 10 15H/De
Exce
ss P
ress
ure,
Cp
Port Nozzle Peak Slope
Starboard Nozzle Peak Slope
PredictedPort Nozzle
PredictedStarboard Nozzle Port Nozzle
Starboard Nozzle
FX652 Plume DataPort Nozzle
Starboard Nozzle
FX652 Plume Data
Full-ScaleSmall-Scale
Cp0.900.800.700.600.500.400.300.200.10
Figure 16. Comparison of Small-scale and
Full-scale Plumes Interpreting the significance of differences in plume shape is currently a matter of technical judgment. Reference 2 presents a means for comparing plumes on the basis of centerline decay characteristics; however,
this only captures part of the effect. As understanding improves, more elaborate schemes to capture pressure gradients and other relevant physics should be developed and validated. Figure 16 shows the plume pressure contours for both the small-scale and full-scale nozzles, as well as centerline decay data. It indicates that the small-scale nozzles were more uniform (port to starboard) than the full-scale, and the small-scale nozzle decay characteristics fell between the full-scale port and starboard nozzles. The stronger full-scale starboard nozzle persisted longer, and the weaker port nozzle decayed more rapidly than the small-scale nozzles. Considering these effects in the aggregate, and applying plume effect correction from Reference 2, which is based on slope of centerline decay and location of the peak slope, the overall effect was a 0.3% increase in propulsion induced lift loss as compared with the small-scale nozzles. What appears to be a difference in effective splay is related to the reference planes of the survey. The measured effective splay angles were within ±0.5° between small-scale and full-scale. Figure 17 presents a comparison of small-scale to full-scale data for the jetscreen
9% HGI Model (H/Dh AJS = 10.7) FX652 (H/Dh AJS = 9.4)
Figure 17. Comparison of Small-scale and Full-scale
Jetscreen Plumes The full-scale jetscreen surveys were added in response to the HGI with roll sensitivity uncovered during small-scale HGI testing. To conduct the jetscreen surveys, the plume rake structure was re-oriented to traverse along the engine centerline to provide the best available resolution. Given the relatively low pressure and temperature levels in the jetscreen, as well as the rapid decay with distance downstream of the exit, the instrumentation was not optimum for jetscreen surveys. Only the top rake survey was considered. Figure 17 illustrates that the full-scale lateral jetscreen is wider than the small-scale, and still had acceptable strength to manage the forward penetration of the fountain. The axial jetscreen was stronger than the small-scale model, and more vertical. The technical judgment of the Boeing and Government engineers was that the full-scale jetscreen would be at least as effective in controlling the thermal distortion with aircraft roll.
Page 12
AIAA-2002-6002 Approved for Public Release
Summarizing the full-scale plume survey results:
1) Confirmed a measurable thrust asymmetry between the starboard and port nozzles, with the starboard nozzle strong. It varied as a function of power setting. It was not represented in the small-scale model, but was well within roll trim capability of the aircraft
2) There was a small (~0.5°) differential in splay between the lift nozzles. It was not represented in the small-scale model, but was well within roll trim capability of the aircraft.
3) The plume mixing characteristics were very similar between the small-scale nozzles and the starboard full-scale nozzle. The port full-scale nozzle decayed more rapidly. Applying the Margason plume correction (Reference 2) resulted in a 0.3% increase in propulsion induced lift loss
4) The full-scale lateral jetscreen cascade was adequately represented by the small-scale model
With the exception of a small adjustment to performance associated with the plume characteristics, the primary product of the full-scale plume surveys was a substantial increase in the confidence of the small-scale database. This was particularly important given the relatively tight performance margins of the X-32B in the ambient conditions anticipated during the flight test program, as well as the issue with thermal distortion due to aircraft roll. Given the added confidence in the small-scale data, we proceeded into X-32B flight test with maximum confidence in our performance estimates and simulation models. X-32B STOVL Flight Test Program Summary: The overall X-32B test program was 78 flights in duration, starting on March 29 2001 and ending on July 28, 2001. The STOVL performance relevant portion of the X-32B flight test program consisted of:
a) 12 steady hover points, 8 of which had high confidence performance calculations made,
b) 4 vertical landings, one on the hover pit and three on the VTOL pad
c) 6 STOs
Each of the three X-32B test pilots, Dennis O’Donoghue (Boeing), Major Jeff Karnes (USMC) and LtCdr Paul Stone (Royal Navy) accomplished at least one of each of the above. The three vertical landings accomplished on the VTOL pad were flights 51 (O’Donoghue), 60 (Karnes) and 64 (Stone). The X-32B performance data referenced in this section is
contained in Reference 9. The HGI data is from Reference 10. The “final” pre-flight test predictions for X-32B vertical landing performance on the VTOL pad are presented in Figure 18. The line at just less than 28,600 lbs represents the weight of the X-32B, configured for vertical mode operations, with a fuel load of 1,500 lbs. This was the minimum fuel at which a vertical landing would be initiated. If the fuel got below 1,500 lbs, the aircraft was waved-off and recovered on one of the runways, either by short landing or conventional landing.
X-32B Temperature and Weight Limits for Pad VL
27,000
27,500
28,000
28,500
29,000
29,500
30,000
30,500
-25 -20 -15 -10 -5 0 5 10Ambient Temperature Relative to θ-Break (F)
Airc
raft
Wei
ght /
δ (l
bs)
< 4 knot headwind< 7 knot headwind< 10 knot headwind< 15 knot headwind
40 45 50 55 60 65 70 75
Outside Air Temperature, deg F
1,500 lb Fuel(Initiate VL)
Figure 18. X-32B Pad VL Performance Estimates Figure 18 illustrates the impact on aircraft performance of the sensitivity of HGI to headwind. A similar figure was contained in the continuation criteria document, which was used by the test team as guidance on aircraft weight limits to conduct a safe test program. Similar figures were used as guidance for OGE hovers and for operations on the hover pit. These figures were complemented by performance calculations made by the Integrated Test Force (ITF) using a Pratt & Whitney tool that considered the specific engine characteristics of the test engine, as well as the ambient conditions. This process calculated anticipated N1 and RIT values for a given weight and flight condition. Further, actual thrust margin available was monitored real-time in the control room. This process is discussed in detail in Reference 3. All flight test operations were intended to use less than 96% of the available thrust for the ambient conditions, which allowed an additional 4% of thrust for execution of an “escape maneuver” if required. The 4% margin was based on Harrier techniques and V/STOL research experience. The adequacy of this margin was validated in the X-32B simulator prior to flight test. Control margins in all axes were monitored real-time as well. Given the sensitivity to wind conditions, the flight test team requested a precise measurement of ambient winds local to the VTOL operations area, which included both the VTOL pad and the hover pit. Two
Page 13
AIAA-2002-6002 Approved for Public Release
ultrasonic anemometers provided this capability, each mounted approximately 12-15 feet above the deck. One was located about 300 feet from the pit and pad, and the second about 1,000 feet further upwind. These were monitored real-time and reported to the Landing Safety Officers, who communicated them to the Test Conductor and Pilot. Tower winds were monitored as well. In addition to their utility real-time, the ultrasonic anemometers provided a record of the wind conditions during vertical mode operations, which proved valuable during post-test analysis of data. Another product was a clear illustration of how unsteady actual winds are, both in magnitude and direction, especially at low speeds, relative to the “winds” represented in the wind tunnels typically used for STOVL testing.
The X-32B flight test occurred in the prevailing ambient conditions. On the test days, during the test windows at dawn, the winds for all landings were at or less than five knots. This was very good from a performance perspective, but presented the most benign environment from an HGI perspective. Given the performance constraints, and the ambient temperatures in June/July at Patuxent River, flight operations would not have been possible in a higher HGI envelope. Figures 19 and 20 indicate good agreement between the small and full-scale data. During X-32B testing, there was a stall event during the Flight 64 landing. The stall occurred just after aircraft touchdown. The likely cause was high thermal distortion due to a bank angle of 3.5 degrees and a wheel height of 1.5 ft. This was just outside the anticipated 2.5-3 degree bank angle envelope below 10 ft gear height. It is important to note that this was not at an extreme bank angle, and in fact bank angles within 1 degree of that level occurred on the other two vertical landings, but not as close to the ground. Figure 21 illustrates the thermal distortion levels with bank angle from small-scale test and flight test.
Given the concerns regarding HGI, the decision was made for a full 40-probe thermocouple rake on the X-32B. This gave as complete a picture of flight test HGI characteristics as possible. Figures 19 and 20 present the face rake average temperature levels measured during flight test vertical landings.
0
10
20
30
40
50
0 5 10 15
Face Avg Temp Rise, deg F
Airc
raft
Hei
ght,
ft
Range of Small Scale DataWindspeed: 6 kts
• Roll: 1.6°
Flight 51Windspeed: 4 kts
• Nominal Roll: 0.4°• Max Roll < 10 ft: 1.4°
0
10
20
30
40
50
0 5 10 15
Flight 60Windspeed: 3 kts
• Nominal Roll: 0.3°• Max Roll < 10 ft: 2.7°
Range of Small Scale Data Windspeed: 6 kts
• Roll: 2.5°
Face Avg Temp Rise, deg F
Flight 51 Flight 60
0%
2%
4%
6%
8%
10%
12%
14%
16%
18%
-6.0-4.0-2.00.02.04.06.0roll angle (deg)
Ave
rage
Circ
umfe
rent
ial I
nten
sity
, DTC
OTA
(%)
Worst DTCOTA for Each Maneuver Below 10 ft Compressed MLG Height** To Facilitate Plotting, Small-Scale Roll Angle Sign Reversed So That Dominate Lift Nozzle Plume Is On Starboard Side
Flt 51
Flt 60
Flt 64
4 kt Small-Scale
7 kt Small-Scale
Figure 19. HGI Comparisons- Flights 51 & 60
0
10
20
30
40
50
0 10 20 30 40 50 60 70 80 90 100
Flt 64Flight 64
Windspeed: 7 kts• Nominal Roll: 0.3°• Max Roll < 10 ft: 3.8°
Range of Small-Scale DataWindspeed: 7 kts
• Roll: -3.0°
Range of Small-Scale Data Windspeed: 7 kts
• Roll: -5.0°
Face Avg Temp Rise, deg F
Airc
raft
Hei
ght,
ft
Figure 21. Thermal Distortion Characteristics with Bank Angle
The DTCOTA distortion parameter considers the effects of temperature differences across the engine face, as well as the rate of change of the temperature levels. It is an important consideration in assessing engine operability characteristics. Figure 20. HGI Comparison- Flight 64 As discussed previously, the X-32B had asymmetric thrust out the two lift nozzles, with the starboard lift nozzle strong. The small–scale model had the port nozzle strong, with less of an asymmetry in thrust than for the X-32B. To allow for direct comparison, the small-scale data on Figure 21 is reversed in sign to be more consistent with the full-scale aircraft asymmetry. The thermal distortion level just prior to the stall did exceed the predicted levels from the small-scale data for an equivalent bank angle. The trends with bank angle were consistent with the full-scale experience.
Also included on these figures is the HGI data from the small-scale test. This allows comparison between small-scale and full-scale HGI characteristics. The small-scale data is included as a ”cloud” that captures all 10 landings at that condition. This is the most meaningful comparison with the single flight test landing.
Page 14
AIAA-2002-6002 Approved for Public Release
The flight test stall event was a highly undesirable event, but did not represent a safety of flight issue. The aircraft had landing gear on deck prior to losing thrust.
0.000
0.010
0.020
0.030
0 50 100 150 200
Hover altitude, ft
Flight 51Flight 60Flight 64
(Thr
ust –
airc
raft
wt)/
thru
st
Slope= 1% ∆L/T / 100 ft
Note: There is a “true” OGE Point- above which ∆L/T will remain constant withincreasing altitude
Figure 23. Flight Test Derived ∆L/T sensitivity with
Aircraft Height
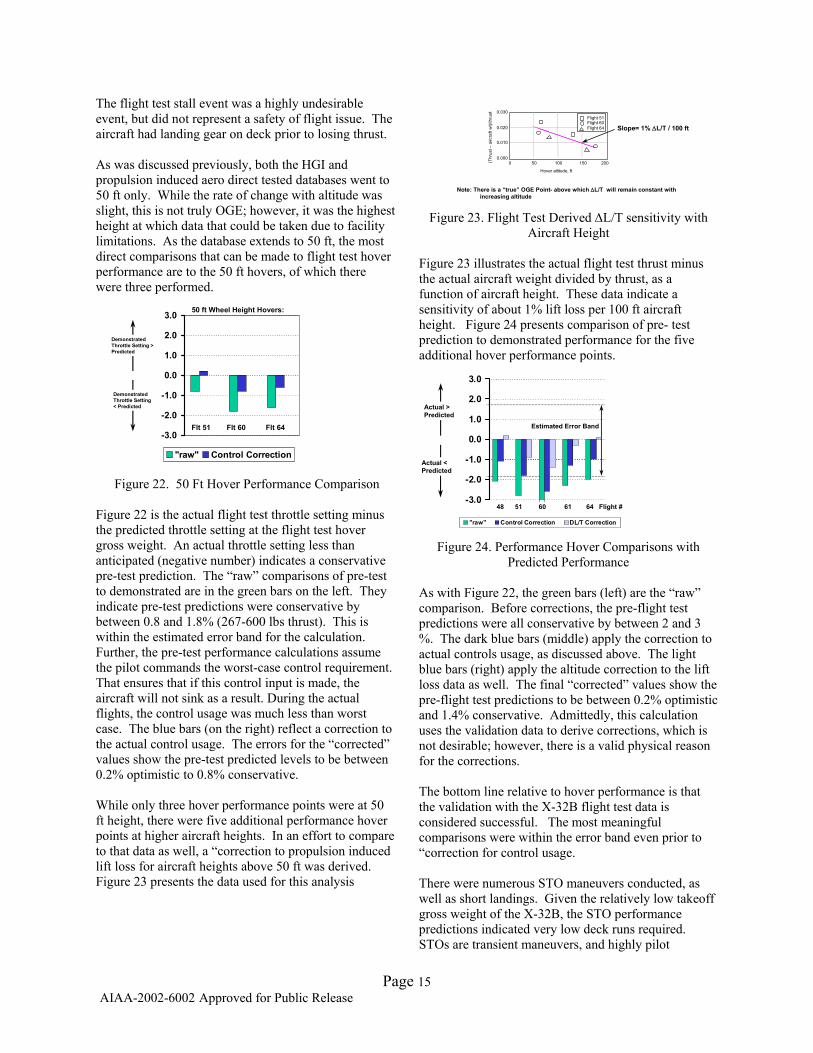
As was discussed previously, both the HGI and propulsion induced aero direct tested databases went to 50 ft only. While the rate of change with altitude was slight, this is not truly OGE; however, it was the highest height at which data that could be taken due to facility limitations. As the database extends to 50 ft, the most direct comparisons that can be made to flight test hover performance are to the 50 ft hovers, of which there were three performed.
Figure 23 illustrates the actual flight test thrust minus the actual aircraft weight divided by thrust, as a function of aircraft height. These data indicate a sensitivity of about 1% lift loss per 100 ft aircraft height. Figure 24 presents comparison of pre- test prediction to demonstrated performance for the five additional hover performance points.
50 ft Wheel Height Hovers:
Flt 51 Flt 60 Flt 64
Demonstrated Throttle Setting > Predicted
Demonstrated Throttle Setting < Predicted
-3.0
-2.0
-1.0
0.0
1.0
2.0
3.0
"raw" Control Correction
Actual < Predicted
48 51 60 61 64 Flight #
Actual > Predicted
Estimated Error Band
-3.0
-2.0
-1.0
0.0
1.0
2.0
3.0
"raw" Control Correction DL/T Correction
Figure 22. 50 Ft Hover Performance Comparison Figure 22 is the actual flight test throttle setting minus the predicted throttle setting at the flight test hover gross weight. An actual throttle setting less than anticipated (negative number) indicates a conservative pre-test prediction. The “raw” comparisons of pre-test to demonstrated are in the green bars on the left. They indicate pre-test predictions were conservative by between 0.8 and 1.8% (267-600 lbs thrust). This is within the estimated error band for the calculation. Further, the pre-test performance calculations assume the pilot commands the worst-case control requirement. That ensures that if this control input is made, the aircraft will not sink as a result. During the actual flights, the control usage was much less than worst case. The blue bars (on the right) reflect a correction to the actual control usage. The errors for the “corrected” values show the pre-test predicted levels to be between 0.2% optimistic to 0.8% conservative.
Figure 24. Performance Hover Comparisons with Predicted Performance
As with Figure 22, the green bars (left) are the “raw” comparison. Before corrections, the pre-flight test predictions were all conservative by between 2 and 3 %. The dark blue bars (middle) apply the correction to actual controls usage, as discussed above. The light blue bars (right) apply the altitude correction to the lift loss data as well. The final “corrected” values show the pre-flight test predictions to be between 0.2% optimistic and 1.4% conservative. Admittedly, this calculation uses the validation data to derive corrections, which is not desirable; however, there is a valid physical reason for the corrections.
The bottom line relative to hover performance is that the validation with the X-32B flight test data is considered successful. The most meaningful comparisons were within the error band even prior to “correction for control usage.
While only three hover performance points were at 50 ft height, there were five additional performance hover points at higher aircraft heights. In an effort to compare to that data as well, a “correction to propulsion induced lift loss for aircraft heights above 50 ft was derived. Figure 23 presents the data used for this analysis
Page 15
AIAA-2002-6002 Approved for Public Release
There were numerous STO maneuvers conducted, as well as short landings. Given the relatively low takeoff gross weight of the X-32B, the STO performance predictions indicated very low deck runs required. STOs are transient maneuvers, and highly pilot
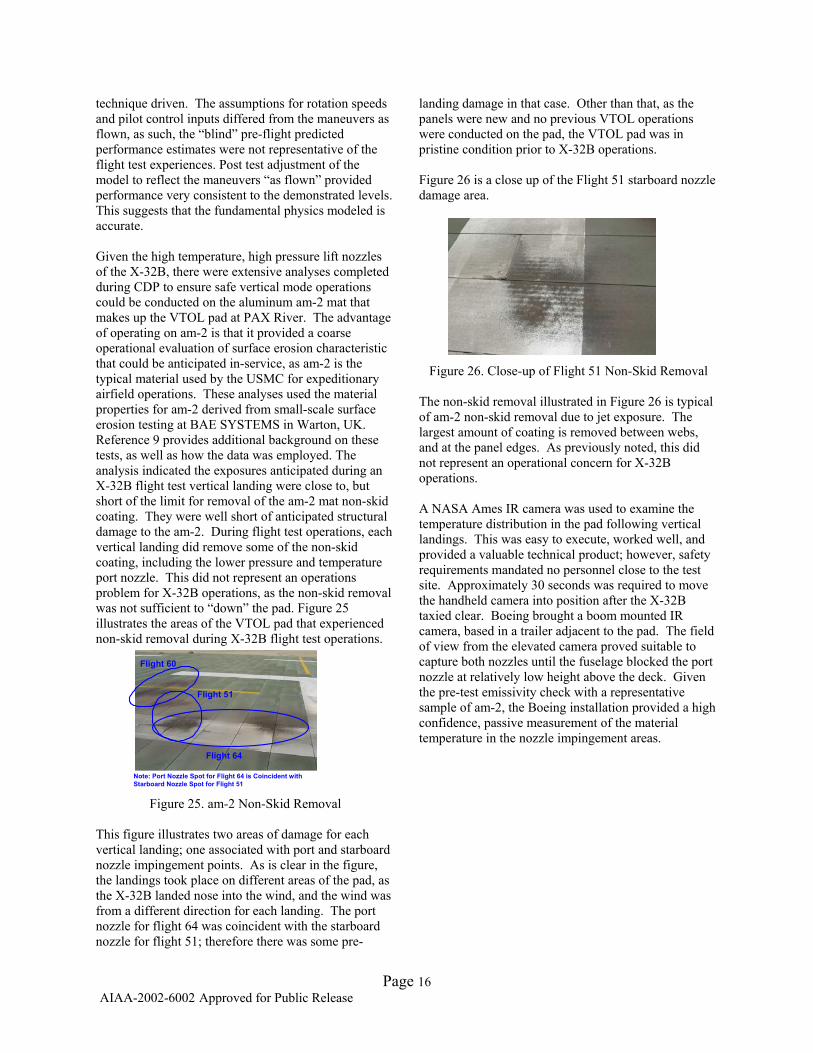
technique driven. The assumptions for rotation speeds and pilot control inputs differed from the maneuvers as flown, as such, the “blind” pre-flight predicted performance estimates were not representative of the flight test experiences. Post test adjustment of the model to reflect the maneuvers “as flown” provided performance very consistent to the demonstrated levels. This suggests that the fundamental physics modeled is accurate. Given the high temperature, high pressure lift nozzles of the X-32B, there were extensive analyses completed during CDP to ensure safe vertical mode operations could be conducted on the aluminum am-2 mat that makes up the VTOL pad at PAX River. The advantage of operating on am-2 is that it provided a coarse operational evaluation of surface erosion characteristic that could be anticipated in-service, as am-2 is the typical material used by the USMC for expeditionary airfield operations. These analyses used the material properties for am-2 derived from small-scale surface erosion testing at BAE SYSTEMS in Warton, UK. Reference 9 provides additional background on these tests, as well as how the data was employed. The analysis indicated the exposures anticipated during an X-32B flight test vertical landing were close to, but short of the limit for removal of the am-2 mat non-skid coating. They were well short of anticipated structural damage to the am-2. During flight test operations, each vertical landing did remove some of the non-skid coating, including the lower pressure and temperature port nozzle. This did not represent an operations problem for X-32B operations, as the non-skid removal was not sufficient to “down” the pad. Figure 25 illustrates the areas of the VTOL pad that experienced non-skid removal during X-32B flight test operations.
Flight 60
Flight 51
Flight 64
Note: Port Nozzle Spot for Flight 64 is Coincident with Starboard Nozzle Spot for Flight 51
Figure 25. am-2 Non-Skid Removal
This figure illustrates two areas of damage for each vertical landing; one associated with port and starboard nozzle impingement points. As is clear in the figure, the landings took place on different areas of the pad, as the X-32B landed nose into the wind, and the wind was from a different direction for each landing. The port nozzle for flight 64 was coincident with the starboard nozzle for flight 51; therefore there was some pre-
landing damage in that case. Other than that, as the panels were new and no previous VTOL operations were conducted on the pad, the VTOL pad was in pristine condition prior to X-32B operations. Figure 26 is a close up of the Flight 51 starboard nozzle damage area.
Figure 26. Close-up of Flight 51 Non-Skid Removal
The non-skid removal illustrated in Figure 26 is typical of am-2 non-skid removal due to jet exposure. The largest amount of coating is removed between webs, and at the panel edges. As previously noted, this did not represent an operational concern for X-32B operations. A NASA Ames IR camera was used to examine the temperature distribution in the pad following vertical landings. This was easy to execute, worked well, and provided a valuable technical product; however, safety requirements mandated no personnel close to the test site. Approximately 30 seconds was required to move the handheld camera into position after the X-32B taxied clear. Boeing brought a boom mounted IR camera, based in a trailer adjacent to the pad. The field of view from the elevated camera proved suitable to capture both nozzles until the fuselage blocked the port nozzle at relatively low height above the deck. Given the pre-test emissivity check with a representative sample of am-2, the Boeing installation provided a high confidence, passive measurement of the material temperature in the nozzle impingement areas.
Page 16
AIAA-2002-6002 Approved for Public Release
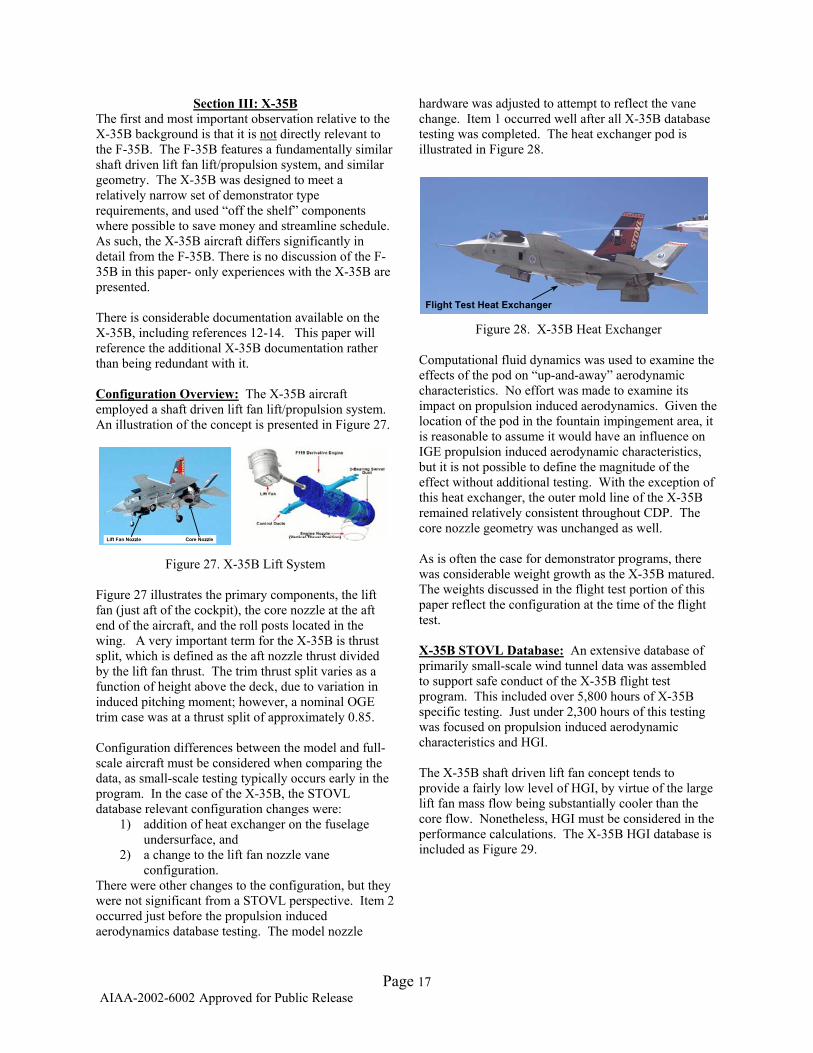
Section III: X-35B The first and most important observation relative to the X-35B background is that it is not directly relevant to the F-35B. The F-35B features a fundamentally similar shaft driven lift fan lift/propulsion system, and similar geometry. The X-35B was designed to meet a relatively narrow set of demonstrator type requirements, and used “off the shelf” components where possible to save money and streamline schedule. As such, the X-35B aircraft differs significantly in detail from the F-35B. There is no discussion of the F-35B in this paper- only experiences with the X-35B are presented. There is considerable documentation available on the X-35B, including references 12-14. This paper will reference the additional X-35B documentation rather than being redundant with it. Configuration Overview: The X-35B aircraft employed a shaft driven lift fan lift/propulsion system. An illustration of the concept is presented in Figure 27.
Lift Fan Nozzle Core Nozzle
Figure 27. X-35B Lift System
Figure 27 illustrates the primary components, the lift fan (just aft of the cockpit), the core nozzle at the aft end of the aircraft, and the roll posts located in the wing. A very important term for the X-35B is thrust split, which is defined as the aft nozzle thrust divided by the lift fan thrust. The trim thrust split varies as a function of height above the deck, due to variation in induced pitching moment; however, a nominal OGE trim case was at a thrust split of approximately 0.85. Configuration differences between the model and full-scale aircraft must be considered when comparing the data, as small-scale testing typically occurs early in the program. In the case of the X-35B, the STOVL database relevant configuration changes were:
1) addition of heat exchanger on the fuselage undersurface, and
2) a change to the lift fan nozzle vane configuration.
There were other changes to the configuration, but they were not significant from a STOVL perspective. Item 2 occurred just before the propulsion induced aerodynamics database testing. The model nozzle
hardware was adjusted to attempt to reflect the vane change. Item 1 occurred well after all X-35B database testing was completed. The heat exchanger pod is illustrated in Figure 28.
Flight Test Heat Exchanger
Figure 28. X-35B Heat Exchanger Computational fluid dynamics was used to examine the effects of the pod on “up-and-away” aerodynamic characteristics. No effort was made to examine its impact on propulsion induced aerodynamics. Given the location of the pod in the fountain impingement area, it is reasonable to assume it would have an influence on IGE propulsion induced aerodynamic characteristics, but it is not possible to define the magnitude of the effect without additional testing. With the exception of this heat exchanger, the outer mold line of the X-35B remained relatively consistent throughout CDP. The core nozzle geometry was unchanged as well. As is often the case for demonstrator programs, there was considerable weight growth as the X-35B matured. The weights discussed in the flight test portion of this paper reflect the configuration at the time of the flight test. X-35B STOVL Database: An extensive database of primarily small-scale wind tunnel data was assembled to support safe conduct of the X-35B flight test program. This included over 5,800 hours of X-35B specific testing. Just under 2,300 hours of this testing was focused on propulsion induced aerodynamic characteristics and HGI. The X-35B shaft driven lift fan concept tends to provide a fairly low level of HGI, by virtue of the large lift fan mass flow being substantially cooler than the core flow. Nonetheless, HGI must be considered in the performance calculations. The X-35B HGI database is included as Figure 29.
Page 17
AIAA-2002-6002 Approved for Public Release
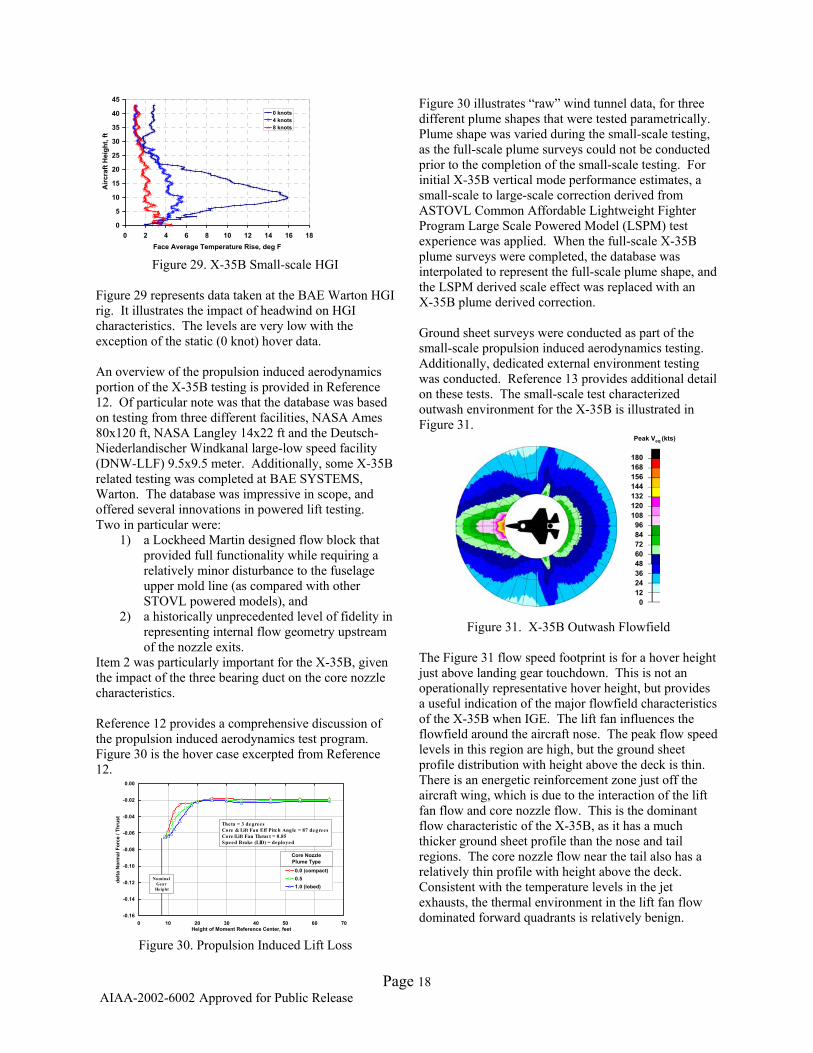
Figure 30 illustrates “raw” wind tunnel data, for three different plume shapes that were tested parametrically. Plume shape was varied during the small-scale testing, as the full-scale plume surveys could not be conducted prior to the completion of the small-scale testing. For initial X-35B vertical mode performance estimates, a small-scale to large-scale correction derived from ASTOVL Common Affordable Lightweight Fighter Program Large Scale Powered Model (LSPM) test experience was applied. When the full-scale X-35B plume surveys were completed, the database was interpolated to represent the full-scale plume shape, and the LSPM derived scale effect was replaced with an X-35B plume derived correction.
0
5
10
15
20
25
30
35
40
45
0 2 4 6 8 10 12 14 16 18Face Average Temperature Rise, deg F
Airc
raft
Hei
ght,
ft0 knots4 knots8 knots
Figure 29. X-35B Small-scale HGI
Figure 29 represents data taken at the BAE Warton HGI rig. It illustrates the impact of headwind on HGI characteristics. The levels are very low with the exception of the static (0 knot) hover data.
Ground sheet surveys were conducted as part of the small-scale propulsion induced aerodynamics testing. Additionally, dedicated external environment testing was conducted. Reference 13 provides additional detail on these tests. The small-scale test characterized outwash environment for the X-35B is illustrated in Figure 31.
An overview of the propulsion induced aerodynamics portion of the X-35B testing is provided in Reference 12. Of particular note was that the database was based on testing from three different facilities, NASA Ames 80x120 ft, NASA Langley 14x22 ft and the Deutsch-Niederlandischer Windkanal large-low speed facility (DNW-LLF) 9.5x9.5 meter. Additionally, some X-35B related testing was completed at BAE SYSTEMS, Warton. The database was impressive in scope, and offered several innovations in powered lift testing. Two in particular were:
Peak Veq (kts)
0 . 0
1 2 . 0
3 6 . 0
2 4 . 0
4 8 . 0
6 0 . 0
7 2 . 0
8 4 . 0
9 6 . 0
1 0 8 . 0
1 2 0 . 0
1 3 2 . 0
1 4 4 . 0
1 5 6 . 0
1 6 8 . 0
1 8 0 . 018016815614413212010896847260483624120
1) a Lockheed Martin designed flow block that provided full functionality while requiring a relatively minor disturbance to the fuselage upper mold line (as compared with other STOVL powered models), and
2) a historically unprecedented level of fidelity in representing internal flow geometry upstream of the nozzle exits.
Figure 31. X-35B Outwash Flowfield The Figure 31 flow speed footprint is for a hover height just above landing gear touchdown. This is not an operationally representative hover height, but provides a useful indication of the major flowfield characteristics of the X-35B when IGE. The lift fan influences the flowfield around the aircraft nose. The peak flow speed levels in this region are high, but the ground sheet profile distribution with height above the deck is thin. There is an energetic reinforcement zone just off the aircraft wing, which is due to the interaction of the lift fan flow and core nozzle flow. This is the dominant flow characteristic of the X-35B, as it has a much thicker ground sheet profile than the nose and tail regions. The core nozzle flow near the tail also has a relatively thin profile with height above the deck. Consistent with the temperature levels in the jet exhausts, the thermal environment in the lift fan flow dominated forward quadrants is relatively benign.
Item 2 was particularly important for the X-35B, given the impact of the three bearing duct on the core nozzle characteristics. Reference 12 provides a comprehensive discussion of the propulsion induced aerodynamics test program. Figure 30 is the hover case excerpted from Reference 12.
-0.16
-0.14
-0.12
-0.10
-0.08
-0.06
-0.04
-0.02
0.00
0 10 20 30 40 50 60 70Height of Moment Reference Center, feet
delta
Nor
mal
For
ce /
Thru
st
0.0 (compact)0.51.0 (lobed)
Core Nozzle Plume Type
Theta = 3 degreesCore & Lift Fan Eff Pitch Angle = 87 degreesCore /Lift Fan Thrus t = 0.85Speed Brake (LID) = deployed
Nominal Gear
Height
Page 18
AIAA-2002-6002 Approved for Public Release
Figure 30. Propulsion Induced Lift Loss

To confirm the ground sheet was adequately represented small-scale, as well as providing data in support of external environment/basing suitability assessments, full-scale lift system outwash surveys were completed. The surveys were conducted from 18-25 July 2000 at the C-12 test stand at Pratt & Whitney in West Palm Beach, Florida. Figures 32 and 33 illustrate the outwash survey installation.
Peak Levels with HeightMean Flow Speed vs. Azimuth
100 % PLA
0102030405060708090
100
0 20 40 60 80 100 120 140 160 180 200Azimuth, deg from nose
Flow
Spe
ed, k
nots
Full-Scale
Small-Scale
0° 180°
90°
Figure 34. Comparison of Small-Scale and Full-Scale Outwash Characteristics
The Figure 34 data are the peak (from 3 inches to 10 ft above the deck), time averaged, flow speed data at 50 ft radial distance. The reference point for radial distance is the center of thrust, approximately mid-way between the liftfan and core nozzle. The small-scale data illustrated reflects an attempt to model the C-12 stand installation small-scale. The X-35B fuselage was removed, and the stand/jet blast deflectors were modeled small-scale. The small-scale testing preceded the full-scale; therefore, there are likely differences in the exact engine parameters, as well as the ambient conditions at the stand. Generally, the small-scale to full-scale data compares favorably, particularly in the reinforcement region at the wingtip and forward to the nose. This is the region of greatest interest from a performance perspective, due to the influence of the forward ground sheet on HGI. The full-scale flow speed profile with height above the deck in the forward, aft and reinforcement zones are generally consistent with the small-scale data as well. The full-scale data did indicate higher flow speed levels, particularly aft of the reinforcement zone. Analysis to understand what may have caused this result is on-going.
Figure 32. Outwash Cart on C-12
Test Dates:80 ft Radial Distance - 18 July 0060 ft Radial Distance - 20 July 0040 ft Radial Distance - 25 July 00
Radial Distance
80 ft60 ft40 ft
Engine Test Conditions: - Data at ~ 100 PLA- Data at ~ 65 PLA & Ground Idle
Engine Test Conditions: - Data at ~ 100 PLA- Data at ~ 65 PLA & Ground Idle- Data at ~ 100 PLA- Data at ~ 100 PLA- Data at ~ 65 PLA & Ground Idle- Data at ~ 65 PLA & Ground Idle
X - Concern on Quality of Pressure/Velocity Data
XX
XXXXXXX
XX
X
X
X
X
X
Figure 33. Outwash Survey Details
Figure 32 is a photograph of the installation on the deck around the C-12 stand. The lift system, mounted on the stand, is visible in the upper right. Figure 33 illustrates the locations at which data were taken during the surveys. The data population was increased near 90 degrees of azimuth to capture the energetic outwash flow at the stagnation line. As noted on Figure 33, for the aft portion of the 80 ft radial distance survey, the pressure data is of questionable quality, as the cart was caught in a brief rainstorm prior to taking those data. The forward portion of the azimuth sweep was taken earlier in the day.
Full-scale plume surveys were conducted as well, to characterize the plume shape of the full-scale lift fan and core nozzle. The plume survey rake installed under the lift system on the C-12 stand is illustrated in Figure 5, which was presented in the plume rake overview discussion in Section I.
Figure 34 is a comparison of the small-scale and full-scale outwash flow speeds.
The vane geometry in the lift fan nozzle was modified just prior to the small-scale propulsion induced aero test, as was previously noted. The specific modification was a change to two fixed longitudinal vanes. Two tabs in the aft portion of the lift fan exit were added to attempt to represent the final vane geometry. Following X-35B flight test, a maximum similarity X-35B small-scale lift fan nozzle was constructed and tested. Some compromises in fidelity were required
Page 19
AIAA-2002-6002 Approved for Public Release

due to scale and manufacturing, but the major geometry was faithfully represented. Figure 35 illustrates the centerline decay characteristics of the small-scale nozzle used for the pre-test database, the full-scale X-35B and the most representative small-scale nozzle.
LiftFan (TEVEN Nozzle)
0.50
0.55
0.60
0.65
0.70
0.75
0.80
0.85
0.90
0.95
1.00
0.00 1.00 2.00 3.00 4.00 5.00 6.00 7.00Z/De , Dis tance From Nozzle Exit
Q /
Qex
it
Mos t Re pres entative Small-Sc ale X-35B
Pre-Flight Tes t Small-Sc ale X-35B
Full-Sc ale X-35B
Z/De, Distance from Nozzle Exit
Q/Q
exit
Most Representative Small-Scale X-35B
Pre Flight Test Small-Scale X-35B
Full-Scale X-35B
∆ L/T(based on decay characteristics):Pre-flight test small-scale - 0.0052Full-scale - 0.0059Most representative small-scale - 0.0076
Figure 35. Lift fan Centerline Decay Comparison
Figure 35 indicates favorable correlation between the pre-flight test database nozzle and the full-scale X-35B nozzle. Photographs of each of the nozzles are presented on the right of the figure. The inset indicates the plume decay derived delta to the propulsion induced lift loss as calculated using the Reference 2 methodology. The full-scale and pre-flight test small-scale are virtually identical (differ by 0.07 % of lift fan thrust). Figure 36 also indicates the most representative X-35B small-scale nozzle decays more rapidly than the full-scale. Had the most representative nozzle been used for the database testing, these data suggest a positive scale effect of about 0.2% of lift fan thrust should have been applied. Figure 36 presents plume shape comparison of the three lift fan nozzles.
Port
X
Y
-40 -30 -20 -10 0 10 20 30 40-40
-30
-20
-10
0
10
20
30
40
Y
-40
-30
-20
-10
0
10
20
30
40
Y
-40
-30
-20
-10
0
10
20
30
40
X-40 -30 -20 -10 0 10 20 30 40
PT/P02.152.051.951.851.751.651.551.451.351.251.151.05
Z= 39.3 in
Z= 91.3 in
Z= 127.3 in
Full-Scale X-35B Most RepresentativeSmall-Scale X-35B
Pre-Flight TestSmall-Scale X-35B
Z= 66.7 in
Forward
Figure 36. Lift fan Plume Shape Comparison
These data show that the pre-flight test small-scale plume is narrower than the full-scale. Experience with parametric lift fan nozzle testing suggests that the narrower small-scale plume would have less propulsion induced lift loss in transition. As such, our estimated
transition performance would be optimistic. The most representative small-scale nozzle data represents most of the plume shape characteristics of the full-scale nozzle, but has an additional lobe on the aft edge. The impact of this lobe on propulsion induced aerodynamics cannot be quantitatively assessed without further testing, although it is reasonable to expect a higher level of negative pressure on the fuselage bottom aft of the lift fan (therefore higher lift loss). Equivalent plume comparison data for the core nozzle are provided in Figures 37 and 38.
Core Nozzle
0.50
0.55
0.60
0.65
0.70
0.75
0.80
0.85
0.90
0.95
1.00
0.00 1.00 2.00 3.00 4.00 5.00 6.00 7.00Z/De, Distance From Nozzle Exit
Q /
Qex
it
Most Representative X-35B
Pre-Flight Test X-35B
Full-Scale X-35B
Z/De, Distance from Nozzle Exit
Q/Q
exit
Most Representative Small-Scale X-35B
Pre Flight Test Small-Scale X-35B
Full-Scale X-35B
∆ L/T(based on decay characteristics):Pre-flight test small-scale - 0.0074Full-scale - 0.0066Most representative small-scale - 0.0084
Figure 37. Core Nozzle Centerline Decay Comparison
PT/P02.051.951.851.751.651.551.451.351.251.151.05
Y
-40
-30
-20
-10
0
10
20
30
40
Y
-40
-30
-20
-10
0
10
20
30
40
X-40 -30 -20 -10 0 10 20 30 40
X
Y
-40 -30 -20 -10 0 10 20 30 40-40
-30
-20
-10
0
10
20
30
40
Pre-Flight TestSmall-Scale X-35B Full-Scale X-35B Most Representative
Small-Scale X-35B
Z= 11.2 in
Z= 63.2 in
Z=99.2 in
Forward
Port
Note : Z= 2.1 in
Figure 38. Core Nozzle Plume Shape Comparison
Figure 37 presents a comparison of the core nozzle centerline decay characteristics. While not as obvious as for the lift fan, the pre-flight small-scale nozzle agreed more favorably with full-scale than the most geometrically representative nozzle. When the centerline decay data were evaluated using the Reference 2 methodology, the pre-flight test small-scale nozzle propulsion induced lift loss was about 0.1 % of core thrust conservative relative to the full-scale data. Figure 38 illustrates plume shape comparisons of the three nozzles. All nozzles clearly illustrate the pressure deficit at the front of the plume due to the turn. This illustrates that the high fidelity internal flow geometry of the small-scale model accomplished the desired objective of properly representing the plume shape in a coarse sense.
Page 20
AIAA-2002-6002 Approved for Public Release

The STOVL performance relevant portion of the X-35B flight test program consisted of: On the basis of the favorable centerline decay
comparison between the pre-flight test small-scale nozzles and the full-scale nozzles, the scale effect being used for X-35B performance estimates was adjusted to a zero correction. This resulted in an increase in the estimated vertical mode performance of approximately 700 lbs; as compared to the previous performance estimates that included the LSPM derived scale effect. As was previously discussed, interpreting the significance of differences in plume shape is currently a matter of technical judgment. Reference 2 presents a means for comparing plumes on the basis of centerline decay characteristics; however, this only captures part of the effect. As understanding improves, more elaborate schemes to capture pressure gradients and other relevant physics should be developed and validated. Reference 12 contains a discussion of the impact of swirl on plume shape, and may be a first step in this direction.
a) 10 vertical landings on the VTOL pad b) 4 OGE waveoff points which were the highest
confidence performance points c) Numerous steady hover points, up to 5 minutes
+ in duration d) 14 STOs, 5 fixed nozzle STOs and 9 auto
STOs e) 17 vertical takeoffs from and vertical landings
on the hover pit
Each of the three X-35B test pilots, Simon Hargreaves (BAE SYSTEMS), Major Arthur Tomassetti (USMC) and Squadron Leader Justin Paines (Royal Air Force) accomplished at least one of each of the above. The demonstrated performance of the X-35B, as well as X-35A and X-35C is documented in Reference 14. The “final” pre-flight test OGE hover performance predictions for the X-35B are presented in Figure 39.
Summarizing the full-scale plume survey results:
29,500
30,000
30,500
31,000
31,500
32,000
32,500
45 50 55 60 65 70 75 80 85 90 95 100Temperature, deg F
Gro
ss W
eigh
t, lb
s0.96 HWR OGE
Figure 39. X-35B Estimated OGE Hover Performance
at EAFB
1) The pre-flight test small-scale nozzles accurately reflected the centerline decay characteristics of the full-scale jets. As such, the small-scale to large-scale correction was a zero correction. The removal of the negative LSPM scale correction resulted in an increase in vertical mode performance of about 700 lbs.
1,500 lbs Fuel
2) The full-scale plume data confirmed the expected effective thrust angles for both the lift fan and core nozzle
The full-scale plume survey results had a significant impact on the X-35B estimated vertical mode performance. Further, the full-scale plume surveys provided a substantial increase in the confidence of the small-scale database. This was particularly important given the relatively tight performance margins of the X-35B in the ambient conditions anticipated during the flight test program. Given the added confidence in the small-scale data, we proceeded into X-35B flight test with maximum confidence in our performance estimates and simulation models.
The performance predictions reflect an OGE 4% thrust margin held in reserve during flight test. The line at approximately 32,250 lbs represents the weight of the X-35B, with a fuel load of 1,500 lbs. This was the minimum fuel at which a vertical landing would be initiated. Figure 39 indicates deficient performance at the ambient conditions for Edwards Air Force Base (EAFB) (2,300 ft field elevation). The test plan was to conduct first hover operations at low height (up to 50 ft) over the Lockheed Martin hover pit in Palmdale, CA. This would provide insight on actual aircraft performance characteristics. A decision to proceed with STOVL testing in the high desert, or bring the aircraft to sea level altitude to continue testing at NAS Patuxent River would be made on the basis of these data.
X-35B STOVL Flight Test Program Summary: The overall X-35B test program was 39 flights (21.5 flight hours) in duration, starting on June 23, 2001 and ending on August 6, 2001. The X-35B aircraft was reconfigured from the X-35A, which completed the conventional takeoff and landing variant flight test objectives during the X-35A flight test program (24 October- 22 November, 2000)
There were indications during the hover pit force and moment testing, discussed in more detail in Reference
Page 21
AIAA-2002-6002 Approved for Public Release

12, that the aircraft had substantially more installed thrust than calculated by the analytical engine model. There were several considerations that prevented a conclusive understanding. First, the schedule of the pit force and moment testing was such that there was a non-flight representative software build in the full authority digital engine controller (FADEC) which sets the thrust level. Second, there was a lift fan/main engine combination installed for the pit testing that was not a flight combination nor ever tested in combination on the engine stand. Third, there were substantial thrust variations with engine throttle transients. Finally, the hover pit grating was configured slightly differently than was modeled in the small-scale propulsion induced lift loss test. These sources of uncertainty made it difficult to isolate the source of the additional thrust, and therefore determine if it was appropriate to apply it to flight test performance estimates.
The green bars on the left of Figure 40 present the initial predicted performance levels. They indicate the pre-flight test estimates were 3.5-6% conservative. The blue bars on the right reflect the 1,350 lb increase in installed thrust due to the database adjustments discussed previously. With that adjustment, the estimated performance was 0.3% optimistic to 1.8% conservative, which is within the estimated error band for the calculation. In an effort to isolate propulsion induced lift loss from the flight test data, Lockheed Martin developed and implemented an “F=ma” methodology to calculate net propulsive force. This method used vehicle weight (zero fuel weight + fuel state) and acceleration data from a three-component accelerometer group closest to the vehicle cg. A backup accelerometer group (next closest to the cg) was selected also. Pitch, roll and yaw rates were obtained from the inertial gyroscope system. These rates were differentiated to calculate pitch, roll and yaw angular accelerations about the cg. The angular accelerations were used to correct the accelerations at the accelerometer locations to accelerations at the cg. From measured aircraft pitch and roll angles, the vertical acceleration of the cg was calculated. Due to drift in the reference readings of the accelerometers, reference values for each event of interest had to be derived. This was done by double integrating the vertical acceleration to produce height. The accelerometer offset was adjusted until the height over the event was consistent with other measures of height (such as radar altitude). Once vertical acceleration was calculated, the net propulsive force was the mass times the vertical acceleration. This calculation was employed over many dozens of events during the vertical mode operations. The resulting net propulsive force calculations are presented in Figure 41, which is excerpted from Reference 12.
This experience, as well as the X-35B flight test data from hover pit press-ups, resulted in a comprehensive series of analyses and discussions involving multiple disciplines within Lockheed Martin, Pratt & Whitney and the Government to try to understand why the engine appeared to offer additional thrust relative to the engine model. The X-35B did not have sufficient instrumentation to conclusively answer the question, but it was the technical judgment of the assembled experts that there were several areas of conservatism in the analytical engine model. The two most significant from a thrust perspective were; 1) potentially higher than anticipated mass flow from the lift fan, and 2) improved pressure recovery in the main engine inlet relative to the database. When these effects, as well as the other likely candidates, were modeled they resulted in an increase in vertical thrust of 1,350 lbs relative to the original analytical engine model. The highest confidence comparisons with flight test are the four OGE waveoff points. The throttle technique used to execute these maneuvers minimized thrust transients. Figure 44 presents a comparison of the estimated performance to the demonstrated performance. A demonstrated weight greater than predicted (negative number) indicates a conservative pre-test prediction.
-2400
-2000
-1600
-1200
-800
-400
0
400
800
0 10 20 30 40 50 60 70 80Extended Gear Height (ft)
Jet-I
nduc
ed V
ertic
al L
ift (
lbf)
VL Test 188, Flt 63VL Test 184, Flt 60VL Test 179, Flt 53VL Test 175, Flt 49VL Test 184, Flt 59VL Test 181, Flt 57VTO, Test 179, Flt 53F/M Ground TestX-35B SJE Database TS=0.85
-9 ft/s, TS~0.82
0 ft/s, TS~0.86
Nozzle Nudge
-4 to -5 ft/s, TS~0.84
TS~0.88
TS~0.90TS~0.98
-6.0-5.0-4.0-3.0-2.0-1.00.01.02.0
VLPC +1350 lb
Max Out of Ground Effect Hover Weight:
Flight # 175 184 187 188
Demonstrated > Predicted
Demonstrated < Predicted
Figure 41. Flight Test Derived Lift Loss Figure 41 presents jet induced vertical lift loss, which is net propulsive force (from F=ma calculation at that point) minus reconciled thrust for six of the flight test vertical landings. Reconciled thrust was calculated
Figure 40. X-35B Performance Comparison
Page 22
AIAA-2002-6002 Approved for Public Release

post-test using Pratt & Whitney detailed analytical tools calibrated with flight test engine parameters. The six landings (of ten) shown represent those with the most consistent results. Figure 41 also shows measured load cell force data taken during the force and moment testing on the hover pit. The flight test derived data are compared to the small-scale propulsion induced lift loss database curve at an equivalent thrust split. The data are generally consistent OGE, although the flight test data tends toward a lower lift loss than the small-scale data. When IGE, the flight test data has a significantly different character than the small-scale data. Analysis to understand potential sources for this difference is ongoing. One contributor to the discrepancy could be the effect of the heat exchanger on fountain capture characteristics. Another could be a dynamic effect on propulsion induced lift loss when IGE.
X-35B Flight 188
0
20
40
60
80
100
120
140
0 2 4 6 8
Delta Temperature, deg F
Hei
ght,
ft
T2#1
T2#2
Small-scale 8 knot
Figure 42. X-35B HGI Comparison
Figure 42 shows the two T2 sensor traces from Flight 188 as compared to the 8 knot small-scale. The small-scale and flight test results are generally consistent, as they were for the other 9 vertical landings as well. Any more definitive conclusions are not appropriate.
The X-35B had 16 thermocouples located in front of the engine face. This is in addition to the two fan inlet temperature (T2) sensors that provide data to the FADEC. Data from these thermocouples would provide a coarse assessment of the flight test HGI levels. Post-test examination of the face rake thermocouple data indicated that four were never hooked up, and 8 had failed. These parameters were not considered flight critical, and the aggressive flight test schedule precluded repair. Post test analysis indicated that the remaining four thermocouples were not reliable either; therefore the only reliable source for measured temperature levels were the T2 sensors, which were grouped toward the bottom of the engine face. The wind envelope presented during flight test was generally high, with tower winds reporting 10 knots or higher for all but one of the vertical landings on the pad. The only measure of the winds local to the pad were from the Landing Safety Officer (LSO), via a hand-held anemometer at shoulder height approximately 200 ft from the center of the VTOL pad. The LSO winds were generally lower than the tower winds. These data were called to the pilot prior to initiating a vertical landing.
STO demonstrations were a critical aspect of the flight test program as well. The X-35B performed two different technique STOs; 1) fixed nozzle and 2) auto-STOs. The fixed nozzle STOs are self-explanatory, and were used for the initial flight test STO maneuvers. For these maneuvers, the demonstrated performance was very consistent with predicted levels. The flight test auto-STOs featured a deck run nozzle angle (34/28 fan/main) and flyaway nozzle angle between 40/40 and 60/60, depending on aircraft weight. The auto-rotation was pilot actuated at the desired rotation speed. Figure 43 illustrates the correlation between the demonstrated STO deck run performance and the predicted levels for the up-wind auto-STOs.
X-35B Auto STO PerformanceTest Day Conditions
500
550
600
650
700
750
800
850
900
950
1000
500 550 600 650 700 750 800 850 900 950 1000
Flight Test Takeoff Distance - Ft
Pred
icte
d Ta
keof
f Dis
tanc
e - F
t
• Figure 5.3.3-7 from X-35 Flight Test Report• STO performance model was adjusted to match flight test control inputs• Primary Differences from Pre-Test Predictions:
Aircraft Rotation Rates < 10°/secThrust Split commands
Model 5% Optimistic
Model 10% Optimistic
In summary, the validation of the small-scale HGI is not robust, as there is insufficient detail on the temperature levels at the engine face and insufficient detail on ambient winds to make a meaningful comparison. It is a valid conclusion is that for the ambient winds present during flight test, the small-scale data indication of low levels of HGI was consistent with the demonstrated levels. An example of the available HGI data is presented as Figure 42.
Figure 43. X-35B STO Performance Comparison STOs are transient maneuvers, and highly technique driven, even for the auto-STOs. The “blind” pre-flight predicted performance estimates differed from the flight test maneuvers. Figure 47 reflects post-test adjustment of the model to reflect the maneuvers “as flown”. With this adjustment, the demonstrated performance was typically within 5% of prediction, but in all cases, the
Page 23
AIAA-2002-6002 Approved for Public Release
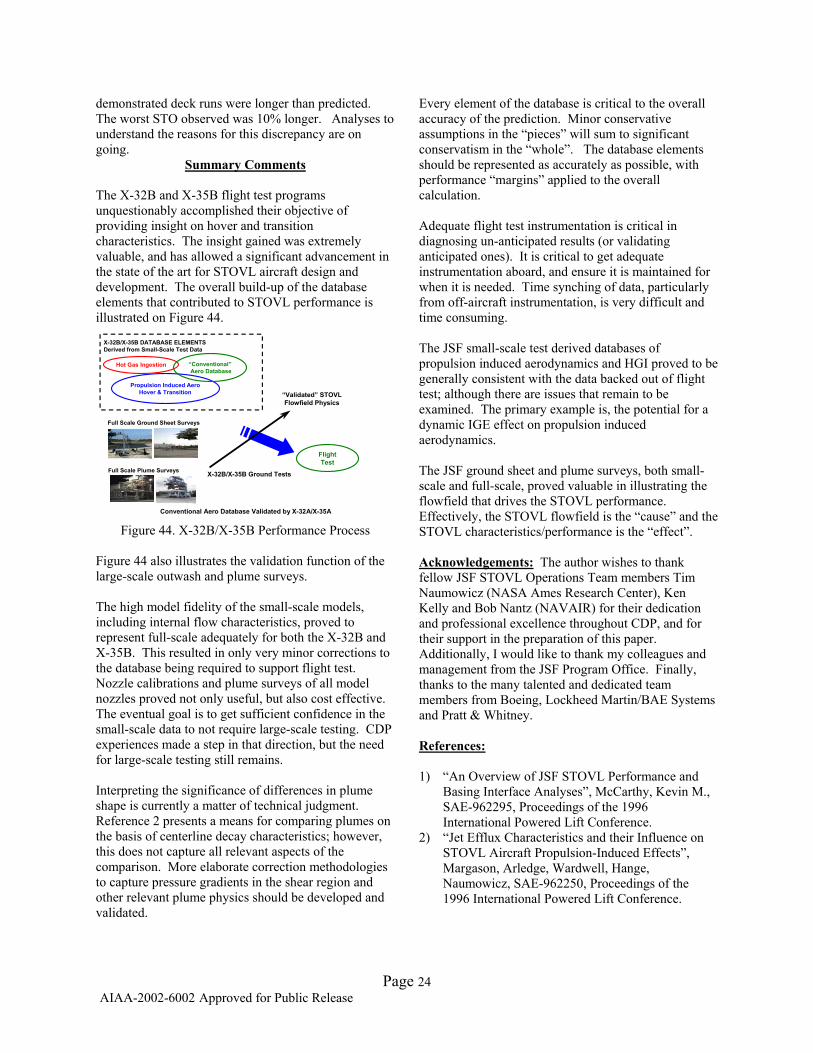
demonstrated deck runs were longer than predicted. The worst STO observed was 10% longer. Analyses to understand the reasons for this discrepancy are on going.
Every element of the database is critical to the overall accuracy of the prediction. Minor conservative assumptions in the “pieces” will sum to significant conservatism in the “whole”. The database elements should be represented as accurately as possible, with performance “margins” applied to the overall calculation.
Summary Comments The X-32B and X-35B flight test programs unquestionably accomplished their objective of providing insight on hover and transition characteristics. The insight gained was extremely valuable, and has allowed a significant advancement in the state of the art for STOVL aircraft design and development. The overall build-up of the database elements that contributed to STOVL performance is illustrated on Figure 44.
Adequate flight test instrumentation is critical in diagnosing un-anticipated results (or validating anticipated ones). It is critical to get adequate instrumentation aboard, and ensure it is maintained for when it is needed. Time synching of data, particularly from off-aircraft instrumentation, is very difficult and time consuming.
Propulsion Induced AeroHover & Transition
X-32B/X-35B DATABASE ELEMENTSDerived from Small-Scale Test Data
“Conventional”Aero Database
FlightTest
“Validated” STOVLFlowfield Physics
Conventional Aero Database Validated by X-32A/X-35A
Full Scale Ground Sheet Surveys
Full Scale Plume Surveys X-32B/X-35B Ground Tests
The JSF small-scale test derived databases of propulsion induced aerodynamics and HGI proved to be generally consistent with the data backed out of flight test; although there are issues that remain to be examined. The primary example is, the potential for a dynamic IGE effect on propulsion induced aerodynamics.
Hot Gas Ingestion
The JSF ground sheet and plume surveys, both small-scale and full-scale, proved valuable in illustrating the flowfield that drives the STOVL performance. Effectively, the STOVL flowfield is the “cause” and the STOVL characteristics/performance is the “effect”. Figure 44. X-32B/X-35B Performance Process
Figure 44 also illustrates the validation function of the large-scale outwash and plume surveys.
Acknowledgements: The author wishes to thank fellow JSF STOVL Operations Team members Tim Naumowicz (NASA Ames Research Center), Ken Kelly and Bob Nantz (NAVAIR) for their dedication and professional excellence throughout CDP, and for their support in the preparation of this paper. Additionally, I would like to thank my colleagues and management from the JSF Program Office. Finally, thanks to the many talented and dedicated team members from Boeing, Lockheed Martin/BAE Systems and Pratt & Whitney.
The high model fidelity of the small-scale models, including internal flow characteristics, proved to represent full-scale adequately for both the X-32B and X-35B. This resulted in only very minor corrections to the database being required to support flight test. Nozzle calibrations and plume surveys of all model nozzles proved not only useful, but also cost effective. The eventual goal is to get sufficient confidence in the small-scale data to not require large-scale testing. CDP experiences made a step in that direction, but the need for large-scale testing still remains.
References:
1) “An Overview of JSF STOVL Performance and Basing Interface Analyses”, McCarthy, Kevin M., SAE-962295, Proceedings of the 1996 International Powered Lift Conference.
Interpreting the significance of differences in plume shape is currently a matter of technical judgment. Reference 2 presents a means for comparing plumes on the basis of centerline decay characteristics; however, this does not capture all relevant aspects of the comparison. More elaborate correction methodologies to capture pressure gradients in the shear region and other relevant plume physics should be developed and validated.
2) “Jet Efflux Characteristics and their Influence on STOVL Aircraft Propulsion-Induced Effects”, Margason, Arledge, Wardwell, Hange, Naumowicz, SAE-962250, Proceedings of the 1996 International Powered Lift Conference.
Page 24
AIAA-2002-6002 Approved for Public Release
3) “STOVL Envelope Expansion: the X-32B Build-Down Approach”, Sowa, Robert J. and Lay, Nicholas P., Published in the Proceedings of the Society of Flight Test Engineers 33rd Annual International Symposium, August 2002.
9) “X-32B Sealed Envelope”, Mosberger, Neal, Robinson, Don, Boeing briefing, 16 August 2001.
10) “X-32B HGI”, Acheson, Kurt, Boeing briefing and spreadsheet, 20 July 2001.
11) “An Overview of the JSF Surface Erosion Analytical Method”, McCarthy, Kevin M., AIAA-98-3861, 34th AIAA/ASME/SAE/ ASEE Joint Propulsion Conference & Exhibit, July 13-15, 1998.
4) “X-35 STOVL Test Program”, Burton, Robert N, Published in the Proceedings of the Society of Flight Test Engineers 32nd Annual International Symposium, 10-14 September 2001.
12) “Highlights of the JSF X-35 STOVL Jet Effects Test Effort”, Buchholz, Mark, AIAA-2002-5962, Proceedings of the 2002 International Powered Lift Conference.
5) “Full Scale Plume Survey- Final Report”, McCarthy, Kevin M., JSF Program Internal Document.
6) “AV-8B VTOL External Environment Survey- Overview”, Nantz, The Royal Aeronautical Society, Proceedings of the 1998 International Powered Lift Conference.
13) “X-35B Thermal Environment and Test”, Willmer, Jonathan, AIAA-2002-5975, Proceedings of the 2002 International Powered Lift Conference.
14) “X-35 Flight Test Report”, Poole, David, Lockheed Martin Document 127B5050, 30 September 2001.
7) “AV-8B –408 External Environment Outwash Flow Speed and Temperature Survey”, Lake, Robert, McCarthy, Kevin, Nantz, Robert, Gonzalez, Hugo, NAWCAD Report of Test Results, Report No: NAWCADPAX/RTR-2000/114, 29 August 2000.
15) “Design and Test of the X-35B Hover Pit”, Gerhold, Martin and Buchholz, Mark, AIAA-2002-6005, Proceedings of the 2002 International Powered Lift Conference.
8) “The JSF Hover Pit at Naval Air Station Patuxent River- Configuration and Operational Experiences”, McCarthy Kevin M.
Page 25
AIAA-2002-6002 Approved for Public Release