The JRA-55 Reanalysis: General specifications and basic characteristics Kazutoshi Onogi on behalf of...
23
The JRA-55 Reanalysis: General specifications and basic characteristics Kazutoshi Onogi on behalf of the JRA-55 reanalysis group Japan Meteorological Agency 1 SCI-PS226.02 20 August 2014 WWOSC
-
Upload
allison-walsh -
Category
Documents
-
view
221 -
download
3
Transcript of The JRA-55 Reanalysis: General specifications and basic characteristics Kazutoshi Onogi on behalf of...

The JRA-55 Reanalysis: General specifications and basic characteristics
Kazutoshi Onogi on behalf of the JRA-55 reanalysis group
Japan Meteorological Agency
1SCI-PS226.02 20 August 2014 WWOSC

• The second Japanese global reanalysis conducted by JMA• The first comprehensive global atmospheric reanalysis that
applies 4D-Var to the last half century
Outline of JRA-55 (JRA Go! Go!)
JRA-55 (4D-Var)JRA-55 (4D-Var)JRA-25/JCDAS (3D-Var)JRA-25/JCDAS (3D-Var)
Surface, radiosondes, tropical cyclone retrievals, windprofilersSurface, radiosondes, tropical cyclone retrievals, windprofilers
Polar orbiting satellitesPolar orbiting satellites
Geostationary satellitesGeostationary satellites
GNSSGNSS
AircraftAircraft
1960 1970 1980 1990 2000 2010IGY FGEE
2

JRA-55 Reanalysis system
JRA-25 JRA-55 Reanalysis
years1979-2004 (26 years)
and JCDAS (2005~2014.1)1958-2012 (55 years) and
continue in real time basis
Equivalent operational NWP
systemAs of Mar. 2004 As of Dec. 2009
ResolutionT106L40 (~110km)
(top layer at 0.4 hPa)TL319L60 (~55km)
(top layer at 0.1 hPa)
Advection Scheme Eulerian Semi-Lagrangian
Assimilation scheme 3D-Var
4D-Var(with T106 inner model)
Bias correction(satellite radiance)
Adaptive method(Sakamoto and Christy 2009)
Variational Bias Correction(Dee and Uppala 2009)
GHG concentrations Constant at 375 ppmv (CO2)
Annual mean data are interpolated to daily data
(CO2,CH4,N2O) 3

Observational data• The major data source
– The ERA-40 observational dataset supplied by ECMWF
• Homogenization– Radiosonde Observation Correction
using Reanalyses (RAOBCORE) v1.4 (Haimberger et al. 2008)
• Reprocessed satellite observations– GMS, GOES-9 and MTSAT-1R
(MSC/JMA)• Sustained, Coordinated Processing of
Environmental Satellite Data for Climate Monitoring
– METEOSAT (EUMETSAT), TMI (NASA and JAXA), AMSR-E (JAXA), QuikSCAT (NASA/PO.DAAC), AMI (ESA), GNSS/RO (UCAR)
• The major data source– The ERA-40 observational dataset
supplied by ECMWF• Homogenization
– Radiosonde Observation Correction using Reanalyses (RAOBCORE) v1.4 (Haimberger et al. 2008)
• Reprocessed satellite observations– GMS, GOES-9 and MTSAT-1R
(MSC/JMA)• Sustained, Coordinated Processing of
Environmental Satellite Data for Climate Monitoring
– METEOSAT (EUMETSAT), TMI (NASA and JAXA), AMSR-E (JAXA), QuikSCAT (NASA/PO.DAAC), AMI (ESA), GNSS/RO (UCAR)
Chronology of types of observational data assimilated in JRA-55Chronology of types of observational data assimilated in JRA-55
4
(hPa)
(hPa)
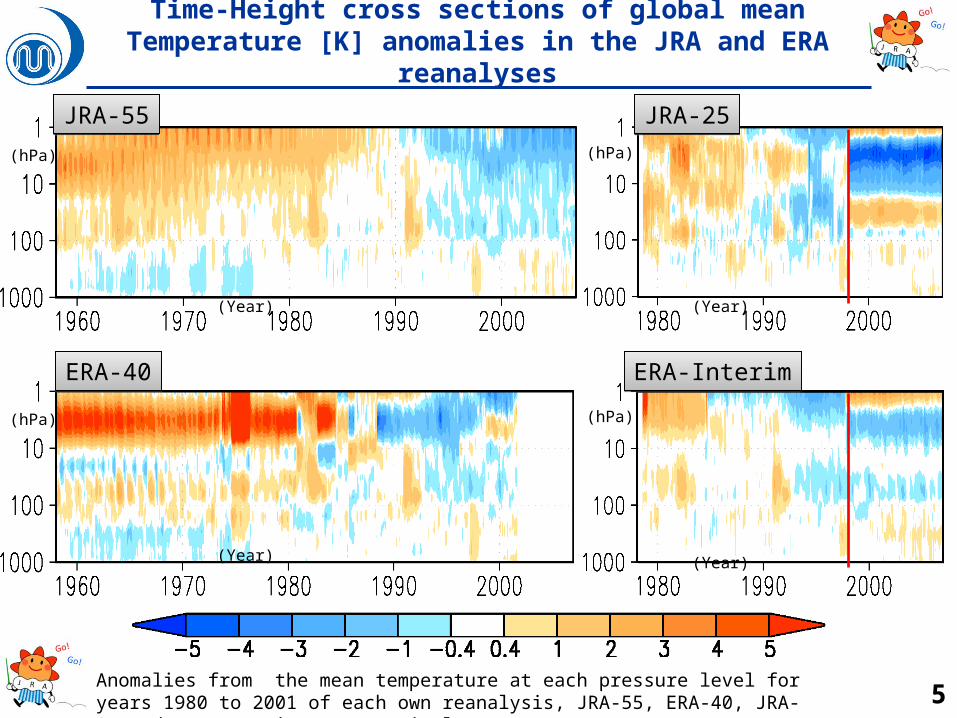
Time-Height cross sections of global mean Temperature [K] anomalies in the JRA and ERA reanalyses
(hPa)
(hPa)
(Year)
(Year)
(Year)
(Year)
Anomalies from the mean temperature at each pressure level for years 1980 to 2001 of each own reanalysis, JRA-55, ERA-40, JRA-25 and ERA-Interim , respectively.
JRA-55JRA-55
ERA-40ERA-40
JRA-25JRA-25
ERA-InterimERA-Interim
5

Global mean temperature trend compared with independent observation datasets
middle stratosphere25-35km
lower stratosphere15-20km
upper troposphre
middle troposphere
lower troposphere
upper stratosphere35-45km
stratopause40-50km
SSU (K) 75S - 75N mean MSU (K) 82.5S – 82.5N mean
6
Anomalies for each dataset were defined relative to their own monthly means over 1980-1994 (left) and 1979-1988 (right)
equivalent brightness temperature

Time-Height Cross Sections of global mean Specific Humidity increment (kg/kg/day) (1000-300hPa)
JRA-55JRA-55
JRA-25JRA-25
•In JRA-55, WV increments increase above 850hPa and decrease below 850hPa.•The increments increase in recent years owing to enhancement of satellite observing systems.
•In JRA-55, WV increments increase above 850hPa and decrease below 850hPa.•The increments increase in recent years owing to enhancement of satellite observing systems.
VTPR TOVS AMSU-BSSM/I
AMSU-BSSM/I
7

Annual Mean Precipitation
Reanalyses vs. GPCP ( 1980 ~2008 )JRA-55 - GPCPJRA-55 - GPCP JRA-25 - GPCPJRA-25 - GPCP
ERA-Interim - GPCPERA-Interim - GPCP CFSR - GPCPCFSR - GPCP
ERA-40 - GPCPERA-40 - GPCP MERRA - GPCPMERRA - GPCP
8

Frequency of daily precipitation correlation against TRMM
Frequency of spatial correlation of daily precipitation over tropical region (22oS-22oN) against TRMM from 1998 to 2009The red, green and blue bars show JRA-55, JRA-25/JCDAS and ERA-Interim.
Warm season in the Northern hemisphere ( 1 May. – 30 Sep. )
Cold season in the Northern Hemisphere ( 1 Nov. – 31 Mar. )
9

Global Energy Budget
TOA (W m-2) Wild et al. (2013) JRA-25 JRA-55Incoming solar 340 (340, 341) 341 341Solar reflected 100 (96, 100) 95 100Thermal outgoing 239 (236, 242) 255 251Residual (downward) –7.9 -10.0
Surface (W m-2) Wild et al. (2013) JRA-25 JRA-55Solar down 185 (179, 189) 197 189Solar reflected 24 (22, 26) 25 26Solar absorbed surface 161 (154, 166) 172 164Solar absorbed atmosphere 79 (74, 91) 75 77Residual (downward) 0.6 (0.2, 1.0) –11.6 –11.2Thermal down 342 (338, 348) 327 338Thermal up 397 (394, 400) 399 400Sensible heat 20 (15, 25) 20 20Evaporation 85 (80, 90) 91 93
Global annual mean energy balance at the TOA values (upper table) and at the surface values (lower table) from JRA-25 and JRA-55 are for the period 2002–2008, whereas those from Wild et al. (2013) represent present-day climate conditions at the beginning of the 21st century with their uncertainty ranges in parentheses.
10

Long term trend of maximum wind of tropical cyclones
JRA-55 has weakening trend of tropical cyclones’ maximum wind but no such trend is seen in observations and JRA-25. We found the TC retrieval wind data (TCR) assimilated in JRA-55 have unrealistic weakening trend. But TCR is useful for representing a TC at a correct position. 11
Annual Mean of Maximum TC wind speed
Max
imum
Win
d S
peed
(kt
)

Quality of JRA Forecast [FT=48] Scores
RMSE of Z500 for N.H. and S.H. [gpm]
N.H.N.H. S.H.S.H.
VTPRTOVS ATOVS
12
Forecast score is an important index to evaluate accuracy of forecast model and analysis field as an initial condition.
JRA-55 Family
JRA-55C JRA-55AMIPJRA-55
13

JRA-55 family
• JRA-55 (JMA)– Full observing system reanalysis
• JRA-55C (MRI/JMA)– Fixed observing system reanalysis– Using conventional observations only
• surface, radiosondes, tropical cyclone retrievals and windprofilers
• JRA-55AMIP (MRI/JMA)– AMIP type run (with no observations assimilated)
• Providing a range of products using the common base NWP system for investigating impact of changing observing systems and model biases
14

Number and spatial distribution of Radiosonde Observations for JRA-55C
15
Vertical distribution of radiosonde temperature observation for 1960s, 1980s and 2000sVertical distribution of radiosonde temperature observation for 1960s, 1980s and 2000s
Horizontal distribution of radiosonde temperature observationHorizontal distribution of radiosonde temperature observation
1960s 1980s 2000s
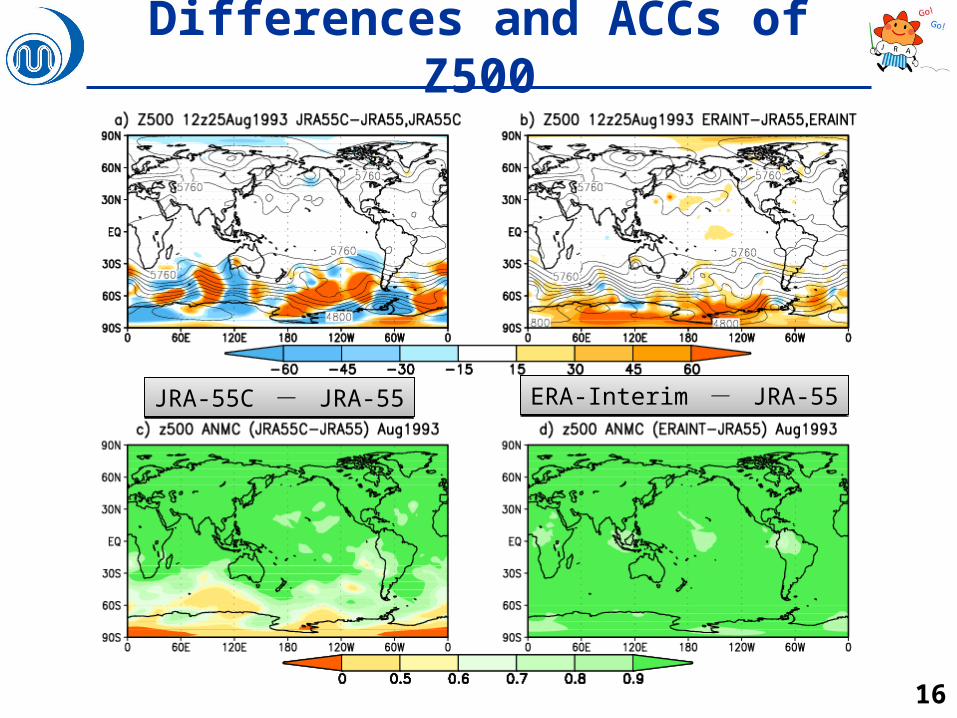
Differences and ACCs of Z500
16
JRA-55C - JRA-55JRA-55C - JRA-55 ERA-Interim - JRA-55ERA-Interim - JRA-55

JRA-55JRA-55
JRA-55CJRA-55C
JRA-55AMIPJRA-55AMIP
20CR20CR
QBO reproducibility equatorial (5S-5N) zonal mean U wind component (m/s)
17
surf. press. only

Quality of JRA Forecast [FT=48] Scores
RMSE of Z500 for N.H. and S.H. [gpm]
N.H.N.H. S.H.S.H.
18

Quality of JRA Forecast [FT=48] Scores
RMSE of Z500 for N.H. and S.H. [gpm]
N.H.N.H. S.H.S.H.
19

Summary• Advantages
– Results of quality assessment have suggested that many of deficiencies in JRA-25 have been diminished or reduced in JRA-55.
– Temporal consistency of temperature analysis of JRA-55 has the best performance with few jumps among the reanalyses.
– Inter-comparison among the “JRA-55 family” provides an opportunity for quantitative assessment regarding representation of climatic trends and low-frequency variations.
• Deficiencies– Unexpected unrealistic weakening trend of tropical cyclone maximum winds.
– Some parameters of energy budget still have biases. • Further works
– Detailed evaluations are underway.
– For further improvement of temporal consistency, issues such as performance of data assimilation system under reduced observing systems and model biases need to be addressed.
20
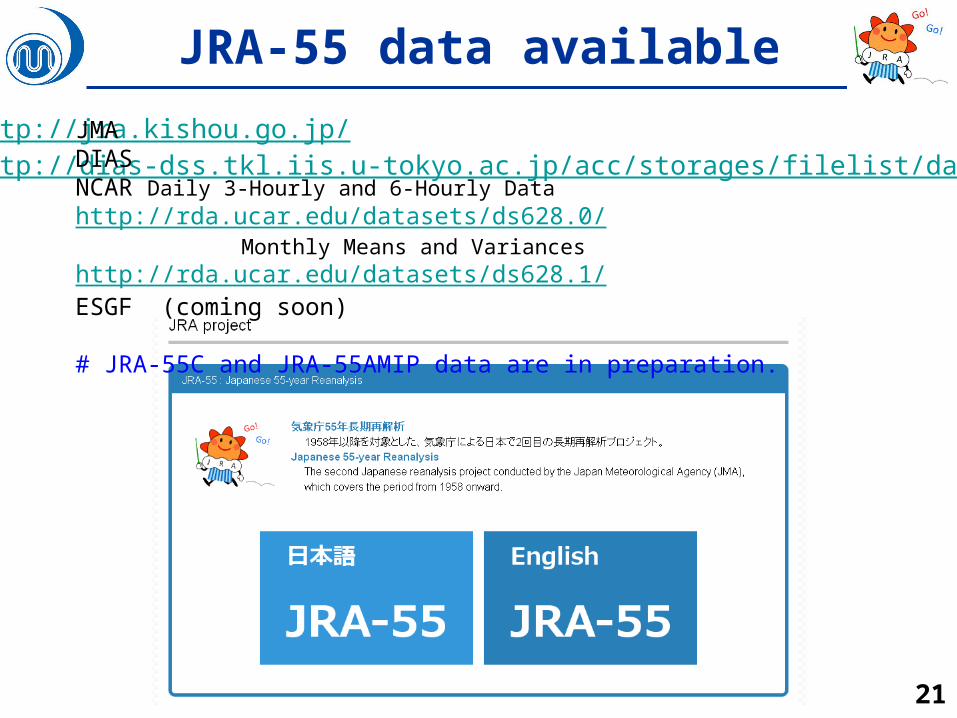
JRA-55 data available
http://jra.kishou.go.jp/http://dias-dss.tkl.iis.u-tokyo.ac.jp/acc/storages/filelist/dataset:204
JMADIASNCAR Daily 3-Hourly and 6-Hourly Data http://rda.ucar.edu/datasets/ds628.0/ Monthly Means and Variances http://rda.ucar.edu/datasets/ds628.1/ESGF (coming soon)
# JRA-55C and JRA-55AMIP data are in preparation.
21

References
• S. Kobayashi et al. (2014)– Shinya Kobayashi, Y.Ota, Y.Harada, A.Ebita, M.Moriya, H.Onoda, K.Onogi, H.Kamahori,
C.Kobayashi, H.Endo, K.Miyaoka, and K.Takahashi
– “ The JRA-55 Reanalysis: General Specifications and Basic Characteristics ”
– Submitted to JMSJ. It is likely to be accepted. Coming soon.– It replaces the interim report Ebita et al. (2011) .
• Harada et al. (to be published in 2015) – A comprehensive evaluation report of JRA-55 (in preparation)
• C. Kobayashi et al. (2014)– Chiaki Kobayashi, H.Endo, Y.Ota, S.Kobayashi, H.Onoda, Y.Harada, K.Onogi and H.Kamahori
– “Preliminary Results of the JRA-55C, an Atmospheric Reanalysis Assimilating Conventional Observations Only"
• SOLA, 2014, Vol.10, 78-82, doi:10.2151/sola.2014-016• https://www.jstage.jst.go.jp/article/sola/10/0/10_2014-016/_article
22

Thank you!
Go!Go!
J R A
23