The Journey Begins… · 6 FY 2014 Actual FY 2015 Actual FY 2015 Goal Goal # +/- FY 2016 Goal HAW...
64
The Journey Begins… 1 Increase Graduation and Transfer Eliminate Access and Success Gaps for: Native Hawaiian Students Filipino Students Pacific Island Students Pell Students
Transcript of The Journey Begins… · 6 FY 2014 Actual FY 2015 Actual FY 2015 Goal Goal # +/- FY 2016 Goal HAW...

The Journey Begins…
1
Increase Graduation and Transfer Eliminate Access and Success
Gaps for: Native Hawaiian Students Filipino Students Pacific Island Students Pell Students

The Journey Begins…
2
Maintain Quality Provide Effective Workforce Remove Cost as a Barrier to
Community College Success Accelerate Student Success in
Developmental Coursework Use Guided Pathways to
Graduation and Transfer

The Journey Begins…
3
Use Technology to Expand Offerings and Improve Processes
Fulfill Our Commitment as a Model Indigenous Serving System
Fulfill Our Commitment to Sustainability, Including Financial Sustainability
Performance Funding
4
UHCC Measures ($6.46M)
Wt UH Measures ($2.0M)
Wt
Degrees & Certificates 35 Degrees & Certificates 30
NH Degrees & Certificates 10 NH Degrees & Certificates 10
Pell Degrees & Certificates 10 Pell Degrees & Certificates 10
Total STEM Degrees & Certificates
10 UHCC STEM Degrees & Certificates
10
Total UHCC Transfers 35 Total UHCC to UH Transfers 10
3-yr Student Success 30
Total 100 Total 100
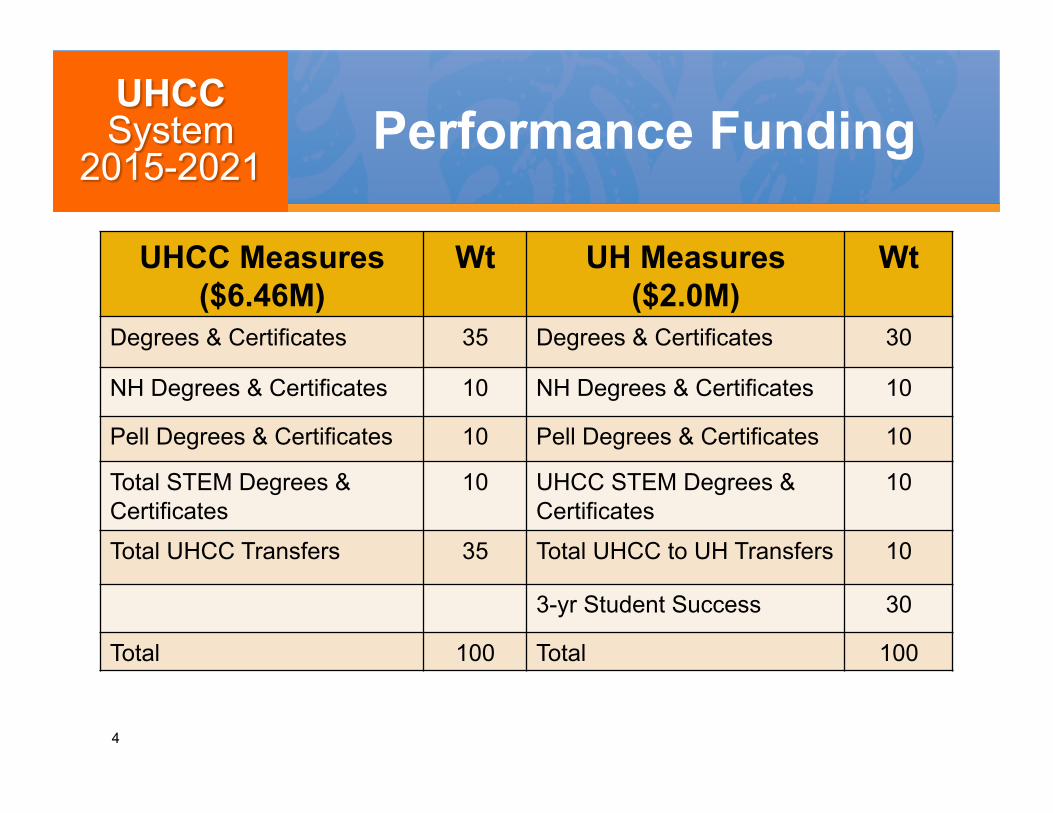
Graduation Outcomes Degrees and Certificates
2,968 3,088 3,240 3,405
5,004 5,254
5,517 5,793
6,082 6,387
6,706
3,034 3,327
3,645 4,106
5,171
4,837
2,000
4,000
6,000
8,000
FY 2010
11 12 13 14 15 16 17 18 19 20 21
Goal Degrees & CA Awarded 5
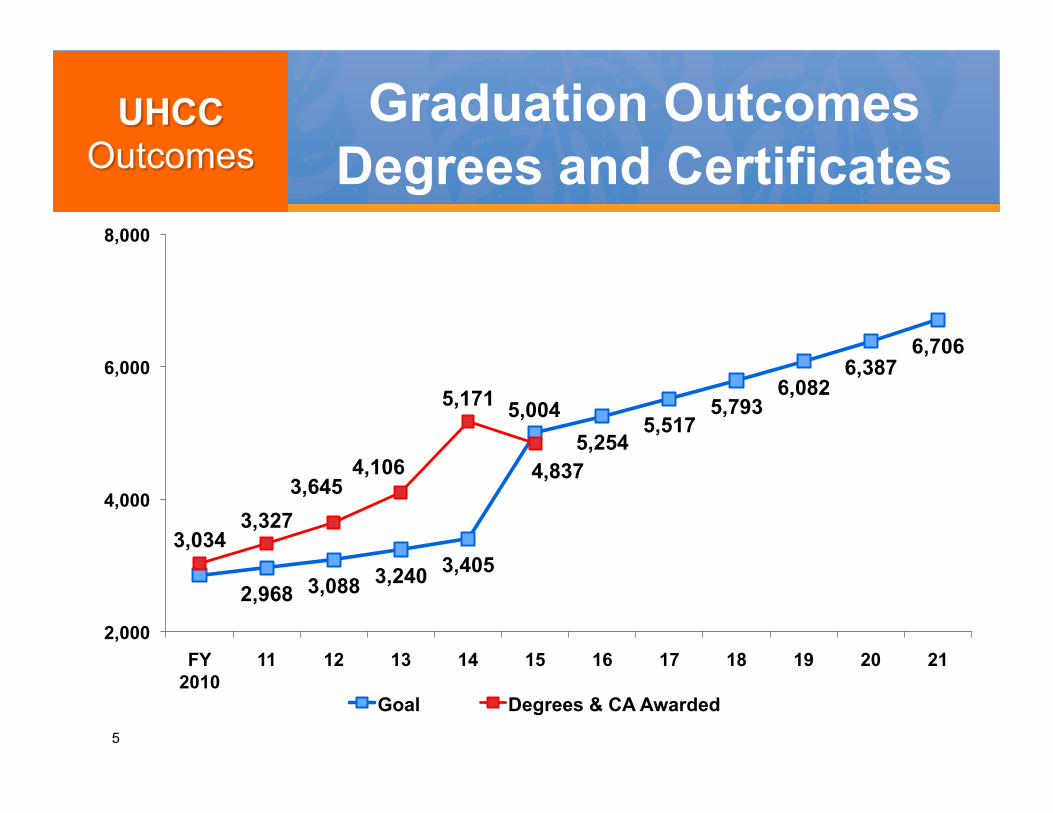
6
FY 2014 Actual
FY 2015 Actual
FY 2015 Goal
Goal # +/-
FY 2016 Goal
HAW 669 569 619 -50 650 HON 683 725 704 21 739 KAP 1,513 1,335 1,424 -89 1495 KAU 203 264 234 30 245 LEE 1,090 1,000 1,045 -45 1,097 MAU 660 575 617 -42 648 WIN 353 369 361 8 379 UHCC 5,171 4,837 5,004 -167 5,254
5% compounded growth - Did not achieve target
7
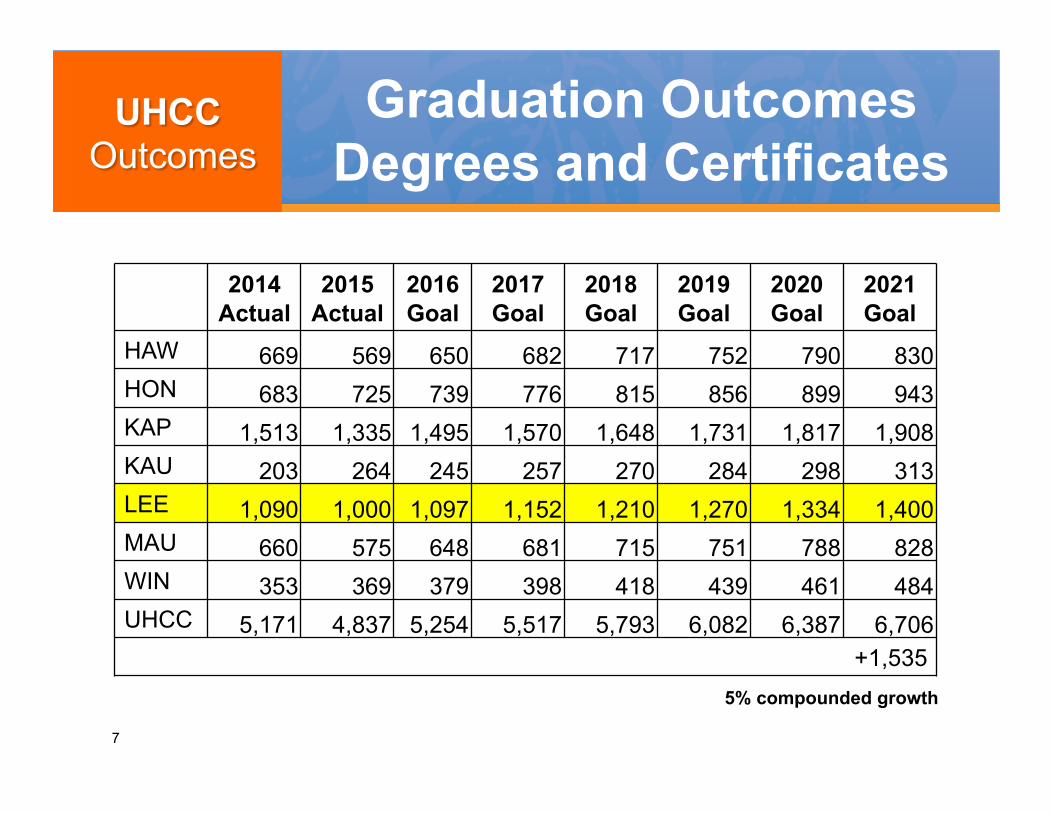
2014 Actual
2015 Actual
2016 Goal
2017 Goal
2018 Goal
2019 Goal
2020 Goal
2021 Goal
HAW 669 569 650 682 717 752 790 830 HON 683 725 739 776 815 856 899 943 KAP 1,513 1,335 1,495 1,570 1,648 1,731 1,817 1,908 KAU 203 264 245 257 270 284 298 313 LEE 1,090 1,000 1,097 1,152 1,210 1,270 1,334 1,400 MAU 660 575 648 681 715 751 788 828 WIN 353 369 379 398 418 439 461 484 UHCC 5,171 4,837 5,254 5,517 5,793 6,082 6,387 6,706
+1,535
Graduation Outcomes Degrees and Certificates
5% compounded growth
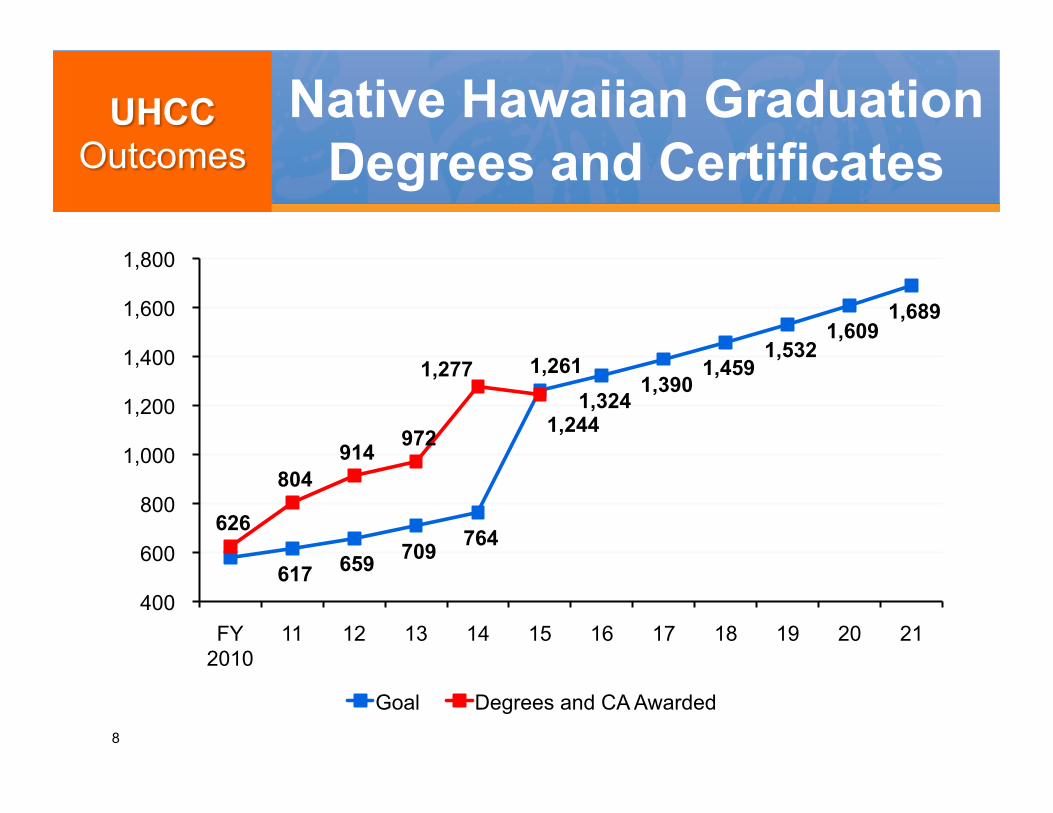
Native Hawaiian Graduation Degrees and Certificates
8
617 659 709 764
1,261 1,324
1,390 1,459
1,532 1,609
1,689
626
804 914 972
1,277
1,244
400
600
800
1,000
1,200
1,400
1,600
1,800
FY 2010
11 12 13 14 15 16 17 18 19 20 21
Goal Degrees and CA Awarded
9
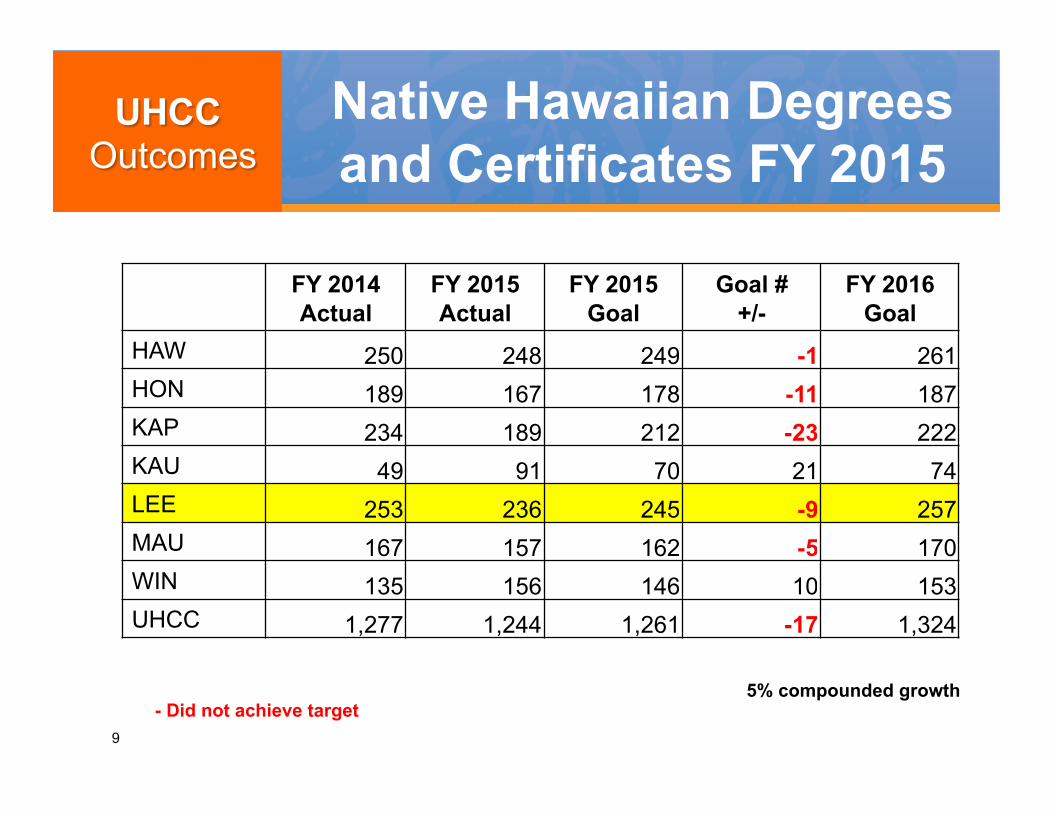
FY 2014 Actual
FY 2015 Actual
FY 2015 Goal
Goal # +/-
FY 2016 Goal
HAW 250 248 249 -1 261 HON 189 167 178 -11 187 KAP 234 189 212 -23 222 KAU 49 91 70 21 74 LEE 253 236 245 -9 257 MAU 167 157 162 -5 170 WIN 135 156 146 10 153 UHCC 1,277 1,244 1,261 -17 1,324
5% compounded growth
Native Hawaiian Degrees and Certificates FY 2015
- Did not achieve target
10
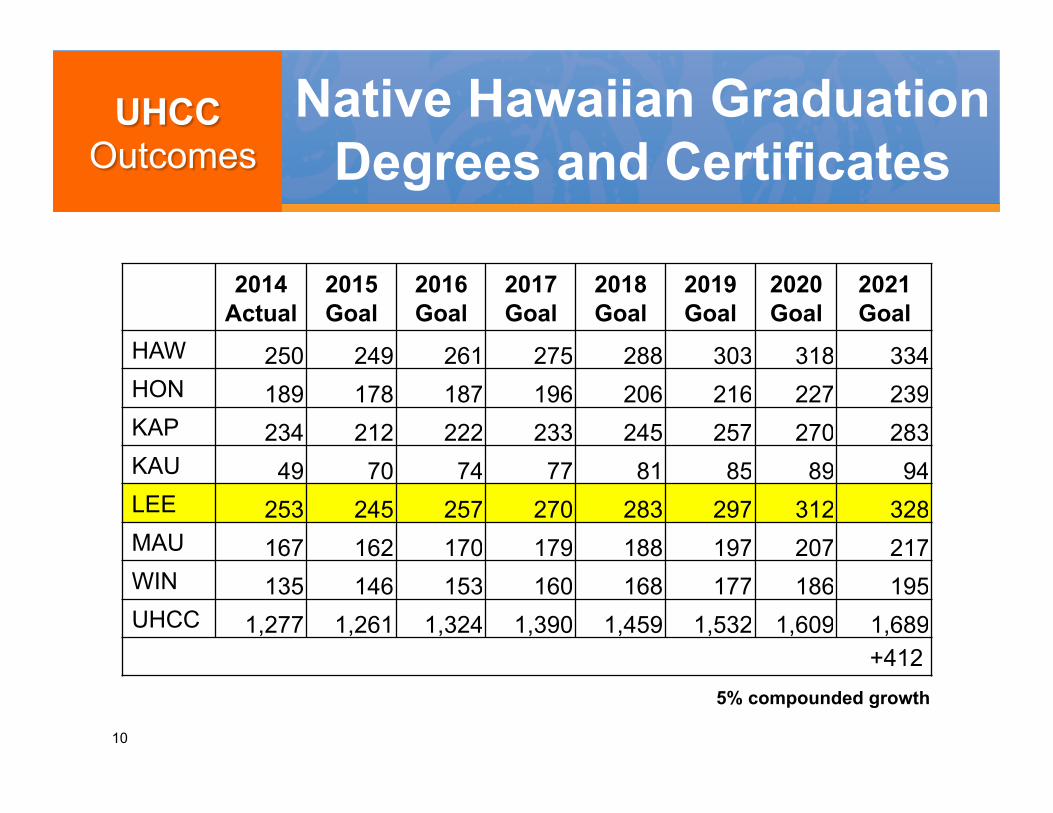
2014 Actual
2015 Goal
2016 Goal
2017 Goal
2018 Goal
2019 Goal
2020 Goal
2021 Goal
HAW 250 249 261 275 288 303 318 334 HON 189 178 187 196 206 216 227 239 KAP 234 212 222 233 245 257 270 283 KAU 49 70 74 77 81 85 89 94 LEE 253 245 257 270 283 297 312 328 MAU 167 162 170 179 188 197 207 217 WIN 135 146 153 160 168 177 186 195 UHCC 1,277 1,261 1,324 1,390 1,459 1,532 1,609 1,689
+412 5% compounded growth
Native Hawaiian Graduation Degrees and Certificates

Graduation Pell Recipients
11
987 1,036 1,088 1,143
2,389 2,508 2,634 2,766 2,904 3,049 3,201
940 1,212
1,462
1,893 2,320
2,458
0
1000
2000
3000
4000
FY 2010
11 12 13 14 15 16 17 18 19 20 21
Goal Degrees and CA Awarded

12
FY 2014 Actual
FY 2015 Actual
FY 2015 Goal
Goal # +/-
FY 2016 Goal
HAW 435 401 418 -17 439 HON 227 321 274 47 288 KAP 509 542 526 16 552 KAU 116 148 132 16 139 LEE 475 480 478 2 501 MAU 387 349 368 -19 386 WIN 171 217 194 23 204 UHCC 2,320 2,458 2,389 69 2,508
5% compounded growth - Did not achieve target

13
2014 Actual
2015 Goal
2016 Goal
2017 Goal
2018 Goal
2019 Goal
2020 Goal
2021 Goal
HAW 435 418 439 461 484 508 533 560 HON 227 274 288 302 317 333 350 367 KAP 509 526 552 579 608 639 671 704 KAU 116 132 139 146 153 160 168 177 LEE 476 478 501 526 553 580 609 640 MAU 387 368 386 406 426 447 470 493 WIN 171 194 204 214 225 236 248 260 UHCC 2,321 2,389 2,508 2,634 2,766 2,904 3,049 3,201
+880 5% compounded growth

241 282
400 470 463 486 498 523 549 576 605
635
115 126 156
244 226
313 283 297 312 328 344 361
126 156
244 226 237
173 215 226 237 248 261 274
0
200
400
600
800
FY 2010 11 12 13 14 15 16 17 18 19 20 21
Total STEM UHCC STEM UH 4yr STEM
Degrees & CA Awarded in STEM
14
Actual STEM awarded based on UH 2015 STEM designations
15
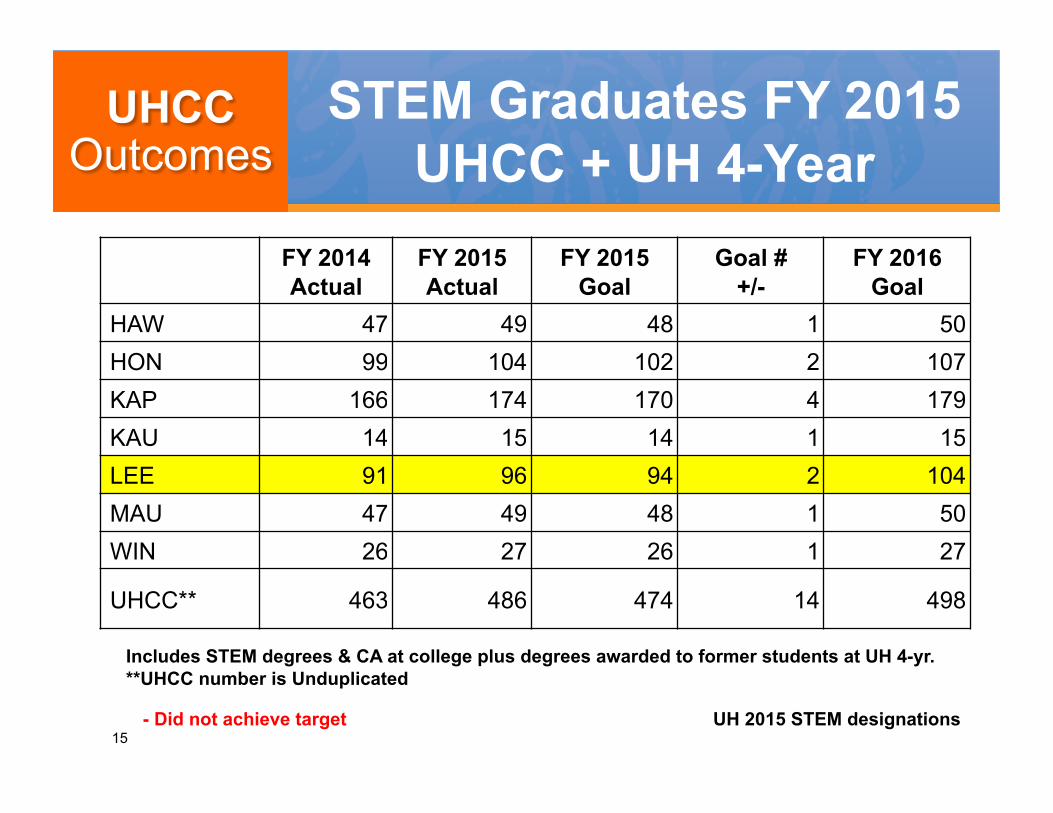
STEM Graduates FY 2015 UHCC + UH 4-Year
FY 2014 Actual
FY 2015 Actual
FY 2015 Goal
Goal # +/-
FY 2016 Goal
HAW 47 49 48 1 50 HON 99 104 102 2 107 KAP 166 174 170 4 179 KAU 14 15 14 1 15 LEE 91 96 94 2 104 MAU 47 49 48 1 50 WIN 26 27 26 1 27
UHCC** 463 486 474 14 498
UH 2015 STEM designations
Includes STEM degrees & CA at college plus degrees awarded to former students at UH 4-yr. **UHCC number is Unduplicated
- Did not achieve target
16
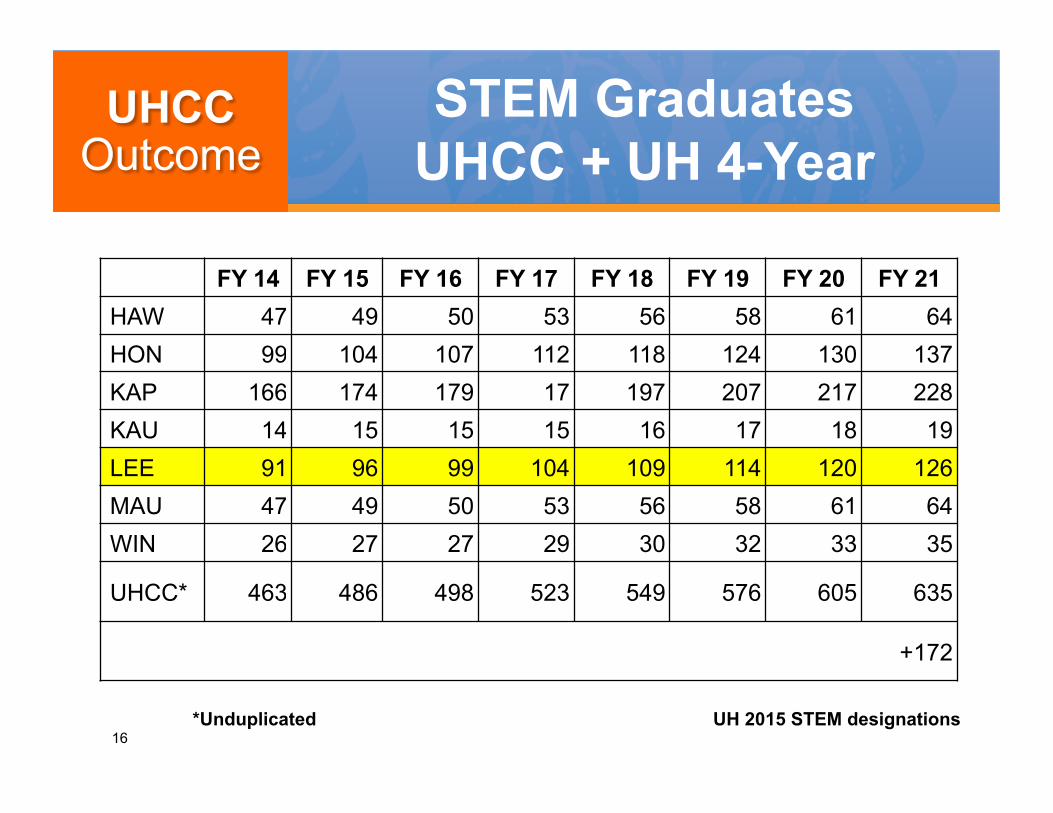
STEM Graduates UHCC + UH 4-Year
FY 14 FY 15 FY 16 FY 17 FY 18 FY 19 FY 20 FY 21 HAW 47 49 50 53 56 58 61 64 HON 99 104 107 112 118 124 130 137 KAP 166 174 179 17 197 207 217 228 KAU 14 15 15 15 16 17 18 19 LEE 91 96 99 104 109 114 120 126 MAU 47 49 50 53 56 58 61 64 WIN 26 27 27 29 30 32 33 35
UHCC* 463 486 498 523 549 576 605 635
+172
UH 2015 STEM designations *Unduplicated

17
STEM Graduates FY 2015 UHCC Only
FY 2014 Actual
FY 2015 Actual
FY 2015 Goal
Goal # +/-
FY 2016 Goal
HAW 19 15 17 -2 18 HON 60 63 62 1 65 KAP 77 110 94 16 98 KAU 7 5 6 -1 6 LEE 29 66 48 18 50 MAU 23 15 19 -4 20 WIN 11 39 25 14 26
UHCC** 226 313 270 43 283
UH 2015 STEM designations - Did not achieve target

18
STEM Graduates UHCC Only
FY 14 FY 15 FY 16 FY 17 FY 18 FY 19 FY 20 FY 21 HAW 19 15 18 19 20 21 22 23
HON 60 63 65 68 71 75 78 82 KAP 77 110 98 103 108 114 119 125 KAU 7 5 6 7 7 7 8 8 LEE 29 66 50 52 55 58 61 64 MAU 23 15 20 21 22 23 24 25 WIN 11 39 26 28 29 30 32 34
UHCC* 226 313 283 297 312 328 344 361
+135
UH 2015 STEM designations

3,625 3,898 4,023 4,052 4,286 4,320 4,518 4,744 4,981 5,230 5,492 5,767
1,995 2,216 2,217 2,245 2,425
2,020
2,334 2,450 2,573 2,701 2,837 2,978
1630 1682 1806 1807 1,861
2,300
2,185 2,294 2,409 2,529 2,655 2,788
0
2,000
4,000
6,000
8,000
Bgn Fall 2010
11 12 13 14 15 16 17 18 19 20 21
Total Transfers Transfers to UH 4yr Transfers non UH
* Unduplicated at UHCC level
Annual Transfers*
19
Actual Transfers

20
Transfers to UH–4yr plus non-UH 4-yr. **UHCC Number is Unduplicated.
Annual Transfers FY 2015
FY 2014 Actual
FY 2015 Actual
FY 2015 Goal
Goal # +/-
FY 2016 Goal
HAW 425 396 410 -14 431 HON 530 517 524 -7 550 KAP 1,196 1,246 1,221 25 1,282 KAU 174 204 189 15 198 LEE 1,332 1,365 1,348 17 1,416 MAU 544 522 533 -11 560 WIN 451 463 457 6 480 UHCC** 4,296 4,320 4,303 17 4,518
5% compounded
- Did not achieve target

21
FY 14 FY 15 FY 16 ƑY 17 FY 18 FY 19 FY 20 FY 21 HAW 425 396 431 453 475 499 524 550 HON 530 517 550 577 606 636 668 702 KAP 1,196 1,246 1,282 1,346 1,413 1,484 1,558 1,636 KAU 174 204 198 208 219 230 241 253 LEE 1,332 1,365 1,416 1,487 1,561 1,639 1,721 1,807 MAU 544 522 560 588 617 648 680 714 WIN 451 463 480 504 529 555 583 612 UHCC* 4,286 4,320 4,518 4,744 4,981 5,230 5,492 5,767
+1,481
5% compounded *UHCC Number is Unduplicated

22
**UHCC Number is Unduplicated.
UH Annual Transfers
College FY 2014 Actual
FY 2015 Actual
FY 2015 Goal
Goal # +/-
FY 2016 Goal
HAW 275 267 271 -4 285 HON 193 188 191 -3 200 KAP 669 713 691 21 726 KAU 70 83 77 6 80 LEE 602 613 608 5 638 MAU 217 191 204 -13 214 WIN 207 216 212 4 222 UHCC** 2,233 2,271 2,252 19 2,365
5% compounded - Did not achieve target

23
FY 14 FY 15 FY 16 FY 17 FY 18 FY 19 FY 20 FY 21 HAW 275 267 285 299 314 329 346 363 HON 193 188 200 210 221 232 243 255 KAP 669 713 726 762 800 840 882 926 KAU 70 83 80 84 89 93 98 103 LEE 602 613 638 670 703 738 775 814 MAU 217 191 214 225 236 248 260 273 WIN 207 216 222 233 245 257 270 283 UHCC* 2,233 2,271 2,365 2,483 2,607 2,737 2,874 3,018
+785
5% compounded *UHCC Number is Unduplicated

UHCC 3-Yr Success Rate
24

UHCC 3-Yr Success Rate
25
37.8%
UHCC Average; 34.4% 36.1%
Leeward CC; 34.4%
Leeward CC Goal; 50.0%
0%
10%
20%
30%
40%
50%
60%
70%
Cohort Graduation Year
Leeward CC (in red)
Brown markers indicate target values. 2015 figure is preliminary.

26
U.S. Census
Fall 2015 Enrollment
All Degrees & CAs
FY 2015
**STEM Degrees & CAs
FY 2015
Transfer 4 Year
FY 2015
HAW 33% 41% 44% *27% *29%
HON 18% 24% *23% *12% *15%
KAP 13% 16% *14% *14% *14%
KAU 22% 28% 34% *27% *16%
LEE 24% 26% *24% *15% *19%
MAU 24% 30% *27% *26% *19%
WIN 33% 40% 42% *36% *31%
UHCC 21% 26% 26% *17% *18%
Eliminating Native Hawaiian Success Gaps
*Did not achieve target ** STEM at UHCC & former UHCC students at UH 4 yr
27
U.S. Census
Fall 2015 Enrollment
All Degrees & CAs
FY 2015
**STEM Degrees & CAs
FY 2015
Transfer 4 Year
FY 2015
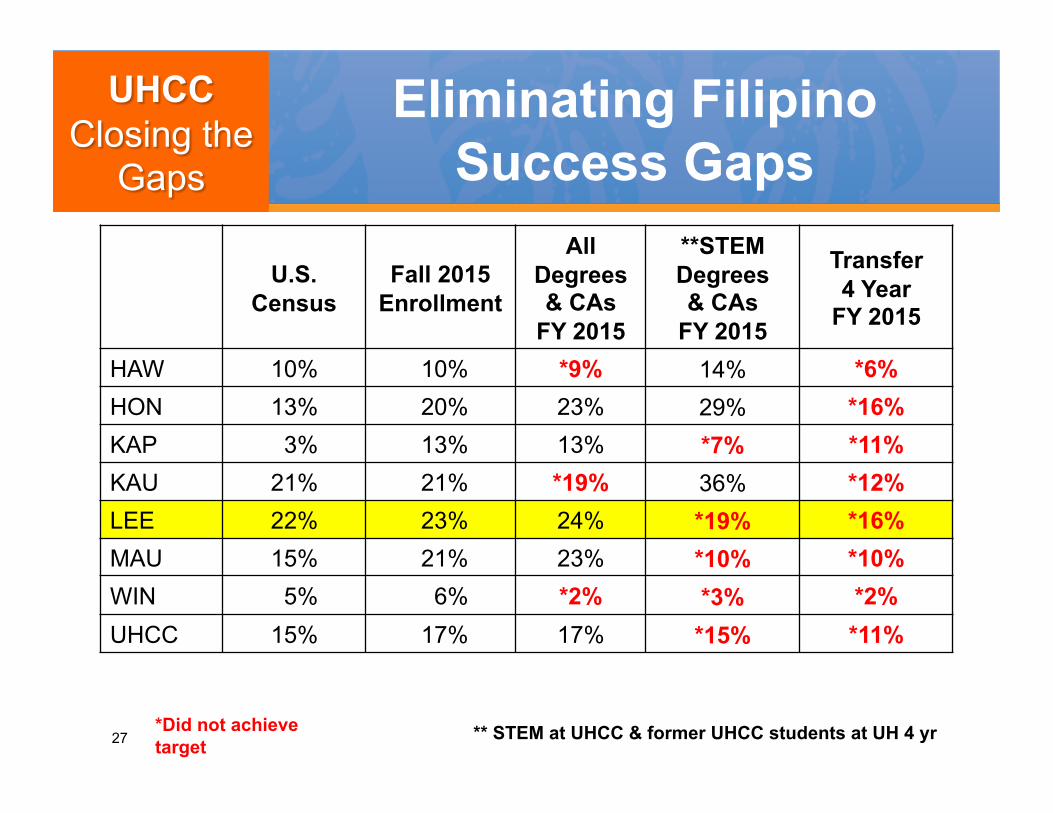
HAW 10% 10% *9% 14% *6% HON 13% 20% 23% 29% *16% KAP 3% 13% 13% *7% *11% KAU 21% 21% *19% 36% *12% LEE 22% 23% 24% *19% *16% MAU 15% 21% 23% *10% *10% WIN 5% 6% *2% *3% *2% UHCC 15% 17% 17% *15% *11%
Eliminating Filipino Success Gaps
*Did not achieve target
** STEM at UHCC & former UHCC students at UH 4 yr

28
U.S. Census
Fall 2015 Enrollment
All Degrees & CAs
FY 2015
**STEM Degrees & CAs
FY 2015
Transfer 4 Year
FY 2015
HAW 4% *3% *2% *0% *2% HON 4% *3% *2% *1% *2% KAP 1% 2% *1% *1% 2% KAU 1% 2% *1% *0% *0% LEE 6% *2% *1% *1% 2% MAU 3% *1% 1% *0% 2% WIN 5% *1% 2% *0% 2% UHCC 4% *2% 2% *1% 2%
Eliminating Pacific Islander Success Gaps
*Did not achieve target
** STEM at UHCC & former UHCC students at UH 4 yr
29
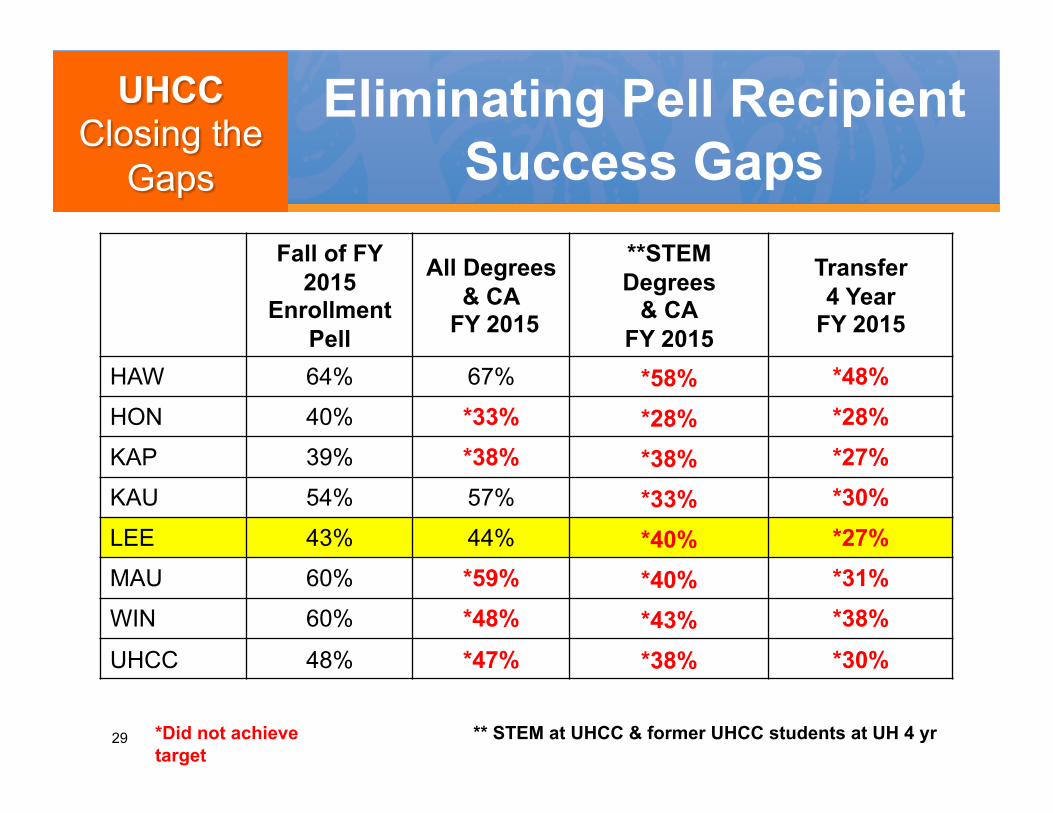
Fall of FY 2015
Enrollment Pell
All Degrees & CA
FY 2015
**STEM Degrees
& CA FY 2015
Transfer 4 Year
FY 2015
HAW 64% 67% *58% *48% HON 40% *33% *28% *28% KAP 39% *38% *38% *27% KAU 54% 57% *33% *30% LEE 43% 44% *40% *27% MAU 60% *59% *40% *31% WIN 60% *48% *43% *38%
UHCC 48% *47% *38% *30%
Eliminating Pell Recipient Success Gaps
*Did not achieve target
** STEM at UHCC & former UHCC students at UH 4 yr
Improving Time to Degree
30
Completing Math & English • 75% of students testing at 1 level below
college ready will successfully complete their college-level English and/or math course within 1 semester
• 70% of students testing at 2 or more levels below college ready will successfully complete their college-level English or math course within 1 year

College Math Success Summary
31
2013 Cohort
Math 100 Ready:
Complete
Math 100 Ready:
Not Complete
Dev Ed: Complete
Dev Ed: Not
Complete
Total: Complete
Total: Not
Complete
HAW 787 40 53 44 650 84 703 HON 791 75 86 68 563 142 649 KAP 1,195 187 164 163 681 350 845 KAU 305 36 15 48 206 84 221 LEE 1,408 135 128 121 1,024 256 1,152 MAU 642 54 52 46 490 100 542 WIN 419 55 17 43 304 98 322 UHCC 5,547 582 515 532 3,918 1,114 4,443

32
Math Placement College Level - Completed
Entered College Ready. Completed College Level Math in:
Fall 2013
Spring 2014
Fall 2014
Spring 2015
College Level
Completion
HAW (93) 19% 14% 8% 2% 43% HON (161) 23% 15% 4% 4% 47% KAP (351) 32% 15% 5% 2% 53% KAU (51) 35% 24% 6% 6% 71% LEE (263) 30% 11% 8% 2% 51% MAU (106) 20% 17% 9% 5% 51% WIN (72) 54% 14% 8% 0% 76% UHCC (1,097) 30% 15% 6% 3% 53%
2013 Entering Cohort
33
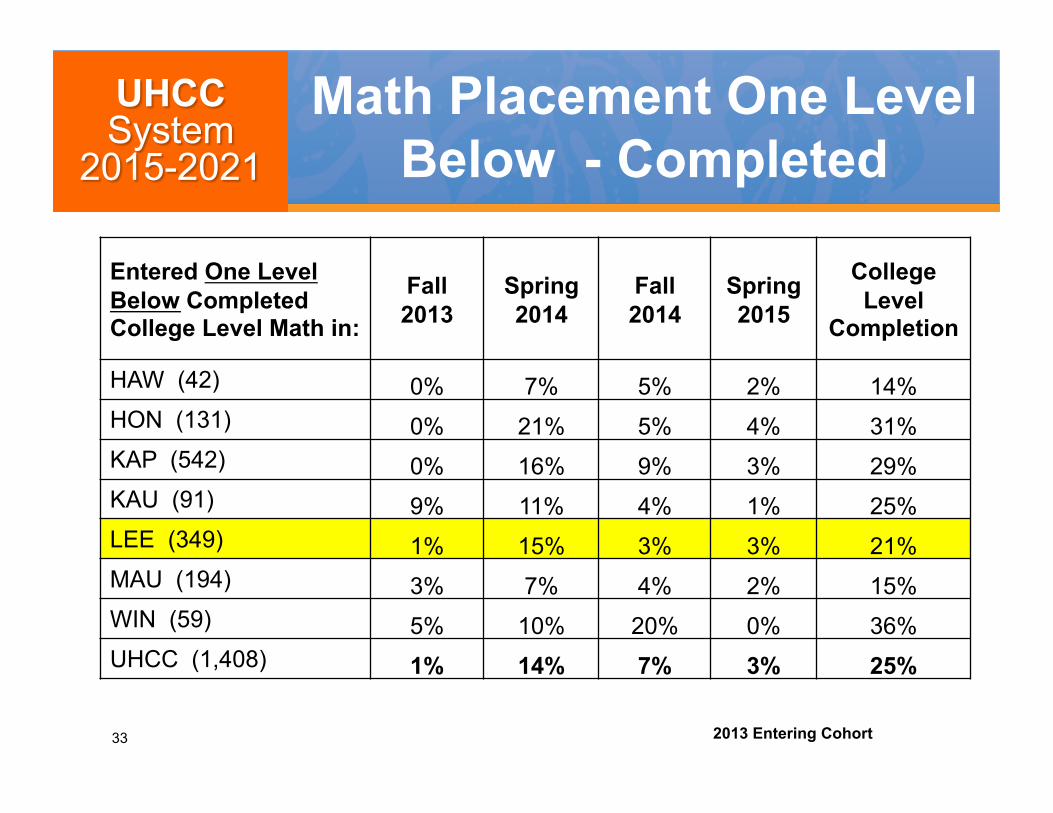
Math Placement One Level Below - Completed
Entered One Level Below Completed College Level Math in:
Fall 2013
Spring 2014
Fall 2014
Spring 2015
College Level
Completion
HAW (42) 0% 7% 5% 2% 14% HON (131) 0% 21% 5% 4% 31% KAP (542) 0% 16% 9% 3% 29% KAU (91) 9% 11% 4% 1% 25% LEE (349) 1% 15% 3% 3% 21% MAU (194) 3% 7% 4% 2% 15% WIN (59) 5% 10% 20% 0% 36% UHCC (1,408) 1% 14% 7% 3% 25%
2013 Entering Cohort
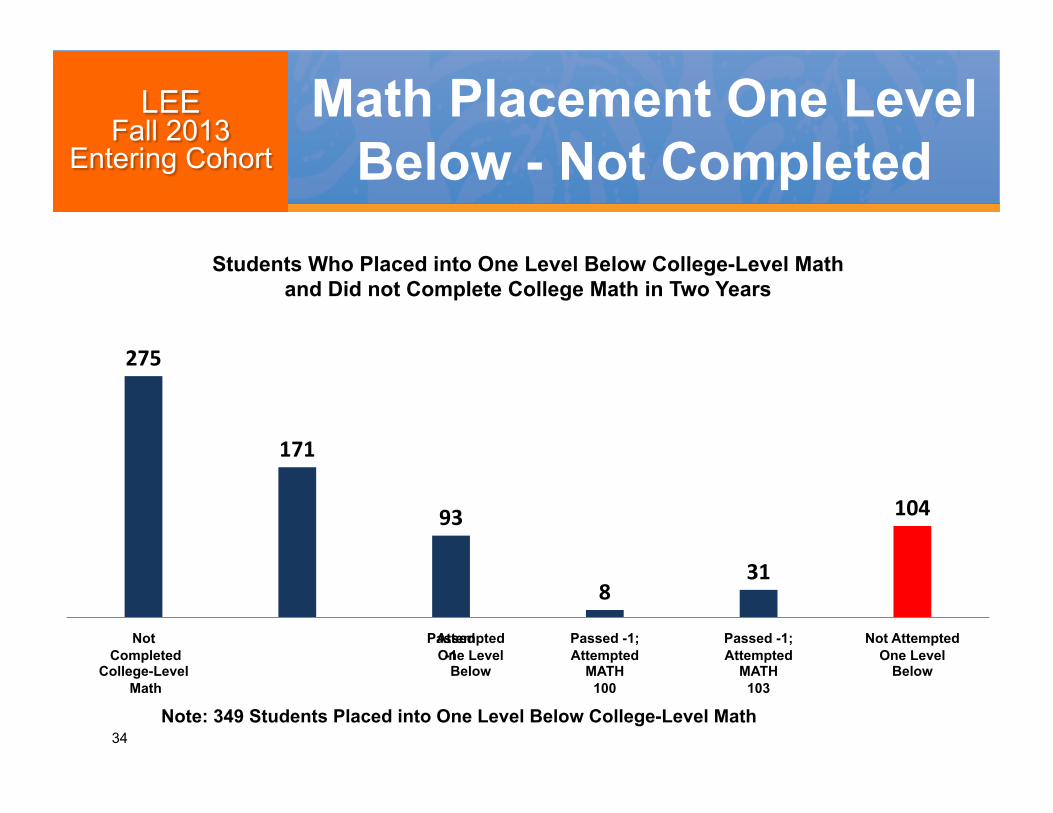
34 Note: 349 Students Placed into One Level Below College-Level Math
275
171
93
8 31
104
Not Completed
College-Level Math
Attempted One Level
Below
Passed -1
Passed -1; Attempted
MATH 100
Passed -1; Attempted
MATH 103
Not Attempted One Level
Below
Students Who Placed into One Level Below College-Level Math and Did not Complete College Math in Two Years
Math Placement One Level Below - Not Completed

35
Entered Two Levels Below Completed College Level Math in:
Fall 2013
Spring 2014
Fall 2014
Spring 2015
College Level
Completion
HAW (460) 0% 3% 3% 2% 8% HON (177) 0% 6% 4% 1% 10% KAP (302) 0% 0% 1% 1% 3% KAU (112) 4% 6% 6% 3% 19% LEE (733) 0% 2% 2% 2% 7% MAU (342) 1% 0% 3% 1% 5% WIN (91) 3% 7% 5% 0% 15% UHCC (2,217) 0% 2% 3% 2% 7%
2013 Entering Cohort
Math Placement Two Levels Below - Completed

36
Note: 733 Students Placed into Two Levels Below College-Level Math
686
434
319
211
95 9 25
252
Not Completed
College-Level Math
Attempted Two Levels
Below
Passed -2
Passed -2; Attempted
-1
Passed -1 Passed -1; Attempted MATH
100
Passed -1; Attempted MATH
103
Not Attempted Two Levels
Below
Students Who Placed into Two Levels Below College-Level Math and Did not Complete College Math in Two Years
Math Placement Two Levels Below – Not Completed

37
Math Placement Three Levels Below - Completed
Entered Three or More Levels Below Completed College Level Math in:
Fall 2013
Spring 2014
Fall 2014
Spring 2015
College Level
Completion
HAW (192) 0% 0% 0% 0% 0% HON (322) 0% 0% 1% 1% 3% KAP n/a n/a n/a n/a n/a KAU (51) 2% 0% 4% 2% 8% LEE (63) 0% 0% 0% 0% 0% MAU n/a n/a n/a n/a n/a WIN (197) 0% 1% 2% 1% 4% UHCC (825) 0% 0% 1% 1% 3%
2013 Entering Cohort

38
Math Placement Three Levels Below – Not Completed
Note: 63 Students Placed into Three Levels Below College-Level Math
63
0 0 0 0 0 0 0 0
63
Not Completed
College-Level Math
Attempted Three Levels
Below
Passed -3
Passed -3;
Attempted -2
Passed -2
Passed -2;
Attempted -1
Passed -1
Passed -1;
Attempted MATH
100
Passed -1;
Attempted MATH
103
Not Attempted Three or More
Levels Below
Students Who Placed into Three Levels Below College-Level Math and Did not Complete College Math in Two Years
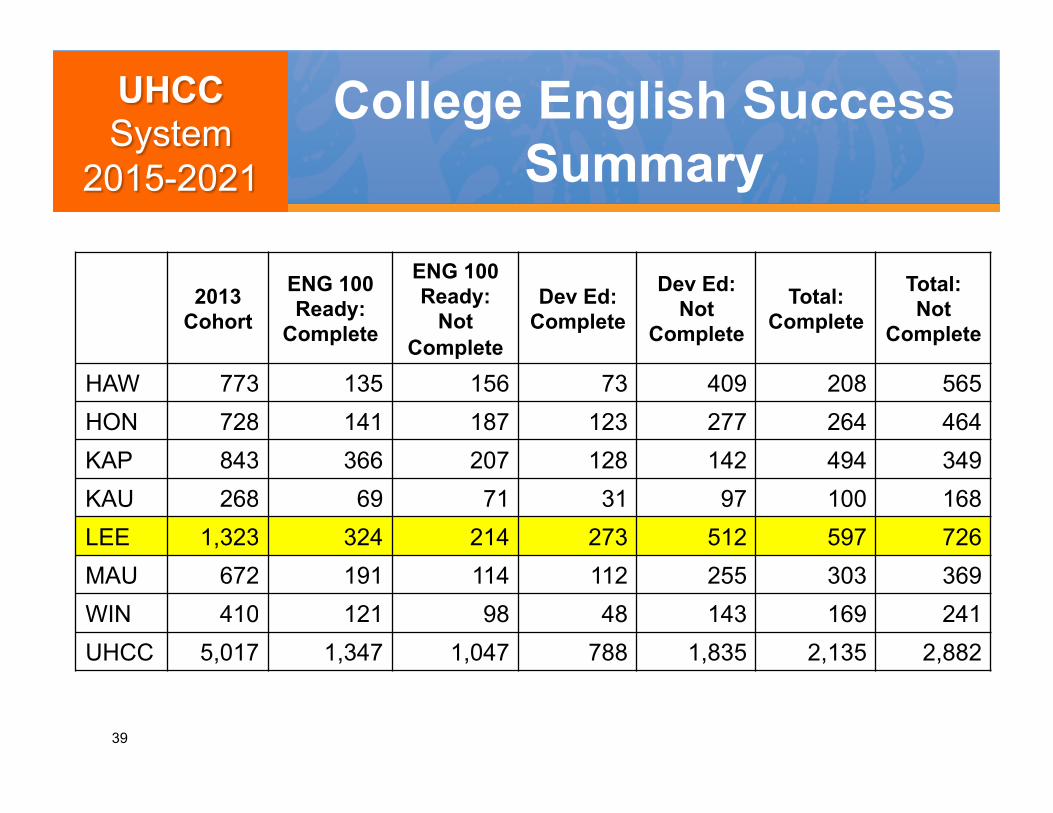
College English Success Summary
39
2013 Cohort
ENG 100 Ready:
Complete
ENG 100 Ready:
Not Complete
Dev Ed: Complete
Dev Ed: Not
Complete
Total: Complete
Total: Not
Complete
HAW 773 135 156 73 409 208 565 HON 728 141 187 123 277 264 464 KAP 843 366 207 128 142 494 349 KAU 268 69 71 31 97 100 168 LEE 1,323 324 214 273 512 597 726 MAU 672 191 114 112 255 303 369 WIN 410 121 98 48 143 169 241 UHCC 5,017 1,347 1,047 788 1,835 2,135 2,882

40
Entered College Ready Completed College Level English in:
Fall 2013
Spring 2014
Fall 2014
Spring 2015
College Level
Completion
HAW (291) 33% 10% 2% 1% 47% HON (328) 36% 6% 1% 0% 43% KAP (573) 55% 6% 2% 1% 64% KAU (140) 45% 3% 1% 0% 49% LEE (538) 49% 6% 4% 2% 61% MAU (305) 52% 8% 2% 1% 63% WIN (219) 45% 7% 2% 2% 55% UHCC (2,394) 46% 7% 2% 1% 56%
2013 Entering Cohort
English Placement College Level – Completed

41
Entered One Level Below Completed College Level English in:
Fall 2013
Spring 2014
Fall 2014
Spring 2015
College Level
Completion
HAW (258) 1% 13% 6% 2% 22% HON (159) 16% 16% 4% 3% 40% KAP (270) 19% 18% 8% 3% 47% KAU (96) 2% 17% 4% 6% 29% LEE (480) 13% 23% 5% 3% 43% MAU (195) 13% 19% 4% 3% 38% WIN (109) 5% 25% 6% 2% 38% UHCC (1,567) 11% 19% 5% 3% 38%
2013 Entering Cohort
English Placement One Level Below – Completed

42 Note: 480 Students Placed into One Level Below College-Level English
274
159
71 35 36
115
Not Completed
ENG100
Attempted One Level Below
Passed -1
Passed -1; Attempted ENG100
Passed -1;
Not Attempted ENG100
Not Attempted
One Level Below
Students Who Placed into One Level Below College-Level English and Did not Complete ENG 100 in Two Years
ENG Placement One Level Below – Not Completed

43
Entered Two Levels Below Completed College Level English in:
Fall 2013
Spring 2014
Fall 2014
Spring 2015
College Level
Completion
HAW (95) 0% 1% 6% 3% 11% HON (161) 7% 17% 7% 1% 32% KAP (n/a) n/a n/a n/a n/a n/a KAU (32) 0% 6% 3% 0% 9% LEE (248) 0% 13% 8% 2% 24% MAU (83) 4% 11% 7% 4% 25% WIN (72) 0% 3% 1% 6% 10% UHCC (691) 2% 11% 7% 2% 22%
2013 Entering Cohort
English Placement Two Levels Below - Completed

44 Note: 248 Students Placed into Two Levels Below College-Level English
189
65
25 13 2 2 0
124
Not Completed
ENG100
Attempted Two Levels
Below
Passed -2
Passed -2;
Attempted -1
Passed -1
Passed -1;
Attempted ENG100
Passed -1;
Not Attempted ENG100
Not Attempted Two Levels
Below
Students Who Placed into Two Levels Below College-Level English and Did not Complete ENG 100 in Two Years
ENG Placement Two Levels Below – Not Completed

45
Entered Three or More Levels Below Completed College Level English in
Fall 2013
Spring 2014
Fall 2014
Spring 2015
College Level
Completion
HAW (129) 0% 1% 2% 2% 5% HON (80) 0% 4% 4% 3% 10% KAP (n/a) n/a n/a n/a n/a n/a KAU (n/a) n/a n/a n/a n/a n/a LEE (57) 0% 0% 9% 5% 14% MAU (89) 0% 3% 9% 7% 19% WIN (10) 0% 0% 0% 0% 0% UHCC (365) 0% 2% 5% 4% 11%
2013 Entering Cohort
English Placement Three Levels Below - Completed

46 Note: 57 Students Placed into Three Levels Below College-Level English
49
36
27
5 1 0 0 0 0
13
Not Completed
ENG100
Attempted Three Levels
Below
Passed -3
Passed -3;
Attempted -2
Passed -2
Passed -2;
Attempted -1
Passed -1
Passed -1;
Attempted ENG100
Passed -1; Not
Attempted ENG100
Not Attempted
Three or More Levels Below
Students Who Placed into Three Levels Below College-Level English and Did not Complete ENG 100 in Two Years
ENG Placement Three Levels Below – Not Completed

47
Committee Convener/s Members Meeting Dates
Policy-Time to Degree
Peter Quigley Brenda Ivelisse Cheryl Chappell-Long Jim Dire Jonathan Kalk Katy Ho Louise Pagotto Suzette Robinson
7/22/15
Assessment Options: a) Cognitive Math, Reading/Writing, b) Non-Cognitive
Debbie Nakama Brenda Ivelisse
HAW-Gwen Kimura, Reshela DuPois, Robert Duley HON-Katy Ho. Shanon Miho, Silvan Chung, Jeff Stearns, Jerry Saviano KAP-Veronica Ogata, Sheldon Tawata, Kristie Malterre, Krista Hiser KAU-Patricia McGrath MAU-Kristine Korey-Smith, Catherine Bio, Christine Vorhies, Melissa Yoshioka WIN-Ardis Eschenberg UH SYS-Cheryl Chappell-Long, Dan Doerger, Suzette Robinson, Peter Quigley JUST FYI-Louise Pagotto/Kap, Lara Sugimoto/Hon
9/23
Case Management: Coaching, Counseling and other Wrap Around Services
Earl Nishiguchi Cathy Bio Curtis Washburn
HAW-Beth Sanders HON-Wayne Sunahara KAP-Brenda Ivelisse KAU-Wade Tanaka MAU-Cathy Bio
Changing the Culture through Professional Development
Joni Onishi, Jason Cifra Ardis Eschenberg
HON-Mieko Matsumoto KAP-Leigh Dooley KAU-Cammie Matsumoto LEE- Della Anderson, Cindy Martin WIN-Ellen Ishida-Babineau
7/29/15 10/14/15

48
Committee Convener/s Members Meeting Dates
Curriculum Development English Corequisite
Katy Ho HAW-Billie Jones, Deseree Salvador, Caroline Naguwa/CTE HON-Jeff Stearns, Jerry Saviano KAP-Reid Sunahara, Lisa Kanae KAU-Jeff Mexia, Brian Cronwall LEE-Lani Uyeno, Michelle Igarashi/CTE MAU-Eric Engh, Morgan Andaluz WIN-Jenny Webster
8/4/15 8/31/15 Writing
Curriculum Development Math Corequisite
Louise Pagotto, Jonathon McKee James Dire
HAW-Toni Cravens, James Schumaker, Robert Yamane/CTE HON-Femar Lee, Sterling Foster, Michael Kaczmarski KAP-Austin Anderson, Evan Yoshimura KAU-Jonathan Kalk, Loni Delaplane, Erin Millard LEE-Eric Matsuoka, Jenny Watada MAU-Samantha Bowe, Donna Harbin, Kate Acks WIN-Clayton Akatsuka, Navtej Singh
8/20/15
Data and Predictive Analytics Measures
Cheryl Chappell-Long
HAW-Grace Funai , Jason Cifra UH SYS-Dan Doerger, Melissa Tome, David Mongold, Sam Prather LEE-Laurie Lawrence
7/15/15, 10/22
Enrollment Management: Banner, FA, Registration, Veterans
Lara Sugimoto HAW-Dorinna Manuel-Cortez HON-Josephine Stenberg, Preshess Willets-Vaquillar, Jannine Oyama LEE-Harriet Miyasaki MAU-Kilohana Miller, Cathy Bio WIN-Geri Imai UH SYS-Melissa Tome, David Mongold
7/31, 10/7
Comprehensive Reform
49
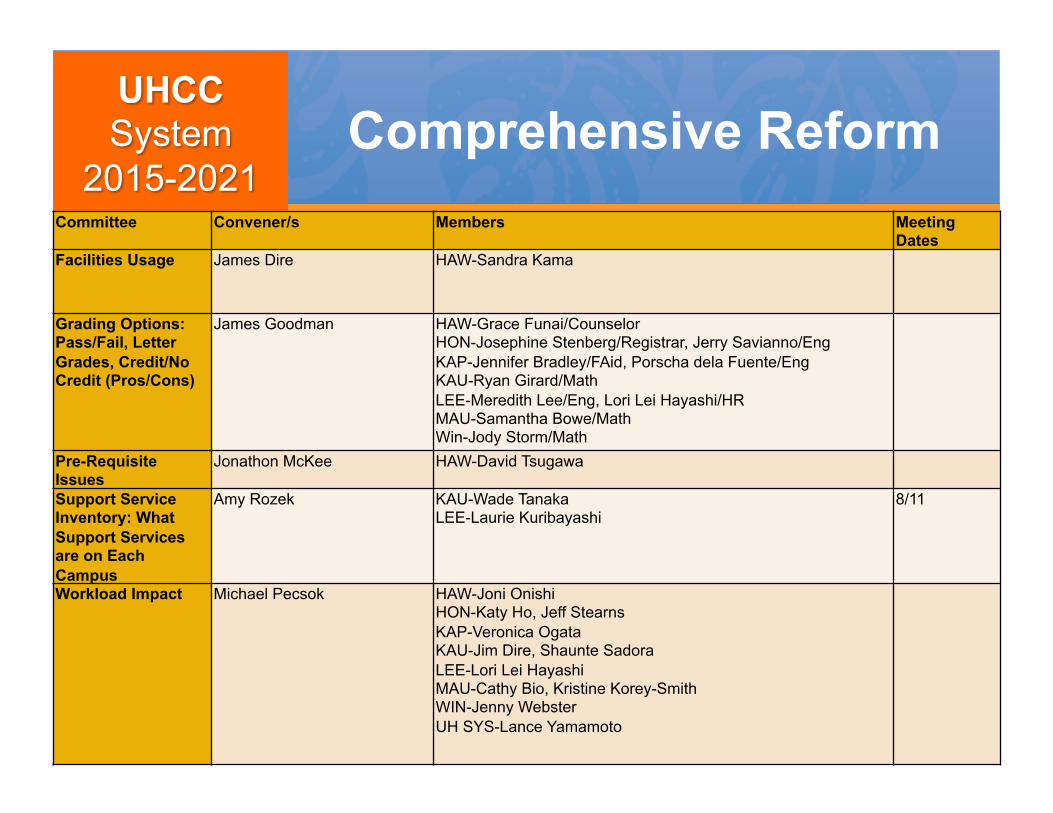
Committee Convener/s Members Meeting Dates
Facilities Usage James Dire HAW-Sandra Kama
Grading Options: Pass/Fail, Letter Grades, Credit/No Credit (Pros/Cons)
James Goodman HAW-Grace Funai/Counselor HON-Josephine Stenberg/Registrar, Jerry Savianno/Eng KAP-Jennifer Bradley/FAid, Porscha dela Fuente/Eng KAU-Ryan Girard/Math LEE-Meredith Lee/Eng, Lori Lei Hayashi/HR MAU-Samantha Bowe/Math Win-Jody Storm/Math
Pre-Requisite Issues
Jonathon McKee HAW-David Tsugawa
Support Service Inventory: What Support Services are on Each Campus
Amy Rozek KAU-Wade Tanaka LEE-Laurie Kuribayashi
8/11
Workload Impact Michael Pecsok HAW-Joni Onishi HON-Katy Ho, Jeff Stearns KAP-Veronica Ogata KAU-Jim Dire, Shaunte Sadora LEE-Lori Lei Hayashi MAU-Cathy Bio, Kristine Korey-Smith WIN-Jenny Webster UH SYS-Lance Yamamoto
Comprehensive Reform

50
College Algebra Coreq:
One Level Down
Math 88 (2 credits)
Math 103
College Math
Coreq: One Level
down
Math 78 (1 credit)
Math 100/111/115
College Algebra
Linear: Two Levels Down
Fall Math 82*: (4 cr) Math 82X (5 cr)
(Optional)
Spring Math 103
* Grade D in Math 82 gets one to Math 103 but with Math 88 as
corequisite
College Math Linear: Two Levels
Down
Math 75 (3 cr) Math 75X (4 cr)
(Optional) Open Enrollment
Spring Math 100/111/115
Statway/Quantway one year
Below 2 levels student counseled into non-STEM
Split semester optional where appropriate: e.g. 8 weeks of X then 8 weeks of Y
Finish college level math in one year
(Recommended by Math Ad Hoc Committee 8/20/15)

51
One Level Down Model Two or More Levels Down Model
All students enter into Eng 100; one level down gets a corequisite
activity; more than one level down receive two coreq activities
One Semester
22 Mixed class
100 Mixed class
19 Mixed class
22 Mixed class
One Year
100 in second
term
(Recommended by English Task Force 8/11/15)
English Models

52
Resolving Placement Models
Refining Models
CTE Math Sequencing
iCan Alternative for Weakest Students
Developing Consistent Support Systems
Scheduling
Professional Development
Outstanding Issues
53
Students perform better when presented with clear, focused pathway toward their goal
Pathways avoid random walks through curriculum with resulting “excess” credits and time to degree
Meta-majors help students select their ultimate path
Students will likely change paths
Paths should be focused on student’s ultimate goal which might be transfer baccalaureate
Guided Pathways
54
STAR is being transformed into a tool that can guide the student’s registration into their selected pathway
STAR-based registration and its related information will also inform colleges of student demand and student roadblocks
Registration interface is being completed this Fall
Guided Pathways
55
Guided Pathways

56
Guided Pathways
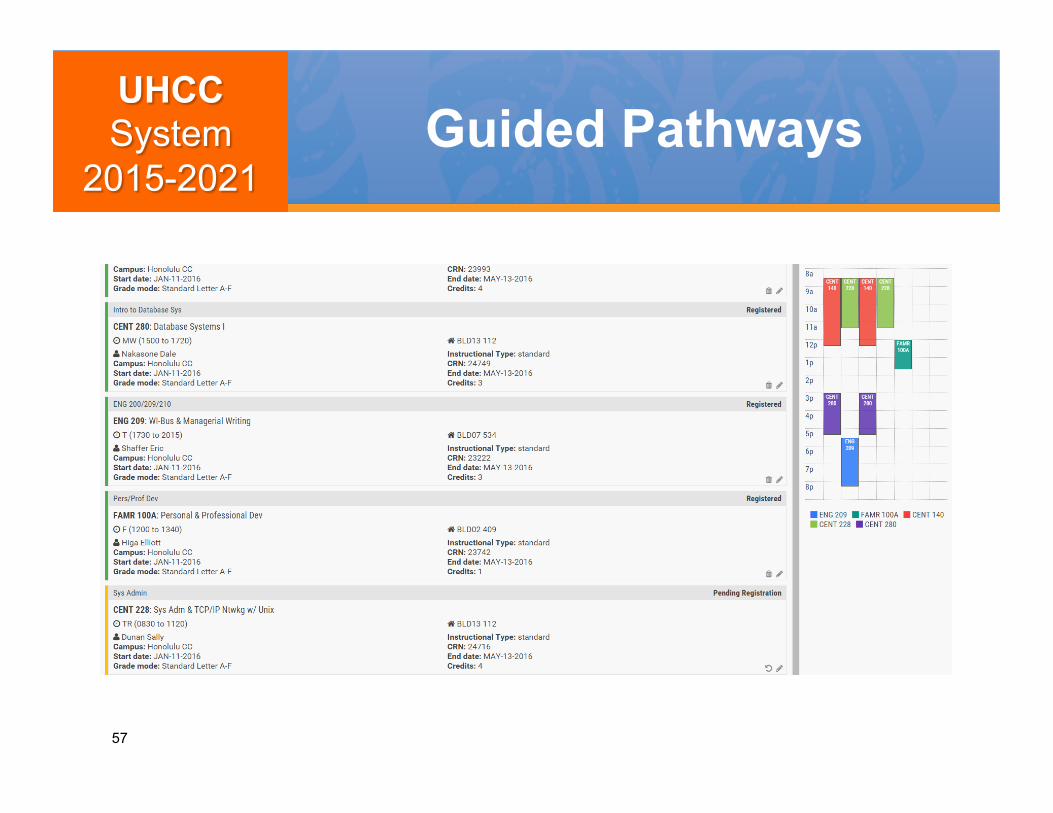
57
Guided Pathways

58
Guided Pathways

59
Final design tested at Honolulu CC in Fall 2015
All campuses will pilot test some pathways in Spring 2016
Full implementation in AY 2017
Guided Pathways

60
Alignment of offerings with pathways
Availability of pathway courses
Creation of meta-major pathways
Pathways that account for developmental education
Pathways that work for part-time as well as full-time students
Watch for hidden barriers
Guided Pathways Design Considerations
61
Private Scholarship Campaign - $1.5M per year
Third-Party Payers
Take advantage of community benefits programs like SNAP and Social Service Programs
Zero Cost Textbooks (Open Educational Resources [OER])
Eliminate Cost as a Barrier

62
UH Systemwide effort
UH Repository built
Leeward and Kapi’olani leading CC effort
Leeward offering 53 sections of $0 textbook costs in Fall 2015
Working to expand adoption by more faculty
Eliminate Cost as a Barrier
63
Developing sector-based workforce planning tool
Consolidating Services – financial aid, admissions, transcript evaluation
Creating a Grants Office
Focus on non-credit programs as revenue generation
UHCC System Native Hawaiian Council
Other Strategic Initiatives

The Journey Continues 64