The Journal of Nutritional Biochemistry · Walnuts are rich in omega-3 fatty acids, phytochemicals...
36
Changes in the Gut Microbial Communities Following Addition of Walnuts to the Diet Lauri O. Byerley, Derrick Samuelson, Eugene Blanchard IV, Meng Luo, Brittany N. Lorenzen, Shelia Banks, Monica A. Ponder, David A Welsh, Christopher M. Taylor PII: S0955-2863(17)30111-0 DOI: doi: 10.1016/j.jnutbio.2017.07.001 Reference: JNB 7802 To appear in: The Journal of Nutritional Biochemistry Received date: 6 February 2017 Revised date: 19 June 2017 Accepted date: 6 July 2017 Please cite this article as: Byerley Lauri O., Samuelson Derrick, Blanchard IV Eu- gene, Luo Meng, Lorenzen Brittany N., Banks Shelia, Ponder Monica A., Welsh David A, Taylor Christopher M., Changes in the Gut Microbial Communities Following Ad- dition of Walnuts to the Diet, The Journal of Nutritional Biochemistry (2017), doi: 10.1016/j.jnutbio.2017.07.001 This is a PDF file of an unedited manuscript that has been accepted for publication. As a service to our customers we are providing this early version of the manuscript. The manuscript will undergo copyediting, typesetting, and review of the resulting proof before it is published in its final form. Please note that during the production process errors may be discovered which could affect the content, and all legal disclaimers that apply to the journal pertain.
Transcript of The Journal of Nutritional Biochemistry · Walnuts are rich in omega-3 fatty acids, phytochemicals...
�������� ����� ��
Changes in the Gut Microbial Communities Following Addition of Walnuts tothe Diet
Lauri O. Byerley, Derrick Samuelson, Eugene Blanchard IV, Meng Luo,Brittany N. Lorenzen, Shelia Banks, Monica A. Ponder, David A Welsh,Christopher M. Taylor
PII: S0955-2863(17)30111-0DOI: doi: 10.1016/j.jnutbio.2017.07.001Reference: JNB 7802
To appear in: The Journal of Nutritional Biochemistry
Received date: 6 February 2017Revised date: 19 June 2017Accepted date: 6 July 2017
Please cite this article as: Byerley Lauri O., Samuelson Derrick, Blanchard IV Eu-gene, Luo Meng, Lorenzen Brittany N., Banks Shelia, Ponder Monica A., Welsh DavidA, Taylor Christopher M., Changes in the Gut Microbial Communities Following Ad-dition of Walnuts to the Diet, The Journal of Nutritional Biochemistry (2017), doi:10.1016/j.jnutbio.2017.07.001
This is a PDF file of an unedited manuscript that has been accepted for publication.As a service to our customers we are providing this early version of the manuscript.The manuscript will undergo copyediting, typesetting, and review of the resulting proofbefore it is published in its final form. Please note that during the production processerrors may be discovered which could affect the content, and all legal disclaimers thatapply to the journal pertain.

ACC
EPTE
D M
ANU
SCR
IPT
ACCEPTED MANUSCRIPT
1
Changes in the Gut Microbial Communities Following Addition of Walnuts to the Diet
Lauri O. Byerley1, $
Derrick Samuelson2
Eugene Blanchard IV3
Meng Luo3
Brittany N. Lorenzen1
Shelia Banks1
Monica A. Ponder4
David A Welsh2, 3
Christopher M. Taylor3
1 Department of Physiology, School of Medicine, Louisiana State University Health Sciences Center,
1901 Perdido St., New Orleans, LA 70112, [email protected],[email protected] 2 Department of Internal Medicine, School of Medicine, Louisiana State University Health Sciences
Center, 1901 Perdido St, New Orleans, LA 70112 [email protected], [email protected],
[email protected] 3 Department of Microbiology, Immunology and Parasitology, School of Medicine, Louisiana State
University Health Sciences Center, 1901 Perdido St., New Orleans, LA 70112, [email protected],
[email protected] 4 Department of Food Science and Technology, 401-D HABB1, Virginia Tech, Blacksburg, VA, United
States 24061, [email protected]
$ Corresponding author: Department of Physiology, School of Medicine, 1901 Perdido St., Louisiana
State University Health Sciences Center, New Orleans, LA 70112-1393 [email protected] 704-340-
4482

ACC
EPTE
D M
ANU
SCR
IPT
ACCEPTED MANUSCRIPT
2
Abstract
Walnuts are rich in omega-3 fatty acids, phytochemicals and antioxidants making them unique
compared to other foods. Consuming walnuts has been associated with health benefits including a
reduced risk of heart disease and cancer. Dysbiosis of the gut microbiome has been linked to several
chronic diseases. One potential mechanism by which walnuts may exert their health benefit is through
modifying the gut microbiome. This study identified the changes in the gut microbial communities that
occur following the inclusion of walnuts in the diet. Male Fischer 344 rats (n=20) were randomly
assigned to one of two diets for as long as 10 weeks: 1) walnut (W), and 2) replacement (R) in which the
fat, fiber, and protein in walnuts were matched with corn oil, protein casein, and a cellulose fiber
source. Intestinal samples were collected from the descending colon, the DNA isolated, and the V3-V4
hypervariable region of 16S rRNA gene deep sequenced on an Illumina MiSeq for characterization of the
gut microbiota. Body weight and food intake did not differ significantly between the two diet groups.
The diet groups had distinct microbial communities with animals consuming walnuts displaying
significantly greater species diversity. Walnuts increased the abundance of Firmicutes and reduced the
abundance of Bacteriodetes. Walnuts enriched the microbiota for probiotic-type bacteria including
Lactobacillus, Ruminococcaceae, and Roseburia while significantly reducing Bacteroides and
Anaerotruncus. The class Alphaproteobacteria was also reduced. Walnut consumption altered the gut
microbial community suggesting a new mechanism by which walnuts may confer their beneficial health
effects.
Key Words: Walnut; gut microbiome; diet

ACC
EPTE
D M
ANU
SCR
IPT
ACCEPTED MANUSCRIPT
3
1. Introduction
Several epidemiologic studies have linked eating tree nuts, such as walnuts, to living a longer,
healthier life [1-3]; however, the mechanism by which nuts impart this benefit has not been identified.
Eating walnuts has been associated with a reduced the risk of cardiovascular disease in humans [4],
slowing the rate of tumor growth in mice [5, 6], and maintaining brain health during aging [7].
Walnuts have been labelled a “superfood” because they are rich in the omega-3 fatty acid,
alpha-linolenic acid (ALA), as well as phytochemicals, antioxidants polyphenols, and fiber [8]. Which of
these components imparts the health benefits associated with eating walnuts is not clear. Walnuts are
one of the few foods that are rich in ALA. Also, walnuts contain approximately double the concentration
of phenols compared to other fruits and vegetables [9, 10] and have one of the highest concentration of
antioxidants [11, 12]. Dietary fiber content is 6 to 7% [13, 14] but the polysaccharide composition of the
fiber has not been well studied.
The importance of the gut microbiome on human health has been demonstrated recently in
several studies. The presence of distinct bacterial communities is linked to a number of chronic diseases
including heart disease [4], cancer [6], and brain health [7]. Clearly, diet composition influences the
relative abundance of bacterial communities present in the gut [15]. Nakanishi et al. [16] showed using
a mouse colon carcinogenesis model that inclusion of walnuts in the diet may partially protect against
colon cancer and suggest a possible mechanism may be the changing the gut microbiome. Mice with
the lowest number of tumors had a lower abundance of the Bacteriodetes and Lachnospiraceases
bacterial families, and a greater abundance of Ruminococcaceae and the Clostridium XIVa species
subcluster.
One mechanism by which walnuts may exert their health benefit is through modulating the gut
microbiome. The goal of this study was to determine if the inclusion of walnuts in the diet changed the

ACC
EPTE
D M
ANU
SCR
IPT
ACCEPTED MANUSCRIPT
4
gut microbiome and identify the changes in the gut microbial communities that occurred leaving future
studies to determine if this is a mechanism by which walnuts confer their health benefit.
2. Materials and Methods
2.1. Study Design
This study was approved by the Institutional Care and Use Committee at the Louisiana State
University Health Sciences Center (LSUHSC) in New Orleans, LA. Mature rats weighing more than 250 g
were studied. Upon arrival at the LSUHSC vivarium, 20 male Fischer 344 rats were group housed for one
week and maintained on rat chow (Harlan, Madison, WI) to allow them to adjust to their new
environment. After, each rat was weighed and randomly assigned to one of two diet groups: 1) walnut
(W), or 2) replacement (R). The diets are described under “Diets” and in Table 1. For the remainder of
the study, each rat was singly housed, weighed daily, and fed daily their assigned diet. The animals were
sacrificed six or ten weeks later and, at the time of sacrifice, fecal samples collected aseptically from the
descending colon, immediately frozen in liquid nitrogen and stored at -80° C until DNA isolation.
2.2. Diets:
The diets were identical to the diets previously reported by Hardman et al. (10). This diet is
based on the AIN-76 diet. Approximately 11 % by weight ground walnut per 100 g diet was added. Since
walnuts contain protein, fat, carbohydrate and fiber, these macro-nutrients were adjusted in the
replacement diet that contained no walnuts (Table 1) using the values for walnuts found in the USDA
nutrient database [14]. Corn oil and alphacel fiber were used to adjust the fat and fiber content
respectively of the replacement diet. The protein content was matched by increasing the casein in the

ACC
EPTE
D M
ANU
SCR
IPT
ACCEPTED MANUSCRIPT
5
replacement diet. All ingredients except the sugar, corn oil, and walnuts were purchased from Dyets
(Bethlehem, PA). The sugar and corn oil were purchased from a local grocery store in bulk (Albertsons,
Mandeville, LA). Shelled, whole walnuts were graciously provided by the California Walnut Commission
(Folsom, CA). To prevent deterioration once received, the walnuts were vacuumed sealed in 1 kg bags
and stored in a walk-in cooler maintained at -4° C. Each diet was made in small batches. At the time the
diet was made, the walnuts were ground to a fine state and mixed with the rest of the ingredients in an
industrial sized mixer (Hobart, Troy, OH). When the diet was the consistency of cookie dough, it was
rolled, vacuum sealed in small batches and frozen at -20° C until fed to the animals. At the time of
feeding, the diet was thawed, cut into 1-inch cubes, weighed and given to the animal. Every two days,
fresh diet was provided. The diets were analyzed for protein, fat, carbohydrate, fiber, ash and moisture
content by Covance Laboratories (Madison, WI). The total calorie content of each diet was determined
by multiplying each macronutrient by its appropriate kcal/g.
2.3 DNA Isolation and PCR Amplification
Total DNA was extracted from approximately 0.25 g of feces using a protocol developed by the
Louisiana State University School of Medicine Microbial Genomics Resource Group
(http://metagenomics.lsuhsc.edu/mgrg), as previously published [17]. Briefly, DNA was isolated using
the QIAamp DNA Stool Kits (Qiagen, Germantown, MD) modified to include bead-beating and RNAase
treatment steps.
2.4 Sequencing
The V3-V4 hypervariable region of 16S rRNA gene was PCR amplified using V3F =
CCTACGGGAGGCAGCAG and V4R = GGACTACHVGGGTWTCTAAT primers, Illumina adaptors and
molecular barcodes [18]. Illumina indexes were ligated onto each sample and samples were multiplexed

ACC
EPTE
D M
ANU
SCR
IPT
ACCEPTED MANUSCRIPT
6
for sequencing on a single Illumina MiSeq run using the Illumina V3 600-cycle sequencing kit (Illumina,
San Diego, CA) in paired-end mode as previously published [17].
2.5 Quality filtering/Picking
Due to persistent read quality issues with the reverse sequencing reads from Illumina V3
sequencing kits, the forward reads files were processed through the UPARSE pipeline [19] and reverse
reads were discarded. Reads were truncated to a uniform length of 280bp and reads with quality scores
less than 16 were filtered out. The UPARSE pipeline steps described by Edgar were performed in
sequence and OTU clusters were formed at 97% with chimeric OTUs removed from the data. After
quality filtering, reads were analyzed using QIIME 1.9.0 [20].
2.6 Microbial Community Analysis
A total of 20 samples were included in the QIIME analysis with read counts ranging from 14628
to 90465 with an average read count per sample of 56041. Alpha rarefaction was performed at a level
of 14600 reads to include all samples.
2.7 Statistical analysis
Alpha rarefaction plots were produced by plotting the number of sequences in a sample against
several different diversity metrics, for example, Shannon, Simpson, and Chao1. Beta diversity was
determined by principal coordinate analysis using both unweighted and weighted UniFrac metrics.
Emperor 3D viewer was used to visualize the plots. Statistical difference was determined using SAS
software (Cary, NC) or GraphPad Prism 6 (La Jolla, CA). Student’s T- test was used to determine
statistical significance between two groups using p<0.05 as a cutoff. Mann-Whitney-Wilcoxon was used
ACC
EPTE
D M
ANU
SCR
IPT
ACCEPTED MANUSCRIPT
7
to determine significant differences for specific microbial communities between each diet and any p-
value less than 0.05 is shown. The p-value was not corrected for multiple comparisons; instead the
actual value was reported. Data are presented as a mean + standard error of the mean (SEM). In Table 2,
only significantly different organisms present in 5 or more animals are shown.
Potential microbial functions were identified by PICRUst v0.9.0 (http://picrust.github.io/picrust/)
[21]. Following PICRUst analysis the potential microbial functions associated with walnut consumption
were identified by LEfSe (Linear Discriminant Analysis Effect Size)
(http://huttenhower.sph.harvard.edu/lefse/) as described elsewhere [22]. An LDA score was generated
using linear discriminate analysis for KEGG (Kyoto Encyclopedia of Genes and Genomes) pathways. LDA
is a classification method that searches for linear combinations of variables (predictors) that best
separate two classes (walnut vs replacement diet).
3. Results
3.1. Animal Weight and Food Intake
Average body weight did not differ significantly between the two diet groups at the start of the
study (data not shown). Regardless of diet consumed, the animals grew at a similar rate (0.91 + 0.1
g/day). This indicates that the addition of walnuts to the diet did not increase body weight more than
the replacement diet. At the time of sacrifice, the animals weighed 340 + 24 g walnut diet and 340 + 24 g
replacement diet (Figure 1A).
The composition of the two diets is shown in Table 1. The replacement diet was slightly higher
in calories than the walnut diet (walnut: 3.48 kcal/g vs. replacement: 3.57 kcal/g, p=.96). To make up for
the difference in calories, the animals eating the walnut diet consumed ad libitum slightly more food (W:

ACC
EPTE
D M
ANU
SCR
IPT
ACCEPTED MANUSCRIPT
8
15.4+2.6 g/day vs. R: 14.9+2.0 g/day, p=.96) so caloric intake was remarkably similar and not
significantly different between the two diet groups throughout the study (Figure 1B).
3.2 Gut Microbiome
The alpha diversity for walnut and replacement diets are shown in Figure 2. Adding walnuts to
the diet significantly increased bacterial diversity measured by Shannon’s (p=0.018) and Simpson’s (not
shown, p=0.013) indices. However, Chao1 diversity was not different between the two groups. Thus,
there was a significant increase in community evenness (Shannon’s and Simpson’s) for those animals
eating the walnut diet compared to the replacement diet, but not in richness (Chao1, p=0.77).
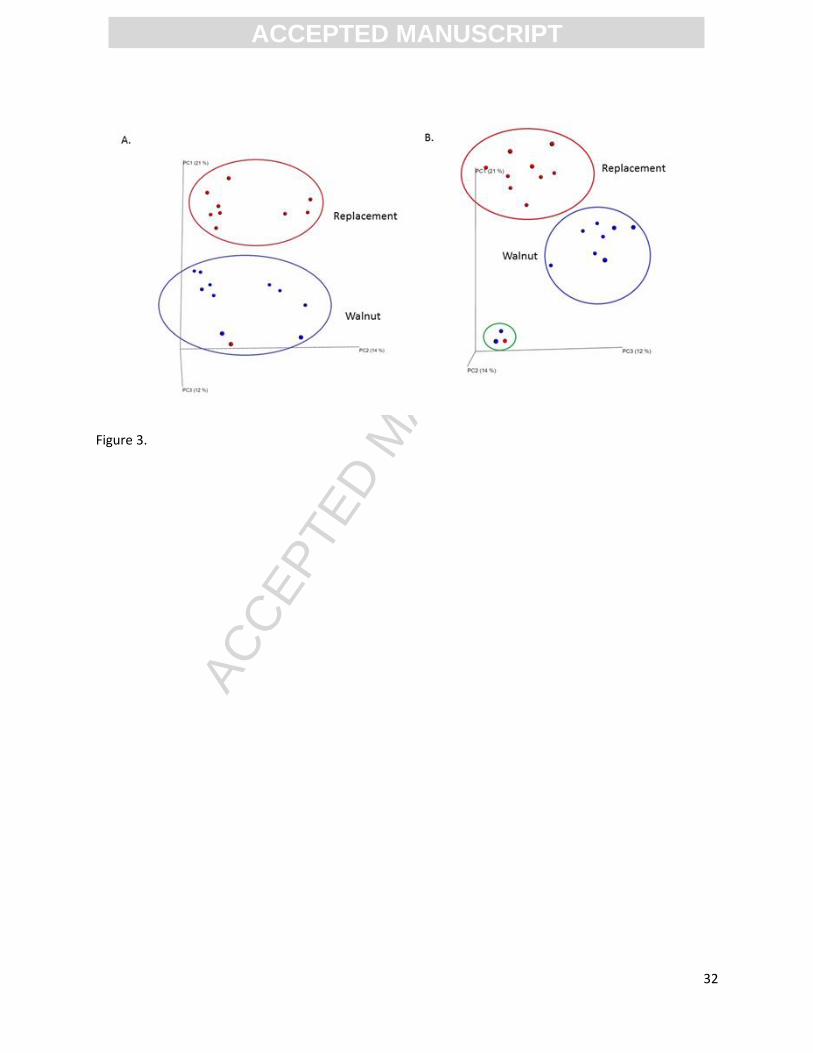
Beta diversity (Principal Coordinate Analysis plots) for walnut and replacement diets are shown
in Figure 3. As demonstrated by unweighted UniFrac analysis, clear, distinct clustering was observed
between the two diet groups. Beta diversity for walnut and replacement diets were significantly
different using both unweighted (p=0.0003) and weighted UniFrac analysis (data not shown, p=0.002).
Figure 3B rotates the plane, keeping PC1 in the ”Y” axis position and exchanging the PC2 and
PC3 between the “X” and “Z” axis. By rotating the plane, it becomes clearly evident that there are three
rats which group together by beta diversity metrics, two of which were from the walnut group (one six
week and one 10 week sacrifice) and one of which was from the replacement group (six week sacrifice).
There is no clear explanation for the overlap of these three animals. Each animal was individually housed
and fed separately.
The changes in operational taxonomic units for the bacterial phyla are shown in Figure 4A
(walnut diet) and 4B (replacement diet). The pie charts in Figure 4A and 4B demonstrate that the
addition of walnut to the diet changed the bacterial communities present in the descending colon. At
the phylum level, the abundance of Firmicutes and Bacteriodetes were significantly different between
the two diets. As expected, the preponderance of bacteria belonged to these two phyla made up more

ACC
EPTE
D M
ANU
SCR
IPT
ACCEPTED MANUSCRIPT
9
than 90% of the bacteria present in the lower colon. While Figure 4A and 4B show that the walnut
group had no Lentisphaerae, there was one animal in the replacement diet with organisms from this
phyla, and there was no significant difference between the two diets. Figure 4C shows the ratio of
Firmicutes to Bacteriodetes in the walnut and replacement diet fed rats. The animals that ate walnuts
had a significantly greater (>1.8 fold) ratio of Firmicutes to Bacteriodetes when compared to the
replacement diet.
The twenty-five most abundant bacteria communities for each diet at the genus level are shown
in Figure 5. The twenty-five predominant microbes at the genus level were derived from five different
phyla, seven different classes, nine different orders, and seventeen different families. Bacteroides and
Coprococcus were significantly more abundant after eating the replacement diet while Oscillopira,
Lachnospiraceae, and Turicibacter were significantly more abundant after long-term, continuous
consumption of walnuts.
Table 2 lists the significant shifts in the relative abundance of various bacteria following long-
term continuous consumption of modest amounts of walnuts daily. Animals consuming walnuts had a
greater relative abundance of the phyla Firmicutes and the smaller communities of Actinobacteria and
Cyanobacteria. Although an increase in the Firmicutes phyla was observed, within the phyla particular
taxa increased and decreased. Within the Firmicutes phyla, significant changes in the Bacilli,
Erysipolotrichi, and Clostridia were observed. The Bacilli class includes the Lactobacillus family, which
produce lactic acid. The species L. Reuteri had a three-fold higher relative abundance following walnut
consumption. In addition, Turicibacteriaceae increased approximately three-fold. The Lactobacillales
order also contains the family Carnobacteriaceae whose relative abundance significantly decreased.
Both increases and decreases were observed in the relative abundance of specific members of
Clostridia, which is known for its butyrate-production. Increases were seen in Oscillospira, Moyella,
Roseburia, Peptococeaceae, and Ruminacoccaecea. Alternatively, some members of this class were

ACC
EPTE
D M
ANU
SCR
IPT
ACCEPTED MANUSCRIPT
10
reduced by the addition of walnuts to the diet. These included Anaerotruncus, Dehalobecteriaciae,
Blautia and Coprococus. The relative abundance of Erysipelotrichi class decreased.
The Cyanobacteria phyla also saw increases and decreases in the relative abundance of specific
members. The Streptophyta order increased more than tenfold while the 4COD-2 decreased almost
three-fold. Bacteroidetes, Proteobacteria, and Tenecutes were significantly reduced following walnut
consumption. At the genus level, the reductions in Bacteroides, which make up a substantial portion of
this phylum, was more than two-fold. Within the Proteobacteria family, Alphaproteobacteria and
Gammaproteobacteria saw reductions. Members Anaeroplamalaes and ML615j-28 were reduced
within the Tenericutes phyla.
3.3 Predicted Metagenome Inference
Figure 6 shows the different inferred functional capacities ranked by effect size associated with
the bacterial communities present in the colon of animals eating the walnut (green) or replacement diet
(red). Nine pathways were more dominant when walnuts were included in the diet. Three pathways
involved amino acid metabolism and two pathways focused on omega-3 and omega-6 fatty acid
metabolism. Three pathways were more dominant following long-term continuous consumption of the
replacement diet. Two of these pathways involved products synthesized from amino acids. The amino
acid tryptophan is implicated in both diets but different metabolic pathways. For the animals eating
walnuts, the pathways for producing tryptophan products such as serotonin were more prominent while
tryptophan pathways involved with indole alkaloid biosynthesis were predominant in the replacement
diet animals. Thus the relative abundance of bacterial communities significantly altered the inferred
functional capacity of the microorganisms in the gut.

ACC
EPTE
D M
ANU
SCR
IPT
ACCEPTED MANUSCRIPT
11
4. Discussion
The walnut and replacement diets have several notable differences. The fiber, protein, fat and
carbohydrate found in walnuts were substituted to make the replacement diet eucaloric and similar in
macronutrient content. It was not the intent of this study to determine the impact of individual
constituents but to examine walnuts as a whole since humans eat whole walnuts. First, Alphacel, a 99%
cellulose based fiber, was used to replace the fiber in walnuts as it is readily available and the type of
fiber present in walnuts has yet to be identified. Second, walnuts contain a mixture of polyunsaturated
and monounsaturated fats and are one of the few plant foods that contain the anti-inflammatory
omega-3 fatty acids. The fat content of the replacement diet was corn oil, which is high in
polyunsaturated fatty acids and lack omega-3 fatty acids. Third, casein was the protein source for both
diets, and this was increased slightly in the replacement diet. There have been several reviews recently
published that have discussed the role of individual nutrients on gut microbiome composition [15]. Most
likely these macronutrients and fiber were involved in producing the unique bacterial signature
observed for with walnut diet.
Deep 16S rDNA sequencing found significant differences in the gut microbial communities of
rats administered walnuts compared to rats consuming the replacement diet. There was a clear, distinct
separation between the two diets with walnuts significantly increasing community diversity driven by an
increase in evenness of bacterial species. These same changes were observed by Nakanishi et al. who
fed walnuts to mice [16]. Also, De Filippo et al. [23] found higher microbial diversity in children from
Burkina Faso who ate a diet higher in whole grains, legumes and vegetables compared to European
children whose diet contained more animal-based foods. However, children who consumed 1.5 oz. of
almonds or an equivalent amount of almond butter for three weeks did not change their gut microbial
diversity as measured by Shannon’s or Simpson’s [24].

ACC
EPTE
D M
ANU
SCR
IPT
ACCEPTED MANUSCRIPT
12
Walnut consumption shifted the predominant microbe phyla from Bacterodites to Firmicutes.
Other studies have shown a greater relative abundance of Firmicutes in the young, but that the
predominance of this phylum declines, while the abundance of Bacterodites increases, with age [25].
Shifts in these two phyla have been associated with obesity, as well. Generally, obese individuals have a
greater abundance of Firmicutes and lower amount of Bacteriodetes although these changes may be
related more to a high fat, obesogenic diet than excessive adipose [26]. The fat content of the diet used
in this study was approximately 5%, very low compared to the high fat (>40%) used to induce obesity in
laboratory animals. Based on our current understanding of these phyla shifts, the increased abundance
of Firmicutes microbes seen when walnuts are incorporated continuously long-term into the diet may
not be perceived as beneficial, but the animals consuming walnuts had greater microbial diversity than
those animals on the replacement diet. Microbial diversity has been associated with better health
outcomes, and this shift may be more important than the relative abundance of the Firmicutes and
Bacteriodetes phyla. Low bacterial diversity has been linked to obesity and inflammatory bowel disease
[27, 28].
The major shift within the phylum Bacteriodetes was a decrease in the genus Bacteroides. A
reduction in Bacteroides and increase in Firmicutes has been observed in response to the addition of
whole grains to the diet [29]. Very few studies have investigated the effect of tree nuts on the gut
microbiome. Burns et al. [24] found no changes at the phylum and family level following the addition of
1.5 oz. almonds to the diet for three weeks while Ukhanova et al. [30] found significant changes at the
phylum and genus level when twice the dose of almonds was provided. Although walnuts and almonds
are both considered tree nuts, they are distinctly different in composition. Walnuts contain less fiber
but more phytochemicals/antioxidants and omega-3 fatty acids. Given this, a differential effect on the
gut microbial community is not surprising.

ACC
EPTE
D M
ANU
SCR
IPT
ACCEPTED MANUSCRIPT
13
Very little is known about the impact of nuts on the gut microbiome, but the available evidence
strongly suggests that tree nuts alter gut microbial communities. Two human studies have been
published on almonds [24, 30]. Only one report has examined the impact of walnuts on the gut
microbiome, and this study used a carcinogenesis model to produce colon cancer [16]. In humans,
Ukhanova et al. [30] found almonds significantly modulated the microbiota at the phylum and genus
levels and increased the relative abundance of butyrate produces, but not the number of lactate
producers (Lactobacillidus or Bifidobacteria). Burns et al. [24] found almonds only modified the gut
microbiome at the genus level. Several genera were altered but only one change was similar to walnuts;
Turicibacter increased. One notable difference between the two almond studies was the dose of
almonds consumed each day: 3 oz/day [30] vs. 1.5 g/day [24], respectively.
Nakanishi et al. [16] fed three levels of walnuts, 5.2%, 10.5%, 21.1 % of total calories to mice
chemically induced to grow colon cancers. They reported an increase abundance of Firmicutes,
including Lactobacillus, Clostridiales, Clostridium, Lachnospiraceae and Ruminococcaceae. We found a
similar bacterial signature except Clostridium was not significantly different between the two groups in
the current study. There are several plausible reasons for this as there may have been an interaction
between diet and the carcinogenesis model. Nakanishi et al. [16] found carcinogen treatment reduced
microbe diversity and richness of the gut, so this could be one plausible explanation, as xenobiotics can
alter the relative abundance of gut bacteria [31]. A second explanation could be a difference in the
animal species. Nakanishi’s model used mice while our study used rats. Finally, the bacterial signature
observed in Nakanishi’s study may be the result of inflammation-associated with colon tumorigenesis
because changes have been reported by others studying colon carcinogenesis [32]. The animals in our
study were healthy without known pathology.

ACC
EPTE
D M
ANU
SCR
IPT
ACCEPTED MANUSCRIPT
14
Gut microbes produce many lipids with biological activity. For example, Lactobacillus and
Bacteroides mediate synthesis of secondary bile acids and important components of lipid transport [33].
Walnuts increased both Lactobacillus and Bacteroides after long-term continuous consumption
compared to the replacement diet.
Prebiotics are dietary substances that selectively promote proliferation and/or activity of
“beneficial” colonic bacteria. Typically targeted are the genera Bifidobacterium and Lactobacillus, but
there are several emerging probiotic candidates: Ruminococcus bromii, Roseburia intestinalis,
Eubacterium rectale and Faecalibactruim prausnitzii [34, 35]. Adding walnuts to the diet increased
Lactobacillus, Ruminococcus, and Roseburia suggesting a prebiotic role for walnuts; some part of the
walnut escaped assimilation in the small intestine and was fermented in the colon or events in the upper
tract migrated downstream, positively altering the composition of the gut microbiome.
The addition of walnuts to the diet shifted the relative abundance of the inferred functional
capacities of the microbial communities. Twelve KEGG metabolic pathways were affected. Further
studies targeted at understanding these changes are needed since it is not clear if these changes are
important for the microbes to flourish when walnuts are added to the diet and if there is an added host
benefit. The greater functional capacity to degraded branch chain amino acids was suggested by the
shift in relative abundance of microbes in the animals eating walnuts. Most likely this is related to the
shifts in relative abundance of the microbes and their associated metabolic capacities. The diets were
matched for protein content (Table 1) and the amino acid composition was similar (data not shown).
Metabolomic studies have recently suggested branch chain amino acids may play a role in type 2
diabetes, fatty acid metabolism, and immunity [36-38].
Functional capacity for tryptophan metabolism was also increased with long-term consumption
of walnuts in the diet. Tryptophan catabolism has been implicated in modulating the delicate balance

ACC
EPTE
D M
ANU
SCR
IPT
ACCEPTED MANUSCRIPT
15
between the immune system’s response to pathogens and non-harmful antigens [39]. Also, the
tryptophan metabolism pathway is known for serotonin, melatonin and niacin synthesis. Several
recently published studies have linked gut microbes to brain health. Yano et al. showed that microbes
indigenous to the gut can regulate host serotonin biosynthesis [40]. Several studies have been published
suggesting walnuts can improve brain functions [7]. The connection between our observation and these
other studies needs further investigation.
Both arachidonic and alpha-linolenic acid metabolism pathways were increased by continuous
walnut consumption. Walnuts are an excellent source of omega-3 fatty acids, particularly alpha-linoleic
acid. The KEGG arachidonic acid metabolism pathway involves the production of eicosanoids, for
example, prostaglandins, prostacyclin, thromboxanes and 5-HETE, leukotrienes, 15-HPETE, 12-HETE,
hepoxillins, and anandamide. These are inflammatory-modulating molecules. At the same time, the
metabolic pathways for alpha-linolenic acid are also more prevalent. Omega-3 fatty acids are generally
considered anti-inflammatory. This KEGG pathway also produces a number of other molecules, like
volicitin, but the importance of these has not been clearly delineated.
The functional capacity of microbes to degrade limonene and pinene was significantly greater in
those animals consuming walnuts. Both these compounds are pheromones emitted by plants.
Limonene gives lemons their characteristic smell while pinene is the most dominant volatile emitted by
walnut trees [41]. Wang et.al. recently showed that Cyanobacteria have enhanced limonene production
[42] and several members of this phyla were significantly more abundant following long-term
continuous consumption of walnuts.

ACC
EPTE
D M
ANU
SCR
IPT
ACCEPTED MANUSCRIPT
16
5. Conclusion
In summary, we show that walnuts change the bacterial communities found in the descending
colon. We propose that reshaping of the gut microbe community may play a physiological role in
promoting walnut’s health benefits and this needs further exploration.
Abbreviations W: Walnut diet R: Replacement diet
Acknowledgments: We thank the Animal Resource Center at the LSU Health Sciences Center, New
Orleans, LA, for their help in conducting the study.
Funding: This work was supported by the American Institute for Cancer Research and California Walnut
Commission.
Authors’ contributions: LOB designed the study and oversaw its conduct in the Animal Resource Center
and her laboratory. MAP and SB provided the preliminary data that encouraged this study. BL
completed the day to day care of the animals and the laboratory assays. ML completed the amplicon
sequencing using fecal DNA isolated in LOB’s laboratory by SB and BL. CMT and EB performed the
bioinformatics analysis. CMT, DAW, and EB advised on the bioinformatics analysis. DS complete the
metagenomics analysis. LOB completed the other data analysis. LOB, CMT and DS wrote the manuscript
and DAW and MAP provided their expertise comment, as well as interpretation of the data, during the
preparation of this manuscript. All authors read and approved the final manuscript.
Conflicts of interests: The authors declare that they have no competing interests.

ACC
EPTE
D M
ANU
SCR
IPT
ACCEPTED MANUSCRIPT
17
References
[1] Bao Y, Han J, Hu FB, Giovannucci EL, Stampfer MJ, Willett WC, et al. Association of nut
consumption with total and cause-specific mortality. N Engl J Med. 2013;369:2001-11.
[2] Ellsworth JL, Kushi LH, Folsom AR. Frequent nut intake and risk of death from coronary heart
disease and all causes in postmenopausal women: the Iowa Women's Health Study. Nutrition,
metabolism, and cardiovascular diseases : NMCD. 2001;11:372-7.
[3] van den Brandt PA. The impact of a Mediterranean diet and healthy lifestyle on premature
mortality in men and women. Am J Clin Nutr. 2011;94:913-20.
[4] Kris-Etherton PM. Walnuts decrease risk of cardiovascular disease: a summary of efficacy and
biologic mechanisms. J Nutr. 2014;144:547s-54s.
[5] Akinsete JA, Ion G, Witte TR, Hardman WE. Consumption of high omega-3 fatty acid diet
suppressed prostate tumorigenesis in C3(1) Tag mice. Carcinogenesis. 2012;33:140-8.
[6] Hardman WE, Ion G. Suppression of implanted MDA-MB 231 human breast cancer growth in
nude mice by dietary walnut. Nutr Cancer. 2008;60:666-74.
[7] Poulose SM, Miller MG, Shukitt-Hale B. Role of Walnuts in Maintaining Brain Health with Age.
The Journal of Nutrition. 2014;144:561S-6S.
[8] Hayes D, Angove MJ, Tucci J, Dennis C. Walnuts (Juglans regia) Chemical Composition and
Research in Human Health. Critical Reviews in Food Science and Nutrition. 2016;56:1231-41.
[9] Gunduc NE, S.N. Assessing antioxidant activities of phenolic compounds of common Turkish
food and drinks on in vitro low-density lipoprotein oxidation. J Food SC. 2003;68:2591-5.
[10] Chen CY, Blumberg JB. Phytochemical composition of nuts. Asia Pacific journal of clinical
nutrition. 2008;17 Suppl 1:329-32.

ACC
EPTE
D M
ANU
SCR
IPT
ACCEPTED MANUSCRIPT
18
[11] Halvorsen BL, Carlsen MH, Phillips KM, Bohn SK, Holte K, Jacobs DR, Jr., et al. Content of redox-
active compounds (ie, antioxidants) in foods consumed in the United States. Am J Clin Nutr.
2006;84:95-135.
[12] Pellegrini N, Serafini M, Salvatore S, Del Rio D, Bianchi M, Brighenti F. Total antioxidant capacity
of spices, dried fruits, nuts, pulses, cereals and sweets consumed in Italy assessed by three
different in vitro assays. Molecular nutrition & food research. 2006;50:1030-8.
[13] Savage GP. Chemical composition of walnuts (Juglans regia L.) grown in New Zealand. Plant
foods for human nutrition (Dordrecht, Netherlands). 2001;56:75-82.
[14] US Department of Agriculture ARS, Nutrient Data Laboratory. USDA National Nutrient Database
for Standard Reference, Release 28. Internet: /nea/bhnrc/ndlVersion Current: September 2015,
slightly revised May 2016.
[15] Conlon MA, Bird AR. The impact of diet and lifestyle on gut microbiota and human health.
Nutrients. 2014;7:17-44.
[16] Nakanishi M, Chen Y, Qendro V, Miyamoto S, Weinstock E, Weinstock GM, et al. Effects of
Walnut Consumption on Colon Carcinogenesis and Microbial Community Structure. Cancer Prev
Res (Phila). 2016;9:692-703.
[17] Bruce-Keller AJ, Salbaum JM, Luo M, Blanchard Et, Taylor CM, Welsh DA, et al. Obese-type gut
microbiota induce neurobehavioral changes in the absence of obesity. Biol Psychiatry.
2015;77:607-15.
[18] Caporaso JG, Lauber CL, Walters WA, Berg-Lyons D, Lozupone CA, Turnbaugh PJ, et al. Global
patterns of 16S rRNA diversity at a depth of millions of sequences per sample. Proc Natl Acad Sci
U S A. 2011;108 Suppl 1:4516-22.
[19] Edgar RC. UPARSE: highly accurate OTU sequences from microbial amplicon reads. Nat Methods.
2013;10:996-8.

ACC
EPTE
D M
ANU
SCR
IPT
ACCEPTED MANUSCRIPT
19
[20] Caporaso JG, Kuczynski J, Stombaugh J, Bittinger K, Bushman FD, Costello EK, et al. QIIME allows
analysis of high-throughput community sequencing data. Nat Methods. 2010;7:335-6.
[21] Langille MG, Zaneveld J, Caporaso JG, McDonald D, Knights D, Reyes JA, et al. Predictive
functional profiling of microbial communities using 16S rRNA marker gene sequences. Nat
Biotechnol. 2013;31:814-21.
[22] Segata N, Izard J, Waldron L, Gevers D, Miropolsky L, Garrett WS, et al. Metagenomic biomarker
discovery and explanation. Genome Biol. 2011;12:R60.
[23] De Filippo C, Cavalieri D, Di Paola M, Ramazzotti M, Poullet JB, Massart S, et al. Impact of diet in
shaping gut microbiota revealed by a comparative study in children from Europe and rural
Africa. Proc Natl Acad Sci U S A. 2010;107:14691-6.
[24] Burns AM, Zitt MA, Rowe CC, Langkamp-Henken B, Mai V, Nieves C, Jr., et al. Diet quality
improves for parents and children when almonds are incorporated into their daily diet: a
randomized, crossover study. Nutr Res. 2016;36:80-9.
[25] Saraswati S, Sitaraman R. Aging and the human gut microbiota-from correlation to causality.
Front Microbiol. 2014;5:764.
[26] Delzenne NM, Cani PD. Interaction between obesity and the gut microbiota: relevance in
nutrition. Annu Rev Nutr. 2011;31:15-31.
[27] Qin J, Li R, Raes J, Arumugam M, Burgdorf KS, Manichanh C, et al. A human gut microbial gene
catalogue established by metagenomic sequencing. Nature. 2010;464:59-65.
[28] Turnbaugh PJ, Hamady M, Yatsunenko T, Cantarel BL, Duncan A, Ley RE, et al. A core gut
microbiome in obese and lean twins. Nature. 2009;457:480-4.
[29] Martinez I, Lattimer JM, Hubach KL, Case JA, Yang J, Weber CG, et al. Gut microbiome
composition is linked to whole grain-induced immunological improvements. ISME J. 2013;7:269-
80.

ACC
EPTE
D M
ANU
SCR
IPT
ACCEPTED MANUSCRIPT
20
[30] Ukhanova M, Wang X, Baer DJ, Novotny JA, Fredborg M, Mai V. Effects of almond and pistachio
consumption on gut microbiota composition in a randomised cross-over human feeding study.
Br J Nutr. 2014;111:2146-52.
[31] Lu K, Mahbub R, Fox JG. Xenobiotics: Interaction with the Intestinal Microflora. ILAR J.
2015;56:218-27.
[32] Baxter NT, Zackular JP, Chen GY, Schloss PD. Structure of the gut microbiome following
colonization with human feces determines colonic tumor burden. Microbiome. 2014;2:20.
[33] Backhed F, Ley RE, Sonnenburg JL, Peterson DA, Gordon JI. Host-bacterial mutualism in the
human intestine. Science. 2005;307:1915-20.
[34] Bird AR, Conlon MA, Christophersen CT, Topping DL. Resistant starch, large bowel fermentation
and a broader perspective of prebiotics and probiotics. Benef Microbes. 2010;1:423-31.
[35] Conlon MA, Kerr CA, McSweeney CS, Dunne RA, Shaw JM, Kang S, et al. Resistant starches
protect against colonic DNA damage and alter microbiota and gene expression in rats fed a
Western diet. J Nutr. 2012;142:832-40.
[36] Giesbertz P, Daniel H. Branched-chain amino acids as biomarkers in diabetes. Curr Opin Clin Nutr
Metab Care. 2016;19:48-54.
[37] Lerin C, Goldfine AB, Boes T, Liu M, Kasif S, Dreyfuss JM, et al. Defects in muscle branched-chain
amino acid oxidation contribute to impaired lipid metabolism. Mol Metab. 2016;5:926-36.
[38] Calder PC. Branched-chain amino acids and immunity. J Nutr. 2006;136:288S-93S.
[39] Moffett JR, Namboodiri MA. Tryptophan and the immune response. Immunol Cell Biol.
2003;81:247-65.
[40] Yano JM, Yu K, Donaldson GP, Shastri GG, Ann P, Ma L, et al. Indigenous bacteria from the gut
microbiota regulate host serotonin biosynthesis. Cell. 2015;161:264-76.

ACC
EPTE
D M
ANU
SCR
IPT
ACCEPTED MANUSCRIPT
21
[41] Rather MA, Dar BA, Dar MY, Wani BA, Shah WA, Bhat BA, et al. Chemical composition,
antioxidant and antibacterial activities of the leaf essential oil of Juglans regia L. and its
constituents. Phytomedicine. 2012;19:1185-90.
[42] Wang X, Liu W, Xin C, Zheng Y, Cheng Y, Sun S, et al. Enhanced limonene production in
cyanobacteria reveals photosynthesis limitations. Proc Natl Acad Sci U S A. 2016.

ACC
EPTE
D M
ANU
SCR
IPT
ACCEPTED MANUSCRIPT
22
Table 1. The composition of the walnut and replacement diet.
Walnut1 Replacement
Ingredient Percent by Weight Percent by Weight
Caseina 18.3 20
Sucroseb 45 45
Corn starcha 13.5 15
Cellulosea 4.8 5
Choline bitartratea 0.2 0.2
DL-methioninea 0.3 0.3
Mineral mixc 3.5 3.5
Vitamin mixd 1 1
Ground walnutse 11.1 0
Corn oila 2.63 10
Content determined by chemical analysism
Proteinf (g/100g) 15.6 15.5
Fatg (g/100g) 4.3 5.8
Crude Fiberh (g/100g) 3.67 2.7
Moisturei 16.2 15.7
Ashj 2.2 2.17
Mathematically derived from chemical analysis
Carbohydratek (g/100g) 61.7 60.9
Total Energy Content (Cal/100g)l
348
358
Omega 6/Omega 3 ratio 4.5/1 23.3/1
1 18% of calories from walnut

ACC
EPTE
D M
ANU
SCR
IPT
ACCEPTED MANUSCRIPT
23
a Dyets, Bethlehem, PA; b Flavorite, Eden Prairie, MN; c AIN-76, Dyets, Bethlehem, PA; d AIN-76A, Dyets, Bethlehem, PA; e donated California Walnut Commission, Folsom, CA; f measured by Dumas method, Official Methods of Analysis of AOAC INTERNATIONAL, 18th Ed.,
Methods 968.06 and 992.15, AOAC INTERNATIONAL, Gaithersburg, MD, USA, (2005). (Modified); g quantitated by Soxhlet, Official Methods of Analysis of AOAC INTERNATIONAL, 18th Ed., Methods
960.39and 948.22. AOAC International, Gaithersburg, MD, 2005 (Modified); h quantitated by Official Methods of Analysis of AOAC INTERNATIONAL (2005) 18th Ed., AOAC
INTERNATIONAL, Gaithersburg, MD, USA, Official Method 962.09; i Official Methods of Analysis of AOAC INTERNATIONAL, 18th Ed., Methods 925.09 and 926.08, AOAC
INTERNATIONAL, Gaithersburg, MD, USA, (2005). (Modified); j Official Methods of Analysis of AOAC INTERNATIONAL, 18th Ed., Method 923.03, AOAC
INTERNATIONAL, Gaithersburg, MD, USA, (2005). (Modified) k calculated by difference; l calculated from values in United States Department of Agriculture, "Composition of Foods"
Agricultural Handbook, No. 8, pp. 159-160, (1975) m Covance Labaoratories, Madison, WI

ACC
EPTE
D M
ANU
SCR
IPT
ACCEPTED MANUSCRIPT
24
Table 2. Relative abundance significantly different between walnut diet and replacement diet
Taxa Wilcoxon P
Value Walnut
Replacement
Average
(%) SD
# of Rats
Average (%)
SD # of Rats
Higher abundance walnut diet vs. replacement diet
Firmicutes
p__Firmicutes 0.007
67.39 9.03 10
55.52 6.80 10
p__Firmicutes;c__Bacilli 0.004
2.60 3.59 10
0.46 0.43 10
p__Firmicutes;c__Bacilli;o__Lactobacillales 0.011
1.84 3.78 10
0.26 0.23 10
p__Firmicutes;c__Bacilli;o__Lactobacillales;f__Lactobacillaceae 0.003
1.42 2.70 10
0.15 0.19 10
p__Firmicutes;c__Bacilli;o__Lactobacillales;f__Lactobacillaceae;g__Lactobacillus 0.003
1.42 2.70 10
0.15 0.19 10
p__Firmicutes;c__Bacilli;o__Lactobacillales;f__Lactobacillaceae;g__Lactobacillus;s__ 0.004
1.33 2.56 10
0.15 0.19 10
p__Firmicutes;c__Bacilli;o__Lactobacillales;f__Lactobacillaceae;g__Lactobacillus; s__reuteri
0.003
0.090 0.145 9
0.003 0.003 7
p__Firmicutes;c__Bacilli;o__Turicibacterales 0.034 0.751 0.636 9 0.192 0.228 7
p__Firmicutes;c__Bacilli;o__Turicibacterales;f__Turicibacteraceae 0.034 0.751 0.636 9 0.192 0.228 7
p__Firmicutes;c__Bacilli;o__Turicibacterales;f__Turicibacteraceae;g__Turicibacter 0.034 0.751 0.636 9 0.192 0.228 7
p__Firmicutes;c__Bacilli;o__Turicibacterales;f__Turicibacteraceae;g__Turicibacter;s__ 0.034 0.751 0.636 9 0.192 0.228 7
p__Firmicutes;c__Clostridia 0.026 64.705 10.89 10 54.93 5.769 10
p__Firmicutes;c__Clostridia;o__Clostridiales 0.026 64.705 10.89 10 54.93 6.769 10
p__Firmicutes;c__Clostridia;o__Clostridiales;Other 0.017 15.62 5.354 10 9.832 2.962 10
p__Firmicutes;c__Clostridia;o__Clostridiales;Other;Other 0.017 15.615 5.354 10 9.832 2.962 10
p__Firmicutes;c__Clostridia;o__Clostridiales;Other;Other;Other 0.017 15.615 5.354 10 9.832 2.962 10
p__Firmicutes;c__Clostridia;o__Clostridiales;f__Dehalobacteriaceae;g__ 0.017 0.009 0.007 8 0.004 0.013 2
p__Firmicutes;c__Clostridia;o__Clostridiales;f__Dehalobacteriaceae;g__;s__ 0.017 0.009 0.007 8 0.004 0.013 2
p__Firmicutes;c__Clostridia;o__Clostridiales;f__Lachnospiraceae;g__Moryella 0.017 0.336 0.246 10 0.097 0.086 10
p__Firmicutes;c__Clostridia;o__Clostridiales;f__Lachnospiraceae;g__Moryella;s__ 0.017 0.336 0.246 10 0.097 0.086 10
p__Firmicutes;c__Clostridia;o__Clostridiales;f__Lachnospiraceae;g__Roseburia 0.026 0.093 0.08 10 0.041 0.062 9
p__Firmicutes;c__Clostridia;o__Clostridiales;f__Lachnospiraceae;g__Roseburia;Other 0.026 0.093 0.080 10 0.042 0.062 10
p__Firmicutes;c__Clostridia;o__Clostridiales;f__Lachnospiraceae;g__[Ruminococcus] 0.021 0.158 0.147 10 0.066 0.046 10
p__Firmicutes;c__Clostridia;o__Clostridiales;f__Peptococcaceae;Other 0.016 0.225 0.137 10 0.099 0.054 10
p__Firmicutes;c__Clostridia;o__Clostridiales;f__Ruminococcaceae;g__Oscillospira 0.045 11.547 5.534 10 6.732 1.724 10

ACC
EPTE
D M
ANU
SCR
IPT
ACCEPTED MANUSCRIPT
25
p__Firmicutes;c__Clostridia;o__Clostridiales;f__Ruminococcaceae;g__Oscillospira; Other
0.005 1.0367 0.799 10 0.458 0.121 10
p__Firmicutes;c__Clostridia;o__Clostridiales;f__Ruminococcaceae;g__Oscillospira;s__ 0.031 10.511 4.892 10 6.273 1.644 10
p__Firmicutes;c__Clostridia;o__Clostridiales;f__Ruminococcaceae;g__Ruminococcus; Other
0.003 0.142 0.190 9 0.004 0.003 9
Actinobacteria
p__Actinobacteria;Other 0.045 0.030 0.035 10 0.007 0.009 10
p__Actinobacteria;Other;Other 0.045 0.030 0.035 10 0.007 0.009 10
p__Actinobacteria;Other;Other;Other 0.045 0.030 0.035 10 0.007 0.009 8
p__Actinobacteria;Other;Other;Other;Other 0.045 0.030 0.035 10 0.007 0.009 8
p__Actinobacteria;Other;Other;Other;Other;Other 0.045 0.030 0.035 10 0.007 0.009 8
Cyanobacteria p__Cyanobacteria;c__Chloroplast 0.024 0.005 0.006 6 0.0004 0.001 1
p__Cyanobacteria;c__Chloroplast;o__Streptophyta 0.024 0.005 0.006 6 0.0004 0.001 1
p__Cyanobacteria;c__Chloroplast;o__Streptophyta;f__ 0.024 0.005 0.006 6 0.004 0.001 1
p__Cyanobacteria;c__Chloroplast;o__Streptophyta;f__;g__ 0.024 0.005 0.004 6 0.0004 0.001 1
p__Cyanobacteria;c__Chloroplast;o__Streptophyta;f__;g__;s__ 0.024 0.005 0.006 6 0.0004 0.001 1
Lower abundance walnut diet vs. replacement diet
Bacteroidetes
p__Bacteroidetes 0.007
23.56 6.94 10
34.19 7.40 10
p__Bacteroidetes;c__Bacteroidia 0.007
23.08 6.92 10
33.46 7.40 10
p__Bacteroidetes;c__Bacteroidia;o__Bacteroidales 0.007
23.08 6.92 10
33.46 7.40 10
p__Bacteroidetes;c__Bacteroidia;o__Bacteroidales;f__Bacteroidaceae 0.002
9.99 4.58 10
20.29 5.81 10
p__Bacteroidetes;c__Bacteroidia;o__Bacteroidales;f__Bacteroidaceae;g__Bacteroides 0.002
9.99 4.58 10
20.29 5.81 10
p__Bacteroidetes;c__Bacteroidia;o__Bacteroidales;f__Bacteroidaceae;g__Bacteroides; s__
0.005
7.05 3.20 10
15.10 5.58 10
p__Bacteroidetes;c__Bacteroidia;o__Bacteroidales;f__Bacteroidaceae;g__Bacteroides 0.002 9.988 4.583 10 20.286 5.811 10
p__Bacteroidetes;c__Bacteroidia;o__Bacteroidales;f__Bacteroidaceae;g__Bacteroides;
Other 0.038
2.332 2.035 10
4.219 2.009 10
Firmicutes

ACC
EPTE
D M
ANU
SCR
IPT
ACCEPTED MANUSCRIPT
26
p__Firmicutes;c__Bacilli;o__Lactobacillales;f__Carnobacteriaceae 0.029 0.002 0.003 3 0.007 0.007 9
p__Firmicutes;c__Bacilli;o__Lactobacillales;f__Carnobacteriaceae;g__Granulicatella 0.029 0.002 0.003 3 0.007 0.007 9
p__Firmicutes;c__Bacilli;o__Lactobacillales;f__Carnobacteriaceae;g__Granulicatella;s_ 0.029 0.002 0.003 3 0.007 0.007 9
p__Firmicutes;c__Clostridia;Other 0.009
0.0004 0.001 2
0.002 0.002 8
p__Firmicutes;c__Clostridia;Other;Other 0.009
0.0004 0.001 2
0.002 0.002 8
p__Firmicutes;c__Clostridia;Other;Other;Other 0.009
0.0004 0.001 2
0.002 0.002 8
p__Firmicutes;c__Clostridia;Other;Other;Other;Other 0.009
0.0004 0.001 2
0.002 0.002 8
p__Firmicutes;c__Clostridia;o__Clostridiales;f__Lachnospiraceae;g__Blautia 0.036 0.012 0.027 6 0.055 0.101 9
p__Firmicutes;c__Clostridia;o__Clostridiales;f__Lachnospiraceae;g__Blautia;Other 0.044 0.009 0.021 6 0.016 0.022 9
p__Firmicutes;c__Clostridia;o__Clostridiales;f__Lachnospiraceae;g__Coprococcus 0.026 6.405 3.471 10 12.349 6.495 10
p__Firmicutes;c__Clostridia;o__Clostridiales;f__Lachnospiraceae;g__Coprococcus; s__eutactus
0.014 3.484 3.075 10 10.136 6.873 10
p__Firmicutes;c__Clostridia;o__Clostridiales;f__Lachnospiraceae;g__[Ruminococcus]; s__gnavus
0.021 0.158 0.147 10 0.066 0.046 10
p__Firmicutes;c__Clostridia;o__Clostridiales;f__Ruminococcaceae;g__;s__ 0.045 2.348 1.302 10 3.434 1.478 10
p__Firmicutes;c__Clostridia;o__Clostridiales;f__Ruminococcaceae;g__ 0.045 2.348 1.302 10 3.434 1.478 10
p__Firmicutes;c__Clostridia;o__Clostridiales;f__Ruminococcaceae;g__Anaerotruncus 0.003
0.006 0.005 8
0.034 0.035 9
p__Firmicutes;c__Clostridia;o__Clostridiales;f__Ruminococcaceae;g__Anaerotruncus; s__
0.003 0.006 0.005 8 0.034 0.035 9
p__Firmicutes;c__Erysipelotrichi 0.045 0.044 0.028 10 0.102 0.074 10
p__Firmicutes;c__Erysipelotrichi;o__Erysipelotrichales 0.045
0.044 0.028 10
0.102 0.073 10
p__Firmicutes;c__Erysipelotrichi;o__Erysipelotrichales;f__Erysipelotrichaceae 0.045 0.044 0.028 10 0.102 0.074 10
p__Firmicutes;c__Erysipelotrichi;o__Erysipelotrichales;f__Erysipelotrichaceae; g__Allobaculum
0.022 0.008 0.013 5 0.055 0.065 9
p__Firmicutes;c__Erysipelotrichi;o__Erysipelotrichales;f__Erysipelotrichaceae; g__Allobaculum;s__
0.022 0.008 0.013 5 0.055 0.065 9
p__Firmicutes;c__Erysipelotrichi;o__Erysipelotrichales;f__Erysipelotrichaceae;Other; Other
0.011 0.001 0.003 1 0.008 0.010 7
Proteobacteria;
p__Proteobacteria;c__Alphaproteobacteria 0.0004
0.049 0.039 10
0.390 0.264 10
p__Proteobacteria;c__Alphaproteobacteria;o__RF32 0.001
0.043 0.039 10
0.385 0.268 10
p__Proteobacteria;c__Alphaproteobacteria;o__RF32;f__;g__ 0.001
0.043 0.039 10
0.385 0.268 10
p__Proteobacteria;c__Alphaproteobacteria;o__RF32;f__;g__;s__ 0.001 0.043 0.039 10 0.385 0.268 10
p__Proteobacteria;c__Gammaproteobacteria;o__Pseudomonadales; f__Moraxellaceae
0.043 0.003 0.006 3 0.007 0.013 6

ACC
EPTE
D M
ANU
SCR
IPT
ACCEPTED MANUSCRIPT
27
Tenericutes
p__Tenericutes;c__Mollicutes;o__Anaeroplasmatales 0.007
0.008 0.012 6
0.115 0.153 9
p__Tenericutes;c__Mollicutes;o__Anaeroplasmatales;f__Anaeroplasmataceae; g__Anaeroplasma;s__
0.007 0.008 0.012 6 0.115 0.153 9
Cyanobacteria
p__ Cyanobacteria 0.014
0.121 0.071 10
0.334 0.303 10
p__Cyanobacteria;c__4C0d-2 0.011 0.116 0.072 10 0.334 0.303 10
p__Cyanobacteria;c__4C0d-2;o__YS2;f__;g__;s__ 0.011 0.116 0.072 10 0.334 0.303 10
p__Cyanobacteria;c__4C0d-2;o__YS2;f__ 0.011 0.116 0.072 10 0.334 0.303 10
p__Cyanobacteria;c__4C0d-2;o__YS2;f__;g__ 0.011 0.116 0.072 10 0.334 0.303 10

ACC
EPTE
D M
ANU
SCR
IPT
ACCEPTED MANUSCRIPT
28
Figure Legends
Figure 1. Body weight (1A) and daily food intake (1B) for the two diet groups. Body weight and
food intake did not differ significantly between the two groups.
Figure 2. Alpha diversity (within a community) of the gut microbiome shown using Shannon
analysis. The addition of walnuts significantly increased (p=0.018) the diversity
evenness of the gut microbial community.
Figure 3. Beta diversity (between communities) of the gut microbial communities. The principle
coordinate analysis (PCoA) plot based on unweighted (shown in the figure) UniFrac
distances showed two distinct gut microbial communities (replacement diet red circles,
walnut diet blue circles) (Figure 3A). Although Figure 3A suggests one outlier from the
walnut group in the replacement group, rotating the axis shows clearly three outliers
(Figure 3B) – two from the walnut diet and one from the replacement diet.
Figure 4. Relative abundance of the bacterial phyla between the walnut and replacement diet.
Relative abundance was calculated from the relative abundance of 16S rRNA gene
sequences assigned to each bacterial community using the Greengenes database. Figure
4A shows the changes at the phyla level for the walnut diet and Figure 4B shows the
phyla changes for the replacement diet. Only Firmicutes and Bacteriodetes were
significantly changed, and the ratio of Firmicutes to Bacteriodetes is shown in Figure 4C.
Figure 5. The top twenty-five most abundant bacteria in genus. The two columns on the left
graphically represent the data shown in the table. The taxa in the boxes are shown in
the same descending order as the table.

ACC
EPTE
D M
ANU
SCR
IPT
ACCEPTED MANUSCRIPT
29
Figure 6. Inferred functional capacity of the microbial communities associated with walnut and
replacement diet determined by linear discriminative analysis (LDA) effect size (LEfSe)
analysis of KEGG (Kyoto Encyclopedia of Genes and Genomes) pathways. Positive LDA
scores are enriched in animals eating the walnut diet (green bars) while negative LDA
scores are enriched in those animals eating the replacement diet (red bars).

ACC
EPTE
D M
ANU
SCR
IPT
ACCEPTED MANUSCRIPT
30
Figure 1.

ACC
EPTE
D M
ANU
SCR
IPT
ACCEPTED MANUSCRIPT
31
Figure 2.
ACC
EPTE
D M
ANU
SCR
IPT
ACCEPTED MANUSCRIPT
32
Figure 3.

ACC
EPTE
D M
ANU
SCR
IPT
ACCEPTED MANUSCRIPT
33
Figure 4.

ACC
EPTE
D M
ANU
SCR
IPT
ACCEPTED MANUSCRIPT
34
Figure 5.

ACC
EPTE
D M
ANU
SCR
IPT
ACCEPTED MANUSCRIPT
35
Figure 6.