THE JOURNAL OF GEOLOGY - Lamont–Doherty Earth …polsen/nbcp/schlische_olsen_90_sm.pdf · THE...
21
VOLUME 98 NUMBER 2 THE JOURNAL OF GEOLOGY March 1990 QUANTITATIVE FILLING MODEL FOR CONTINENTAL EXTENSIONAL BASINS WITH APPLICATIONS TO EARLY MESOZOIC RIFTS OF EASTERN NORTH AMERICA' ROY W. SCHLISCHE AND PAUL E. OLSEN Department of Geological Sciences and Lamont-Doherty Geological Observatory of Columbia University, Palisades, New York 10964 ABSTRACT In many half-graben, strata progressively onlap the hanging wall block of the basins, indicating that both the basins and their depositional surface areas were growing in size through time. Based on these con- straints, we have constructed a quantitative model for the stratigraphic evolution of extensional basins with the simplifying assumptions of constant volume input of sediments and water per unit time, as well as a uniform subsidence rate and a fixed outlet level. The model predicts (1) a transition from fluvial to lacustrine deposition, (2) systematically decreasing accumulation rates in lacustrine strata, and (3) a rapid increase in lake depth after the onset of lacustrine deposition, followed by a systematic decrease. When parameterized for the early Mesozoic basins of eastern North America, the model's predictions match trends observed in late Triassic-age rocks. Significant deviations from the model's predictions occur in Early Jurassic-age strata, in which markedly higher accumulation rates and greater lake depths point to an increased extension rate that led to increased asymmetry in these half-graben. The model makes it possible to extract from the sedimentary record those events in the history of an extensional basin that are due solely to the filling of a basin growing in size through time and those that are due to changes in tectonics, climate, or sediment and water budgets. INTRODUCTION A fundamental problem in the study of ex- tensional basins is the quantitative determi- nation of the first-order controls on basin stratigraphy. This problem is especially acute for non-marine basins, which lack a sea-level datum. Traditionally, each major change in depositional environment and sedimentation has been interpreted as a result of some "tec- tonic" event (such as increased boundary fault movement) or major climatic change, yet predictive, quantitative models for the stratigraphic development of extensional ba- sins are notably lacking. This stands in con- ' Manuscript received May 18, 1989; accepted October 17, 1989. [JOURNAL OF GEOLOGY, 1990, vol. 98, p. 135-1551 0 1990 by The University of Chicago. All rights reserved. 0022-1376/90/9802-001$1.00 trast to the study of post-rift deposits, in which the fundamental aspects of the stratig- raphy are explained in terms of thermally driven subsidence, sediment loading, sedi- ment compaction, and eustatic sea level change (e.g., McKenzie 1978; Steckler and Watts 1978; Bond and Kominz 1984; Steckler et al. 1988). Quantitative stratigraphic modeling of ex- tensional basins has proven difficult because of the lack of appreciation of the critical ef- fects of basin geometry on the stratigraphic record. In this paper, we develop a simple model of extensional basin filling that appears to explain many of the elements of the strati- graphic record of early Mesozoic rift basins of eastern North America. The model is based on the filling of a basin growing in size through time. Even under conditions of uni- form subsidence and constant volume of sedi- ment and water input per unit time, the model
Transcript of THE JOURNAL OF GEOLOGY - Lamont–Doherty Earth …polsen/nbcp/schlische_olsen_90_sm.pdf · THE...
VOLUME 98 NUMBER 2
THE JOURNAL OF GEOLOGY March 1990
QUANTITATIVE FILLING MODEL FOR CONTINENTAL EXTENSIONAL BASINS WITH APPLICATIONS TO EARLY MESOZOIC RIFTS
OF EASTERN NORTH AMERICA'
ROY W. SCHLISCHE AND PAUL E. OLSEN
Department of Geological Sciences and Lamont-Doherty Geological Observatory of Columbia University, Palisades, New York 10964
ABSTRACT
In many half-graben, strata progressively onlap the hanging wall block of the basins, indicating that both the basins and their depositional surface areas were growing in size through time. Based on these con- straints, we have constructed a quantitative model for the stratigraphic evolution of extensional basins with the simplifying assumptions of constant volume input of sediments and water per unit time, as well as a uniform subsidence rate and a fixed outlet level. The model predicts (1) a transition from fluvial to lacustrine deposition, (2) systematically decreasing accumulation rates in lacustrine strata, and (3) a rapid increase in lake depth after the onset of lacustrine deposition, followed by a systematic decrease. When parameterized for the early Mesozoic basins of eastern North America, the model's predictions match trends observed in late Triassic-age rocks. Significant deviations from the model's predictions occur in Early Jurassic-age strata, in which markedly higher accumulation rates and greater lake depths point to an increased extension rate that led to increased asymmetry in these half-graben. The model makes it possible to extract from the sedimentary record those events in the history of an extensional basin that are due solely to the filling of a basin growing in size through time and those that are due to changes in tectonics, climate, or sediment and water budgets.
INTRODUCTION
A fundamental problem in the study of ex- tensional basins is the quantitative determi- nation of the first-order controls on basin stratigraphy. This problem is especially acute for non-marine basins, which lack a sea-level datum. Traditionally, each major change in depositional environment and sedimentation has been interpreted as a result of some "tec- tonic" event (such as increased boundary fault movement) or major climatic change, yet predictive, quantitative models for the stratigraphic development of extensional ba- sins are notably lacking. This stands in con-
' Manuscript received May 18, 1989; accepted October 17, 1989.
[JOURNAL OF GEOLOGY, 1990, vol. 98, p. 135-1551 0 1990 by The University of Chicago. All rights reserved. 0022-1376/90/9802-001$1.00
trast to the study of post-rift deposits, in which the fundamental aspects of the stratig- raphy are explained in terms of thermally driven subsidence, sediment loading, sedi- ment compaction, and eustatic sea level change (e.g., McKenzie 1978; Steckler and Watts 1978; Bond and Kominz 1984; Steckler et al. 1988).
Quantitative stratigraphic modeling of ex- tensional basins has proven difficult because of the lack of appreciation of the critical ef- fects of basin geometry on the stratigraphic record. In this paper, we develop a simple model of extensional basin filling that appears to explain many of the elements of the strati- graphic record of early Mesozoic rift basins of eastern North America. The model is based on the filling of a basin growing in size through time. Even under conditions of uni- form subsidence and constant volume of sedi- ment and water input per unit time, the model

R. W. SCHLISCHE AND P. E. OLSEN
. . - - - Post-rift sediments
- - - - / - 6
B - ^ ' / I 5 km -
- / . 8
FIG. 1.-Cross section and seismic lines of typical half-graben, showing the wedge-shaped geometry and the progressive onlap of younger strata onto the hanging wall basement block on the hinged side of the ( A ) Newark (see figs. 5 and 7 for location), (B) Atlantis (see fig. 5 for location), and (C) Railroad Valley basins. Abbreviations for stratigraphic units in the Newark basin are: B, Boonton Formation; F , Feltville Forma- tion; H, Hook Mountain Basalt; L, Lockatong Formation; 0, Orange Mountain Basalt; P, Passaic Forma- tion; Pd, Palisades diabase; Pr, Preakness Basalt; S, Stockton Formation; and T , Towaco Formation. TWTT is two-wav travel time. Seismic ~rofiles were traced from figures presented by Hutchinson et al. (1986) and reela and and Berrong (1979):
predicts transitions in major depositional en- vironments and trends in accumulation rates and lake depth. Furthermore, the model's predictions can be "subtracted" from the actual stratigraphic record, yielding the tec- tonic and climatic signal and allowing for the parameterization of sediment and water budgets.
EXTENSIONAL BASIN GEOMETRY AND
STRATIGRAPHIC ARCHITECTURE
In many extensional basins, younger strata progressively onlap the "basement" rocks of the hanging wall block (fig. 1). Charles Lyell (1847) first noted this onlap geometry in the Blackheath region of the hinge area of the Triassic Richmond basin of Virginia. Outcrop studies and coal mine excavations indicate that the lowermost stratigraphic unit-the Lower Barren Beds-is absent from this re- gion and that the stratigraphically higher Pro- ductive Coal Measures rest directly on base- ment. Further toward the border fault of the half-graben, seismic reflection profiles and
drill hole data record the presence and thick- ening of the Lower Barren Beds (B. Cornet pers. comm. 1989). At Tennycape, Nova Scotia, strata of the Triassic Wolfville For- mation clearly onlap the Carboniferous "basement" rocks in the hinge of the Fundy half-graben. Furthermore, the beds of the Wolfville Formation dip at a shallower angle than the unconformity between the Triassic and Carboniferous rocks (Olsen et al. 1989). McLaughlin stated that the basal Stockton Formation onlapped the northeastern, south- ern, and southwestern margins of the Newark basin (McLaughlin 1945; McLaughlin and Willard 1949; Willard et al. 1959; see fig. 1A). Seismic reflection profiles reveal this onlap geometry in (1) the Cenozoic basins of the Basin and Range-the Dixie Valley basin, Nevada (Anderson et al. 1983, their fig. 4), the northern Fallon basin of the Carson De- sert, Nevada (Anderson et al. 1983, their fig. S), the Diamond Valley basin, Nevada (An- derson et al. 1983, their fig. 6), the Railroad Valley basin, Nevada (fig. 1C; Vreeland and

QUANTITATIVE FILLING MODEL
Berrong 1979, their fig. 8), and the Great Salt Lake basin, Utah (Smith and Bruhn 1984, their fig. 10); (2) Lake Tanganyika of East Africa (Burgess et al. 1988, their fig. 35-12); (3) the North Viking graben of the North Sea (Badley et al. 1988, their figs. 6 and 8); (4) the Hopedale and Sagiek basins of the Labrador margin (Balkwill 1987, his figs. 9 and 1 1); and (5) the Mesozoic basins of the U.S. Atlantic passive margin-the Long Island, Nan- tucket, and Atlantis basins (fig. 1B; Hutch- inson et al. 1986, their figs. 3 , 7, 11, and 15).
Anderson et al. (1983) cited this onlap pat- tern as evidence that the extensional basins had grown in size through time. Leeder and Gawthorpe (1987) related the onlap pattern to the migration of the basin's hinge or fulcrum (reflecting the line basinward of which the hanging wall has experienced subsidence) away from the border fault and have incor- porated this concept into their tectono- sedimentary facies models. We agree with these authors' interpretations and extend them one step further: not only were the ex- tensional basins growing in size, but the de- positional surface also was growing in area through time as a consequence of the filling of the basin. This conclusion serves as the foun- dation of the extensional basin filling model.
Continental extensional basins often dis- play a tripartite stratigraphic architecture (Lambiase 1990) which, from bottom up, con- sists of: (1) a fluvial unit indicating through- going drainage and open-basin conditions; (2) a lacustrine unit with deepest-water facies near its base, gradually shoaling upward, in- dicating predominantly closed-basin condi- tions; and (3) a fluvial unit reflecting once again through-going drainage.
These major changes in depositional envi- ronments (on a basin-wide scale) have been explained in terms of changes in basin subsi- dence (Lambiase 1990). The fluvial unit is in- terpreted to have been deposited during ini- tial, slow basin subsidence, perhaps in a number of linked, small sub-basins. The deep-water lacustrine unit is interpreted to reflect a deepening of the basin resulting from increased subsidence and the coalescence of sub-basins. The upward-shoaling is inter- preted to reflect the gradual infilling of the basin, with fluvial sedimentation returning af- ter the basin had filled to the lowest outlet of the basin. Taking a different approach, Olsen
and Schlische (1988a, 1988b) have demon- strated how evolving basin geometry as a consequence of filling under conditions of uniform subsidence and uniform rate of input of sediments and water could produce much the same stratigraphic architecture and in ad- dition make specific predictions about the changes in accumulation rates and times of transitions from one environment to another.
EXTENSIONAL BASIN FILLING MODEL
The analytically simplest model consists of a basin, trapezoidal in cross-section, bounded by planar faults that dip at equal angles, and bounded along-strike by vertical surfaces (fig. 2). In this full-graben model, uniform extension results in uniform subsi- dence along the boundary faults (see fig. 3), and hence the depth (D) of the basin in- creases linearly. To maintain simplicity in the model, the volumetric sedimentation rate (V,, the volume of sediment added to the ba- sin per unit time) and the available volume of water (Vw) are constant. The outlet of the basin also is assumed to be held fixed with respect to an external reference system.
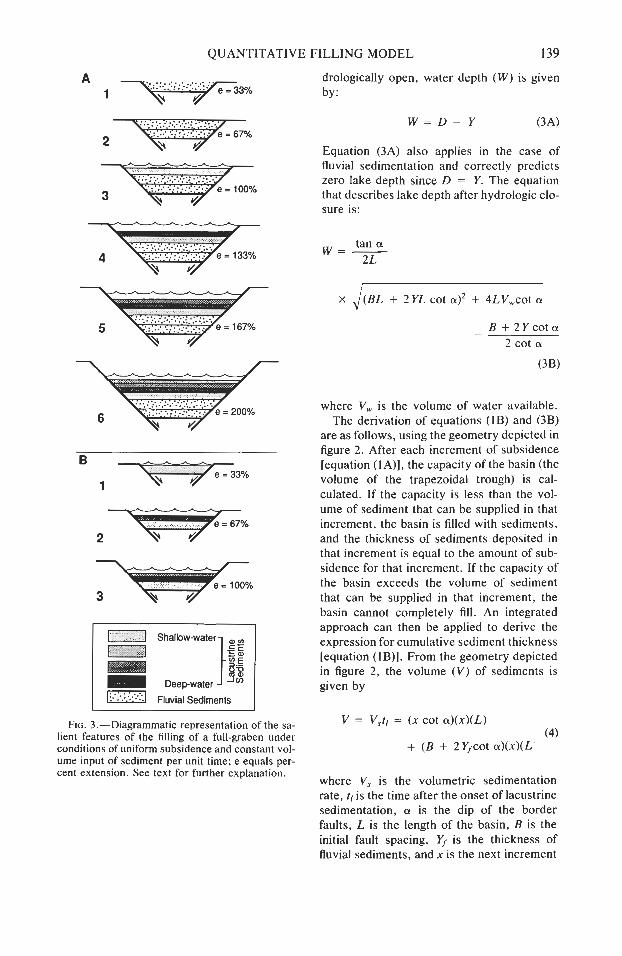
If the basin subsides slowly enough or V, is large enough, the basin initially fills com- pletely with sediments, and excess sediment and water leave the basin (fig. 3A.1). We characterize this mode of sedimentation as fluvial; the basin is sedimentologically and hydrologically open. During this phase, ac- cumulation rate (thickness of sediment de- posited per unit time) is constant and equal to the subsidence rate: with an excess of sedi- ments available, the thickness of sediment deposited is governed solely by the space made available through subsidence. As the graben continues to grow, the same volume of sediment added per unit time is spread out over a larger and larger depositional surface area. Ultimately, a point is reached when the sediments exactly fill the basin (fig. 3A.2). Thereafter, the sediments no longer can com- pletely fill the growing basin. The basin is sedimentologically closed (all sediments en- tering the basin cannot leave the basin), and a lake can occupy that portion of the basin be- tween the sediment surface and the basin's outlet (fig. 3A.3). After the onset of lacustrine deposition, accumulation rates decrease sys- tematically, driven by the increasing size of
R. W. SCHLISCHE AND P. E. OLSEN
- 8 4
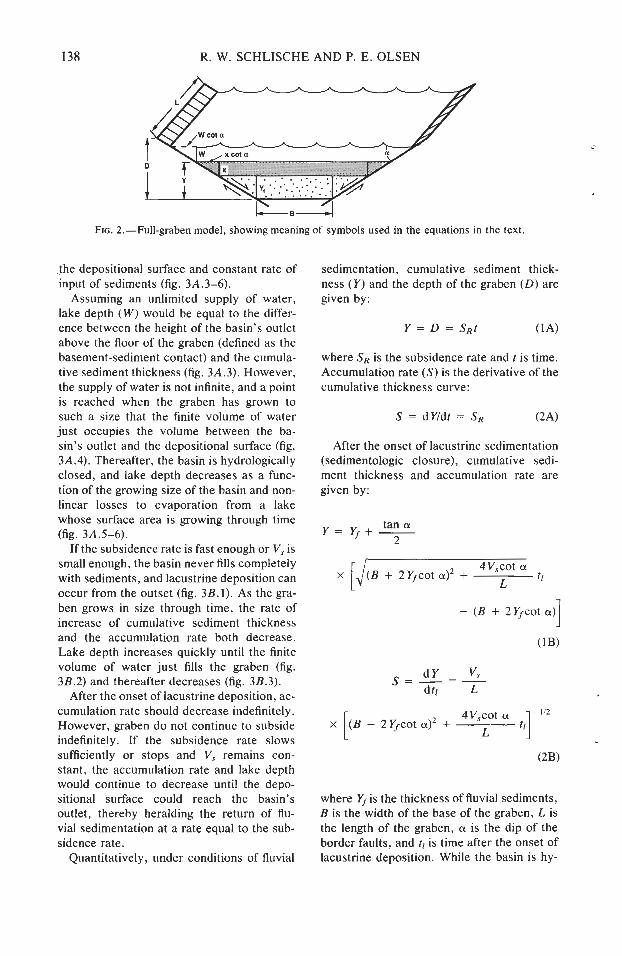
FIG. 2.-Full-graben model, showing meaning of symbols used in the equations in the text.
the depositional surface and constant rate of input of sediments (fig. 3A.3-6),
Assuming an unlimited supply of water, lake depth (W) would be equal to the differ- ence between the height of the basin's outlet above the floor of the graben (defined as the basement-sediment contact) and the cumula- tive sediment thickness (fig. 3A.3). However, the supply of water is not infinite, and a point is reached when the graben has grown to such a size that the finite volume of water just occupies the volume between the ba- sin's outlet and the depositional surface (fig. 3A.4). Thereafter, the basin is hydrologically closed, and lake depth decreases as a func- tion of the growing size of the basin and non- linear losses to evaporation from a lake whose surface area is growing through time (fig. 3A.5-6).
If the subsidence rate is fast enough or V. is small enough, the basin never fills completely with sediments, and lacustrine deposition can occur from the outset (fig. 35.1). As the gra- ben grows in size through time, the rate of increase of cumulative sediment thickness and the accumulation rate both decrease. Lake depth increases quickly until the finite volume of water just fills the graben (fig. 35.2) and thereafter decreases (fig. 35.3).
After the onset of lacustrine deposition, ac- cumulation rate should decrease indefinitely. However, graben do not continue to subside indefinitely. If the subsidence rate slows sufficiently or stops and V, remains con- stant, the accumulation rate and lake depth would continue to decrease until the depo- sitional surface could reach the basin's outlet, thereby heralding the return of flu- vial sedimentation at a rate equal to the sub- sidence rate.
Quantitatively, under conditions of fluvial
sedimentation, cumulative sediment thick- ness (Y) and the depth of the graben (D) are given by:
where SR is the subsidence rate and t is time. Accumulation rate (S) is the derivative of the cumulative thickness curve:
After the onset of lacustrine sedimentation (sedimentologic closure), cumulative sedi- ment thickness and accumulation rate are given by:
tan a Y = Y f + - 2
where Yf is the thickness of fluvial sediments, B is the width of the base of the graben, L is the length of the graben, a is the dip of the border faults, and ti is time after the onset of lacustrine deposition. While the basin is hy-
QUANTITATIVE FILLING MODEL
drologically open, by:
139
water depth (W) is given
D - Y ( 3 4
Equation (3A) also applies in the case of fluvial sedimentation and correctly predicts zero lake depth since D = Y. The equation that describes lake depth after hydrologic clo- sure is:
tan a w=- 2 L
FIG. 3.-Diagrammatic representation of the sa- lient features of the filling of a full-graben under conditions of uniform subsidence and constant vol- ume input of sediment per unit time; e equals per- cent extension. See text for further explanation.
I
x J{BL + ~ Y L cot a)' + ~LV, , ,CO~ a
- B + 2 Y c o t a 2 cot a
where Vw is the volume of water available. The derivation of equations (1B) and (3B)
are as follows, using the geometry depicted in figure 2. After each increment of subsidence [equation (lA)], the capacity of the basin (the volume of the trapezoidal trough) is cal- culated. If the capacity is less than the vol- ume of sediment that can be supplied in that increment, the basin is filled with sediments, and the thickness of sediments deposited in that increment is equal to the amount of sub- sidence for that increment. If the capacity of the basin exceeds the volume of sediment that can be supplied in that increment, the basin cannot completely fill. An integrated approach can then be applied to derive the expression for cumulative sediment thickness [equation (IB)]. From the geometry depicted in figure 2, the volume (V) of sediments is given by
V = V,tl = (x cot a)(x)(L)
where V, is the volumetric sedimentation rate, tl is the time after the onset of lacustrine sedimentation, a is the dip of the border faults, L is the length of the basin, B is the initial fault spacing, Yf is the thickness of fluvial sediments, and x is the next increment
140 R. W. SCHLISCHE AND P. E. OLSEN
of lacustrine sediment thickness. Rearranging terms yields:
Vs t (cot a)x2 + (B + 2Yfcot a)x - - = 0 L
( 5 )
The positive root of x is obtained from the quadratic formula. Equation (1B) is then given by
After the onset of lacustrine deposition, the capacity of the basin is again calculated knowing Y. If it is less than the available vol- ume of water (Vw), water depth (W) is cal- culated as the difference between the total depth of the basin and Y. If the basin's capac- ity exceeds V,,,, lake depth is derived as fol- lows, again based on the geometry in figure 2.
Vw = (B + 2 Y cot a)(W)(L)
+ (W cot a)(W)(L) (7)
(L cot a)W2 + (BL + 2Y cot a)W - V,,, = 0 (8)
Solving for the positive root of W yields equa- tion (3B).
In principle, the above analysis should hold for any concave-upward basin in which the depositional surface area grows through time under conditions of uniform subsidence, con- stant rate of input of sediments and water, and constant position of the outlet fixed to an external reference system, although the form of the equations will differ depending on the evolving geometry of the basin. In a half- graben growing in volume through time (in- ferred from onlap geometry) under conditions of uniform extension, it therefore seems rea- sonable to assume that the changes in aver- age accumulation rate and the time of transi- tion from fluvial to lacustrine sedimentation should follow a similar path as for a full- graben as long as the area of the depositional surface continues to grow. Although three- dimensional modeling of the filling of a half- graben has not yet been undertaken, prelimi- nary two-dimensional modeling indicates that the above assumption may be valid. In the two-dimensional approach, a constant cross- sectional area (the two-dimensional analogue
Drill Hole
Drill Hole Data
0 1 2 3 4 5 Time (millions of years)
0
Basin Averaae
Time (millions of years)
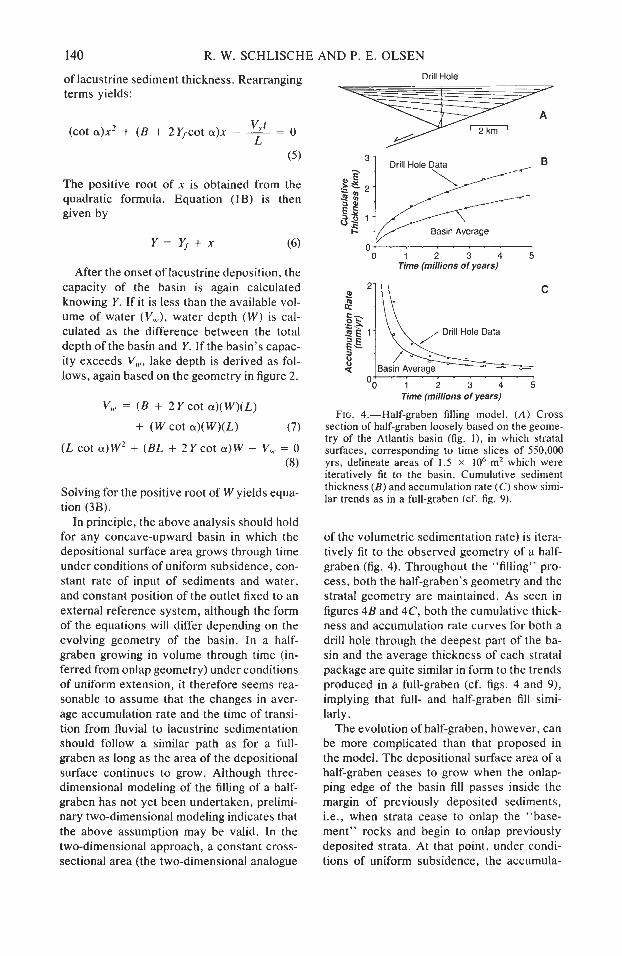
FIG. 4.-Half-graben filling model. (A) Cross section of half-graben loosely based on the geome- try of the Atlantis basin (fig. I ) , in which stratal surfaces, corresponding to time slices of 550,000 yrs, delineate areas of 1.5 x lo6 m2 which were iteratively fit to the basin. Cumulative sediment thickness (B) and accumulation rate (C) show simi- lar trends as in a full-graben (cf. fig. 9).
of the volumetric sedimentation rate) is itera- tively fit to the observed geometry of a half- graben (fig. 4). Throughout the "filling" pro- cess, both the half-graben's geometry and the stratal geometry are maintained. As seen in figures 4 5 and 4C, both the cumulative thick- ness and accumulation rate curves for both a drill hole through the deepest part of the ba- sin and the average thickness of each stratal package are quite similar in form to the trends produced in a full-graben (cf. figs. 4 and 9), implying that full- and half-graben fill simi- larly.
The evolution of half-graben, however, can be more complicated than that proposed in the model. The depositional surface area of a half-graben ceases to grow when the onlap- ping edge of the basin fill passes inside the margin of previously deposited sediments, i.e., when strata cease to onlap the "base- ment" rocks and begin to onlap previously deposited strata. At that point, under condi- tions of uniform subsidence, the accumula-

QUANTITATIVE FILLING MODEL 141
tion rate would cease to change or actually decrease. Additional complications arise in half-graben bounded by domino-style rota- tional faults. With continued extension, the normal faults progressively rotate to shal- lower dips (Wernicke and Burchfiel 1982). Even under conditions of uniform extension, therefore, subsidence will not be uniform. Furthermore, subsidence can .be expected to decrease from a maximum along the bound- ary fault to a minimum at the hinged margin of the half-graben. We also expect significant along-strike changes in subsidence, ranging from a maximum near the center of the boundary fault to zero at its tips. This cumu- lative variation in subsidence would then mimic the nature of subsidence observed fol- lowing slip on normal faults, such as the 1959 Hebgen Lake earthquake in Montana (Fraser et al. 1964).
The qualitative model presented above pre- dicts major changes in depositional environ- ments as a consequence of the filling of the basin: fluvial sedimentation (basin is sedi- mentologically and hydrologically open) giv- ing way to hydrologically open lacustrine sedimentation followed by hydrologically closed lacustrine sedimentation. Further- more, the model can be quantified to predict the timing of the major transitions in deposi- tional environments and trends in accumula- tion rates and lake depth. Clearly, however, the model cannot address all aspects of ex- tensional basin stratigraphy. For example, during "lacustrine deposition," fluvial and fluvio-deltaic deposits will ring the lacustrine deposits (see facies models of Leeder and Gawthorpe 1987). Furthermore, near the main border faults of the basin, lacustrine and alluvial fan deposits will interfinger. Re- peated motions along the border fault will lead to the formation of tectonic cyclothems (Blair and Bilodeau 1988). In addition, the facies distribution will be influenced by climatic changes (Olsen 1984a, 1984b, 1986): the lakes may shrink and swell, and the po- sition of the marginal lacustrine facies will migrate accordingly. The model therefore is only intended as a guide to understanding the gross stratigraphic development of ex- tensional basins, reflecting perhaps those processes operating on a scale of lo6 or 10' years.
The rationale of the assumptions used in
the basin filling model warrants additional discussion. The model assumes a constant volumetric sedimentation rate, yet as the ba- sin fills, younger strata progressively onlap potential source areas of new sediment. As a result, volumetric sedimentation rate might decrease. However, in the East African rifts, most sediments are derived from the hanging wall block and from rivers flowing along the axis of the rift system (Lambiase 1990). If this axial component is a general feature of most rift systems, then the effect of onlap onto source regions may not critically affect sedi- ment supply, and the assumption of constant V. is probably a good starting point.
The model also assumes that the outlet of the depositional basin is fixed with respect to an external reference system. Based again on the East African rifts, the lowest elevation outlet is commonly found at the along-strike end of an individual half-graben (Lambiase 1990). As this is the region that experiences minimal hanging wall subsidence and foot- wall uplift, then the outlet may indeed be as- sumed to be stationary.
As for subsidence and volume of water available, there are no reliable, long-term, modern data. Parsimony therefore dictates that we assume these parameters to be con- stant. The model is specifically designed to assess the intrinsic effects of the filling of the basin. Only when these are understood can we begin to examine and decipher the causes of the extrinsic effects (changes in subsidence rate, climate, and rates of sediment and water input). This approach is illustrated below with reference to the extensional basins con- taining the rocks of the early Mesozoic-age Newark Supergroup, particularly the Newark basin.
APPLICATION OF THE BASIN FILLING MODEL
Geologic Overview of the Newark Super- group.-Eastern North America forms part of the classic Atlantic-type passive continen- tal margin (Bally 1981) created by rifting of the supercontinent of Pangaea. All along the axis of the future Atlantic Ocean from Green- land to Mexico, the Triassic initiation of the breakup was marked by the formation of ex- tended crust. Early Mesozoic rift basins of eastern North America are exposed from South Carolina to Nova Scotia; numerous others have been discovered or inferred by

R. W. SCHLISCHE AND P. E. OLSEN
FIG. 5.-Early Mesozoic rift basins of eastern North America. Names of basins mentioned in the text are bold-faced. ~odified from Olsen et al. (1989).
drilling, seismic reflection profiling, and grav- ity studies to be buried both by post-rift sedi- ments on the continental shelf and below coastal plain sediments (fig. 5). Thousands of meters of exclusively continental strata, tholeiitic lava flows, and diabase plutons filled the exposed rift basins. The faulted, tilted, and eroded strata are termed the Newark Supergroup (Van Houten 1977; Olsen 1978; Froelich and Olsen 1984).
Milankovitch-Period Lacustrine Cycles.- The lacustrine rocks of Newark Supergroup basins show a common theme of repetitive cycles named in honor of their discover, F. B. Van Houten, by Olsen (1986). The fun- damental Van Houten cycle consists of three lithologically-distinct divisions which are in- terpreted as (1) lake transgression, (2) high
stand, and (3) regression plus low-stand facies (Olsen 1986). These cycles were appar- ently produced by the basin-wide rise and fall of water level of very large lakes (Van Houten 1964; Olsen 1984a, 1984b, 1986; Olsen et al. 1989). Fourier analysis of strati- graphic sections has shown that the Van Houten cycles have a periodicity of approxi- :
mately 21,000 yrs (Olsen 1986). Furthermore, the 21,000-yr-long cycles are hierarchically arranged in compound cycles of 100,000 and 400,000 yrs. It is this hierarchy that provides the best evidence that lake levels were cli- matically driven by orbital variation accord- ing to the Milankovitch theory (Olsen 1986). These cycles permit well-constrained esti- mates of accumulation rate (thickness of cy- cle divided by its duration) in the lacustrine
QUANTITATIVE FILLING MODEL
Lake Depth (Milankovitch Cycles)
High *
"Maximum"
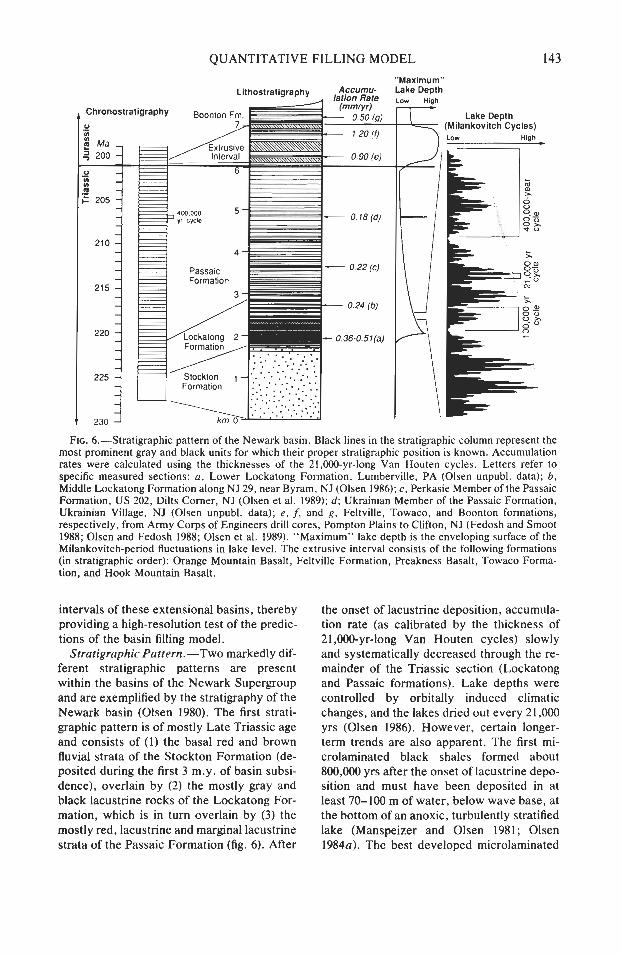
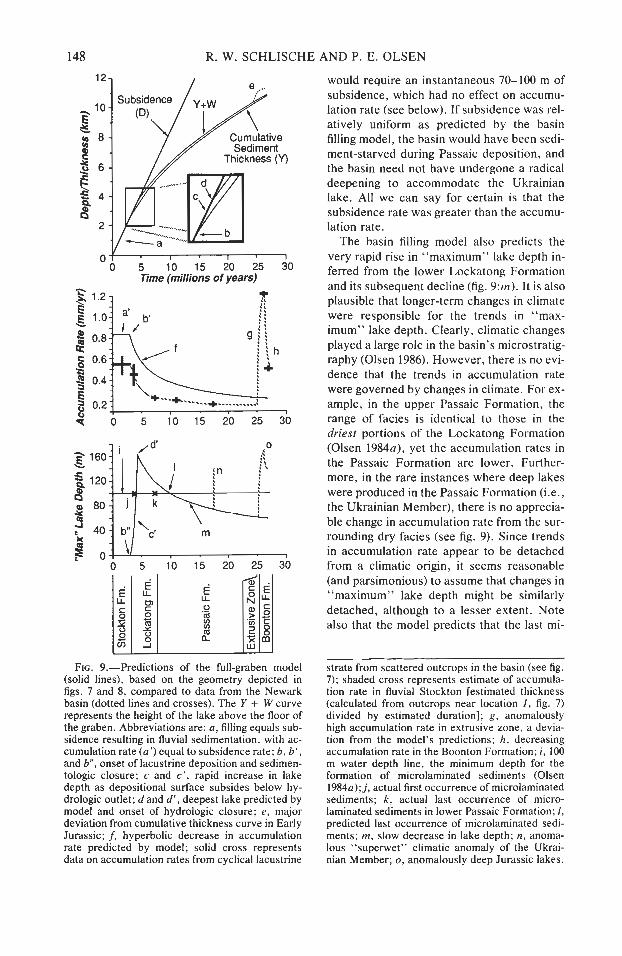
FIG. 6.-Stratigraphic pattern of the Newark basin. Black lines in the stratigraphic column represent the most prominent gray and black units for which their proper stratigraphic position is known. Accumulation rates were calculated using the thicknesses of the 21,000-yr-long Van Houten cycles. Letters refer to specific measured sections: a, Lower Lockatong Formation, Lumberville, PA (Olsen unpubl. data); b, Middle Lockatong Formation along NJ 29, near Byram, NJ (Olsen 1986); c , Perkasie Member of the Passaic Formation, US 202, Dilts Comer, NJ (Olsen et al. 1989); d ; Ukrainian Member of the Passaic Formation, Ukrainian Village, NJ (Olsen unpubl. data); e , f, and g, Feltville, Towaco, and Boonton formations, respectively, from Army Corps of Engineers drill cores, Pompton Plains to Clifton, NJ (Fedosh and Smoot 1988; Olsen and Fedosh 1988; Olsen et al. 1989). "Maximum" lake depth is the enveloping surface of the Milankovitch-period fluctuations in lake level. The extrusive interval consists of the following formations (in stratierauhic order): Orange Mountain Basalt, Feltville Formation, Preakness Basalt, Towaco Forma- tion, a n d ~ b o k Mountain ~ a s a l t .
intervals of these extensional basins, thereby providing a high-resolution test of the predic- tions of the basin filling model.
Stratigraphic Pattern.-Two markedly dif- ferent stratigraphic patterns are present within the basins of the Newark Supergroup and are exemplified by the stratigraphy of the Newark basin (Olsen 1980). The first strati- graphic pattern is of mostly Late Triassic age and consists of (1) the basal red and brown fluvial strata of the Stockton Formation (de- posited during the first 3 m.y. of basin subsi- dence), overlain by (2) the mostly gray and black lacustrine rocks of the Lockatong For- mation, which is in turn overlain by (3) the mostly red, lacustrine and marginal lacustrine strata of the Passaic Formation (fig. 6). After
the onset of lacustrine deposition, accumula- tion rate (as calibrated by the thickness of 21,000-yr-long Van Houten cycles) slowly and systematically decreased through the re- mainder of the Triassic section (Lockatong and Passaic formations). Lake depths were controlled by orbitally induced climatic changes, and the lakes dried out every 21,000 yrs (Olsen 1986). However, certain longer- term trends are also apparent. The first mi- crolaminated black shales formed about 800,000 yrs after the onset of lacustrine depo- sition and must have been deposited in at least 70-100 m of water, below wave base, at the bottom of an anoxic, turbulently stratified lake (Manspeizer and Olsen 1981; Olsen 1984~). The best developed microlaminated
144 R. W. SCHLISCHE AND P. E. OLSEN
units, suggesting the deepest lakes, are found in strata deposited 1.4 m. y. after lacustrine de- position began. Higher in the Lockatong For- mation, red massive mudstones become more and more abundant. With the exception of the Ukrainian Member of the Passaic Forma- tion and the Early Jurassic-age sedimentary rocks, the last microlaminated unit is present near the base of the Passaic Formation. Gray and black shales are still present within the rest of the Passaic Formation, but both their frequency and extent of development de- crease up-section (fig. 6). For ease in model- ing, we have defined "maximum" lake depth as the depth of the deepest lake produced by each 400,000 yr climate cycle; it is the bound- ing curve for the entire fluctuating lake level curve (see fig. 6). "Maximum" lake depth be- gan shallow at the onset of lacustrine deposi- tion, rapidly deepened during the deposition of the lower Lockatong Formation, and then slowly and systematically decreased toward the Triassic-Jurassic boundary (fig. 6).
The second stratigraphic sequence of mostly Early Jurassic age consists of tho- leiitic lava flows interbedded with and suc- ceeded by mostly lacustrine strata, which show marked changes in accumulation rate and "maximum" lake depth. Approximately 30 m below the palynologically determined Triassic-Jurassic boundary (Cornet 1977), both the accumulation rate and "maximum" lake depth greatly increased (fig. 6). The high- est accumulation rates and the deepest lake facies (well-developed microlaminated units) are associated with the thick extrusive basalt flows. After the extrusion of the last basalt flow, accumulation rate and "maximum" lake depth again decreased systematically. Basin Geometry.-Eastern North Ameri-
can rift basins were profoundly influenced by pre-existing structural control (Ratcliffe and Burton 1985; Swanson 1986; Schlische and Olsen 1987, 1988). Where the basins trended oblique to the regional extension direction, extensional strike-slip duplexes, flower struc- tures, and small syndepositional horsts and basins were developed in strike-slip zones (Schlische and Olsen 1987; Olsen et al. 1989). In both volume of sedimentary fill and sur- face area, however, these strike-slip regions are subordinate to the predominantly dip-slip half-graben.
Where the early Mesozoic extension direc- tion was normal to the strike of pre-existing structures, Paleozoic thrust faults of the Ap- palachian orogen were reactivated principally as dip-slip normal faults, as in the Newark basin (Ratcliffe and Burton 1985), forming half-graben in their collapsed hanging walls. Based on surface geology and seismic reflec- tion profiles, the basin fill of these half-graben '
is wedge-shaped (see fig. I), indicating that normal faulting responsible for basin subsi- dence was active during sedimentation. Fur- thermore, younger strata dip less steeply than older strata, indicating syndepositional rota- tion of the hanging wall block. As mentioned above, published seismic reflection profiles of offshore basins clearly show onlap onto the hanging wall, and studies of outcrops, drill holes, and proprietary seismic reflection pro- files of the Newark, Fundy, and Richmond basins lead to a similar conclusion.
The Newark basin of New York, New Jersey, and Pennsylvania is a half-graben bounded on its northwestern side by a south- east-dipping border fault system (figs. 1, 7). The dip of the border fault ranges from 60' to less than 25' (Ratcliffe and Burton 1985). The basin is approximately 190 km long (exclud- ing the narrow neck between the Newark and Gettysburg basins), presently 30-50 km wide, and contains cumulatively >7 km of sedimentary rocks, lava flows, and diabase sheets and dikes. Strata within the basin gen- erally dip at less than 20' toward the border fault system, although they are locally more steeply dipping within transverse folds adja- cent to the border and intrabasinal faults (see fig. 7). McLaughlin's studies of the Stockton Formation (McLaughlin 1945; McLaughlin and Willard 1949; Willard et al. 1959) and our mapping of the thickness of Van Houten cy- cles (Olsen et al. 1989; Olsen 1989) clearly show that units of all ages thicken noticeably toward the border fault side of the basin, indi- cating that the faulting responsible for basin subsidence was occurring throughout the filling of the basin (contra Faill 1973). The basin is cut by a number of intrabasinal faults, but these appear to have developed late in the history of the basin, after deposi- tion of most of the preserved sedimentary rocks (Olsen 1985; Faill 1988; Schlische and Olsen 1988).
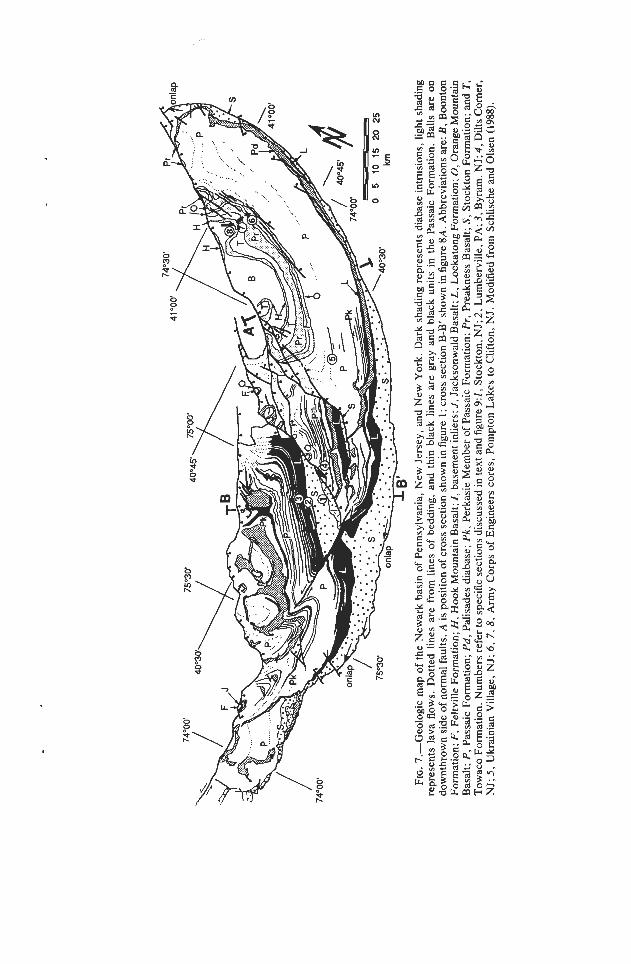
FIG. 7.-Geologic map of the Newark basin of Pennsylvania, New Jersey, and New York. Dark shading represents diabase intrusions, light shading represents lava flows. Dotted lines are from lines of bedding, and thin black lines are gray and black units in the Passaic Formation. Balls are on downthrown side of normal faults. A is position of cross section shown in figure 1; cross section B-B' shown in figure 8A. Abbreviations are: B , Boonton Formation; F, Feltville Formation; H, Hook Mountain Basalt; I , basement inliers; J, Jacksonwald Basalt; L, Lockatong Formation; 0, Orange Mountain Basalt; P, Passaic Formation; Pd, Palisades diabase; Pk, Perkasie Member of Passaic Formation; Pr, Preakness Basalt; 5, Stockton Formation; and T, Towaco Formation. Numbers refer to specific sections discussed in text and figure 9:1, Stockton, NJ; 2, Lumberville, PA; 3, Byram, NJ; 4, Dilts Comer, NJ; 5, Ukrainian Village, NJ; 6, 7, 8, Army Corps of Engineers cores, Pompton Lakes to Clifton, NJ. Modified from Schlische and Olsen (1988).

R. W. SCHLISCHE AND P. E. OLSEN
FIG. 8.-(A) Cross section A-A' of the Delaware River valley (see fig. 7 for location) before and after palinspastic restoration of slip on the intrabasinal faults. (B) Cross-sectional geometry of palinspastically- restored basin just after the deposition of the Perkasie Member. (C) Full-graben equivalent of basin shown in ( B ) . The areas of the shaded regions in (B) and (C) are equal.
Comparison of Model Predictions with Newark Basin Stratigraphy.-Before the full-graben model can be applied, the asym- metric Newark half-graben needs to be "transformed" to a symmetric basin. The ap- proach is to determine a representative cross- sectional area of the Newark basin for a given time-slice and then by conserving cross- sectional area convert the basin into a full- graben with border faults dipping at equal angles. Thus the width of the basin after de- position of a certain stratigraphic horizon and the depth of the basin for that time need to be known. Unfortunately, the Newark basin has been substantially eroded, and its present boundaries do not reflect its limits during de- position. Variations in thickness of units with distance from the border fault, however, do provide important constraints. In the Dela- ware River valley, the Newark basin is cut up into three fault blocks with repetition of the same formations (fig. 8A). Outcrops in the northwestern fault block indicate that the Stockton Formation is approximately 1800 m thick (Olsen 19801, whereas the Stockton is only about 900 m thick where it outcrops in the southeastern fault block (Willard et a]. 1959). Because the intrabasinal faulting com- pletely post-dates the preserved strata in these fault blocks (Olsen 1985; Fail1 1988;
Schlische and Olsen 19881, key horizons can be palinspastically restored as shown in figure 8A. In this restored basin, the base and top of the Stockton Formation are con- strained by known thicknesses and by the av- erage dip of the base of the Stockton in the northwestern fault block; where these two horizons converge is taken to be the south- eastern edge of the Newark basin after depo- sition of the Stockton Formation. A similar exercise can be performed on the Perkasie Member, where the constraints are (1) the po- sition of Perkasie outcrops in the northwest- ern fault block and (2) the height of the Perkasie above the top of the Stockton For- mation in the middle fault block. A projection of the line connecting these two points clearly extends further to the southeast than the lim- its of the Stockton Formation, again reflect- ing the progressive onlap of younger strata onto basement on the hanging wall margin of the basin.
In figure 8B, the horizon representing the Perkasie Member has been rotated to paleohorizontal. The basin was approxi- mately 6 km deep in its depocenter (cor- roborated by proprietary seismic lines) and >60 km wide after deposition of the Perkasie Member. We have assumed that the border fault did not rotate along with the hanging
QUANTITATIVE FILLING MODEL 147
wall and hence the 30' dip shown in figure 8B is the same as the present day dip (Ratcliffe et al. 1986). The "full-graben" equivalent of this basin is shown in figure 8C. By preserv- ing cross-sectional area, choosing an initial border fault spacing of 5 km (so that the "full- graben" more closely approximates the trian- gular cross-sectional geometry of the palin- spastically-restored Newark half-graben), and by preserving the same 6 km thickness of strata, the "border faults" of the "full- graben" must dip at approximately 13'. Be- cause of this transformation, the output of the model (always given for the deepest part of the full-graben) will most closely match the stratigraphic data from the deepest portion of the Newark half-graben.
Additional parameters entered intofie ba- sin filling model were determined as follows. The subsidence rate can be constrained be- cause, under fluvial sedimentation during de- position of the Stockton Formation, subsi- dence rate equaled accumulation rate. The maximum thickness of the Stockton Forma- tion in the deepest part of the basin is esti- mated to be 2500 m (see fig. 8A), and its paleontologically estimated duration is 3 m.y. (Cornet and Olsen 1985), thus yielding an es- timated accumulation rate of 0.833 mmlyr. A volumetric sedimentation rate (Vc = 4.15 x 10⁶ m31yr) was chosen to yield a transition from fluvial to lacustrine deposition 3 m.y. af- ter the start of subsidence. The maximum volume of water available (V,,, = 1.10 x lo1* m2) was chosen to yield the deepest lakes in the lower Lockatong Formation.
It must be emphasized again that the Newark basin did not evolve as a full-graben. This exercise is only a heuristic procedure meant to demonstrate an application of the basin filling model, not to precisely model the evolution of the Newark basin. It is clear that the approach has severe limitations: namely that it cannot predict transverse and along- strike changes in accumulation rate and lake depth in an asymmetrically-subsiding basin. Nonetheless, the trends in accumulation rate and "maximum" lake depth generated by the model in many instances match the same trends observed in the rock record.
The curves generated using equations (1-3) are shown in figure 9 with reference to actual stratigraphic data. Using the parameters out- lined above, the model can generate a transi-
tion from fluvial to lacustrine sedimentation at the appropriate time (fig. 9: b, b', and b"). It remains to be seen whether the V , needed to generate this transition is realistic. A po- tential test would be to calculate the volume of a key marker bed, such as the Perkasie Member, over the entire basin; unfortu- nately, the trends in thickness of units along- strike are not yet well enough defined. The model also predicts a systematic decrease in accumulation rate in the Lockatong and Passaic formations (fig. 9: f) . Actual strati- graphic data show a similar trend, suggesting that the filling of a basin growing in size through time might indeed be responsible. Notice, however, that the model's accumula- tion rates are consistently higher than those measured in the basin. If we assume that the sediment added to the model basin was fully compacted, then the discrepancy is most likely the result of the fact that the model's output applies to the deepest part of the basin and that the actual stratigraphic data were not collected from its depocenter. Additional comparisons and extrapolations are not war- ranted at this time because the stratigraphic data come from outcrops scattered through- out a basin in which appreciable transverse and along-strike changes occur.
The decreasing accumulation rates in the Lockatong and Passaic formations should not be necessarily construed to reflect decreasing subsidence rates. It can be argued that the lake cycles present in these formations repre- sent filling sequences: the basin subsided, formed a lake, which subsequently filled in, the basin subsided, etc. In this scenario, the decompacted cycle thickness would approxi- mate the deepest lake and the amount of sub- sidence. This argument is flawed on two accounts: (1) The cycle thickness in the Lockatong is only 5.5 m, decompacted to about 10 m, implying a lake depth of 10 m, yet the facies analysis of Olsen (1984~) requires the lakes that deposited microlaminated sedi- ments were minimally 70-100 m deep. (2) Most of the Passaic Formation is not mi- crolaminated, and therefore there are no good constraints on lake depth; it is then plausible that subsidence approximates de- compacted cycle thickness and was decreas- ing through the deposition of the Passaic For- mation. However, the Ukrainian Member in the middle Passaic is microlaminated and
R. W. SCHLISCHE AND P. E. OLSEN
I I f 0 5 10 15 20 25 30
Time (millions of years)
FIG. 9.-Predictions of the full-graben model (solid lines), based on the geometry depicted in figs. 7 and 8, compared to data from the Newark basin (dotted lines and crosses). The Y + W curve represents the height of the lake above the floor of the graben. Abbreviations are: a , filling equals sub- sidence resulting in fluvial sedimentation, with ac- cumulation rate (a') equal to subsidence rate; b, b ' , and b", onset of lacustrine deposition and sedimen- tologic closure; c and c', rapid increase in lake depth as depositional surface subsides below hy- drologic outlet; d and d' , deepest lake predicted by model and onset of hydrologic closure; e, major deviation from cumulative thickness curve in Early Jurassic; A hyperbolic decrease in accumulation rate predicted by model; solid cross represents data on accumulation rates from cyclical lacustrine
would require an instantaneous 70-100 m of subsidence, which had no effect on accumu- lation rate (see below). If subsidence was rel- atively uniform as predicted by the basin filling model, the basin would have been sedi- ment-starved during Passaic deposition, and the basin need not have undergone a radical deepening to accommodate the Ukrainian lake. All we can say for certain is that the subsidence rate was greater than the accumu- lation rate.
The basin filling model also predicts the very rapid rise in "maximum" lake depth in- ferred from the lower Lockatong Formation and its subsequent decline (fig. 9:m). It is also plausible that longer-term changes in climate were responsible for the trends in "max- imum" lake depth. Clearly, climatic changes played a large role in the basin's microstratig- raphy (Olsen 1986). However, there is no evi- dence that the trends in accumulation rate w e w v e r n e d by changes in climate. For ex- ample, in the upper Passaic Formation, the ramge of facies is identical to those in the driest portions of the Lockatong Formation (Olsen 1 9 8 4 ~ ) ~ yet the accumulation rates in the Passaic Formation are lower. Further- more, in the rare instances where deep lakes were produced in the Passaic Formation (i.e., the Ukrainian Member), there is no apprecia- ble change in accumulation rate from the sur- rounding dry facies (see fig. 9). Since trends in accumulation rate appear to be detached from a climatic origin, it seems reasonable (and parsimonious) to assume that changes in "maximum" lake depth might be similarly detached, although to a lesser extent. Note also that the model predicts that the last mi-
strata from scattered outcrops in the basin (see fig. 7); shaded cross represents estimate of accumula- tion rate in fluvial Stockton [estimated thickness (calculated from outcrops near location 1, fig. 7) divided by estimated duration]; g, anomalously high accumulation rate in extrusive zone, a devia- tion from the model's predictions; h, decreasing accumulation rate in the Boonton Formation; i, 100 m water depth line, the minimum depth for the formation of microlaminated sediments (Olsen 1984~); j, actual first occurrence of microlaminated sediments; k, actual last occurrence of micro- laminated sediments in lower Passaic Formation; 1, predicted last occurrence of microlaminated sedi- ments; m, slow decrease in lake depth; n, anoma- lous "superwet" climatic anomaly of the Ukrai- nian Member; 0, anomalously deep Jurassic lakes.
QUANTITATIVE FILLING MODEL 149
crolaminated black shale should form consid- erably later than is indicated by the data (fig. 9 : k ) . This most likely can be attributed to the fact that the model did not incorporate the effects of evaporation of water from a lake whose surface area was continually increas- ing. Thus, actual lake depth decreased more rapidly than predicted by the model.
Operating under its basic assumptions (uni- form subsidence, constant rates of input of sediment and water), the model cannot ex- plain the observed Early Jurassic increases in both accumulation rate and "maximum" lake depth (fig. 9:g, o), which imply that the Newark basin had actually decreased in size. In full-graben, changes in subsidence have either no effect or the wrong effect, for ac- cumulation rate and "maximum" lake depth are governed by the areas of the depositional and lake surfaces respectively. Increasing the subsidence rate only deepens the basin, but it cannot change the surface areas. Decreasing the subsidence rate initially has no effect until the basin fills to its lowest outlet, whereupon fluvial sedimentation returns.
In half-graben, however, maximum subsi- dence occurs adjacent to the border fault and decreases systematically toward the basin's hinge. An increase in the subsidence rate re- sults in an increase in basin asymmetry. As a result, sediments and water shift to the deep- est portion of the basin. A rapid increase in basin asymmetry in the earliest Jurassic of the Newark basin therefore could have re- sulted in (temporary) decreases in the areas of the depositional and lake surfaces, causing increases in accumulation rate and "max- imum" lake depth. Systematic decreases in accumulation rate and "maximum" lake depth recorded in the Boonton Formation (figs. 6 and 9:h) might then reflect the return to uniform subsidence, as the newly depos- ited sediments progressively onlapped the older sediments and "basement" rocks of the hanging wall.
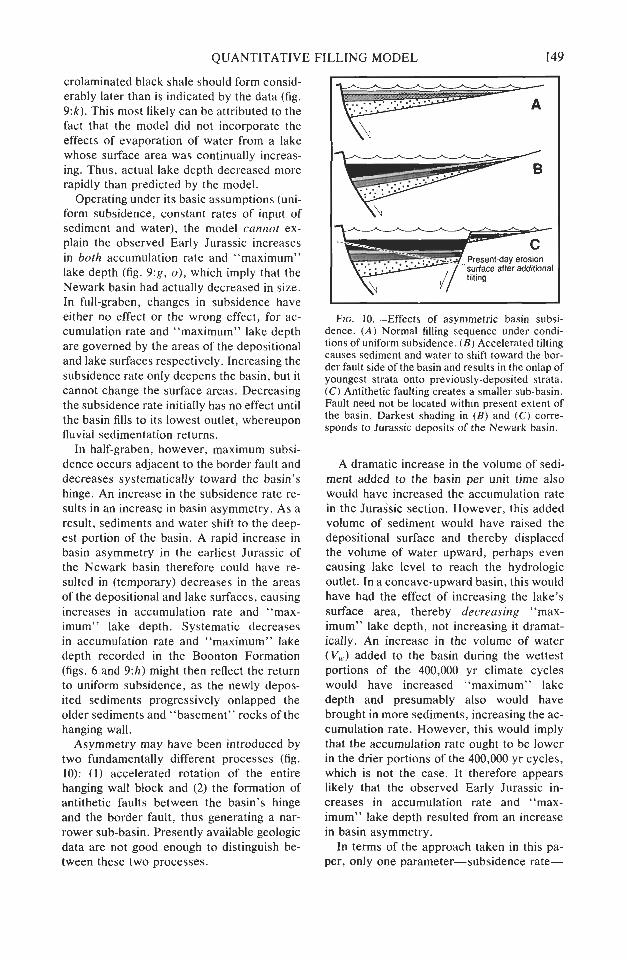
Asymmetry may have been introduced by two fundamentally different processes (fig. 10): (1) accelerated rotation of the entire hanging wall block and (2) the formation of antithetic faults between the basin's hinge and the border fault, thus generating a nar- rower sub-basin. Presently available geologic data are not good enough to distinguish be- tween these two processes.
FIG. 10.-Effects of asymmetric basin subsi- dence. ( A ) Normal filling sequence under condi- tions of uniform subsidence. (B) Accelerated tilting causes sediment and water to shift toward the bor- der fault side of the basin and results in the onlap of youngest strata onto previously-deposited strata. ( C ) Antithetic faulting creates a smaller sub-basin. Fault need not be located within present extent of the basin. Darkest shading in (B) and ( C ) corre- sponds to Jurassic deposits of the Newark basin.
A dramatic increase in the volume of sedi- ment a d d e d t o t h e basin per unit time also would haVe increased the accumulation rate in the ~ u r a s b s e c t i o n . However, this added volume of sediment would have raised the depositional surface and thereby displaced the volume of water upward, perhaps even causing lake level to reach the hydrologic outlet. In a concave-upward basin, this would have had the effect of increasing the lake's surface area, thereby decreasing "max- imum" lake depth, not increasing it dramat- ically. An increase in the volume of water (V,,,) added to the basin during the wettest portions of the 400,000 yr climate cycles would have increased "maximum" lake depth and presumably also would have brought in more sediments, increasing the ac- cumulation rate. However, this would imply that the accumulation rate ought to be lower in the drier portions of the 400,000 yr cycles, which is not the case. It therefore appears likely that the observed Early Jurassic in- creases in accumulation rate and "max- imum" lake depth resulted from an increase in basin asymmetry.
In terms of the approach taken in this pa- per, only one parameter-subsidence rate-

150 R. W. SCHLISCHE AND P. E. OLSEN
1 Lava Flows and Intercalated Sediments 1
FUNDY Bt HARTFORD BASIN
Fluvial and Alluvial Sediments 0.25 NEWARK BASIN
Accumulation rate 0.20 (mnvyr) determined by
Balls Bluff thickness of fixed-period Sinstone / lacustrine cycles
. . :. ::. 0.10 -0.24 Sandsty.
:..: ..:.. -0.40 : : : : : :.Â¥
Lower Barren Beds-
DEEP RIVER BASH Sanford Sub-basil
I imn~vrt estimated bv
by its paleontologplly estimated dur ion
FIG. 11 .-Chronostratigraphic sections of several Newark Supergroup basins, showing trends in accumu- lation rate. In all of the basins, the transition from fluvial to lacustrine deposition occurred at different times. The marked increases in accumulation rate and "maximum" lake depth associated with the extrusive episode occurred simultaneouslv in all basins that contain a Jurassic section. Modified from Olsen et al.
needs to be altered to explain the marked changes in the Jurassic sequence. In terms of the traditional approach, the changes would be explained by increasing both the volume of sediment and water added to the basin. For example, Manspeizer (1988) cites the deep Jurassic lakes as evidence of a wetter Ju- rassic climate. Our new approach indicates that climate need not necessarily have been responsible.
Other Basins.-The basin filling model predicts a basic tripartite stratigraphic pat- tern consisting of (1) a fluvial base, which would not be present if the subsidence rate is high and/or the rate of sediment input is low), (2) a middle lacustrine interval showing de- creasing accumulation rates and evidence of deep lakes near its base followed by gradual shoaling, and (3) possibly an upper fluvial in- terval, deposited during waning subsidence. These predictions provide a convenient frame of reference against which the ob- served stratigraphy of basins can be com- pared and their histories deciphered.
All of the Newark Supergroup basins shown in figure 11 contain a basal fluvial unit (Reinemund 1955; Hubert et al. 1978; Hubert
and Forlenza 1988; Ressetar and Taylor 1988; Olsen et al. 1989; Smoot 1989). In the Fundy, Culpeper, R ichmtfn ind Deep River basins, the fluvial units are overlain by predomi- nantly lacustrine deposits (Reinemund 1955; Ressetar and Taylor 1988; Smoot 1989) with the deepest water intervals definitely occur- ring near the base of the lacustrine sequence in the Deep River, Richmond, and Fundy basins (Olsen et al. 1989). In the Blomidon Formation of the Fundy basin, studies of scattered outcrops support a decrease in ac- cumulation rate up-section (Olsen et al. 1989). In the Hartford basin, the basal New Haven Arkose is fluvial until just prior to the eruption of the first basalt flow (Olsen et al. 1989). It is possible that the basin was subsid- ing too slowly or the volumetric sedimenta- tion rate was too high to have permitted the onset of lacustrine deposition. It is also possi- ble that the preserved fluvial strata are mar- ginal to lacustrine strata. Since paleocurrents flowed from east to west at the time of New Haven deposition (Hubert et al. 1978) and the strata now dip to the east, any lacustrine strata undoubtedly now would be eroded. In the upper Triassic portions of the Culpeper

QUANTITATIVE FILLING MODEL
and Deep River basins, a higher content of coarse clastic material suggests that fluvial sedimentation may have returned (Olsen et al. 1989), signaling a decrease in the subsi- dence rate. It also is possible that the coarse elastics reflect the proximity to the border fault or that they are the marginal facies to lacustrine strata deposited in a deeper portion of the basin. More study is needed to resolve this problem. The Otterdale Sandstone of the Richmond basin is largely fluvial (Ressetar and Taylor 1988) and contains evidence of Late Triassic paleo-canyon systems appar- ently cut by rivers after subsidence had stopped or during uplift of the basin (B. Cor- net pers. comm. 1989).
In the Fundy, Hartford, and Culpeper ba- sins, the syn- and post-extrusive formations record higher accumulation rates and greater "maximum" lake depths over the preceding Triassic portions (fig. 11; Olsen et al. 1989), possibly reflecting increased asymmetry in each of these basins in the earliest Jurassic. The uppermost Portland Formation of the Hartford basin appears to be fluvial in origin (Olsen et al. 1989). If no lacustrine strata are located downdip of the exposed fluvial strata, then this interval recorded a slowing of basin subsidence, which allowed the Hartford ba- sin to once again fill its lowest outlet.
Lake Bogoria in the Gregory Rift and the hydrologically-open Lake Tanganyika repre- sent two modern examples (Lambiase and Rodgers 1988; Lambiase 1990) of graben in the first two stages, respectively, of the mod- el's tripartite evolution. The Keweenawan trough of Michigan and Wisconsin (Elmore and Engel 1988) also shows a tripartite stratigraphic architecture.
Jones (1988) presented a graph of cumula- tive sediment and lava flow thickness plotted against time for the Kenya Rift east of the Elgeyo escarpment. Although there is consid- erable scatter, the rate of increase of cumula- tive thickness decreases up-section, which may indicate that the basin was increasing in size through time. A paleomagnetically and radiometrically calibrated plot of cumulative sediment thickness against time for the Ngor- ora Formation of the Kenya Rift shows the same trend (Tauxe et al. 1985; their fig. 4). The higher accumulation rates in the lower part of the section were interpreted to reflect the rapid infilling of a topographic depression
and the subsequent lower accumulation rates to reflect sedimentation keeping up with sub- sidence, implying that excess sediments were leaving the basin. However, the stratigraphy of the upper two-thirds of the Ngorora For- mation is predominantly lacustrine (Bishop and Pickford 1972), implying sedimentologic closure. Thus, the decrease in accumulation rate up-section may be an indication of a ba- sin growing in size through time, fitting our model's predictions.
Cumulative sediment thickness and ac- cumulation rate curves for the Cenozoic Val- lecito-Fish Creek basin in the Imperial Valley in California (Johnson et al. 1983; their figs. 4 and 5) bear a strong resemblance to those in figure 9. As the sediments were deposited largely in shallow marine waters, implying that sedimentation kept up with subsidence, Johnson et al. (1983) interpreted the curves to reflect decreasing rates of tectonic subsi- dence. Alternatively, the basin may have been subsiding uniformly and growing in size through time.
SUMMARY AND DISCUSSION
Stratal onlap geometry in extensional ba- sins indicates that the tiasins were growing in size through time, and therefore the depo- sitional surface area was also increasing through time. Under conditions of uniform subsidence and constant rate of sediment and water input, a simple basin filling model pre- dicts an initial period of fluvial sedimentation as the volume of sediments available exceeds the capacity of the basin, such that the ac- cumulation rate equals the subsidence rate. As the given volume of sediment is spread over a larger and larger basin volume, a point is reached when the sediments exactly fill the basin; subsequently, lacustrine deposition occurs. Accumulation rate decreases as the sediments are spread over a larger deposi- tional surface area. After the onset of lacus- trine deposition, lake depth should rapidly deepen to a maximum (as the finite volume of water available just fills the basin between the hydrologic outlet and the depositional sur- face) and then systematically decrease as the volume of water is spread over a larger area. If the subsidence rate is fast enough or the sediment input rate slow enough, lacustrine deposition will occur from the outset.
The basin filling model provides a frame-
152 R. W. SCHLISCHE AND P. E. OLSEN
work for understanding the stratigraphic de- velopment of extensional basins, particularly the Newark basin of eastern North America. Many of the observed changes through the stratigraphic sequence can be explained sim- ply as the consequence of the filling of a growing basin: the transition from fluvial to lacustrine deposition in the Triassic-age se- quence, the decrease in accumulation rate (calibrated by the thickness of Milankovitch- period lacustrine cycles) after the onset of lacustrine deposition, and the inferred rapid rise and subsequent slower decline in "max- imum" lake depth. Other observations re- quire additional explanations. For example, figure 9:p shows a marked departure in "maximum" lake depth in the Ukrainian Member of the Passaic Formation. Prior to this type of analysis, the "excursion" would simply have been interpeted as one of the many climatic changes thought to have in- fluenced the basin's stratigraphic develop- ment. With the basin filling model and Milan- kovitch-period modulation accounting for most of the changes in the stratigraphic se- quence, this anomaly stands out as something unique-a superwet climatic event. Accumu- lation rate was not affected, indicating that sediment accumulation rates and climate are not causally linked (fig. 9).
Analogous to thermal modeling of passive margins, the usefulness of the basin filling model rests in subtracting the stratigraphic effects due simply to the filling of the basin (intrinsic effects) from the observed sedimen- tary record. The resulting anomalies reflect departures from the basin filling model's as- sumptions (e.g., constant volume of sediment input per unit time, constant inflow rate of water, etc.) and point to important changes in tectonics, climate, and sediment and water budgets (extrinsic effects).
Furthermore, two or more basins may be compared in order to separate local from re- gional effects. For example, in each of the basins illustrated in figure 11, the transition from fluvial to lacustrine deposition in the Triassic-age sequences occurred at different times (local effect). This is to be expected: even if all the basins had equal subsidence rates and began subsiding simultaneously, their filling rates and the timing of the fluvial- lacustrine transition would depend on the di-
mensions of the basins, their geometries, and the rates of sediment input.
On the other hand, the marked increases in accumulation rate and "maximum" lake depth occurred simultaneously in the earliest Jurassic in all of the basins containing this sequence (regional effect; fig. 11). This anom- aly is attributed to a marked increase in basin asymmetry, causing sediment and water to pile up adjacent to the border fault (fig. 11). This asymmetry may have resulted from a sudden change in border fault geometry. However, this seems unlikely, as it would mean that all border faults experienced a similar change in geometry at the same time. More likely, the basins' asymmetry is at- tributable to a marked increase in the exten- sion rate, which was probably governed by deep-seated mantle processes.
The inferred regional increase in the exten- sion rate occurred just 150,000 yrs before the volumetrically massive early Mesozoic extru- sive event. The sudden increased extension may have thinned the crust sufficiently to al- low melting in the upper mantle. That the ac- celerated extension was a brief excursion is supported by the brief duration (<550,000 yrs) of the eastern North American extrusive episode (Olsen and Fedosh 1988). Further- more, the loading of up to 700 m of basalt and coeval intrusives within the basins may have contributed to their asymmetry.
Both the filling of a growing extensional ba- sin as a result of mechanical (fault-controlled) subsidence and subsidence induced by decay of thermal anomalies on passive margins pro- duce much the same result on accumulation rates: a decrease in rate up-section. We do not imply that our basin filling model is appli- cable to deposits resulting from thermal sub- sidence on known passive margins. How- ever, care must be taken in interpreting accumulation rates in older (particularly fos- sil-poor) rocks for which precise tectonic and depositional settings (marine vs. continental) may not be known and the cause of the subsi- dence (mechanical vs. thermal) may be con- fused. The resolution of this problem may be aided somewhat by the observation that ther- mal subsidence tends to be regionally persis- tent, whereas mechanical subsidence gener- ally is restricted to smaller, discrete basins, where diagnostic coarse-grained facies may
QUANTITATIVE FILLING MODEL 153
point to normal faulting as the cause of sub- sidence.
In basins in which fault-controlled subsi- dence is thought to be the dominant mecha- nism of basin evolution, as in the basins of the Newark Supergroup, the minimum subsi- dence rate can be constrained, for the sub- sidence rate is greater than the filling rate during lacustrine deposition and equal to the filling rate during fluvial deposition. Ulti- mately, by combining the results of the ba- sin filling model's subsidence analysis with knowledge on how extensional basins grow and deform through time (e.g., Wernicke and Burchfiel 1982; Gibbs 1984), it may be possi- ble to estimate how the extension rate varied throughout the history of Early Mesozoic ex- tension, provided the basins' geometries are also defined through time.
Before the extensional basin filling model can be used to its full potential, several important improvements need to be made. Foremost, three-dimensional quantitative models for the filling of half-graben need to be developed, models that take into account not only variations in subsidence with position in the basin but also build in the along-strike growth of the basin. The effects of differential relief and the erosion of uplifted blocks on the filling of the basins has yet to be addressed. The non-linear losses of water volume to evaporation still need to be quantified as well as the effects of sediment compaction. Future models also need to incorporate different filling sequences for structurally distinct yet sedimentologically-linked half-graben, such as the Newark-Gettysburg-Culpeper system in eastern North America (Olsen et al. 1989)
and the Ruzizi-Kigoma-Southern deposi- tional basins of Lake Tanganyika (Burgess et al. 1988; Lambiase 1990). In addition, the ex- isting geometry of the extensional basins needs to be more tightly constrained, ideally through a network of intersecting transverse and along-strike seismic lines.
Despite the shortcomings of the exten- sional basin filling model presented in this re- port, the preliminary results are encouraging: even under the simplest conditions, continen- tal facies in extensional basins are expected to exhibit predictable changes through time as a consequence of the changing geometry of the basin and not necessarily as a result of changing tectonic or climatic parameters. In- deed, in order to recognize changes in the extrinsic parameters, the changes intrinsic to the basin must first be subtracted from the stratigraphic record.
ACKNOWLEDGMENTS.-We thank Gerard Bond, William hosworth, Roger Buck, A1 Froelich, Joseph Lambiase, Fred Mandel- baum, and Joseph Smoot for valuable dis- cussions. This paper was greatly improved by reviews from Mark Anders, Nicholas Christie-Blick, Bernie Coakley, Bruce Cor- net, Michelle Kominz, Teresa Jordan, Mar- jorie Levy, and Warren Manspeizer. We gratefully acknowledge support from the Do- nors of the American Chemical Society ad- ministered by the Petroleum Research Fund and the National Science Foundation (Grants BSR-87-17707 to PEO and EAR-87-21 103 to G. Karner, M. Steckler, and PEO). This pa- per is Lamont-Doherty Geological Observa- tory Contribution Number 4575.
REFERENCES CITED
ANDERSON, R. E.; ZOBACK, M. L.; and THOMPSON, G. A., 1983, Implications of selected subsurface data on the structural form and evolution of some basins in the northern Basin and Range province, Nevada and Utah: Geol. Soc. America Bull., v. 94, p. 1055-1072.
BADLEY, M. E.; PRICE, J. D.; DAHL, C. R.; and AGDESTEIN, T. , 1988, The structural evolution of the northern Viking graben and its bearing upon extensional modes of basin formation: Jour. Geol. Soc. (London), v. 145, p. 455-472.
BALKWILL, H. R., 1987, Labrador basin: Structural and stratigraphic style, in BEAUMONT, C., and TANKARD, A. J., eds., Sedimentary Basins and
Basin-Forming Mechanisms: Can. Soc. Petr. Geol. Mem. 12, p. 17-43.
BALLY, A. W., 1981, Atlantic-type margins, in BALLY, A. W., ed., Geology of Passive Conti- nental Margins: History, Structure, and Sed- imentologic Record (with Emphasis on the At- lantic Margin): AAPG Education Course Note Series 19, p. 1-1-1-48.
BISHOP, W. W., and PICKFORD, M. H. L., 1975, Geology, fauna and paleoenvironments of the Ngorora Formation, Kenya Rift Valley: Nature, V. 254, p. 185-192.
BLAIR, T. C . , and BILODEAU, W. L., 1988, eve lop- ment of tectonic cyclothems in rift, pull-apart,

R. W. SCHLISCHE AND P. E. OLSEN
and foreland basins: sedimentary response to episodic tectonism: Geology, v. 16, p. 517-520.
BOND, G. C., and KOMINZ, M. A., 1984, Construc- tion of tectonic subsidence curves for the early Paleozoic miogeocline, southern Canadian Rocky Mountains: Implications for subsidence mechanisms, age of breakup, and crustal thin- ning: Geol. Soc. America Bull., v. 95, p. 155- 173.
BURGESS, C. F.; ROSENDAHL, B. R.; SANDER, S.; BURGESS, C. A.; LAMBIASE, J.; DERKSEN, S.; and MEADER, N., 1988, The structural and strati- graphic evolution of Lake Tanganyika: a case study of continental rifting in MANSPEIZER, W., ed., Triassic-Jurassic Rifting, Continental Breakup, and the Origin of the Atlantic Ocean and Passive Margins: New York, Elsevier, p. 859-881.
CORNET, B., 1977, The palynostratigraphy and age of the Newark Supergroup: Unpub. Ph.D. dis- sertation, Pennsylvania State University, State College, PA, 505 p.
, and OLSEN, P. E., 1985, A summary of the biostratigraphy of the Newark Supergroup of eastern North America, with comments on early Mesozoic provinciality, in WEBER, R., ed., I11 Cong. Latinoamericano Paleontol., Mexico, Simposio Sobre Floras del Triasico Tardio, su Fitografia y Paleoecologia., Mem., p. 67-81.
ELMORE, R. D., and ENGEL, M. H., 1988, The Pre- cambrian Nonesuch Formation of the North American Mid-Continent rift, sedimentology and organic geochemical aspects of lacustrine depo- sition, in Lacustrine exploration: case studies and modem analogues: AAPG Res. Conf. (Snowbird, Utah), September 7-9, 1988.
FAILL, R. T., 1973, Tectonic development of the Triassic Newark-Gettysburg basin in Pennsylva- nia: Geol. Soc. America Bull., v. 84, p. 725-740. - 1988, Mesozoic tectonics of the Newark
basin, as viewed from the Delaware River, in HUSCH, J. M., and HOZIK, M. J., eds., Geology of the Central Newark Basin: Fifth Meet. Geol. Assoc. New Jersey (Rider College, Law- renceville), p. 19-4 1 .
FEDOSH, M. S., and SMOOT, J. P., 1988, A cored stratigraphic section through the northern Newark basin, in FROELICH, A. J., and ROBINSON, G. R., JR., eds., Studies in the Early Mesozoic Basins of the Eastern United States: U.S. Geol. Survey Bull. 1776, p. 19-24.
FRASER, G. D.; WITKIND, I. J.; and NELSON, W. H., 1964, A geological interpretation of the epicen- tral area-the dual-basin concept: U.S. Geol. Survey Prof. Paper 435, p. 99-106.
FROELICH, A. J., and OLSEN, P. E., 1984, Newark Supergroup, a revision of the Newark Group in eastern North America: U.S. Geol. Survey Bull. 1537A, p. A55-A58.
GIBBS, A. D., 1984, Structural evolution of exten- sional basin margins: Jour. Geol. Soc. (London), v. 141, p. 609-620.
HUBERT, J. F., and FORLENZA, M. F., 1988, Sedimentology of braided river deposits in Up- per Triassic Wolfville redbeds, southern shore of Cobequid Bay, Nova Scotia, Canada, in MAN-
SPEIZER, W., ed., Triassic-Jurassic Rifting, Conti- nental Breakup, and the Origin of the Atlantic Ocean and Passive Margins: New York, Elsevier, p. 231-247.
; REED, A. A,; DOWDALL, W. L.; and GIL- CHRIST, J. M., 1978, Guide to the red beds of Central Connecticut, in 1978 Field Trip, Eastern Section, SEPM: University of Massachusetts (Amherst) Dept. Geology and Geography Con- trib. 32, 129 p.
HUTCHINSON, D. R.; KLITGORD, K. D.; and DE- TRICK, R. S., 1986, Rift basins of the Long Island Platform: Geol. Soc. America Bull., v. 97, p. 688-702.
JOHNSON, N. M.; OFFICER, C. B.; OPDYKE, N. D.; WOODARD, G. D.; ZEITLER, P. K.; and LINDSAY, E. H., 1983, Rates of Cenozoic tectonism in the Vallecito-Fish Creek basin, western Imperial Valley, California: Geology, v. 1 1 , p. 664-667.
JONES, W. B., 1988, Listric growth faults in the Kenya Rift Valley: Jour. Struc. Geol., v. 10, p. 661-672.
LAMBIASE, J., 1990, A model for tectonic control of lacustrine stratigraphic sequences in continental rift basins, in KATZ, B., and ROSENDAHL, B.,
'Ñeds. Lacustrine exploration: case studies and modem analogues: AAPG Mem., in press.
', , and RODGERS, M. R., 1988, A model for tectonic control of lacustrine stratigraphic se- quences in continental rift basins, in Lacustrine exploration: case studies and modem analogues: AAPG Res. Conf. (Snowbird, Utah), September 7-9, 1988.
LEEDER, M. R., and GAWTHORPE, R. L., 1987, Sedimentary models for extensional tilt-block1 half-graben basins, in COWARD, M. P.; DEWEY, J. F.; and HANCOCK, P. L., eds., Continental ex- tensional tectonics: Geol. Soc. (London) Spec. Pub. 28, p. 139-152.
LYELL, C., 1847, On the structure and probable age of the coal field of the James River, near Rich- mond, Virginia: Quarterly Jour. Geol. Soc. (London), v. 3, p. 261-280.
MANSPEIZER, W., 1988, Triassic-Jurassic rifting and opening of the Atlantic: an overview, in MAN- SPEIZER, W., ed., Triassic-Jurassic Rifting, Conti- nental Breakup, and the Origin of the Atlantic Ocean and Passive Margins: New York, Elsevier, p. 41-79.
, and OLSEN, P. E., 1981, Rift basins of the passive margin: tectonics, organic-rich lacus- trine sediments, basin analyses, in HOBBS, G. W., 111, ed., Field Guide to the Geology of the Paleozoic, Mesozoic, and Tertiary Rocks of New Jersey and the Central Hudson Valley: New York, Petroleum Exploration Society of New York, p. 25-105.
MCKENZIE, D. P., 1978, Some remarks on the de- velopment of sedimentary basins: Earth Planet. Sci. Letters, v. 40, p. 25-32.
MCLAUGHLIN, D. B., 1945, Type sections of the Stockton and Lockatong Formations: Pennsyl- vania Acad. Sci. Proc., v. 19, p. 102-113.
, and WILLARD, B., 1949, Triassic facies in the Delaware Valley: Pennsylvania Acad. Sci. Proc., v. 23, p. 34-44.

QUANTITATIVE FILLING MODEL 155
OLSEN, P. E., 1978, On the use of the term Newark for Triassic and Early Jurassic rocks of eastern North America: Newsl. Strat., v. 7, p. 90-95.
, 1980, The latest Triassic and Early Jurassic formations of the Newark basin (eastern North America, Newark Supergroup): stratigraphy, structure, and correlation: N.J. Acad. Sci. Bull., v. 25, p. 25-51. - 1984a, Comparative paleolimnology of the
Newark Supergroup: a study of ecosystem evo- lution: Unpub. Ph.D. dissertation, Yale Univer- sity, New Haven, CT, 726 p.
, l984b, Periodicity of lake-level cycles in the Late Triassic Lockatong Formation of the Newark basin (Newark Supergroup, New Jersey and Pennsylvania), in BERGER, A.; IMBRIE, J.; HAYS, J.; KUKLA, G.; and SALTZMAN, B.; eds., Milankovitch and Climate, Pt. 1: Dordrecht, D. Reidel, p. 129-146.
, 1985, Significance of great lateral extent of thin units in the Newark Supergroup (Lower Mesozoic, eastern North America): AAPG Bull., v. 69, p. 1444. - 1986, A 40-million-year lake record of early
Mesozoic climatic forcing: Science, v. 234, p. 842-848.
, 1989, Stratigraphy, facies, depositional en- vironments, and paleontology of the Newark SU- pergroup, in HATCHER, R. D., JR.; THOMAS, W. A.; and VIELE, G., eds., The Appalachian-Oachita in the United States: Geol. Soc. America, The Geology of North America, v. F-2, p. 343-350.
, and FEDOSH, M., 1988, Duration of Early Mesozoic extrusive igneous episode in eastern North America determined by use of Milan- kovitch-type lake cycles: Geol. Soc. America (Abs. with Prog.), v. 20, p. 59.
, and SCHLISCHE, R. W., 1988a, Quantitative rift basin evolution: application of extensional basin filling model to early Mesozoic rifts: Geol. Soc. America (Abs. with Prog.), v. 20, p. 59.
-, and - , 19886, Unraveling the rules of rifts: Lamont-Doherty Geological Observatory1 1988 Yearbook, p. 26-31. -- ; and GORE, P. J. W., eds., 1989,
Tectonic, Depositional, and Paleoecological His- tory of Early Mesozoic Rift Basins, Eastern North America, Int. Geol. Cong. Field Trip T- 351: Washington, D.C., American Geophysical Union, 174 p.
RATCLIFFE, N. M., and BURTON, W. C., 1985, Fault reactivation models for the origin of the Newark basin and studies related to U.S. eastern seismic- ity: U.S. Geol. Survey Circ. 946, p. 36-45. -- ; D'ANGELO, R. M.; and COSTAIN,
J. K., 1986, Low-angle extensional faulting, reactivated mylonites, and seismic reflection ge- ometry of the Newark basin margin in eastern Pennsylvania: Geology, v. 14, p. 766-770.
REINEMUND, J. A., 1955, Geology of the Deep River coal field, North Carolina: U.S. Geol. Survey Prof. Paper 246, 159 p.
RESSETAR, R., and TAYLOR, G. K., 1988, Late Triassic depositional history of the Richmond and Taylorsville basins, eastern Virginia, in MANSPEIZER, W., ed., Triassic-Jurassic Rifting,
Continental Breakup, and the Origin of the At- lantic Ocean and Passive Margins: New York, Elsevier, p. 423-443.
SCHLISCHE, R. W., and OLSEN, P. E., 1987, C0m- parison of growth structures in dip-slip vs. strike-slip dominated rifts: Eastern North America: Geol. Soc. America (Abs. with Prog.), v. 19, p. 833.
, and - , 1988, Structural evolution of the Newark basin, in HUSCH, J. M., and HOZIK, M. J., eds., Geology of the Central Newark Ba- sin: 5th Annual Meeting New Jersey Geol. As- SOC., p. 43-65.
SMITH, R. B., and BRUHN, R. L., 1984, Intraplate extensional tectonics of the eastern Basin- Range: influences on structural style from seismic reflection data, regional tectonics, and thermal-mechanical models of brittle-ductile de- formation: Jour. Geophys. Res., v. 89, p. 5733- 57624 -
SMOOT, J. P., 1989, Fluvial and lacustrine facies of the early Mesozoic Culpeper basin, Virginia and Maryland, Int. Geol. Cong. Field Trip T-213: Washington, D.C., American Geophysi- cal Union, 15 p.
STECKLER, M. S., and WATTS, A. B., 1978, Subsi- dence of the Atlantic-type continental margin off New York: Earth Planet. Sci. Letters, v. 41, p. 1-13.
; WATTS, A. B.; and THORNE, J. A., 1988, Subsidence and basin modeling at the U.S. At- lantic passive margin, in SHERIDAN, R. E., and GROW, J. A., eds., The Atlantic Continental Mar- gin: U.S.: Geol. Soc. America, The Geology of North America, v. 1-2, p. 399-416.
SWANSON, M. T., 1986, Preexisting fault control for Mesozoic basin formation in eastern North America: Geology, v. 14, p. 419-422.
TAUXE, L.; MONAGHAN, M.; DRAKE, R.; CURTIS, G.; and STAUDIGEL, H., 1985, Paleomagnetism of Miocene East African Rift sediments and the cal- ibration of the geomagnetic reversal time scale: Jour. Geophys. Res., v. 90, p. 4639-4646.
VAN HOUTEN, F. B., 1964, Cyclic lacustrine sed- imentation, Upper Triassic Lockatong Forma- tion, central New Jersey and adjacent Pennsyl- vania: Geol. Survey Kansas Bull., v. 169, p. 497-53 1. - 1977, Triassic-Liassic deposits of Morocco
and eastern North America: Comparison: AAPG Bull., V. 61, p. 79-94.
VREELAND, J. H., and BERRONG, B. H., 1979, Seismic exploration in Railroad Valley, Nevada, in NEWMAN, G. W., and GOODE, H. D., eds., Basin and Range Symposium and Great Basin Field Conference: Denver, Rocky Mountain As- soc. Geologists, p. 557-569.
WERNICKE, B., and BURCHFIEL, B. C., 1982, Modes of extensional tectonics: Jour. Struc. Geol., v. 4, p. 105-115.
WILLARD, B.; FREEDMAN, J.; MCLAUGHLIN, D. B.; RYAN, J. D.; WHERRY, E. T.; PELTIER, L. C.; and GAULT, H. R., 1959, Geology and Mineral Resources of Bucks County, Pennsylvania: Pennsylvania Geol. Survey (4th Series) Bull. C9, 243 p.