
The Japanese Automotive Industry: Recent Developments and ...
76
The Japanese Automotive Industry: Recent Developments and Future Competitive Outlook Chris Lin May 1994 Report: UMTRI-94-13 The Office for the Study of Automotive Transportation The University of Michigan Transportation Research Institute 2901 Baxter Road Ann Arbor, MI 48109-2150 Phone: 3 13-764-5592 Fax: 3 13-936-1081
Transcript of The Japanese Automotive Industry: Recent Developments and ...

The Japanese Automotive Industry: Recent Developments and Future Competitive Outlook
Chris Lin May 1994
Report: UMTRI-94-13
The Office for the Study of Automotive Transportation The University of Michigan Transportation Research Institute
2901 Baxter Road Ann Arbor, MI 48109-2150
Phone: 3 13-764-5592 Fax: 3 13-936-1081


I'he Japanese Automotive Industry: Recent Developments and Future Competitive Outlook
Chris Lin* Office for the Study of Automotive Transportation
May 1994
ABSTRACT
As the automotive industry becomes increasingly competitive and global in nature, it
becomes more important to understand the dynamics of competition and the driving forces
of key competitors. This working paper analyzes the Japanese automotive manufacturers
and their primary subcontractors. It describes the Japanese role in the global industry, the
structure of their domestic industry, changes over the past decade, the bursting of their
bubble economy, and the implications of these dynamics for the North American auto
industry. Some aspects of this study parallel Office for the Study of Automotive
Transportation's recent analysis of the changing structure of the U.S. automotive parts
industry to permit an international perspective.
*Chris Lin prepared this paper as a research assistant at The Office for the Study of Automotive Transportation, concurrently completing his MBA at the University of Michigan. He is presently employed at Ford Motor Company.


Acknowledgements
I would like to express my sincere gratitude to a number of individuals for their time and
aid over the past year which contributed to this study: My advisor Professor Frank Strafford for
this theories and creativity. Professor Gary Saxonhouse for his motivating guidance. Professor
Stephen Salant for his modelling insights and encouragement. John Warner from the Stats Lab for
his statistical consulting. Paula Finnegan and Andrew Isztwan for their detailed feedback which
kept my presentation of material understandable from an undergraduate engineering perspective.
Phil Carlisle and Jeff Alden for their professional familiarity in the field. Dr. Dan Luria for his
valuable and intuititive expertise on the industry. Pete Heytler and the Industrial Development
Division for assisting in early research and development of ideas. And most of all, Dr. Sean
McAlinden and the Office for the Study of Automotive Transportation for providing me with
valuable information, insight, resources, and support.
Although their insights shaped the direction of my study, they are not responsible for the
use I have made of their comments.
This study is dedicated to the memory of Glenn Tarr, my boss and mentor during my
internship with Chevrolet. His dedication and genuine interest in numbers inspired me to further
sharpen my quantitative and analytical skills in order to put to useful means.

Table Of Contents
I . The Macro Perspective ................................................................................ 3 *The Development of Japan's Role in Global Automotive Industry .......................... 3 *The Role of the Auto Industry in the Japanese Economy ..................................... 6
I1 . The Japanese Automotive Industry .................................................................. 6 *Japanese Automotive Firm Structure ............................................................ 6 *Firm Characteristics/Measures ................................................................... 12 *Plants and the Subcontracting Relationship .................................................... 15 *Tension with Supplier and Subcontractor Relationships ..................................... 18
Geographical Location Analysis .................................................................... 19 *Firm Cluster Areas ................................................................................ 19
*Tokyo Metropolitan Area ..................................................................... -19 *Tokyo Headquarters and Cluster with Scattered Operations.. ............................. 21 *Aichi Prefecture/Nagoya Area ................................................................. 23 *Osaka Prefecture (Kansai area) ............................................................... 26 *Hiroshima Prefecture ........................................................................... 26 *Tokai Region .................................................................................... 27
*Merits and Implications of Clustering .......................................................... 27 *Movement to New Areas in Japan -Domestic Regionalization ............................ 29 *Movement Overseas - Global Regionalization ................................................ -34
IV . Bursting of the Japanese Bubble Economy ....................................................... 38 *Description - Rise of the Bubble .............................................................. 38 *The Bursting of the Bubble ...................................................................... 39 *Implications and Recent Developments in the Auto Industry ................................ 40
V . New Paradigm for the Japanese Automotive Industry ........................................... 43
VI . Summary and Discussion .......................................................................... -46
Appendix 1 ................................................................................................... 50
................................................................................................... Appendix 2 59
Appendix 3 ................................................................................................... 63
Appendix 4 .................................................................................................. -69
Other References ............................................................................................ 72

I. THE MACRO PERSPECTIVE
The Development of Japan's Role in Global Automotive Industry Even though Detroit is still heralded as the auto capital of the world, Japan has produced
more vehicles per year than the United States since 1980. Figure 1 compares U.S. and Japanese
vehicle production. U.S. production fluctuated between 7 and 13 million over the past two
decades, moving closely with domestic economic cycles, particularly after the oil shocks of 1974
and 1980. In contrast, Japanese production has been growing consistently over the past two
decades from 5.3 million in 1970 to its 1990 peak of 13.5 million. The Japanese automotive
industry developed in three stages: (1) infant domestic development, (2) export driven, and (3)
regionalization.
Figure 1: Light Vehicle Production United States and Japan; 1970- 1993
Year
12
n 10 4 2 *
$ 8 . X h 0 ":C14
Source: AAMA Motor Vehicle Facts and Figures 1993, Page 3 AAMA World Motor Vehicle Data 1993, Page 57
k 4 -
2
-
W United States
* Japan I
0 -. 1970 1975 1980 1985 1990

Figure 2: Motor Vehicle Registratior United States, Japan, World; 1965- 199 1
600
500
# 400
s ; 300
2 p 200 k
100
0 1965 1970 1975 1980 1985 1990
Year
Source: AAMA Motor Vehicle Facts and Figures 1993, Page 3 AAMA World Motor Vehicle Data 1993, Page 57
Figure 3: Japanese Passenger Car Exports and Domestic Production; 1970- 1992
I I I
1970 1975 1980 1985 1990 Year
Source: AAMA World Motor Vehicle Data 1993, Page 57,64

Source: AAMA World Motor Vehicle Data 1993
Since 1985, the Japanese assemblers have developed regionalization strategies in order to
offset trade tension and the appreciation of the yen. Transplants were established in the U.S. and
Europe, and exports began to diminish. While the need for regionalization, or localized production,
is apparent, there have been difficulties in successfully implementing this third phase of
development. Negative growth in foreign market penetration between 1990 and 1992, combined
with the sluggishness of the Japanese economy, has led to the first ever decline in production over a
two-year period since World War 11. The role of the automotive industry in the Japanese economy
and internal structure of the industry must be analyzed to understand the severity and permanence of
this phenomenon.
The Role of the Auto Industry in the Japanese Economy
The production of motor vehicles (shipments of Y31,344 billion) accounted for over 10
percent of total Japanese manufacturing and 30 percent of all machinery manufacturing in 1986.'
The automotive industry is also an important source of employment for Japan: 5.5 million
employees (over 10 percent of the 54.4 million total labor force) are either directly or indirectly
employed in the industry. Over 200,000 workers are employed by assemblers and their
subcontractors; the rest are employed in the supplier network and other supporting industries.2
THE JAPANESE AUTOMOTIVE INDUSTRY
Japanese Automotive Firm Structure
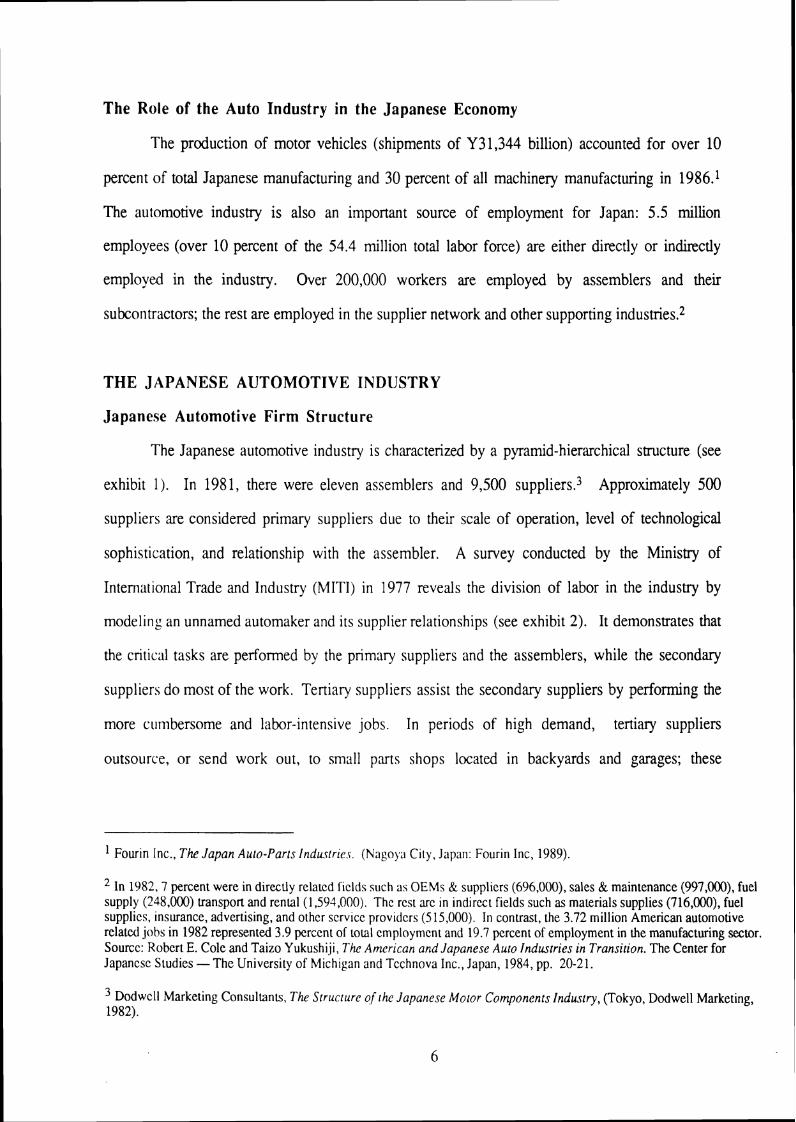
The Japanese automotive industry is characterized by a pyramid-hierarchical structure (see
exhibit 1). In 198 1, there were eleven assemblers and 9,500 supplier^.^ Approximately 500
suppliers are considered primary suppliers due to their scale of operation, level of technologicd
sophistication, and relationship with the assembler. A survey conducted by the Ministry of
International Trade and Industry (MITI) in 1977 reveals the division of labor in the industry by
modeling an unnamed automaker and its supplier relationships (see exhibit 2). It demonstrates that
the critical tasks are performed by the primary suppliers and the assemblers, while the secondary
suppliers do most of the work. Tertiary suppliers assist the secondary suppliers by performing the
more cumbersome and labor-intensive jobs. In periods of high demand, tertiary suppliers
outsource, or send work out, to small parts shops located in backyards and garages; these
Fourin Inc., The Japan Auto-Parts Industries. (Nagoya City, Japan: Fourin Inc, 1989).
In 1982, 7 percent were in directly related ficlds such as OEMs 8: suppliers (696,000), sales & maintenance (997,003, fuel supply (248,000) uanspon and rental(1,594,000). The rcst arc in indirect fields such as materials supplies (716,000), fuel supplies, insurance, advertising, and othcr service providers (5 15,000). In contrast, the 3.72 million American automotive related jobs in 1982 represented 3.9 percent of total employment and 19.7 percent of employment in the manufacturing sector. Sourcc: Robert E. Cole and Taizo Yukushiji, The American and Japanese Auto Industries in Transition. The Center for Japancsc Studies -The University of Michigan and Technova Inc., Japan, 1984, pp. 20-21.
Dodwcll Marketing Consultants. The S~ruaure of [he Japanese Moror Components Industry, (Tokyo. Dodwell Marketing, 1982).

Exhibit 1: Structure of Japanese Automotive Industry
/ Primary Suppliers \ Component md Syskm urcmbly/mmufrcture

Primary Suppliers (20.5%)
Exhibit 2: Division of Labor in the Japanese Automotive Industry
/ (Unnamed) \
Source: Small and Medium Enterprise Agency, Mnisky of International Trade and Industry (A survey conducted in 1977)
Notes: 1. The number of companies for "Primary Suppliers," "Secondary" and "Tertiary" subcontractors include possible overlappings.
2. The figures in parentheses for "Primary Suppliers," "Secondary," and "Tertiary" subcontr;lctors show Ihe respective percentages of small- and medium-sized businesses to the total in the respective sectors. Small and Medium Enterprise Agency defies a small- and medium-sized manufacturing fm as a company which employs fewer than 300 workers andlor whose paid-up capital is less than 100 million yen.

family-run operations provide the family with extra income, and provide even the lowest tier of
suppliers a buffer for production. The lower tiers provide to the tiers directly above them as
needed, and the higher tiers attempt to keep the tier directly below them content This relationship is
often described as paternalistic.
Most primary suppliers are subsidiaries or affiliates of the assembler; this lateral holding of
stocks and intertwining of relationships is typical of the classical kereitsu ~ y s t e m . ~ In 1990, 167
parts makers had equity relationships with vehicle makers; 53 of these parts makers had vehicle
makers as their top shareholders. Table 1 provides further detail of the equity relationships. The
sharing of interests creates a mutually dependent relationship: the supplier depends on the assembler
for its sales and often finance capital, and the assembler depends on the supplier for technological
advancements and uncompromised quality. This interdependence leads to customer and product
speciahzation for most suppliers, yet few assemblers are dependent on any single supplier for a
single part. Thus, the client (assembler) is considered the patron. In fiscal year 198 1, the members
of Auto Parts Industries Association (composed of 310 auto parts makers) delivered 84 percent of
their output to their patron assemblers. Typically, a small group of suppliers will account for 70
percent to 100 percent of the supply of any one particular item.
Keiretsu is defined here as "groups of (Japanese) business f i s tied by common industry or financial interest, and centrally coordinated by a bank, trading company, or major manufacturer." Taken from Keiretsu, USA.: A Tale of Japanese Power, Mid-America Project, Inc., KY, July, 1991.
9

Table 1: Parts Makers Owned by Vehicle Companies (as of fiscal 1990)
Source: Tovo Keizai Incorporated
Toyota
Nissan
Mazda
Honda
Mitsubishi
Suzuki
Daihatsu
Isuzu
Fuji
Hino
Nissan Diesel
Grand Total
Note: The numbers enclosed in parantheses denote parts makers of which the vehicle manufacturers are the top shareholders.
In contrast to the American supplier structure, Japanese companies purchase a large portion
of their components from a small set of primary suppliers (see exhibit 3). Thus, the number of
suppliers that they interact with is smaller, and the relationship requires a greater level of reliability
and long-term commitment. While some of the primary suppliers may be closely tied to the
assembler (as are the auto parts divisions of the American firms) the Japanese assembler is not held
accountable for the supplier's profitability or headcount. This provides the assembler a buffer when
adjusting to production changes and the economic environment. The primary suppliers shift a
portion of this adjustment cost to the secondary suppliers, who in turn transfer some to the tertiary
levels.
less than 5 %
9
7
7
9
15
4
3
6
2
14
13
8 9
5.9%
7 (1)
4 (2)
1
3 (1)
1
6 (1)
1
1
24 (5)
10.19%
4 (1)
2 (1)
1 (1)
1
8 (3)
Shares
20.29%
7 (7)
12 (12)
5 (4)
1 (1)
25 (24)
of equities
30.39%
3 (3)
6 (6)
2 (2)
1 (1)
12 (12)
4 0 - 4 9 %
2 (2)
3 (3)
1 (1)
6 (6)
50% or more
2 (2)
1 (1)
3 (3)
Total
32 (14)
36 (26)
9 (1)
14 (3)
17
4
3
18 (6)
3 (1)
17 (2)
14
167 (53)
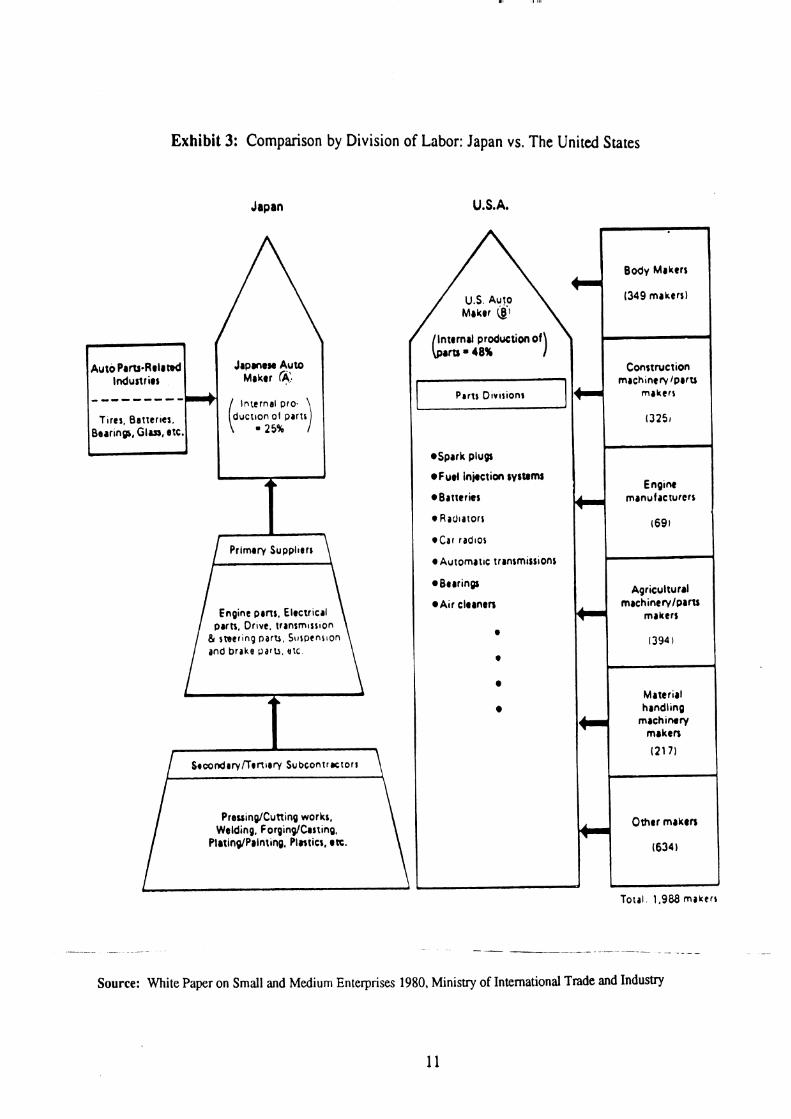
Exhibit 3: Comparison by Division of Labor: Japan vs. The United States
Japan U.S.A,
Source: White Paper on Small and Medium Enterprises 1980, Ministry of International Trade and Industry
Body Makers
(349 makers)
. I
~ u t o PIN-Relttsd Japnen Auto Construction Industries Maker 4, mach~nery Iparu _-------- Internal pro.
T~res, Batter~er, ducr~on of parts ( 825% 1 Berr~ngl, Glra, etC,
Primary Suppl~trt
Engine pmr . Electrical Parts, Drlve, transmlsslon
& sntring oarrr, Surpcnslon and brake paru, etc
Stcond~ryf l tn~cry S u b ~ ~ n t r ~ t O r l
Prrrring/Cutting works, Welding, f-or~ing/Cesting,
PlrtindPainring, Plnticr, etc.
Parts D~v~r ion t makers
@Spark pluw
Fuel Injection lystcms
(3251
Engine Batteries manufacturcrr
a Rad~arorr
a Car radlos
e ~ u t o m a t ~ c tranrmirr~onr
@Bearings
@Air cleanen
1691
Agriculturrl machinewlpafU
makers
a
a
e
13941
Material handling
machinery maken
( 2 1 71
Other maken
(6341
Toral. 1.988 maktrr

Honda, Mitsubishi, and Mazda have the simple, lateral, group structure illustrated in
exhibits 1 and 2, above. Suzuki and Isuzu's structures are comparable, but they also share a
relationship with General Motors. Toyota and Nissan's groups are more complex, as they also
possess longitudinal relationships with another pair of assemblers.
Firm Characteristics/Measures
Although the Japanese assemblers have similar characteristics, it is important to understand
the differences among the various groups. This study analyzes the eleven automotive assemblers
and their key assembly subcontractors. In order to examine the dynamics of industry structure over
time, data will be used to construct snapshots of the industry in 1981 and 1990.5 The analysis will
consider the groups' size in terms of employment, production, plant number and capacity, the plant
ratios among different types of facilities, productivity, supplier relationships, overseas investment,
and geographic location.
In terms of domestic production, Toyota is the largest vehicle producer, followed closely by
Nissan. The remaining seven companies together make up the final third of Japanese domestic
production. Table 2 summarizes the key characteristics of the Japanese automotive manufacturers,
and highlights a number of changes in the Japanese automotive industry during the 1 9 8 0 ~ . ~ Four
new plants were constructed: a tool and die plant, and an electronic plant by Toyota, a transmission
plant by Fuji Heavy, and an engine plant by Isuzu. Employment decreased by 7.4 percent to
approximately 203,000 employees. Production increased by 8.3 percent to approximately 992,000
vehicles per month. These trends indicate that the Japanese auto industry has been increasing its
capacity through investment in new plants and equipment. Japanese auto industry wages have
increased four-fold from 1975 to 1991, as shown i n figure 5. Rising Japanese labor costs
Data were collected from Dodwell Marketing Consultants, Fourin Inc., and company annual reports.
Appendix 1 provides detailed information on each plant including location, employment, monthly production, and products produced there.

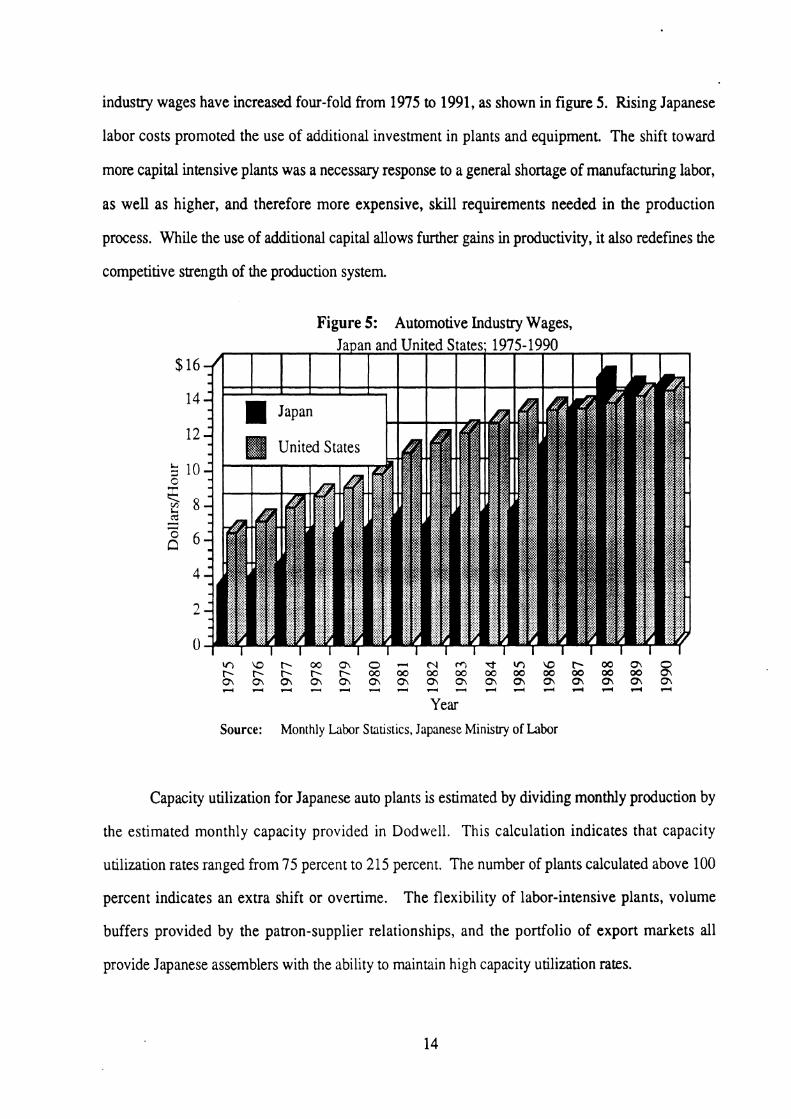
industry wages have increased four-fold from 1975 to 1991, as shown in figure 5. Rising Japanese
labor costs promoted the use of addtional investment in plants and equipment. The shift toward
more capital intensive plants was a necessary response to a general shortage of manufacturing labor,
as well as higher, and therefore more expensive, skill requirements needed in the production
process. While the use of additional capital allows further gains in productivity, it also redefines the
competitive strength of the production system.
Figure 5: Automotive Industry Wages,
' n \ 0 F 0 0 0 \ - C \ l r C , vr r- F F g W W W g W % k % % 8 2 ~ ~ ~ e ~ 2 s ~ ~ ~ s ~ e s s
Year Source: Monthly Labor Statistics, Japanese Ministry of Labor
Capacity utilization for Japanese auto plants is estimated by dividing monthly production by
the estimated monthly capacity provided in Dodwell. This calculation indicates that capacity
utilization rates ranged from 75 percent to 215 percent. The number of plants calculated above 100
percent indicates an extra shift or overtime. The flexibility of labor-intensive plants, volume
buffers provided by the patron-supplier relationships, and the portfolio of export markets all
provide Japanese assemblers with the ability to maintain high capacity utilization rates.

Productivity was estimated by dividing the monthly production by the total employees in the
company. Although this is not the traditional measure of productivity (direct labor hours per
vehicle), the number provides some measure to differentiate efficiency among producers and gauges
each organization's improvement over the decade. Mitsubishi experienced the greatest absolute gain
in productivity. Toyota's productivity also increased substantially, but seemingly at the expense of
its subcontractors. Nissan has improved its productivity, but needs to improve it further in order to
compete with the most productive assemblers. Honda's productivity improved; Mazda's
productivity declined. With higher labor costs in 1980s, it became imperative for Japanese
automotive f i to increase labor productivity; most Japanese companies chose to accomplish this
objective by investing in capital equipment.
Plants and the Subcontracting Relationship7
The total number of plants utilized by the eleven manufacturers and their subcontractors was
83 in 1981, and 88 in 1990. In both periods, about half of the plants were used for assembly, and
nearly one-fifth of the plants were run by subcontractors. Toyota and Nissan were the largest users
of subcontractors; eleven of sixteen plants assembling Toyota vehicles were subcontracted, and
nine of the fourteen plants producing Nissan vehicles were subcontracted. The data obtained for
this study focus on the subcontractors that assemble vehicles on a consignment basis for the eleven
assemblers. The analysis primarily looks at the component plants owned by the assembler and the
subcontracted assembly relationships, even though the kereitsu system also includes other primary
suppliers sourcing components.
Exhibit 4 illustrates the subcontracting relationship of the Toyota Group. Daihatsu and Hino
Motors are included with other subsidiaries and subcontractors in the group. Toyota is able to
influence these smaller companies, with its 14.6 percent stake in Daihatsu and a 10.4 percent
interest in Hino. The relationship also allows Toyota to bolster the subsidiary's financial strength,
Dodwell, Fourin Inc., and company annual reports and publications.

Exhibit 4: The Toyota Group
fOYOTAMOTOR
PRIMARY
TERTIARY
I I I I I I I
SECONDARY AND TERTIARY SUBCONTRACTORS
( RlNO MOTORS 1
PRIMARY SUPPLIERS
I SECONDARY I AND T E R T I A R Y SUBCON- TRACTORS
t
SECONDARY ' AND TE RTIARY SUBCON- 1 TRACTORS

product planning, parts rationalization, and overseas marketing capability. Hino and Daihatsu
produce their own brands and also are subcontracted to produce Toyota-badged cars and trucks.
Subcontractors accounted for approximately 46 percent of the 4 million Toyota-badged vehicles
produced in Japan in 1981, and about 40 percent of the 4.1 million Toyotas produced in Japan in
1990. Toyota and its subcontractors were thus able to produce approximately 70 percent of the
volume of GM vehicles produced in North America, with only half the number of plants.
Nissan's structure parallels Toyota's, except that Daihatsu is replaced by Fuji Heavy, and
Hino is replaced by Nissan Diesel. Fuji Heavy and Nissan Diesel are Japanese assemblers that are
also subcontractors for Nissan. Nissan owns 6.3 percent of Fuji Heavy and 45.6 percent of Nissan
Diesel. Nissan and Fuji Heavy joined forces in 1968 to produce Nissan passenger cars, and have
since shared management and some financial relations. Fuji Heavy also produces its own brand,
Subaru. Nissan Diesel, a leading manufacturer of diesel trucks and engines, produces Nissan brand
light-duty trucks for its parent company. Approximately 40 percent of the 3.1 million Nissan
vehicles produced in Japan in 1981 were produced by Nissan's subcontractors and subsidiaries.
This share dropped to approximately 35 percent of 3.5 million vehicles in 1990.
Honda and Mitsubishi are the two other assemblers that recently began to allow
subcontractors to assemble vehicles under their respective brand names. Yachiyo Industry produces
nearly 10 percent of all Honda-badged vehicles produced in Japan, and Toyo Koki produces
multipurpose vehicles for Mitsubishi.
The subcontracting relationship is valuable to assemblers because it allows them to achieve
significantly greater production without having to own all of the capacity. This gives them added
flexibility to adjust to market conditions, and at the same time allows the assembler to maintain full
employment and continue to operate at high capacity utilization rates. This relationship reduces risk
and hedges investment. Furthermore, keeping the same loyal workers and continuing to operate
the plant at high rates of capacity utilization allows management to continuously improve in-house
productivity. Productivity advances result from innovations in process technology, cross-functional
working teams, and close working relationships with primary suppliers. Japan's top four

assemblers, all of which use subcontractors for assembly, were able to increase their productivity
substantially between 198 1 and 1990.
Tension with Supplier and Subcontractor Relationships
While the subcontracting relationships and the kereitsu structure have been largely
responsible for the competitiveness of the Japanese automotive industry, the subcontracting
relationship can also be a burden, if the parent companies spread their resources too thinly over
noncompany personnel and management systems. Moreover, the current economic climate and
competitive environment have put special pressures on the unique structure of the Japanese auto
industry. Current automotive markets require longer production runs and fewer models and the
subcontractors responsible for producing established platforms or niche vehicles will have to alter
their traditional roles. Kereitsu group membership is no longer a guarantee of success. The
declining profitability of suppliers is another signal that the system is strained.
Even during the automotive boom in Japan in 1989-1990, financial statements indicated that
the assemblers gained at the expense of their suppliers. The announcements of financial reports in
fiscal 1989 reveal a significant gap in profits between the vehicle manufacturers and parts suppliers
in Japan. While nine of the eleven manufacturers posted significant increases in domestic sales,
approximately 30 percent of auto suppliers suffered a drop in profits despite an increase in sales
turnover. Another 50 percent remained unchanged financially. Suppliers of equipment and
electronic parts were able to achieve gains i n sales and profitability during the auto sales boom.
The key drivers squeezing the profits of suppliers during the mid 1980s included the
following: (1) labor shortages, which caused a surge in labor costs, (2) rising output, which drove
suppliers to invest in automation and flexible equipment to make up for the labor constraint, (3)
shorter product cycles, which made it imperative to achieve shorter runs and smaller lots and
diminished the potential gains from scale economies, and (4) the necessity of following vehicle
manufacturers overseas. The operating size of overseas plants is small due to the limited number of
patron transplant customers, malung it nearly impossible to produce most components at a lower
cost than in Japan. The pressure on profits is forcing the industry to restructure, which has a
number of implications on the geographical positioning of production.
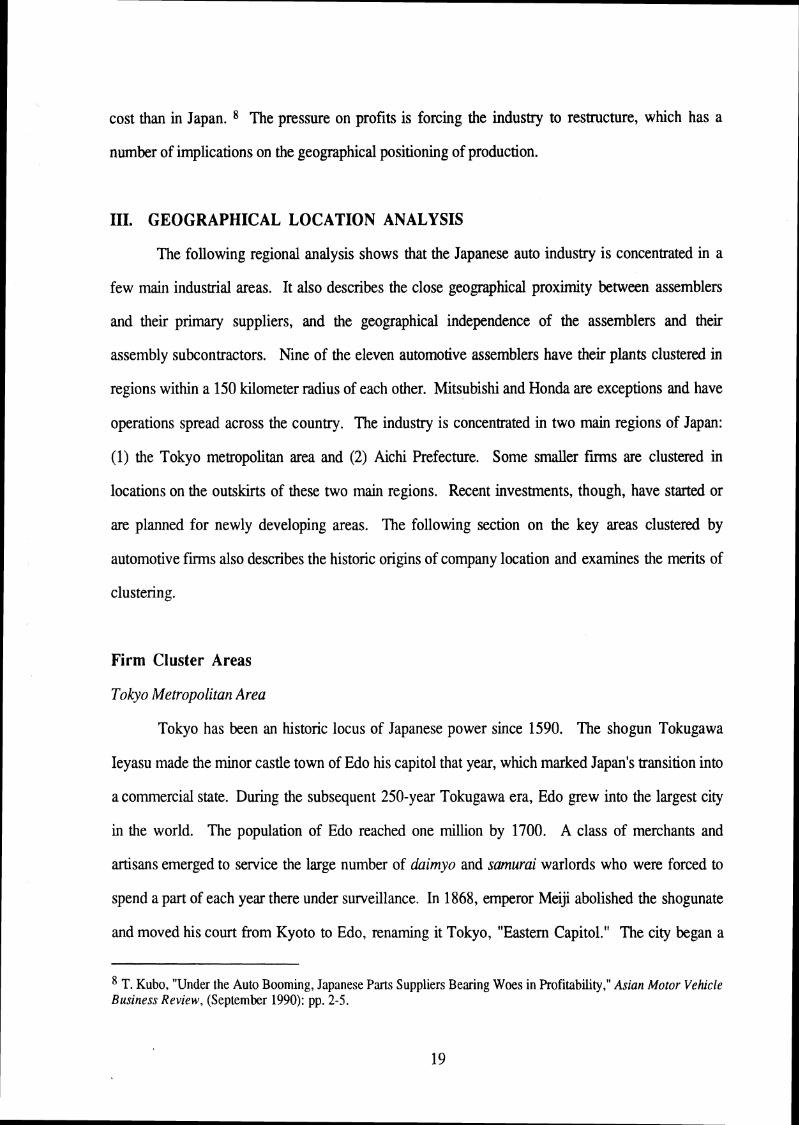
111. GEOGRAPHICAL LOCATION ANALYSIS
The following regional analysis shows that the Japanese auto industry is concentrated in a
few main industrial areas. It also describes the close geographical proximity between assemblers
and their primary suppliers, and the geographical independence of the assemblers and their
assembly subcontractors. Nine of the eleven automotive assemblers have their plants clustered in
regions within a 150 kilometer radius of each other. Mitsubishi and Honda are exceptions and have
operations spread across the country. The industry is concentrated in two main regions of Japan:
(1) the Tokyo metropolitan area and (2) Aichi Prefecture. Some smaller f m s are clustered in
locations on the outskirts of these two main regions. Recent investments, though, have started or
are planned for newly developing areas. The following section on the key areas clustered by
automotive firms also describes the historic origins of company location and examines the merits of
clustering.
Firm Cluster Areas
Tokyo Metropolitan Area
Tokyo has been an historic locus of Japanese power since 1590. The shogun Tokugawa
Ieyasu made the minor castle town of Edo his capitol that year, which marked Japan's transition into
a commercial state. During the subsequent 250-year Tokugawa era, Edo grew into the largest city
in the world. The population of Edo reached one million by 1700. A class of merchants and
artisans emerged to service the large number of daimyo and samurai warlords who were forced to
spend a part of each year there under surveillance. In 1868, emperor Meiji abolished the shogunate
and moved his court from Kyoto to Edo, renaming it Tokyo, "Eastern Capitol." The city began a
T. Kubo, "Under the Auto Booming, Japanese Parts Suppliers Bearing Woes in Profitability," Asian Motor Vehicle Business Review, (September 1990): pp. 2-5.

period of modernization to bring it in line with the West. The daimyo eventually left, and the
merchants, now able to move more freely, settled in the hilly areas in the western part of the city.
The modem Tokyo metropolitan area, with a population of 13 million, is the most densely
populated part of the country, and Japan's government, industry, and commerce are based in this
capitol city. Heavy and light industries located in this coastal region include automotive, as well as
electrical appliances, electronics, optical products, precision engineering, textiles, printing, and
publishing. The 2,000-square-kilometer (800 square mile) metropolitan area houses 24 of the 88
plants analyzed in this study, and is the location for the headquarters of five of the eleven
automotive assemblers.
Nissan is the largest of the assemblers in the Tokyo area, with headquarters in Tokyo and all
but one of its plants within a 150 kilometer radius of the headquarters. The key subcontractors,
including Fuji Heavy and Nissan Diesel, are also clustered in the Tokyo area. Fuji Heavy's three
subcontractor organizations are in the same prefecture. These include 157 firms belonging to the
Gunma Kyoryoku-Kai organization, 69 firms from Mitaka Kyoryoku-Kai, and 48 firms belonging
to the Isesaki Kyoryoku-Kai group. The Nissan Diesel Yayoi-Kai is divided into four subgroups,
which supply rubber, packing, machine parts, and castings, forgings, and pressed parts.
Even though Toyota is located in the Aichi prefecture, one of its main subcontractors, Hino,
has three automotive plants located in the Tokyo area. The Hamura plant produces trucks for
Toyota, the Nitta plant makes cast auto parts, and the headquarters plant in Hino produces medium
and heavy-duty trucks and buses. Harnura is near the headquarters in Hino-city, which is 30
kilometers west of Tokyo and 90 kilometers south of Hino's farthest plant in Nitta.
Isuzu has its headquarters in Tokyo, and initially its automotive plants were all in the Aichi
prefecture, Tsurimi and Tochigi produce automotive parts, the Kawasaki plant produces medium
and heavy trucks, and Fujisawa produces light trucks, buses, and cars. Tochigi is in the northern
part of the prefecture, and the other three plants are south of Tokyo, The new (1992) engine plant
was built in Hokkaido - very far from the traditional Aichi cluster - and currently has under 300
employees. The decision to build away from the Aichi cluster may have been based on the wage

and land costs in the Tokyo area as well as on the saturation of industrial plants and infrastructure
bottlenecks. Jus t-in- time (JIT) delivery of engines is a major characteristic of the To yo ta production
system; typically engines are delivered in small lots of six to twelve. The decision to produce
engines at Hokkaido, so far away from the production cluster may indicate two scenarios: (1)
Toyota is rethinking its implementation of the JIT production system or (2) the engines are being
produced for off-shore assembly.
Tokyo Headquarters and Cluster with Scattered Operations
Honda has its headquarters in Tokyo, and three of its seven other plants are located nearby
at the Saitama factory. The Sayama plant produces passenger cars, the Wako plant produces
engines, and the Mohka plant produces auto parts. The Hamamatsu and Kuamoto plants produce
motorcycles and are very distant from each other. The Suzuka factory, Honda's largest factory
(both in terms of floor space and capacity) is located in the KantoIChubu district of Japan.
Honda's other manufacturing clusters are far from their main manufacturing cluster and
headquarters in Tokyo; the distance is evidence that some assemblers do produce in more than one
central location.

Exhibit Autolnotive Plant Locations: Honda Motor and Mitsubisl~i Motors i
Honda Motor
Mitsu
&itam8 Factory:
Mohka Plant
Wako Plant
Sayam8 Plant
Head Officr (Tokyo)
w sutuka Facton/ ---A ~rmematsu Factory
bishi Motors
Okrzaki Phnt
Ship Plant
Kyoto Plant
Mizushima Motor Vehiclc Works -,
Source: Dodwell Kamesaki Plant
Maruko Plant
Head OHia (Tokyo)

Mitsubishi is another exception to the company-cluster plant arrangement. With
headquarters in Tokyo, the Mitsubishi operations also include plants in three other regions of the
country. Mitsubishi's subcontractor organization, the Kashiwa-Kai, comprises 340 companies.
The regional subgroups include (1) the Tokyo Motor Vehicle Works, which supply the Kawasaki
and Maruko plants, (2) the Nagoya Motor Vehicle Works, which supply the Oye and Okaszaki
plants, (3) the Kyoto Motor Vehicle Works, which supply the Kyoto and Shiga plants, and (4) the
Mizushima Motor Vehicle Works. Mitsubishi's example further demonstrates that, while it is
important for primary suppliers to be located near the assemblers, it is not essential for the
assemblers to be located near each other. Exhibit 5 on the previous page illustrates the dispersed
operations of Honda and Mits~bishi .~
Aichi Pr@ecturelNagoya Area
Nagoya is Japan's fourth largest city and third largest port, located in the middle of the
Tokyo-Hiroshima megalopolis. It is a prosperous commercial and industrial city with a population
of two million. The Aichi prefecture is the second most concentrated automotive area due to the
presence of Toyota (illustrated in exhibit 6).
See Appendix 2 for more maps of the location of Japanese domestic automotive facilities.
23

/'I Erllibit 6: Autollrotive Plallt Locations: Toyotu Motor
Motonuchi Plrnt
Source: Dodwell
Shlbetw Roving Ground
m%x*T%a Source: Toyota Motor Cornpan; S~te of popcted new plant
m m -- Tcch~g~ Houslng Works
mMm H ~ g a s h A u j ~ Technca k t w
Klnuura Plant
Kasuga~ Hounng Works
8;fmr~~ -- . Nagoya Offla

Toyota Motor Co., Ltd. (TMC) was established on August 28, 1937, with capital of 12
million yen. Toyota began in the Nagoya region as a spinoff of Toyoda Automatic Loom Works
(TALWs). Toyoda Automatic Loom Works entered the automotive industry with the launching of
the Model G1 truck in 1935. In 1936, they completed construction of their first complete
automobile assembly plant in Kariya - near the TALWs. With a vision for full-scale automobile
production, the company purchased a large plot of land in Koromo-cho - a municipal region 30
kilometers east of Nagoya. This undeveloped property covered with trees would emerge as the hub
of the Toyota Motor Group by the mid 1960s. In the late 1950s, the municipal government of
Koromo, encouraged by the progress of Toyota's development, drew up plans to be an automobile
industrial city with TMC at its center. Toyota recommended that its suppliers move to Koromo so
that they could reinforce production needs for JIT and jib& lo with the affiliated industries.'l In
1958, Koromo was renamed Toyota City.12
There are eleven Toyota plants in the prefecture, and nine of them are within the boundaries
of the Toyota City limits. Toyota's auto parts manufacturing group, the Kyoho Kai, consists of
224 parts makers, which are regionally organized into three subgroups. The Tokai Kyoho Kai is
the largest subgroup, consisting of 136 companies located in the Tokai district with Toyota's plants.
The Kanto Kyoho Kai consists of 63 companies, located in the central part of Japan near Tokyo.
The third subgroup, Kansai Kyoho Kai, consists of 25 companies clustered in the western part of
Japan. A number of Toyota's main subcontractors are located outside of the Aichi prefecture.
Daihatsu is in the Osaka prefecture, and Hino Motors is located near Tokyo. While Toyota's
example reinforces the importance for primary suppliers to be located near the assemblers in order to
utilize effectively the JIT production system, it also demonstrates that subcontractors do not have to
be located near the patron company in order to assemble the patron's vehicles.
lo The two main pillars of the Toyota production system are the just-in-time system (having suppliers supply parts on a timely, needs basis) and jikoda (self-regulation and building quality into the process).
l Toyota Motor Company, A History of the First 50 Years. Toyota City: Toyota Motor Corporation, 1988, p. 66.
l 2 Ibid. p. 146.

Osaka Prefecture (Kansai area)
Osaka is a huge industrial and commercial city responsible for a quarter of Japan's industrial
output. The airports handle 40 percent of total exports. It is home to the country's pharmaceutical
industry and also produces textiles, iron, and steel. The warlord Hideyoshi founded Osaka in the
sixteenth century as a city for merchants. The great business and banking dynasties (Sumitomo,
Itochu, Marubeni, Sanwa; and Daiwa) trace their roots to Osaka. Sanwa and Daiwa are two of
Daihatsu's five primary banks. Daihatsu was established in 1907, publicly listed in 1949, and
began producing cars in 1966. In 1968, it began to subcontract for Toyota.
All four of Daihatsu's automotive plants are located in the Osaka prefecture within an 80
kilometer radius of the headquarters and main plant in Ikeda. The Shiga and Tada plants produce
engines, auto parts, and machine tools for captive use. The Kyoto and Ikeda plants produce
assembled vehicles (including those subcontracted by Toyota). Nearly 80 percent of Daihatsu's
production is used domestically. Daihatsu's subsidiary, Daihatsu Shatai, has one outside assembly
facility in Maebashi City, Gunma prefecture, approximately 100 kilometers northwest of Tokyo.
The Osaka prefecture is next to Toyota's Aichi prefecture, so Daihatsu could supply Toyota with
parts, if necessary, to support Toyota's production system.
Hiroshima Prefecture
Mazda (Toyo Kogyo) is isolated in the lower central part of Japan. Three of Mazda's four
plants are located in the Hiroshima prefecture, and the Hofu plant is in nearby Yarnaguchi
prefecture. The myoshi plant produces diesel engines and is approximately 70 kilometers away
from Hiroshima on Highway 54. The Hofu plant produces compact cars and transmissions and is
approximately 130 kilometers away from the Hiroshima headquarters via Highway 3. Thus,
transportation from headquarters to the other plants takes approximately two hours via truck.

Tokai Region
Suzuki's three automobile manufacturing plants are located in the Tokai region. The Osuka
plant makes castings and die castings, and the other two plants each assemble 50 percent of the
Suzuki vehicle total. Kosai produces minicabs and commercial vehicles, and Iwata produces four-
wheel drive vehicles and engines. These three plants are located within 65 kilometers of each other.
The other facilities are dedicated to producing motorcycles and parts.
Merits and Implications of Clustering
Clearly, the industry map of Japan (shown in exhibit 7) indicates that the auto industry is
clustered in a few areas of the country. The map illustrates the size and concentration of the
clusters. The darker circles indicate a higher concentration. Assemblers of the same company or
group may tend to locate in the same cluster for the following reasons:
First, the origins of the auto maker, the historic roots of the cities, and the relationships of
the automaker with their primary banks, or kereitsu, can influence the geographical outcomes.
Often, the company's relationship with its primary bank largely determines the location of the head
office.
Second, coordination with headquarters and other plants is facilitated by geographical
proximity. Upstream, it enables primary suppliers to coordinate more efficiently. Downstream, the
manufacturer will be able to coordinate its delivery and transportation to gain from volume discounts
in shipping from the same dock.
Third, the concentration of the firms and the clustering effect of the suppliers with the
assemblers are logical, given the patron-supplier system and the use of .TIT production methods,
The proximity of primary suppliers to the patron assemblers is necessary due to the demands of the
JIT production system. Toyota's example demonstrates the strong influence that the assembler has
on the supplier's welfare and longevity. Locating in the vicinity demonstrates commitment to the

Exhibit 7: Plant Clusters of Japanese Vehicle Manufacturers
Note: The darker shaded areas indicate heavier concentration of plants.
long-term relationships and allows the groups to implement the demands of the JIT system
effectively. By positioning all of the assembly plants near a central location, the same supplier will
be able to supply the same parts to a number of assembly plants with JIT schedules and also realize
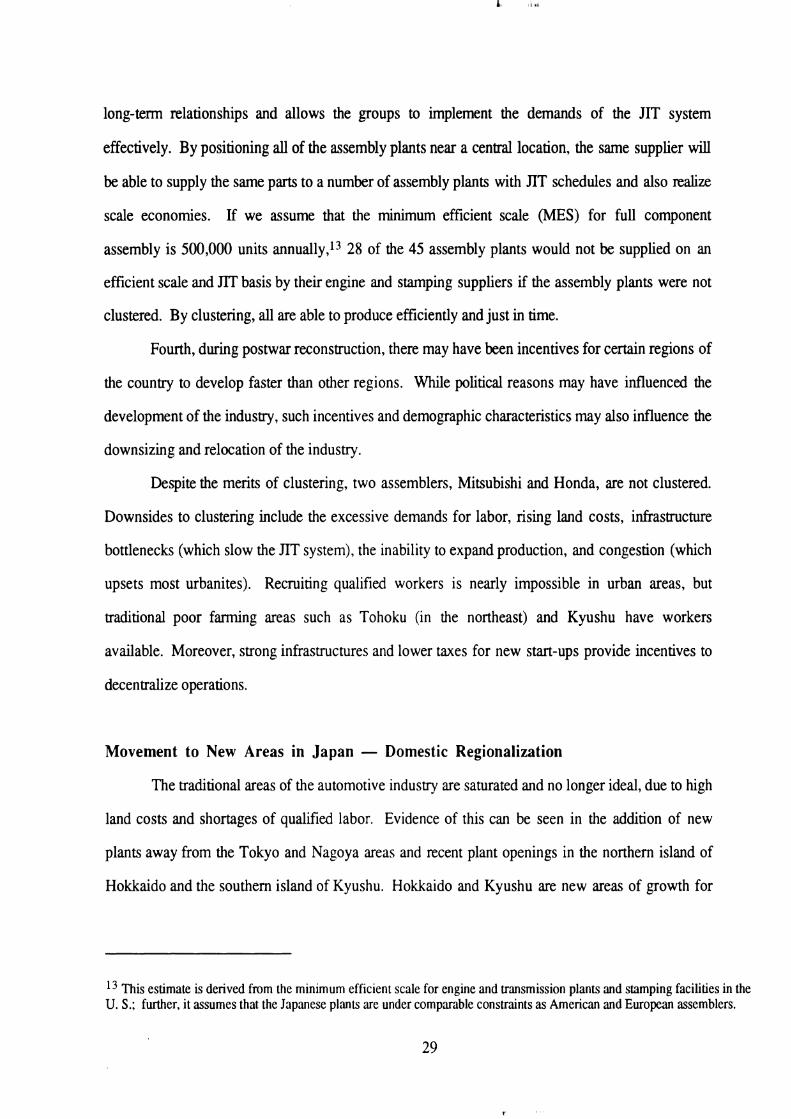
scale economies. If we assume that the minimum efficient scale (MES) for full component
assembly is 500,000 units annually,13 28 of the 45 assembly plants would not be supplied on an
efficient scale and JIT basis by their engine and stamping suppliers if the assembly plants were not
clustered. By clustering, all are able to produce efficiently and just in time.
Fourth, during postwar reconstruction, there may have been incentives for certain regions of
the country to develop faster than other regions. While political reasons may have influenced the
development of the industry, such incentives and demographic characteristics may also influence the
downsizing and relocation of the industry.
Despite the merits of clustering, two assemblers, Mitsubishi and Honda, are not clustered.
Downsides to clustering include the excessive demands for labor, rising land costs, infrastructure
bottlenecks (which slow the JIT system), the inability to expand production, and congestion (which
upsets most urbanites). Recruiting qualified workers is nearly impossible in urban areas, but
trdtional poor farming areas such as Tohoku (in the northeast) and Kyushu have workers
available. Moreover, strong infrastructures and lower taxes for new start-ups provide incentives to
decentralize operations.
Movement to New Areas in Japan - Domestic Regionalization
The traditional areas of the automotive industry are saturated and no longer ideal, due to high
land costs and shortages of qualified labor. Evidence of this can be seen in the addition of new
plants away from the Tokyo and Nagoya areas and recent plant openings in the northern island of
Hokkaido and the southern island of Kyushu. Hokkaido and Kyushu are new areas of growth for
l3 This estimate is derived from the minimum efficient scale for engine and transmission plants and stamping facilities in the U. S.; further, it assumes that the Japanese plants are under comparable constraints as American and European assemblers.
29

the automotive industry. Exhibit 8 illustrates how the industry is relocating from concentrated
central regions to the less-concentrated northern and southern areas.
Toyota started up a parts plant in autumn, 1992, to join the existing Isuzu plant on
Hokkaido. For the first time since the late 1980s, parts are transported via railway; truck transport,
the conventional method of parts delivery, was unable to meet excessive demands. Low land prices
and high quality of life have made this island an attractive place for a number of foreign f i to
establish their new start ups. With an area equivalent to that of Austria, a population equal to
Denmark's, and a GNP falling between that of those two nations, Hokkaido is comparable to a
single European nation, with plenty of room to grow. In the 1990s, Hokkaido is seeking to engage
in direct exchanges with other countries rather than routing exchanges through Tokyo, as has been
done in the past.14
Kyushu, the south western island of Japan, is emerging as the new subcenter of the
Japanese auto industry. Toyota's new vehicle production facility in Kyushu started up in spring,
1993, joining the operating Nissan vehicle production, and Honda motorcycle engine and
transmission facilities. Mazda and Daihatsu's planned plants on this southern island will bring the
total of firms with facilities on this southern island to five by 1996. Suppliers have followed the
assemblers as would be expected. In Kyushu alone, 128 f i s built new facilities between 1990
and 1992; previously only 107 plants were located there.
Toyota's decision to expand beyond its traditional clustering in the Mikawa district in the
Aichi prefecture is rather revolutionary. Although it allows the company to escape the land and
labor costs of operations in the Aichi area, i t adds significant costs to parts transport and signals
that the merits of concentration in Mikawa may be weaker than they once were. The labor shortage
is the primary driver of this change; the regionalization of production facilities seeks to ensure an
adequate workforce. In 1990, President of Toyota, Dr. Shoichiro Toyoda, stated "Plant
l 4 Yokomichi Takahiro. "Hokkaido, the New Frontier for Foreign Companies in Japan," Tokyo Business Today, 61 (March 1993) pp. 28.

Exhibit 8: Declustering of Japanese Vehicle Manufacturers
Note: The darker shaded areas indicate heavier concentration of plants.

decentralization has both advantages and disadvantages - the advantage of solving the labor
shortage problem was judged to be more important than the disadvantages."15 Plans to start up
another new electrical parts production facility in the Tohoku province (northeast Japan) in 1994
reinforce the pattern of regionalization, decentralization, and in-house production.
By 1995, Toyota's Hirose plant will be expanded, and the Tohoku plant will be built, thus
allowing Toyota to have 10 percent of its electronics production in-house. By initiating its own in-
house electronics development and utilizing suppliers other than Nippondenso or Aisin Seiki,
Toyota has (1) transformed its long-standing, two-supplier system for electronics, (2) introduced
more competition and spread out its investment, and (3) developed its own expertise in electronics.
Nippondenso's diversification of customers domestically and abroad combined with its use of
second-tier suppliers outside the traditional Toyota Group may signal further breakup of the kereitsu
supplier system.16 As competition increases, it may become imperative for assemblers to cross
kereitsu lines and align with the strongest suppliers possible-a strategy inconceivable in the past.
Also, suppliers may be forced to sell to nonpatron customers in order to further develop their
businesses.
While it appears that the development of these new regional areas has eased the problem of
land constraints, the challenge of labor shortages is met for only the short term, As the birth rate
slows, the population ages, and working hours decline, the labor shortage will continue to be a
serious obstacle for the Japanese companies.
It appears that the current phase of overseas expansion to North America and Europe is
over. The Japanese assemblers are planning to reconcentrate their efforts on domestic production
and expansion into other Pacific Rim countries. There were five new assembly plants built during
the 198 1- 1990 period analyzed earlier. Nine new facilities (scheduled for completion by 1995) will
l5 H. Niiyama, "Toyota's New Plant Construction Project and Future of the Group Production," Asian Motor Vehicle Business Review 1 (August 1990): p. 3.
l6 Tetsuo Kubo and Hiroshi Nakano, "Toyota Moving Electronics Production In-House," Asian Automotive Business Review 3 (April 1992.): p. 6.

add another 1.75 million vehicles to the current production capacity (see table 3). Nissan and
Toyota have already set up their new plants in Kyushu, and Mazda has expanded its Hofu
factory.'' However, a number of f m are reassessing their investment and expansion plans as
production capacity outstrips the market demand. Daihatsu, for example, has delayed construction
of the second stage of its Shiga factory until 1995 and has put on hold its construction of a Kyushu
facility. The large capital investments and increasing labor costs have raised break-even points and
the minimum efficient scale of plants. Managing plants to yield a high capacity utilization rate is
even more challenging in the current environment. Much of the capacity that produced vehicles for
export to North America and Europe in the 1980s has been replaced by transplant operations. Table
4 provides estimates of the Japanese production capacity in the three major regions.
Table 3: Japanese Automakers' New and Planning Domestic Facilities
Source: Asian Auto Business Review, November 1992, Volume 3, Number 3, p. 14.
Maker
Toyota
Nissan
h4zda
Mitsubishi Motors
Daihatsu
Honda
l7 Omichi Yasunori, "Adjustments in the Car Industry Required," Journal of Japanese Trade and Industry 4 (1993) p. 13.
3 3
Facility
Toyota Kyushu
Toyota Tahara
Kanto Auto Works Kanagasaki
Toyota Auto Body Mio
Kyushu
Hofu
Mizushima
Okazaki
Ryuoh the second facility
Ryuoh new facility
The third line of Suzuka facility
Annual Production Capacity
200 thousand vehicles
130 thousand vehicles
100 thousand vehicles
100 thousand vehicles
240 thousand vehicles
160 thousand vehicles
180 thousand vehicles
180 thousand vehicles
170 thousand vehicles
190 thousand vehicles
220 thousand vehicles
Start-up
1993
1991
1994
1995
1992
1992
By 1995
By 1995
1989
1992
1989
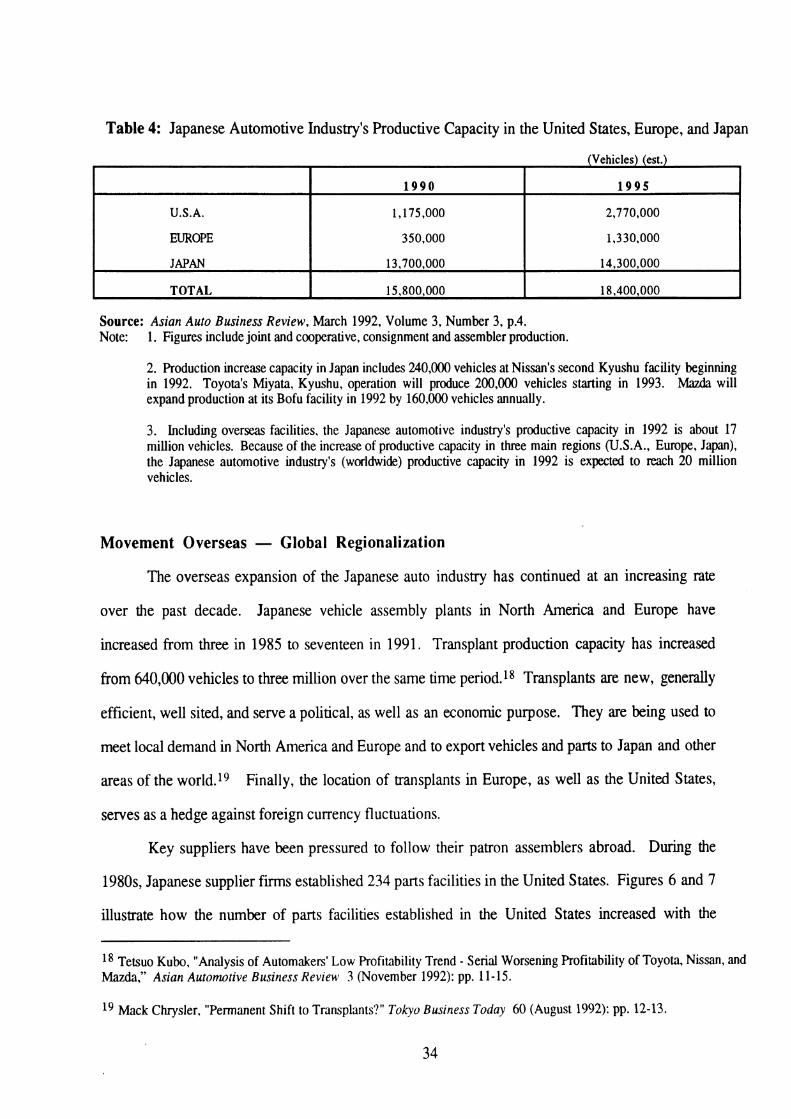
Table 4: Japanese Automotive Industry's Productive Capacity in the United States, Europe, and Japan
(Vehicles) (est.)
Source: Asian Auto Business Review, March 1992, Volume 3, Number 3, p.4. Note: 1. Figures include joint and cooperative, consignment and assembler production.
U.S.A.
EUROPE
JAPAN
TOTAL
2. Production increase capacity in Japan includes 240,000 vehicles at Nissan's second Kyushu facility beginning in 1992. Toyota's Miyata, Kyushu, operation will produce 200,000 vehicles starting in 1993. Mazda will expand production at its Bofu facility in 1992 by 160,000 vehicles annually.
3. Including overseas facilities, the Japanese automotive industry's productive capacity in 1992 is about 17 million vehicles. Because of the increase of productive capacity in three main regions (U.S.A., Europe, Japan), the Japanese automotive industry's (worldwide) productive capacity in 1992 is expected to reach 20 million vehicles.
1 9 9 0
1,175,000
350,000
13,700.000
15,800,000
Movement Overseas - Global Regionalization
The overseas expansion of the Japanese auto industry has continued at an increasing rate
over the past decade. Japanese vehicle assembly plants in North America and Europe have
increased from three in 1985 to seventeen in 1991. Transplant production capacity has increased
from 640,000 vehicles to three million over the same time period.18 Transplants are new, generally
efficient, well sited, and serve a political, as well as an economic purpose. They are being used to
meet local demand in North America and Europe and to export vehicles and parts to Japan and other
areas of the world.19 Finally, the location of transplants in Europe, as well as the United States,
serves as a hedge against foreign currency fluctuations.
Key suppliers have been pressured to follow their patron assemblers abroad. During the
1980s, Japanese supplier firms established 234 parts facilities in the United States. Figures 6 and 7
illustrate how the number of parts facilities established in the United States increased with the
1 9 9 5
2,770,000
1,330,000
14,300,000
18,400,000
l 8 Tetsuo Kubo, "Analysis of Automakersf Low Profitability Trend - Serial Worsening Profitability of Toyota, Nissan, and Mazda," Asian Automotive Business Review 3 (November 1992): pp. 11-15.
l9 Mack Chrysler, "Permanent Shift to Transplants'?" Tokyo Business Today 60 (August 1992): pp. 12-13.

development of transplant assembly operations. The overseas investment presented new
opportunities to the Japanese auto industry, but also presented new challenges and pressures.
Clearly, it is beneficial for the assembler to have the same supplier, providing the quality, delivery,
and service to which the assembler is accustomed. However, the supplier must bear a great burden
in investing abroad; it is not able to obtain the same scale economies that it could in Japan, due to the
smaller volumes produced in the United States. The decline in transplant establishments during the
early 1990s may signal the end of the first wave of expansion, or it may indicate a retreat by the
suppliers and assemblers that are finding profitability overseas difficult. In either case, further
penetration by Japanese suppliers in the United States is not likely in the near future. Those that
have set up shop in the States are now looking to diversify their customer base and product
portfolio.
Figure 6 : Japanese Invested, U.S. Located Part and Component Facilities Reported Startups 1982- 1992
Source: Japanese Automotive Supplier Investment Directory, Fifth Edition, Office for the Study of Automotive Transportation. The Universtity of Michigan, page VI

Figure 6: Japanese Invested, U.S. Located Part and Component Facilities Reported Startups 1982- 1992
Source: Japanese Automotive Supplier Investment Directory, Fifth Edition, Office for the Study of Automotive Transportation, The Universtity of Michigan, page VI
The competitive pressure of almost 300 new Japanese transplant parts facilities have
encouraged traditional, U.S. suppliers to build modern facilities in order to compete, and have
forced many other U.S. parts facilities to shut down completely. This intensified competition,
combined with the Big Three shift in purchasing strategies, 20 has forced traditional American
suppliers to adapt swiftly to the changing environment in order to survive.
In contrast to a "community" model of gradual expansion, exemplified by Ford and GM in
Europe over the past 50 years, the Japanese model of rapidly building new capacity has a number of
costs from a corporate and societal perspective. Financially, it was costlier to invest in new plants
and equipment and train new workers. Although the assemblers were able to develop lean
production systems, the large capital investment forced firms to spread their financial resources;
this further pressured profitability for assemblers and suppliers. Social and political costs resulted
Movement towards developing greater long-rem relationships where suppliers are involved in the development process of new vehicles and produce subassemblies instead of basic parts.
3 6

fiom the displacement of thousands of workers and the business failure of numerous suppliers.
Although transplants now employ over 100,000 in the United States, and it can be argued that the
American consumer has received higher value as a result of such expansion, the European
community is not likely to accept such social costs.21 Even though the Japanese assemblers were
successful at quickly establishing overseas capacity to avert trade friction and to hedge their foreign
currency risk, they incurred Miculties and social costs, which also must be considered in further
developing their global strategy.
Japanese automotive f m s have also been solidifying their presence in the Southeast Asian
automotive industry-the fasting growing market in the world. The Japanese suppliers located in
Southeast Asia are able to supply their patrons and also take advantage of the low-cost labor. A
number of plants make wire harnesses and other labor-intensive items exclusively for export to
Japan. The Japanese development and commitment to the Southeast Asian automotive industry
allows Japanese companies to find another source of low-cost labor. The Japanese investment
allows the Southeast Asian countries to develop their industrial infrastructure; in return, the
Japanese have a bargaining chip to open these growing auto markets to receive their exports. In
1990,2 million vehicles were sold in the largest ASEAN nations-Thailand, Malaysia, Indonesia,
and the Philippines; during the late 1980s and early 1990s, automotive sales experienced annual
growth rates of 30 percent, The Japanese assemblers dominate these markets with an estimated 90
percent market share.22 While these markets are in early stages of development, they can be
expected to play an important role in the future of Japan's global automotive strategy.
Much of the Japanese expansion overseas has been fueled by the success of automotive
manufacturers in recent years. However, much of their financial success has been amibuted to the
domestic bubble economy, which has since burst. Japanese firms have been forced to rethink their
21 Sean McAlinden, "Commentary: A U.S. Perspective on the Globalization of the Automotive Industry," International Automotive Industry Forum, Phoenix, Arizona, December 1990.
22 Tim Barrett, Steve Hartle, Chris Lin, and Don Mills, "American Strategic Entry into ASEAN Nations," corporate strategy paper for Professor Majumdar, University of Michigan School of Business Adminisb-ation, March 5, 1993.

strategic direction under adverse financial situations. The following section describes this economic
phenomenon, its effects on industry growth, and implications for the auto industry during the post-
bubble era.
IV. BURSTING OF THE JAPANESE BUBBLE ECONOMY
Description: Rise of the Bubble
The bubble era was a time of rapid and substantial rise in asset prices during the second half
of the 1980s in Japan.23 Three key developments prompted this growth:
(1) The sharp appreciation of the yen, prompted by the Plaza Accord of 1985, set Japanese
interest rates at historically low levels. In 1985, one U.S. dollar was valued at 250 yen; in April
1993, one dollar was valued at 113 yen. The yen continues to appreciate toward the Y 100/$1 mark.
The yen more than doubled in value during 1985-1993, so that Japanese consumer spending power
was greatly enhanced. In 1987, the official Japanese discount rate on bank borrowing was at 2.5
percent - half the rate in 1985. The low return in savings and the low cost of borrowing prompted
further consumption and investment.
(2) As the monetary policy shifted towards accommodation, and firms were more reluctant
to borrow from banks, there was a sharp increase in financial activity. As asset prices continued to
rise, their rise reinforced the value of hidden assets on corporate balance sheets, which elevated
stock prices beyond their real value. Corporations shifted their financing from debt to equity by
issuing convertible and warrant bonds. Banks shifted their focus from relationship lending to
speculating in real estate and the stock market.24
(3) Thirty years of sustained, domestic economic growth gave the Japanese assemblers a
significant advantage over their international competitors. Bullishness of the Japanese economy
2 3 See, for example, Ryuichiro Tate, "Special Report: The Bubble Economy," The Nikkei Weekly, April 12, 1993, pp. 11- 12.
24 Maryann N. Keller, "Crisis in Japan - Recessions, Secular Trends Force Industry Restructuring", Furman Selz, Inc., April 5, 1993.

was sustained by international expansion and the soaring yen; lenders and borrowers paid less
attention to risk and excessive investments were made in Japanese assets.
Amid some of the heaviest trading in market history, the Nikkei 225 Stock Average virtually
doubled in two years, from 13,113 yen in 1985 to 26,000 yen in 1987. Japan's stock market
became the largest in the world; in 1987, it accounted for 41.7 percent of the world's total market
capitalization. Property assets also soared 240 percent over this five year period, from 1,004 trillion
yen in 1985 to 2,389 trillion yen in 1990. By 1990, the value of Japanese land assets were
quadruple the value of land assets in the United States. As these asset prices skyrocketed and the
yen appreciated, consumer confidence and optimism peaked, with the excess spending of the late
1980s. Japan's per capita GNP had grown from $1 1,000 in 1985 to $24,000 in 1990, the highest
level of per capita GNP among major industrial nations.
Although this growth phenomenon was unprecedented, it did not correspond to the
conditions of the real economy; as the asset prices plummeted, the phenomenon was increasingly
described as a "bubble." A bubble is defined as the portion of a movement in asset prices that
cannot be explained by the basis of economic fundamentals.
The Bursting of the Bubble
In December 1989, Yashushi Mieno, the new head of the Bank of Japan, deflated the bubble
by raising the official discount rate several times. The collapse of the stock market in early 1990
and the plummeting of land prices were clear signs that the bubble had burst.25 By the spring of
1992, the Nikkei index had settled around 16,500 after a two-year descent from a high of 38,000.
The collapse has made raising fresh funds through equity financing more difficult, and borrowing
from banks more expensive. Even though the cost of capital has increased sharply, economists
assert that this is a return to normal levels. The bursting of the bubble is forcing f m s as well as
consumers to change their investment and purchasing behavior. "Until the bubble burst, many
25 Kermit Lanser, 'Things Japanese: A Shift of Focus," Financial World, (August 4, 1992): p. 92.
3 9

companies seemed to behave as though it were an implicit assumption that real estate values would
continue to rise or at least not fall." 26 The sharp decline in value has diminished the value of their
assets and weakened the purchasing power of their previously free-spending domestic consumers;
the downturn has adversely affected consumer confidence. Excessive capital investment during the
bubble era put even more downward pressure on profits and now threatens the Japanese
commitment to high rates of capital-investment and R&D spending.
Other unhealthy signs in the real economy include a rise in bankruptcies, a decline in
industrial productivity, and a fall of corporate profits. The sharp increase in the cost of capital, tight
labor supply, and the aging population present further challenges for Japan's economy to overcome.
Other challenges include the decrease in the number of new college graduates in Japan expected to
begin in 1995, dependence on exports, and growing political pressure abroad.
Implications and Recent Developments in the Auto Industry
The automobile industry was a major beneficiary of the bubble economy. Low rate loans
and equity financing available encouraged a wave of investments by the auto makers. Higher
consumer wealth led to a boom in automotive sales. New car registrations from 1980 to 1985
increased by a solid eleven percent, then sales more than tripled during the next five years. The
excess consumer spending of the bubble era spurred automotive sales beyond expectations and
Japanese auto companies reaped huge gains.2' These profits were reinvested in new facilities,
capital improvements, and overseas expansion.
The industry now suffers from the bursting of the bubble, with declining sales, historically
low profits, and a weakened presence overseas. The industry declined in 1991 for the first time in
eleven years; sales were down 3.3 percent. Vehicle sales volumes declined again in 1992, the first
time in history that Japanese automotive sales have declined significantly for two consecutive years.
26 Tate Ryuichiro, et al., "Special Report: the Bubble Economy." Nikkei Weekly (April 12,1993): p. 11.
27 Appendix 3 summarizes the sharp gains in profitability for the automakers and suppliers.

Sales declined again in 1993 to make it a record third consecutive annual decline.28 Declining
vehicle sales are not the industry's only major difficulty. The Japanese auto industry now finds
itself saddled with inappropriate product development and marketing strategies. The end of rapid
growth in disposable incomes with the bursting of the the bubble economy also signaled the end of
growth in markets for high-end and niche vehicles. In recent years, models were frequently
upgraded to provide fresh styling, and record product proliferation took place to capture and retain
sales. A new "value" emphasis has appeared in Japanese auto markets. The industry must
restructure to adjust to new, modest expectations of Japanese car buyers.
The decline in profitability was traumatic. Combined annual profits in 1992 for Japanese
automakers dropped more than 50 percent to Y500 billion from around Y 1.1 trillion in peak years.
Three of Japan's automakers reported losses.29 Toyota's 1992 fiscal settlement announced that
profits were down 63 percent from the previous year. In 1993, Nissan announced its first ordinary
loss since public offering. Honda and Mazda expected poor profits for their 1993 settlements.
The increased number of facilities has lead to lower capacity utility rates, and therefore,
lower profits. Decreased profits have also resulted from higher production costs - mainly the cost
of materials and parts. This trend has continued since the mid 1980s, but now sales are not
increasing to keep up with the increased costs. Moreover, a declining capital-turnover ratio delays
the investment recovery period, while depreciation costs are at record levels. Toyota's profit-to-
sales ratio dropped to 3.96 percent in 1992, the first time in over a decade that the ratio has dipped
below the 4 percent level (the ratio necessary for paying out expected dividend and wage hikes).
Even though Toyota is the most efficient Japanese producer in terms of unit cost, it still suffers from
severely high futed costs traced to recent, massive investments in plant, equipment and product
development. The cost of capital investment and R&D outlays, carried out with the bubble
economy to forge a "strong company," have rapidly swelled as interest rates have risenS3O During
28 Tokyo Business Today, February 3 , 1993.
29 Dr. Shimokawa Koichi, "The Auto Industry Enters an Era of Restructuring and Globalization," Journal of Japanese Trade and Industry; 4 (1993): pp. 8-1 1.

the bubble period, many of the firms invested in long-term projects, such as new factories, that only
made sense at very low interest rates. These investments are not generating much cash flow to
cover the borrowings that were used to finance them. Even though the capital was cheap up front,
the average borrowing is proving to be quite costly.3
Between 1984 and 1991, Japanese automakers shifted their financing from debt to equity by
issuing $25 billion in convertible and warrant bonds. In the bullish economy, it was expected that
the stock prices would continue to rise, and obligations would be converted. After stock prices
declined to reflect their real value, lenders asked to be paid back; companies were faced with the
prospect of refinancing with straight debt and higher interest rates, or liquidating assets to pay their
obligation^.^^ This increased cost of capital is causing financial distress for operations abroad as
well.
Japanese investment overseas fell by 28.3 percent in fiscal 1992, the third consecutive
annual drop. Annual investment outlays now total about one-third of the $49.1 billion for the peak
year of 1989.33 Moreover, about 20 Japanese parts manufacturers have withdrawn from the
European market due to the collapse of Japan's bubble economy and the economic recession in
Europe. The Japan External Trade Organization said its survey of new Japanese f m s moving into
the European market also hit a low of 27, compared with 1 12 in 1990 and 56 in 1991.34
The bursting of the bubble has slowed the momentum of American exports to Japan. Total
imported (into Japan) car sales for 1991 were 197,184 units, down 12.1 percent from the previous
30 Ryoichi Higurashi and Momoko Ito, "Japanese Aulomnkers Rethink Efficiency vs. Profit," Tokyo Business Today 60 (March 1992): p. 39.
Michael Smitka, The Decline of the Japanese Auto I n d u s r n - Domestic and International Implications, Working paper from the Washington and Lee University, July 1992. p. 32.
32 Keller, Crisis in Japan, page number unavailable.
33 Agence France Presse, May 9,1993.
3 4 ~ a p a n Economic Newswire, March 27. 1993.

year. Most of the loss was incurred by the German luxury car makers (GM sales grew at a slower
rate (5.3 percent) and Ford sales declined slightly).
To summarize the effects on the Japanese automotive industry, the bubble economy
enhanced domestic sales, product proliferation, profitability, equity financing, capital investment,
and overseas expansion. As the assets grew larger than their real value in the bubble economy, the
effects on the automotive industry were severe. The rise of the bubble enhanced the resources of
the Japanese automotive industry. But since the economy is indeed a bubble that has burst, it leaves
behind a number of real, short-term dilemmas, which the auto companies must solve in order to
prosper again.
In his book-Rejuvenation of t h Japanese Economy: Beyond t h Bubble Economy-
Yoshio Suzuki, chairman of the Nomura Research Institute and one of Japan's leading economists,
proposes three major directions for Japan to take: (1) benefitting consumers through economic
policies; (2) reforming the financial system; and (3) maintaining the free trade system and making
other meaningful contributions to the global order.35 Applications of these reforms for the
automotive industry would take out the inefficiencies of the distribution systems, thereby making
automobiles more affordable, and motivating the industry to promote free trade. Tactically, this
would mean opening the Japanese market to foreign competition and developing a more balanced
trade account with key trading partners, through local procurement strategies and local assembly.
V. NEW PARADIGM FOR THE JAPANESE AUTOMOTIVE INDUSTRY
Analysis of the changes in the Japanese automotive industry over the past decade indicate
that the kereitsu relationships, once heralded as Japan's secret for competitiveness during its
emergence as a world-class competitor in the automotive industry, will be loosening due to the
pressures of the domestic economy and the globally competitive environment.
35 Michio Uchida, "Now Even the Public Wonders: Is Japan at a Crossroads?" Tokyo Business Today 60 (September 1992) pp. 14-16.

Key findings from the geographical analysis indicate that the traditional clusters of firm
operations are beginning to decentralize in order to escape the labor shortages and infrastructure
constraints. The regionalization strategies will evolve in the form of declustering of operations
within Japan and diffusion of the value chain internationally, Globally, the Japanese are adjusting
to the shift in comparative labor advantage by moving labor-intensive production of components to
Southeast Asia (and to China in the future) for export to Japan. The Japanese f m s are continuing
to adapt to the political pressures from North American and European industries and governments
with increased transplant production in the local markets. While this strategic shift temporarily
diminished volume efficiency in Japan, such a move was inevitable due to the shortages of land and
labor and the rising yen. Finally, the redistribution of operations worldwide allows the Japanese
f m s to be closer to the markets that they sell in, offers a number of cost advantages, and allows
them to hedge currency risks over the long term.
The postregionalization phase of the Japanese auto industry signals a diminishing role of
Japan's export of fully assembled vehicles to the traditional markets of North America and Europe.
No longer will these full-assembly, fm clusters, responsible for such a large portion of Japan's
exports, be concentrated in one firm's specific area. Rather, the f m s will decentralize into newly
developing industrial areas (i.e., the islands of Kyushu and Hokkaido) in order to escape the labor
shortages of the trdtional clusters. It appears that overcapacity will still exist in Japan in the
middle of the 1990s, but traditional areas will gradually ramp down as the working hours and the
number of qualified workers diminish. This decline should offset the increased production capacity
created by the new emerging areas. Nissan's closing of its Zarna assembly plant and relocation of
workers into Kyushu is an example of the shift and dilution of focus. The closing of plants in
traditional clusters wdl continue to alleviate the issue of overcapacity. Most likely, the older plants
and the facilities too small to accommodate automation will be the first to shut down. Not only will
the clusters gradually dilute, but the export share of total vehicles will decline as transplant
production ramps up to meet overseas demand. Extra capacity will force Japanese assemblers to

seek out new export opportunities in other nontraditional areas. Southeast Asia, China, Latin
America, and Eastern Europe are among the top contenders for new growth opportunities.
Even though exports of fully assembled vehicles to traditional markets have begun to
decline, trade continues to be active. The content of exports will change because assembly facilities
have been constructed in the major markets of North America and Europe, and labor-intensive parts
manufacturers have been positioned in Southeast Asia. Labor-intensive parts (e.g., wire harnesses)
will be produced in Southeast Asia for export to Japan. High value-added parts and critical
components will be assembled in Japan for export to the large market economies. Japan will shift
its export content from fully assembled vehicles to engines and transmissions - the high value-
added parts and critical technologies that require the largest economies of scale. In effect, Japan will
be able to globally source this technology for final assembly in its assembly plants located world-
wide. Local content regulations, pressure from domestic parts makers, and market fundamentals
will encourage local sourcing of other parts as the kereitsu relationships dissolve.
This gradual, yet fundamental, shift from export strategy to transnational regional strategy
has a number of important implications. As capacity and production shift overseas, and the
domestic market matures, the production of Japanese vehicles in Japan will decline unless it is offset
with new export opportunities elsewhere. The loss of scale economies will force the industry to
restructure in order to remain competitive. In order to offset inefficiencies created from this
regionalization, automakers will have to lengthen their product cycles and reduce the variety of
different components so that parts makers can regain economies of scale with longer production
runs, Although local content requirements will make opportunities for local parts makers more
accessible, global sourcing of critical components will replace the exporting of fully assembled
vehicles.

VI. SUMMARY AND DISCUSSION
This paper discusses the evolution of the Japanese automotive industry structure, and
suggests areas for restructuring. Improving relations between the assemblers and their suppliers is
not the sole solution to the complex situation; suppliers have been faced with a number of obstacles
and continue to receive intensified pressure from their patrons. The following conditions pressure
the system to change: the productivity plateau, labor shortages, infrastructure bottlenecks, slowed
growth in domestic demand, trade hctions, continued appreciation of the yen, and rapid
technolo~cal changes. Moreover, the bursting of the bubble economy has exacerbated the severity
of the situation.
In response to these changing conditions, the parts makers are undertaking a number of
initiatives including (1) the rationalization of production: extending runs to achieve economies of
scale; (2) customer diversification: extending relationships beyond the patron to customers outside
the conventional group; (3) product diversification: conducting their own R&D and producing
more of their own products; and (4) overseas investments: supplier transplants to follow the patron
business overseas, and sourcing from operations in low-wage Southeast Asian countries and
Chi11a.3~
The loosening of kereitsu relationships and the trend towards the initiatives discussed may
result in mergers among parts makers and moves toward relationships with leading suppliers
outside the kereitsu group.37 AS this trend unfolds globally, American suppliers attempting to
obtain orders from Japanese transplants will no longer face the same burden of overcoming the
kereitsu lines, but will have to be world-class suppliers in order to survive the rationalization of the
parts industry. Survivors will be able to develop high value-added products and maintain high
levels of productivity. Large production capacity and superior management capability are also
critical success factors.
36 Fourin Inc., The Japan Auto Purls Industries, (Nagoya City, Japan: Fourin Inc.,1989-90).
37 Further upsueam, vehicle makers will strive to use common parts with other manufactures; for instance, Mazda and Nissan have jointly developed automatic uansmissions through JATCO.

As Japanese assemblers face the new realities of the postbubble, postcontinuous-growth era,
they must further differentiate their competitive strategies and focus on their core strengths. In the
continuous-growth era, all Japanese auto companies would attempt to compete head-to-head in most
segments and in most areas of the value chain. This style of competition was effective in the past
decades due to (1) the growing and protected domestic market, (2) the opportunities for entry and
growth in large international markets, (3) the comparative advantages of low labor costs and a
weak yen, (4) the gains in productivity from technical and process innovation, (5) the lean
production system, which emphasized JIT delivery and jikoda, and (6) commitment of the supplier
base, which further enhanced potential gains. With these advantages, the newly challenged
Japanese automotive companies must now adapt to a new economic environment, restructuring, and
developing a new source of competitive advantage.
In order to confront the domestic land and labor shortages, the auto manufacturers are
declustering their operations by moving to Hokkaido and Kyushu islands. Production and
employment have been gradually dissipating from the concentrated clusters out to these newly
industrialized regions; this movement alleviates the infrastructure constraints on congested clusters.
The Japanese also escaped their labor shortage by establishing operations overseas. Transplant
operations in North America and Europe circumvent trade pressures, and new facilities in Southeast
Asia provide the Japanese f m s with a low-cost source of skilled labor. China, another source of
low-cost labor, may play a larger role in the near future. Both areas also represent large potential
export markets.
Producing in the three main continental regions of North America, Europe, and Asia allows
the Japanese automotive companies to hedge against foreign currency fluctuation - in particular,
the further appreciation of the yen. However, spreading out production capacity among various
markets creates disadvantages in terms of diluting the concentrated high volume necessary for
achieving economies of scale. The challenge is to balance the currency hedge and the capacity
hedge so that the system is insulated from foreign currency fluctuation, and yet able to reach
efficient production levels. The balance is easier to attain if the vehicles and operational income are

able to move freely from country to country, and if localization rates can be varied. High-volume
production is also important, but may be difficult for the smaller companies to achieve in a l l three
regions. Creating a portfolio of production sites and markets also provides companies with
exposure to technical and market developments worldwide.38
With resources spread globally, it becomes important for the Japanese vehicle producers to
effectively use their domestic workforce and maintain profitability. Firms must concentrate on
expanding revenues and profitability, now that the continuous growth era is over. Even though
Figures 1 and 3 above illustrate how production in Japan has declined in the past two years, and
export's share of production has declined for the past seven years, further analysis should be
conducted to show if the same trend holds true for growth measured in revenues. By producing
critical technology and high value-added components (e.g., transmissions) in Japan, the highly
skilled workforce is better utilized, and domestic revenues are maximized. Thus, even though
assembly takes place overseas, much of the profit and control is maintained in Japan. This pattern
parallels the regionalization of the automotive industry in the United States years ago when engines
produced in the Detroit area were transported to assembly plants located in various regions of the
country. Such a global sourcing strategy can also utilize the comparative low-cost labor advantage
of the companies' operations in Southeast Asia. Assessment of each company's strengths in the
value chain39 in various markets provides f i s with a concept of which areas to strengthen and
which areas to exit.
While global procurement strategies and hedging overseas may enhance profitability,
standard economic theory asserts that the key to enhancing profitability is to spread the fixed costs
over a greater number of units. To the Japanese assemblers, this means extending product-
development cycles, reducing product variety, standardizing parts, and maintaining high capacity-
utilization rates.
38 McAlinden, Commentary: A U . S. . Persl~ective on the Globalization of the Automotive Industry, International Automotive Industry Forum, Phoenix AZ, Det,ernber 1990.
39 Automotive design, procurement, manufacturing. and marketing.
48

In order to implement some of the initiatives described above, f m s must have broad
geographical scope and high volumes of production in each area. Since most companies do not
have such large operational scopes, arrangements with other companies become increasingly
important. Developing cooperative arrangements with other major assemblers and parts makers
(Japanese, American, and European) will be critical to developing the necessary capability for
competing in the 2 1 st century.

Appendix 1
Key Characteristics of Japanese Automobile Manufacturers


L ( o w d m m ! u n )
~I!A!ID~POM
001'9PI
LSL'CZ (4qmSsv) saadoldmx
LP6'8Z
OOP'E
066
000'02
OOS'P I
000'0 1
OOO'SE
00O'ZZ
l n d ~ n 0
%PZ'Z6
006'EEE
PS9' 18
9PZ'ZSZ
z - 9 ( o w d ~ ~ m ! u n . )
L i ! ~ ! ~ n p o ~ d
O00'PS I
-
s ~ o ) ~ s ~ ~ u o ~ q n g -d.roa Ou!~n~nxqnue&q JOJOM e j o 6 0 ~ -
( ' I l u o ~ / sl!un)
* a $ ! ~ e d e 3
000LZ9E
000'68
000'ELZ
ooo'zz (LlqmSsv) s a a L o ~ d m ~
L8P'LZ
OOP'E
L9Z' I
8LS'E
OSZ'Z
PL9'1
ZL6'P
E8L'I
saaAoldmg
uo!lez!l!in Kj!3ede3
P10.L sasnq p w s~3n-11
sms laguassed
l m o ~ ' p o ~ d ~ ~ I ? J I U O ~ ~ ~ S
s m d ~o!laiu~
sap!yah Li!l!ln ~ M P
sa3ue~nqure 'slm sue^
0 6 6 7
sEIEl.10.L
e q s u o ~ omv
e q s u o ~
Z86E
000'0 I 000'0 1
000'0 1
000'OE
000'02
( ' IJuOhl/ s ~ I ~ ! ' I ~ A )
UO!#3npOJd
OOP'E 008' I
OOP' I
OOS'P
OOP' I
saaAoldmg
m3 such pa~uap-n?3 'sm3
sue^
sue^ p a ~ u a p m ~ 'sm3
sdn y s!d sue^
s l JnpoJd
SlOlOpJ O U I f l
eynsoyo~
!hd !rlsc%!ll s y . 1 0 ~ olnv o~ui?g
e d ~ n q nqem!Cng
A P 0 8 OlnV ~ l ~ ~ 0 . L esnycger
s y ~ o ~ u ~ o g 3!iemolnv epoAoL
sa!l!l!3ed SJO)3r?JJUO3qng R ~ O L O L


Nissan Motor Company, Ltd. Subcontractors
O u t p u t 4,544
28,597 1 1,448
500
Nissan Subcontractor Fac i l i t i e s
Nissan Diesel
Nissan Shatai
Aichi Machine Ind.
Takada (Press) Kogyo
Products Pickups (as subcontractor) Compact cars (as subcontractor)
Vans, trucks (as subcontractor)
Compact cars (as subcontractor)
Subcontract total 20,000 58,850 NA 53,200 45.089
1982 1990
Employees
7,100 6,900 4,700 1,300
Productivity (Unit/Emp./Mo)
NA
Employees NA
NA
NA
NA
Produc t ion (Vehcles / M o n t h )
5,600 40,000 1 3,000
250
ul P
C
Capaci tv* Un i t s IMth
3,700 37,000 12,000
500
Productivity (Unit/Ernp./Mo)
5.1
CU
Employees (Assembly)
N A
Employees (Assembly) 20,000

96P'O I I
a n d ~ n o
* p l ~ 'duedm03 - l o ) o ~ ~ p u o ~
962'001 (4q"assv) saarCo[dmx
L9b'SZ
L9P'SZ (iol3e~luo3qns
a)
OOE'Z 28 L'6
b b Z S b b L 8 L 10 '2 OSZ'9
s a a d o ~ d r n x
9 (owdurrn!un)
rC11~!13npo~d
0 0 1 ' 6 0 1
I 0 0 0 ' 6 0 1
m a WN
OSI ' S S
9 P l ' S b q ~ w / s a ! ~ n .a)!aede3
0661
(owdwm!un) rO!~p3npou 000'£8
OOO'9P
0 0 0 ' L € ( W U O M / S a I a q a ~ )
UO!)3npOJd
2861
ZC0'9 1 (k~qmassv) saarColdw3
OOI'OZ
-
009' I Oob'8
OOS'E Oob OOL' I
OOS'b saadoldurx
(omnw!un) d1!~!13npoq
POI-qns uo!nnpoid asnoq-UI
n3 s n ? ~ iaguassed
slaru\om UME[ 6 ~ a 1 3 r C 3 ~ ~ l ~ ~ sialoox 'spadom 'sm3 ia%uassed
suo!ss!msue~~ ~pemolne 's~ole~aua3 'sia~~!l ' s a p K 3 ~ o l o ~
slu!or ' smd au!%ug sa[3rC3~01om pue sm3 JOJ sautgug
sm3 laguassed SJ3npOJd
(MSSV)SH
WOl
b s n p u ~ o K q 3 e ~ o l o u r e u ~ n ~
EYmnS
n s l e m H
e WOW OYeM
e w k s sa!)!l!3~~ ~ P U O H

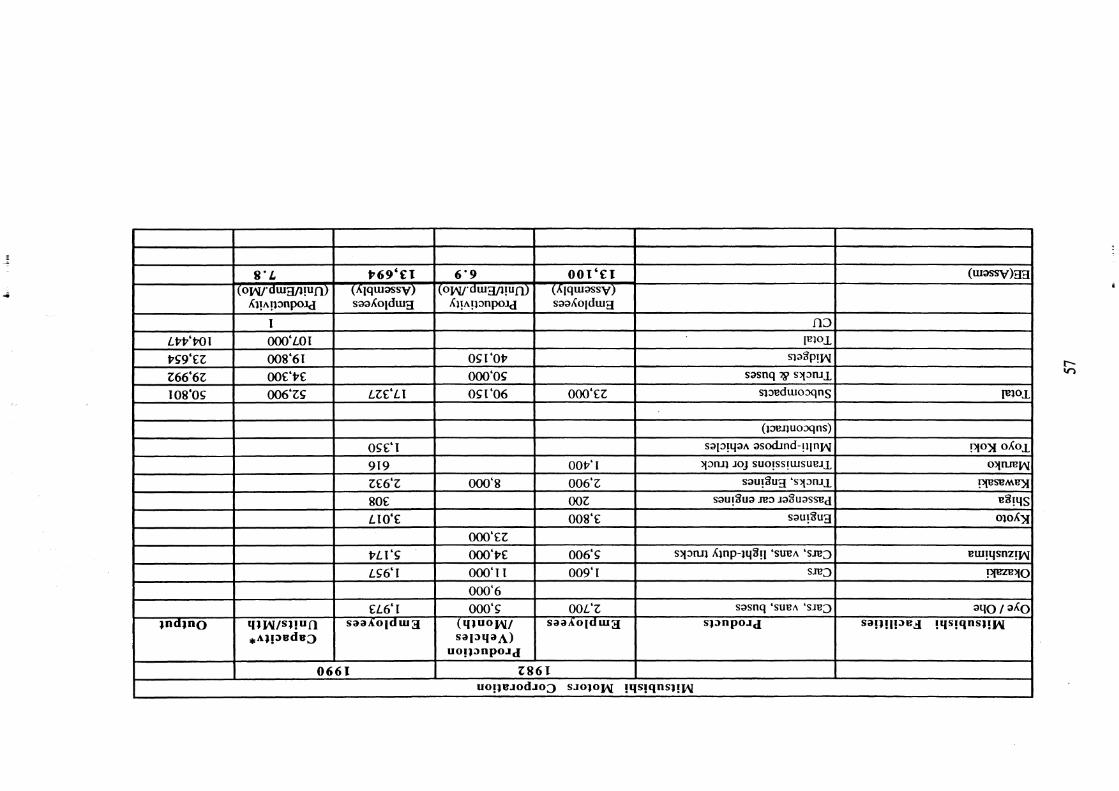
IndInO
u o ! ) s ~ o d ~ o 3 s ~ o ~ o m !qs!qns)!m
YIMI/SI!un .a1!asde3
EL.6'1 ~ a a L o i d m 3
0661 Z 8 6 T
000'6 000'5
('IIuoMIl saI3'laA)
uo!J3npold
OOL'Z s a a k o ~ d m a
sasnq 'sum 'sres s ~ 3 n p o ~ d
a q o I aL0 ~ a ! ~ ! l ! ~ e a ! q ~ ! q n ~ ~ ! m

( o ~ n m ! u n > A I I A ~ ~ P O U
8
( o w n m r u n ) Ai!~g2npord
(w=sv)33
*
3nd3n0
-pa? 'JO)ON nznsI
q ~ ~ / s ~ ! u f l . a l ! s ~ d a 3
OES 8EL 001'1
002' I
692'9 saaA01d~'g
0661 2861
(WUOM/ SaIaUa A)
UO!)3npOJd
saaboldw3
IVl0.L
(pal3eauoqns) s u v ~ ' s y 3 m ~
sa!poa s n ~ sau!8u3 o inv
s a u ! g u ~ o l n v 'uo!ss!ursue~~ suo!suadsn~ 'salxv
SUVA ' sn3 sdnyxd 'SUVA 'sre3
s33npo~d
. p u ~ nhrx
V a s I vYsIPI
!urnzrqo VX-QqO
e l u ~ l e ~
oloy-UOH sa!1!1!3e~ n z n s ~

Appendix 2
Maps of Japanese Domestic Automotive Facilities' Locations .
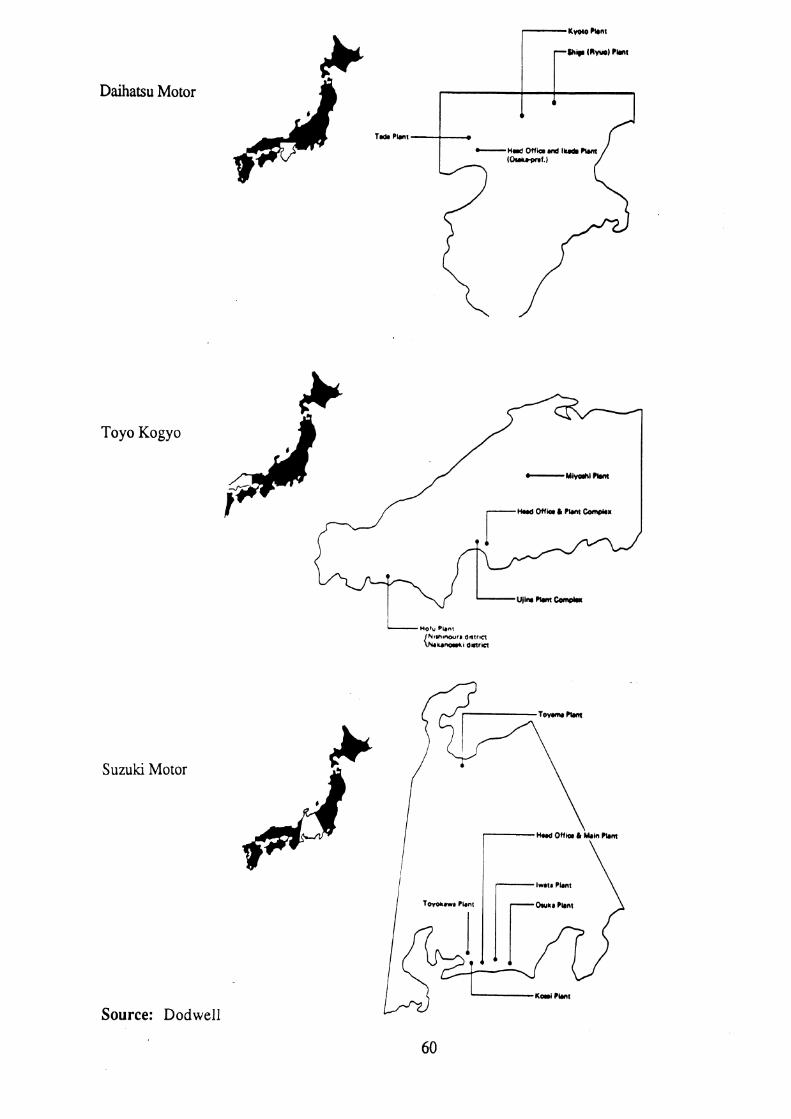
Daihatsu Motor
Toyo Kogyo
Suzuki Motor
Source: Dodwell
I T o v m ?Ian~ 0
I ,-,I"" P " ' \

Nissan Motor
Fuji Heavy Industries
Nissan Diesel
Source: Dodwell

Hino Motors
Isuzu Motors
r- Nina Works
Head Office & Hino Works (Hino-city, Tokyo)
9 Tochigi Works
Kawasak~ Plant Head Off ice (Tokyo)
Tsururn~ Works & Tsurumi Parts Center
F u j i w a Plant

Appendix 3
Profitability for Japanese Automakers and Suppliers in Overseas Expansion

Outline of Japan Autolnakers' Nortli American and European Facilities Establistled in tile 1980s
I 200 thousand $800 m l l l l o n \e\r i n ~ t c d \ ' r 10' \ l a n ~ i a c [ u r ~ n g Inc D ~ c ,1981 1 vth ,Cles i I
A n n u a l lnves tmrnt .I
I T o y o l a Y o t o r U a n u f a c t u r i n g U.S.A, lnc. / Yay.1988 1 2 0 0 < ~ ~ : ; ~ d 1 $NO mil l ion 1 A m e r i c a
'' ~ $ , 1 0 0 Toyotir \101iir \ l u n u i i ~ c ~ u r i n ~ : C n n a d n Inc. Sov..l98R , l ;chiclcs I
Production Local P l a n t
200 t h o u s a n d f 7 0 0 m i l l i o n Europe To)o tn \Intor i l a n u i a c t u r ~ n g { L ' K ) I.td i Dec..1992 1 vehiclas 1
i I
, C s p e c l t y . B r e a k d o w n I
S t a r t - u p
44 t h o u s a n d s745 mil , ion ( L:ika I X i s s a n M o t o r J l a n u i a c t u r i n g Corp. .U.S.A.
200 thousand 1 S i s s a n \4ol(ir \ l o n u i a r t u n n p (1 .K) l.rd ( J u l . . l 9 K / Y e h i c l c s 1 c ~ W mil l ion I Lurope 1
1980 100 thousbnd 1 S.A, / S i s s a n \ lo tor ioer ica . S A . i Vehicles 1
1.:,751 ! I50 t h o u s a n d 1 5380 m i l l i o n I Dcc..1989 , I . I D C ~ I \ i
Marysvil le
1 t l o n d a of t\rncrica hlig Inc
Nov.,1982
Mitsubishi i 240 thousand $600 m i l l i o n D i a m o n d - S t a r h lo tors Corpora t ron I M e t o r s 1 A m e r ~ c * 1 Sep"19BB Vehicies
C$280 m i l l i o n
S.A,
1 h o r t h I 1 240 thousand
360 thousand Vehicles
100 t h o u s a n d Vehicles
100 t h o u s a n d
jjO
- - 6 0 t o 7 0
lsuzu 1 Europe j 1BC Vehicles i , \d I S ~ P ,1989 / t h o u s a n d I f 34 m ~ l l i o n
sw m i l l i o n
Sov.,1986
Oct..1992
H o n d a 1
H o n d a C a n a d a lnc
\ l a Z d a I i r n a r ~ r a 1 \ l a / d a \ 'o!nr \ I A - , ' J . : , ~ I - ~ L 5 \ , LL:? Sep ,1987 1 l ' eh ic les
I I
Fu j i t l e a r y S o r t h 1 160 thousand Industrres & I ; S u b a r u . 1 ~ ~ ~ ~ . \ ~ t n r n n ~ l \ c In: I Sep.19KJ \ .ehit lEs
, Europe
% 500 mi l l ion
H o n d a o f t h e C K hlfg. . L t d .
I S U Z U
: \ m e r ~ c a
19M 35 thousand I *(C,P.) YehlcIes 1
A ~ r . . 1 9 8 9 CAM1 Autornotlve inc
Source: Asian Automotive Business Review, November, 1992, Vol. 3, Number 11, p. 13.
200 t h o u s a n d Vehicles C s 6 1 5 million

Five Japanese Automakers' Trend of Worsening Profitability
( m i l l i o n Y e n . M
P r o d u c t ~ o n Cost C a p ~ t a l Fiscal Sales O p e r e t ~ n g I Turnover Tor m P r o f ~ t / ~ a t s r ~ e l c o s t / D e p r e c ~ a t ~ o n 1 R a t l o
Mazda
S i s s a n
Honda
I
25.?:2 S . A
31,956 S . A . I
40.635 1 1,382,953 41,072 1.474.876 48.771 ! 1.590.446 65.822 / 1.850.613 55 186 ' 2.096.630
S . A .
S . A . 1,069,126 1,164,523 1.281.443 3,487,950 1.686.080
1986. 3 1987. 3 1988, 3 1989. 3 1990. 3 1991 3
(Data ; Security Reports)
Source: Asian Automotive Business Review. November. 1992, Vol. 3. Number 11, p. 12.
3.75~1.172 3,l129.317 3.418.671
58.999 (8.449)
47.610
1992, 3 1 4,270,523 I ! ' 33,775 1 3,719,689
3.580.1 lo I 92,010 4.005 ,550 ' 138 661
3,148,478 1,023,885 1,232,811 I,%lO,7&?
781.662 722.775
1,459,475 1,518,689 1,670,531 1,703,532
1 1.008.223
2,936,814 2,766,753 2,641.198
1,342,483 1.629.537 1.743.067 1.028.407
3985. 2 1986. 2 I9R7. 2
2.730.389 3,290,774
120.110 50.292 55,111 58.534 38.379 31.633 61.707 74,095 74.548 70.766
1 51,981
I 4,175.S\:1 3,559.834
2,508,169 2,371,537 2.212.724
1 I5 2.00
' 2.02 2.03 I . 1 8 1.01 2.03 2.01 1.91 1.97
I 1.99
1987, 9 1,no0,310 . ta , , l i9
1,929,519 2.215.733 2,331,597
1988. 3 1,219 737 2 l . l ~ l j 1 939,763
2,363,581 2,ffl2,03R
70.702 71,513 R2.7RO
1989. 3 1990. 3 1991. 3 1992. 3
3,063.234
114.310 96.837 82,232
2,636,765 i l l j l i : ,918,105 2,718.R63 100.40: 2,08j,370
2,800,199 65,464 1 2,194,741 2,911 .O'l4 3 , 1 0 6 2,231,041
I .5l 1 .28 l .10
72,960 77.175
/ 1 9 6 . 1 0 / 1,569,553 I 69,129 1.311.8RFI
] , I 5 1.20
93.175 1.20


I d
n - m d c l n n n n n n n n n n n n n n n n n f i n n n n n m n - r n .- v L ~ ~ : ~ ? ~ ! o , : , : l n - ~ . . : j w q q : ~ ! q y d q q y d d ~ y ~ ~ ! ~ ' - l m - i - z - ,,an - a a 3 a _ T ,, , - e s ; s ~ Z O C L N W C I J w C I I
w V aw kc - u Q Q w w e w c 5 ;
a w w w . . . . . . . . . . . . . . . . . . . . . . . . . . . . . . . . . . . . . . . . . . . . . . . . . . . -
c s 5 d - 5 2 2 -c . - * - C = 5
Y 2 p . - C , - 2 :< e e u Y Y Y

9 w
n y n n n n n n n n n n n n h n n n n n n n m n n h n n n n
, : q q N ~ N C 3 m r - r - b X S ) N C V ' = x = m = = ' " - L n C S - C C : ? ? = hl w -1
< - - w e V r V V W W V
" \ - < c - = 3 - w - - - CO I

Appendix 4
United States and Japan Industry Ratios

Table 1: Breakdown of facilities by plant type and company
Table 2: Ratioss (Plant typelAssembly) by Company in 1990
Toyota
Daihatsu
Hino
Nissan
Fuji Heavy
Nissan Diesel
Honda
Mazda
Mitsubishi
Suzuki
Isuzu
1990 Total
1990 ralio F
Toyo ta
Daihatsu
Hino
Nissan
Fuji Hcavy
Nissan Diesel
Honda
Mazda
Mitsubishi
Suzuki
Isuzu
*other
0
0
0
0
1
0
1
0
0
1
0
3
9.09%
Total
12
5
3
9
7
3
6
4
7
4
5
6 5
1.97
Assembly
5
2
2
5
3
2
3
3
4
2
2
3 3
Assembly
1 .OO
1.00
1 .OO
1 .OO
1 .OO
1 .OO
1 .OO
1 .OO
1 .OO
1 .OO
1 .OO
Parts
4
2
0
2
0
0
0
0
0
0
2
10
30.30%
MT&D
0.20
0.50
0.50
0.60
0.00
0.00
0.00
0.33
0.00
0.50
0.00
1990 industry ratios * EE = ElcctricaVElectronic
MT&D
1
1
1
3
0
0
0
1
0
1
0
8
24.24%
Powertrain
2
2
0
5
3
1
2
3
4
1
1
24
72.73%
24.24%
Powertrain
0.40
1 .OO
0.00
1 .OO
1 .OO
0.50
0.67
1 .OO
1 .00
0.50
0.50
EE*
1
0
0
0
0
0
0
0
0
0
0
1
3.03%
9.09%
*other
0.00
0.00
0.00
0.00
0.33
0.00
0.33
0.00
0.00
0.50
0.00
72.73%
Total
2.40
2.50
1.50
1.80
2.33
1.50
2.00
1.33
1.75
2.00
2.50
EE*
0.20
0.00
0.00
0.00
0.00
0.00
0.00
0.00
0.00
0.00
0.00
Parts
0.80
1 .OO
0.00
0.40
0.00
0.00
0.00
0.00
0.00
0.00
1 .OO
3.03% 30.30%

US Industry Ratios Over Time (1979 & 1991)
Table 3: Japanese Industry Ratios Over Time (1981 & 1990)
198 1 Total
198 1 ratio
1990 Total
1990 ratio
Net Change:
US-Japanese Comparison During 1990s
I I I I I I 1 I
Assembly
3 3
3 3
0
Net Change: -17 2 I
1991 Totals
Powertrain
2 2
0.67
24
0.73
2
Engine
18
Engine
0
EE*
0
0.00
1
0.03
1
4
Assembly
2 1
Powertrain
3
0
Total
150
EE*
- 1
Parts
10
0.30
10
0.30
0
*other
3
0.09
3
0.09
0
MT&D
8
0.24
8
0.24
0
-12
Parts
100
Total
60
1.818
65
1.97
5
0 1 -42
MT&D *other
- 3

Other References
Cole, Robert E., and Taizo Yakushiji. "The American and Japanese Auto Industries in Transition."
Working paper, Center for Japanese Studies, University of Michigan, Ann Arbor, Michigan, 1984.
Economist Guide of Japan. Great Britain: Hutchinson Business Books Ltd., 1990.
Flynn, Michael S., Sean P. McAlinden, Godfrey Cadogan, Brett Smith, and David J. Andrea, The
1996 U .S. - Japan Bilateral Automotive Trade Deficit. (report no. UMTRI-93-30) Office for the
Study of Automotive Transportation, University of Michigan Transportation Research Institute,
Ann Arbor, Michigan, July 1993.
Fujimoto, Hiroshi, "Japan's Automobile Keiretsu Changing for the Better", Tokyo Business Today
60 (February 1992): pp. 50-51.
Hamilton, David P. "Japanese Recession Prompts Corporations To Take Radical Steps." The Wall
Street Journal (February 24, 1993).
Holyoke, Larry. "Japan's Slump May be Settling in for a Long Stay." Businessweek (November
9, 1992): p. 62.
McAlinden, Sean P., and Brett C. Smith. The Changing Structure of the U.S. Automotive Parts Industr),. (report no. UMTRI-93-6) Office for the Study of Automotive Transportation, University
of Michigan Transportation Research Institute, Ann Arbor, Michigan, June 1993.
Otaki, Shunichi. "Is Japan's Overseas Corporrlte Expansion Winding Down?" Tokyo Business
Today 60 (July 1992): pp. 30-35.
Smitka, Michael, "The Decline of the Japanese Auto Industry - Domestic and International
Implications." Working paper, Washington and Lee University, City, State, July 1992.