
Cohort effect in survival analysis: a change-point perspective

THE JANUARY EFFECT: A GLOBAL PERSPECTIVE
Tyler Folliott
BBA, Thompson Rivers University, 2006 Dipl.T., British Columbia Institute of Technology, 2002
PROJECT SUBMITTED IN PARTIAL FULFILLMENT OF THE REQUIREMENTS FOR THE DEGREE OF
MASTER OF BUSINESS ADMINISTRATION
In the Faculty of Business Administration
Global Asset and Wealth Management Program
O Tyler Folliott, 2007
SIMON FRASER UNIVERSITY
Fall 2007
All rights resewed. This work may not be reproduced in whole or in part, by photocopy
or other means, without permission of the author.

APPROVAL
Name: Tyler Folliott
Degree: Master of Business Administration
Title of Project: The January Effect: A Global Perspective
Supervisory Committee:
Dr. Robert Grauer Senior Supervisor Endowed University Professor
Date Approved:
Dr. George Blazen ko Second Reader Associate Professor

S I M O N F R A S E R U N I V E R S I T Y L I B R A R Y
Declaration of Partial Copyright Licence The author, whose copyright is declared on the title page of this work, has granted to Simon Fraser University the right to lend this thesis, project or extended essay to users of the Simon Fraser University Library, and to make partial or single copies only for such users or in response to a request from the library of any other university, or other educational institution, on its own behalf or for one of its users.
The author has further granted permission to Simon Fraser University to keep or make a digital copy for use in its circulating collection (currently available to the public at the 'Institutional Repository" link of the SFU Library website <www.lib.sfu.ca> at: <http://ir.lib.sfu.ca/handle/l892/112>) and, without changing the content, to translate the thesidproject or extended essays, if technically possible, to any medium or format for the purpose of preservation of the digital work.
The author has further agreed that permission for multiple copying of this work for scholarly purposes may be granted by either the author or the Dean of Graduate Studies.
It is understood that copying or publication of this work for financial gain shall not be allowed without the author's written permission.
Permission for public performance, or limited permission for private scholarly use, of any multimedia materials forming part of this work, may have been granted by the author. This information may be found on the separately catalogued multimedia material and in the signed Partial Copyright Licence.
While licensing SFU to permit the above uses, the author retains copyright in the thesis, project or extended essays, including the right to change the work for subsequent purposes, including editing and publishing the work in whole or in part, and licensing other parties, as the author may desire.
The original Partial Copyright Licence attesting to these terms, and signed by this author, may be found in the original bound copy of this work, retained in the Simon Fraser University Archive.
Simon Fraser University Library Burnaby, BC, Canada
Revised: Fall 2007

ABSTRACT
The January Effect is one of the most commonly studied anomalies in finance.
While largely still considered a mystery, the January effect explanation that has garnered
the most attention and validity is the tax-loss selling hypothesis. This paper begins with a
review of the immense body of literature surrounding the January effect. Then I test,
across 16 countries, whether or not there is a significant positive difference in the January
returns (or whichever month is the beginning of the tax-year) from the remaining eleven
months of the year. The January seasonal is found to be significant in seven of the 16
countries, while a surprising September seasonal, inadvertently discovered and tested, is
significant in 13 of 16 countries. As is commonly the result when studying this anomaly,
further study is warranted to discover a powerful explanation for the January effect.
Keywords: January effect; tax-loss; anomalies; calendar anomalies; small-firm
Subject Terms: Stocks-Prices; stock exchanges
iii

ACKNOWLEDGEMENTS
Without the guidance and support of Dr. Robert Grauer, the process of preparing
this project would have been much different; for all of his time, from the inception of my
idea to the final adjustments, I owe him a heartfelt thank you.
Also, I would like to thank the world-class faculty I have had the pleasure of
learning from, as their insight and experience has been highly influential. Finally, I must
thank my classmates who have made the experience over the last year and a half
something I will certainly remember for my lifetime.

TABLE OF CONTENTS ..
Approval ............................................................................................................................ 11 ...
Abstract ............................................................................................................................. 111
Acknowledgements .......................................................................................................... iv
Table of Contents .............................................................................................................. v
List of Tables and Figures ............................................................................................... vi
1 INTRODUCTION ......................................................................................................... 1
............................................................................................. 2 LITERATURE SURVEY 3 ....................................... 2.1 Articles in Favour of the Tax-Loss Selling Hypothesis 3
2.2 Articles Against the Tax-Loss Selling Hypothesis ........................................ 6 2.3 Explanations Other than the Tax-Loss Selling Hypothesis .................................. 8 2.4 Data Mining ........................................................................................................ 10 2.5 Conclusions from Literature Survey .................................................................. 11
3 DATA ............................................................................................................................ 12
4 RESULTS ..................................................................................................................... 13
5 CONCLUSION .......................................................................................................... 16
REFERENCE LIST ........................................................................................................ 22

LIST OF TABLES AND FIGURES
................................................................................... Table 1 : Monthly Mean Returns 17
........................................................... Table 2: Test Statistics for January Seasonality 19
....................... Table 3: Test Statistics for Non-December Tax Year-End Seasonality 20
....................................................... Table 4: Test Statistics for September Seasonality 21
....................................................... Figure 1 : Monthly Mean Returns for All Countries 18

1 INTRODUCTION
The January effect, also known as the turn-of-the-year effect, is a calendar effect
wherein securities increase in value more rapidly than in other months. Many papers cite
Rozeff and Kinney (1976) as introducing the January effect to the world of finance.
However, looking further back, Wachtel (1942) was actually the first researcher to
discover the anomaly. There have been many studies that find statistical evidence
supporting a January effect in stocks, most focused on US markets, but some
international (Gultekin and Gultekin, 1983). Research has attempted to explain the effect
with many explanations and combinations thereof. Researchers have successfully argued
that the January effect is primarily a small-capitalization phenomenon; a significant
example is Keim (1983). In additional to the small-firm effect, the explanation that has
garnered the most attention and credibility has been the tax-loss selling hypothesis. For
the purpose of narrowing scope and remaining focused on the most revealing findings, I
will focus my literature survey on the tax-loss selling hypothesis; however, other
explanations are discussed. While findings have sparked great excitement over the years,
as they offer hope for explanation of the January effect, the phenomenon remains largely
a mystery. Haug and Hirschey (2006) conducted studies similar to some of the original
work and, even with the accumulated knowledge of 30 years of research, conclude that
nothing can convincingly explain the January effect.
The paper proceeds as follows. Section 1 discusses findings from the literature,
again with a focus on whether or not the tax-loss selling hypothesis can explain the
January effect. Additionally, considering the amount of attention the January effect
1

receives from both academic researchers and practitioners, a brief look into research
focused on data mining with respect to the January effect is essential. Section 2
introduces the data, while Section 3 provides detailed explanation and results of empirical
tests for return seasonality with the purpose of validating the tax-loss selling hypothesis
not just in the US, as most research has historically focused, but internationally. Section 4
provides a brief conclusion to the paper.

LITERATURE SURVEY
Seasonal anomalies, in particular the January effect, are likely one of the most
highly studied areas of finance. The body of literature is immense, so, as the focus of this
paper is the tax-loss selling hypothesis as it relates to the January effect, I have decided to
make the primary focus of my literature survey papers concerning this hypothesis. The
first researcher to discover the January effect was Wachtel(1942) and, surprisingly, is not
highly referenced in the vast majority of the relevant literature. Wachtel opened his paper
with reference to a previous study:
In 191 9 the Harvard Committee on Economic Research reported that a comprehensive study of stock prices from January, 1897, to January, 19 14, revealed absolutely no evidence of seasonal tendencies (Wachtel, 1942, pp. 184).
Therefore, Wachtel's findings were clearly groundbreaking. He finds a significant
seasonal effect in Dow Jones Industrial Average data from 1927 to 1942. This paper
marked the beginning of what would become over a half century of research surrounding
the highly intriguing January effect.
2.1 Articles in Favour of the Tax-Loss Selling Hypothesis
The research is divided on whether or not tax-loss selling can significantly explain
the January effect. Many argue that individual investors are driving the January effect by
selling their losing stocks in December, in order to realize capital losses for tax purposes,
and then using the funds from these sales to reestablish their positions in small-
capitalization stocks in January, thus driving up prices. Many who argue against tax-loss

selling as the solution, particularly Jones, Pearce, and Wilson (1987), Pettengill (1986),
and Berges, McConnell, and Schlarbaum (1984), find that the phenomenon existed prior
to Federal income taxes, therefore making the hypothesis void. To preface the discussion
of evidence of tax-loss selling driving the January effect, it is necessary to qualify it with
an explanation of why the focus tends to be on individual investors. As most agree that
the January effect is driven by small stocks, the focus automatically shifts to individual
investors as institutional money managers are generally focused on large-capitalization
equities. If individuals have equity positions that have accrued losses, many wish to sell
them before the end of the year in order to realize these losses for tax purposes; also,
institutional investors are not usually concerned with tax issues (Eakins and Sewell,
1993).
In Wachtel (1942), the top possible explanatory factor for the seasonal effect was
tax-loss selling. He argues that investors sell in mid-December and the following rally in
stock prices in both late December and January is purely a reaction from the low stock
market levels earlier in the month. In a seminal article by Reinganum (1983), it is found
that small firms unequivocally exhibit higher returns in January. However, while he finds
that tax-loss selling explains most of the phenomenon, a portion of the effect remains
unexplained. As discussed in another highly significant article by Ritter (1988), the
January effect comes into play when investors generally wait until January to reestablish
investment in small stocks; this demand drives up prices of small stocks in January. Ritter
finds that the January seasonal is explained by predictable portfolio rebalancing by
individual investors, who are driven by taxes. These findings are supported by Johnston
and Cox (1996), who find that there is a strong positive relationship between the January

effect and the level of individual ownership of a stock. They confirm that small firms
have a significant rebound in January and that these small firms have a larger proportion
of individual investors in comparison to firms that do not rebound in January. Also, in a
highly cited article, Roll (1983) argues that since small-capitalization stocks are more
volatile, they are better candidates for tax-loss selling. Interestingly, he also finds that
tax-loss selling is present in large firms as well; however, as large firms are generally
highly liquid, the effect is arbitraged away. Roll's findings support the idea of individual
ownership, as he argues that small firms are driving the tax-loss selling explanation.
Eakins and Sewell (1993) further confirm the relationship between firm size and
individual ownership. While somewhat contradictory to the evidence supporting the
small-firm effect, they find that the January effect remains even in large firms that have a
high proportional individual ownership; this finding is similar to Roll (1983). This
finding supports the tax-loss selling theory which is heavily founded on high levels of
individual ownership of companies.
When considering the tax-loss selling hypothesis as an explanation for the
January effect, numerous researchers conducted tests to see if the effect existed before tax
laws were in place in the United States. Pettengill (1986), using 1913 as the first taxable
year, finds no evidence of a post-tax January effect. However, four other studies, all using
the War Revenue Act of 1917 as the start of the post-tax era, do find a significant
seasonal effect once tax laws are in place. Shultz (1985) finds that a January effect did
not exist in the United States prior to taxes for small firms. However, the period from
1918 to 1929 did exhibit a significant January effect, confirming the tax-loss selling
hypothesis. Jones, Pearce, and Wilson (1987), using an equal-weighted index, find that

while the January effect is numerically larger during the post-tax period, cannot prove it
with statistical significance. Jones, Lee, and Apenbrink (1991) find evidence that the
January effect did not exist in any significance before the introduction of personal income
taxes with the War Revenue Act of 19 17. They find that the January effect in small firms
was initiated by this tax introduction. Their evidence indicates a dramatic change in
return behaviour starting in 1917, which also strongly supports the tax-loss selling
hypothesis. Brailsford and Easton (1993) specifically test larger firms to attempt to
eliminate the small-firm effect from the equation. They find a much more significant
January effect over the post-tax period, however conclude that the tax-loss selling
hypothesis cannot fully explain the seasonal anomaly.
From an international perspective, of which this paper is primarily focused,
Gultekin and Gultekin (1983) find that in most major industrial countries, return
seasonality is most significant at the turn-of-the-tax-year; for most industrial countries,
this occurs in January. Contrary to the vast majority of findings, particularly in the U.S.,
Guletkin and Gultekin find that for most countries in their study, the January seasonal is
not related to size, therefore discounting the small-firm effect from an international
viewpoint.
2.2 Articles Against the Tax-Loss Selling Hypothesis
There is a strong body of research that discounts the tax-loss selling hypothesis.
Chan (1986) addresses the issue by looking at the nature of the loss: short-term or long-
term. Rational tax-loss selling is generally considered a short-term phenomenon; one sells
the losing position to realize the tax loss and then repurchases to reestablish a similar
position. His evidence shows that if tax-loss selling is the driving force behind the

January effect, then there is no distinction between short and long-term holding periods;
this finding contradicts the general agreement that tax-loss selling is a rational behaviour.
Chan concludes that the January effect is not a result of tax-loss selling. Also, Fountas
and Segredakis (2002), in a study on emerging markets, find that while seasonality in
stock returns exists in many countries, there is little evidence to prove that the tax-loss
selling hypothesis explains the January effect.
Jones, Pearce, and Wilson (1987) study the January effect over fifty years
preceding personal income taxes. They find evidence, contradicting Jones, Lee, and
Apenbrink (1991), that the January effect did indeed exist prior to income taxes and that
there was not a statistically significant change after the imposition of taxes. Similarly,
Pettengill (1986) finds that the January effect existed before taxes, and also that the
small-firm effect in relation to the January effect is more significant in the pre-tax period
than in the post-tax period. A Canadian study by Berges, McConnell, and Schlarbaum
(1 984) documents a January effect from 195 1 - 1980. These findings discount the tax-loss
selling hypothesis, as Canada did not have a capital gains tax until 1973; the paper clearly
finds that the January effect existed prior to this date. This Canadian study, like many
others, also finds that the January effect is much more significant for firms with smaller
market capitalizations. Not surprisingly, Berges, McConnell, and Schlarbaum feel that
there is still a mysterious, fundamental economic factor that is at play in January.
In summary, the tax-loss selling hypothesis to explain the January effect is highly
debated among academic researchers. There are many arguments both for and against this
hypothesis and, as is no surprise with any topic regarding the January effect, I cannot find
a strong conclusion emerging from the literature.

2.3 Explanations Other than the Tax-Loss Selling Hypothesis
While the tax-loss selling hypothesis is by far the most generally supported
explanation of the January effect, other potential explanations do exist. This section will
briefly discuss a number of these explanations; the detail in which they are covered
generally corresponds with the attention the explanation has garnered.
One explanation that has garnered significant attention is window dressing.
Window dressing refers to the action of institutional portfolio managers rebalancing their
portfolios directly prior to the end of a reporting period. This rebalancing is generally
focused on removing undesirable securities (generally poor performers or speculative
holdings) and replacing them with more desirable holdings. The motivation behind this is
to impress investors in the reports, and ultimately to secure one's job. While the window
dressing hypothesis makes logical sense, it has garnered mixed results. Ritter and Chopra
(1989) find that the stocks of small firms increase in value in January due to tax-loss
selling and institutional portfolio rebalancing (window dressing). Lakonishok, Shleifer,
Thaler, and Vishny (1991) find that some window dressing does exist in their study;
however, this behaviour is not unique to the fourth quarter. In a following study,
Lakonishok, Shleifer, and Vishny (1992) find that window dressing does not have an
effect on prices. They find that while institutional investors follow many different
investing styles, the diversified nature of these styles act as a stabilizing mechanism,
therefore not impacting prices of individual stocks. Further, Eakins and Sewell (1994)
find no indication of window dressing by institutional portfolio rebalancing and Ligon
(1997) finds that window dressing does not significantly contribute to the January effect.
In fact, he finds that institutional management may even reduce the effect. In summary,

most research concludes that window dressing is not a reasonable explanation for the
January effect.
The Capital Asset Pricing Model (CAPM) attempts to have all risk variables
represented by beta. Banz (1981) and Reinganum (1981) argue that beta does not
represent all risk variables, particularly for small stocks. They argue that the simple, one
period CAPM is misspecified. While this work was not directly focused on abnormal
returns in January, it is important to recognize these findings as the January effect in the
United States is unquestionably linked to the small-firm effect. In somewhat of a
response to Banz and Reinganum, Stoll and Whaley (1983) introduce the idea that
transaction costs were not considered by Banz and Reinganum, as they were looking at
gross returns (before transaction costs). Stoll and Whaley find that transaction costs, for
some time periods, can explain the small-firm effect.
Another interesting possible explanation for the January effect is the
Intergenerational Transfers Hypothesis. This hypothesis argues that the wealth transfer
from one generation to the next, around the holiday season, explains the January effect.
Gamble (1993) asserts that while much evidence supports the tax-loss selling hypothesis,
part of the January effect largely remains unexplained. He finds that the Intergenerational
Transfers Hypothesis, working together with the tax-loss selling hypothesis, helps to
more fully explain the abnormal returns in January. Gamble does not empirically test his
hypothesis, stating that data was not available; however, his non-empirical tests support
the hypothesis.
Some research was conducted surrounding the January effect and the business
cycle. Kohers and Kohli (1982) find that the January effect was present during the entire

period and the expansionary phases, while not present during periods of contraction.
Kramer (1994) builds a multi-factor model, with seasonal risk and risk premia, to study
whether or not macroeconomic uncertainty can help explain the January effect. He
concludes that the January effect can be explained by expected return shifts. A similar
approach was taken by Priestley (1997) looking at United Kingdom stock returns. He also
finds that stock return seasonality is driven by expected return seasonality. The primary
driver of the expected returns was the high level of risk involved with holding stocks in
January and December due to the importance these months hold in the business cycle.
Finally, Ogden (1990) argues that the January effect can be explained by an
increase in investors' liquidity at the turn-of-the-year; with more cash at the end of the
year, investors buy stocks. He also finds that monetary policy, particularly the expected
liquid profits that come with loose monetary policy, help to explain abnormal returns in
January.
There are numerous explanations for the January effect other than the tax-loss
selling hypothesis; however, none have managed to generate the same level of confidence
and support in the academic community.
2.4 Data Mining
As economic studies are generally tested on the very data that exposed the
anomaly, data mining can be a serious problem, particularly when a topic is heavily
researched. As the January effect fits this description, it is essential that I discuss data
mining with respect to seasonal returns. Sullivan, Timmermann, and White (2001)
conduct a detailed study specifically on the topic. They mention that stock market data is
particularly vulnerable, as the data contains important outliers. The study concludes that:
10

... when assessed in the context of either a large universe or a restricted universe of calendar rules that could plausibly have been considered by investors and academics with access to our data set, the strength of evidence on calendar anomalies looks much weaker (Sullivan, Timmermann, and White (200 l), pp. 282).
When adjusted for the effects of data mining, the study finds that no significant calendar
effect exists. So, while this paper has reviewed many articles showing statistically
significant results, the evidence surrounding data mining potentially undermines the
entire body of literature.
2.5 Conclusions from Literature Survey
The body of literature evaluating and trying to explain the January effect is
substantial and the proposed explanations of the January effect have been long debated
and, based on the literature surveyed, it is clear that a definitive explanation has not been
found. The literature is, however, in relative agreement that tax-loss selling is at least
partially responsible for the January effect. Other explanations, such as window dressing,
CAPM misspecification, transaction costs, intergenerational transfers, the business cycle,
and seasonal liquidity have garnered some support, and may indeed help to explain some
of the effect; however, the tax-loss selling hypothesis is simply the most broadly
supported. The issue of data mining cannot be ruled out and must be carefully considered
when studying seasonal anomalies. Continued research on the data mining problem and
the January effect, using the most recent data, will be useful for confirming whether or
not the January effect is dwindling. Such research will be useful in a practical setting for
industry participants who transact based on seasonal movements in securities.

3 DATA
Stock market returns used in this study are monthly returns from the market-
capitalization (value) weighted MSCI Standard Index Series for 16 countries and,
additionally, the CRSP equal-weighted index for US stocks, for the period January 1970 -
December 2006. The CRSP index has been included for the US as previous research on
the January effect for US stock markets has shown that the anomaly is primarily found
for small stocks. As the international data is value-weighted, I will not be testing a small-
firm January effect; however, I will compare value-weighted and equal-weighted results
specifically for the US stock markets.

RESULTS
The primary goal of this paper is to test whether or not the tax-loss selling
hypothesis, as an explanation for the January effect, holds from a global perspective.
First, I analyze the MSCI return data for all countries independently, calculating the
monthly mean returns, as displayed in Table 1. Further, I calculate the monthly mean
returns for all countries in aggregate for an international picture of monthly returns. From
Figure 1 , it is clear that the highest returns are earned in January, while the only month
exhibiting negative returns is September. To test for a seasonal effect in January, I need
to test for a significant positive difference between the January mean return and the mean
returns for the remaining eleven months of the year. To do this, I use the following
parametric test:
where, rit is the monthly return of the stock market index i at time t, dit is a dummy
variable where i = 1 for January and i = 0 for all other months, at time t. ai is the mean
return of all months other than January and Pi is the difference between the January
return and the mean of all remaining months. By definition, therefore, the sum of the
intercept and slope is equal to the January mean return. This test is conducted for each
country. If there is a significant positive difference between the January return and the
mean of the remaining eleven months, at the 0.05 probability level, I have confirmed that
a January seasonal anomaly exists.

The results of the test are displayed in Table 2. Seven of 16 tested countries
exhibit the January effect, one of which, the United Kingdom, doesn't even have a
December tax year-end. While the methodology of the test is slightly different, and I test
more countries, Gultekin and Gultekin (1983) found a January effect for all countries
except one. As expected, the MSCI data for the US doesn't generate a January effect,
while the CRSP data does. This is clearly due to the small-firm effect in the US, as the
MSCI data is heavily biased towards the largest-capitalization companies, while the
CRSP data is equally weighted. The January effect was discovered in the US and was
primarily found to exist for small stocks. Therefore, these results confirm the existence of
the small-firm effect in the US. Gultekin and Gultekin (1983) came to the same
conclusion regarding the US findings in their study. However, there is certainly no small-
firm effect driving the anomaly for the seven countries found to display seasonality in the
MSCI data; this is quite fascinating. So, from a global perspective, it appears that the
January effect is not as powedul an anomaly as in the heavily tested United States and it
certainly is not a global small-firm phenomenon.
I have already alluded to the fact that not all countries in this study have a
December tax year-end. Therefore, if I am really trying to confirm the tax-loss selling
hypothesis, I must not test for a January effect for these countries, but for a monthly
seasonal for the first month of the tax year. I conduct the same test as for the January
effect, but instead of testing for different returns in January, I test for different returns in
the first month of the tax year. As is displayed in Table 3, the United Kingdom is the only
nation that exhibited the seasonal anomaly.

As mentioned earlier, it is clear from Figure 1 that the mean return for September,
across all 16 considered countries, is negative. I find this particularly interesting
considering there is no economic rationale for such a finding. I consulted the literature
and, while some papers mentioned negative returns in September, I found no discussion
of a September anomaly or potential explanation for the result. In order to see if the
September returns are significantly different from the other months, potentially the
September Eflect, I conduct the same parametric test that I used to test for the January
effect, only changing the dummy variable so i = I for September and i = 0 for all other
months; the results are staggering. The September returns exhibit a significant positive
difference from the remaining eleven months for 13 of 16 countries. Interestingly, the US
exhibits this seasonal for the MSCI data (value-weighted) but not the CRSP data (equal-
weighted). Perhaps this September seasonal is a large-cap phenomenon. While this
September study is purely data mining, it is very interesting. The problem is that I cannot
think of a significant rational explanation as to why this is occurring. This is certainly an
interesting topic that is open for much more research in the future.

5 CONCLUSION
As is most commonly the case when research is conducted on the January effect, I
end up with a relatively inconclusive study. With the exception of Roll (1983), the vast
majority of research supports that the tax-loss selling hypothesis makes rational,
economic sense. However, from a global perspective, the evidence I have found is not
heavily supportive. Seven of 16 countries tested in this study show a seasonal return
anomaly for the first month of the tax year; this is hardly persuasive. Similar to previous
papers, I have been unable to uncover a solid explanation for the January effect.
However, two conclusive items have come from this paper: the small-firm effect is still
very strong in the United States and, interestingly, the small-firm effect is not the driver
of the January effect internationally. However, eight countries (not counting the US)
showed no January, or turn-of-the-tax-year, seasonal. This finding opens the door for,
believe it or not, future study surrounding the January effect. It would be interesting to
test all countries using equal-weighted data to compare results with this study and see if
the small-firm effect is solely a US phenomenon or if the results are more significant
internationally when small firms are equally represented. As more global indices are
becoming available, this should soon be possible, if not already. Perhaps such a study
would find some conclusive evidence, for once, surrounding an explanation for this
elusive anomaly.

Table 1 Monthly Mean Returns (in % per month)
January 1970 - December 2006 (444 observations)
Country Jan Feb Mar Apr May June July Aug Sep Oct Nov Dec
Australia Austria Belgium Canada Denmark
3 France 4 Germany
Hong Kong Italy Japan Netherlands Spain Sweden Switzerland UK US US EW
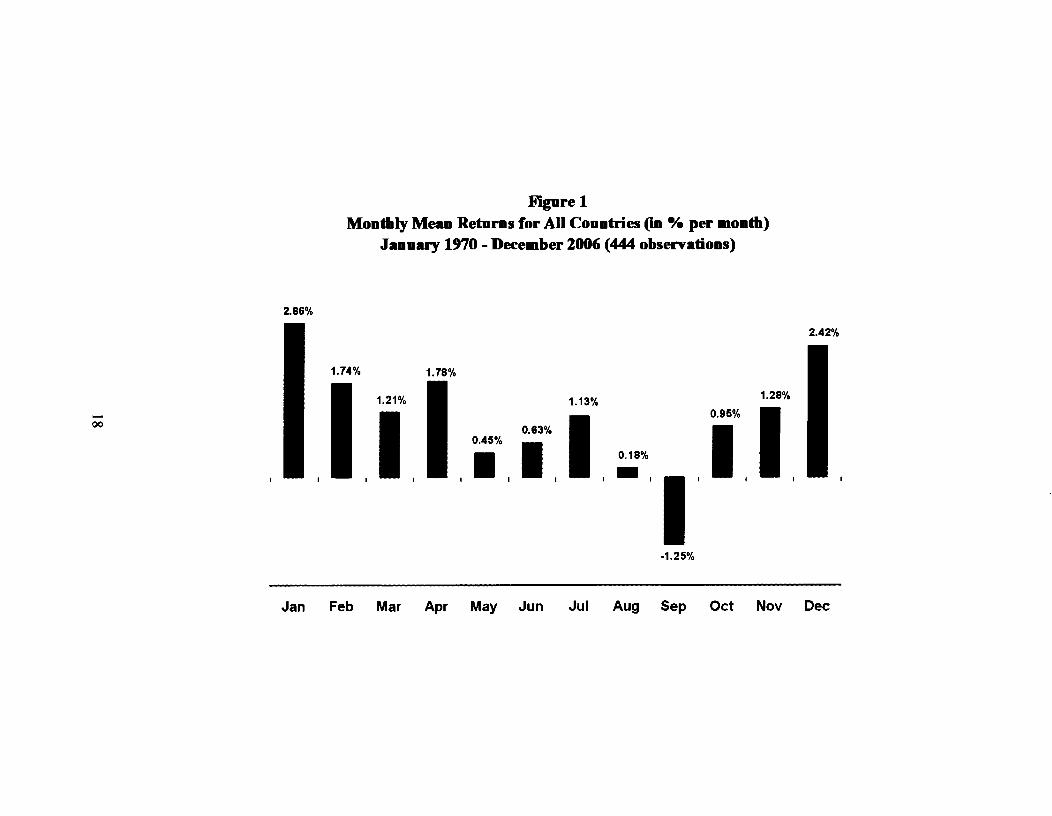
+re 1 Monthly Mean Retnrns for All Countries (in ./. per month)
Jannary 1970 - December 2006 (444 observations)
-- --
Jan Feb Mar Apr May Jun Jul Aug Sep Oct Nov Dec
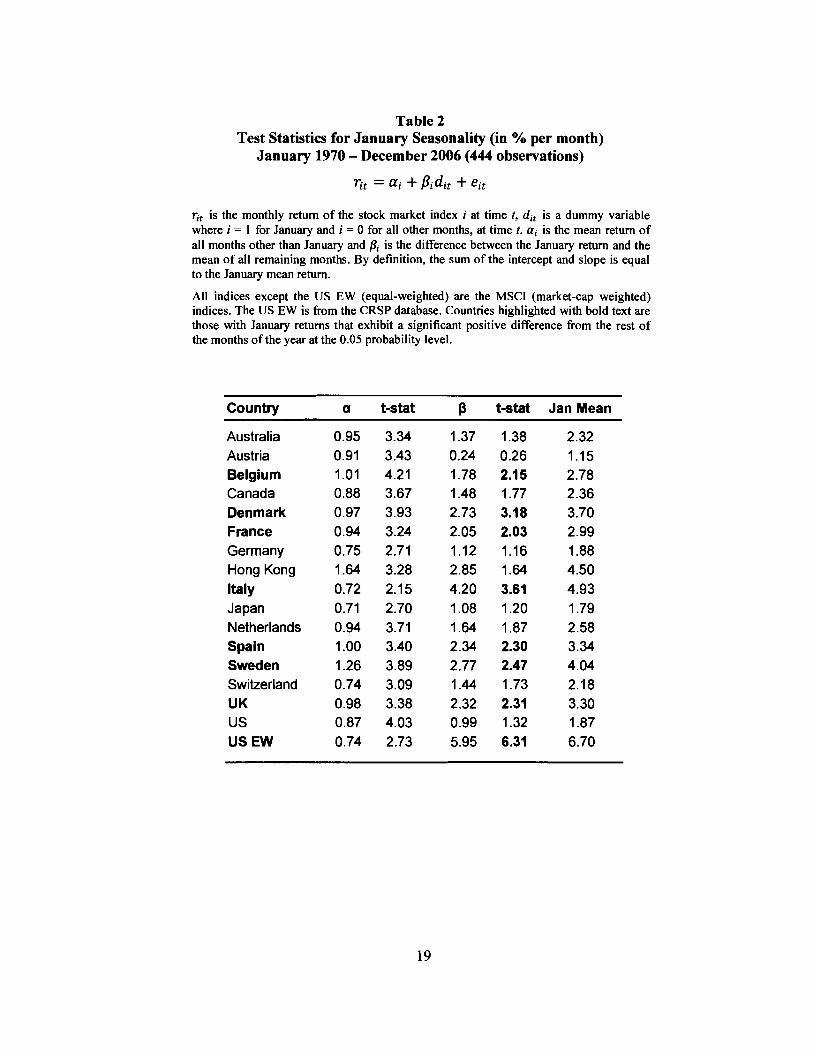
Table 2 Test Statistics for January Seasonality (in % per month)
January 1970 - December 2006 (444 observations)
rit is the monthly return of the stock market index i at time t, dit is a dummy variable where i = 1 for January and i = 0 for all other months, at time t. ai is the mean return of all months other than January and Pi is the difference between the January retum and the mean of all remaining months. By definition, the sum of the intercept and slope is equal to the January mean return.
All indices except the US EW (equal-weighted) are the MSCI (market-cap weighted) indices. The US EW is from the CRSP database. Countries highlighted with bold text are those with January returns that exhibit a significant positive difference from the rest of the months of the year at the 0.05 probability level.
Country a t-stat p t-stat Jan Mean
Australia Austria Belgium Canada Denmark France Germany Hong Kong Italy Japan Netherlands Spain Sweden Switzerland UK US US EW
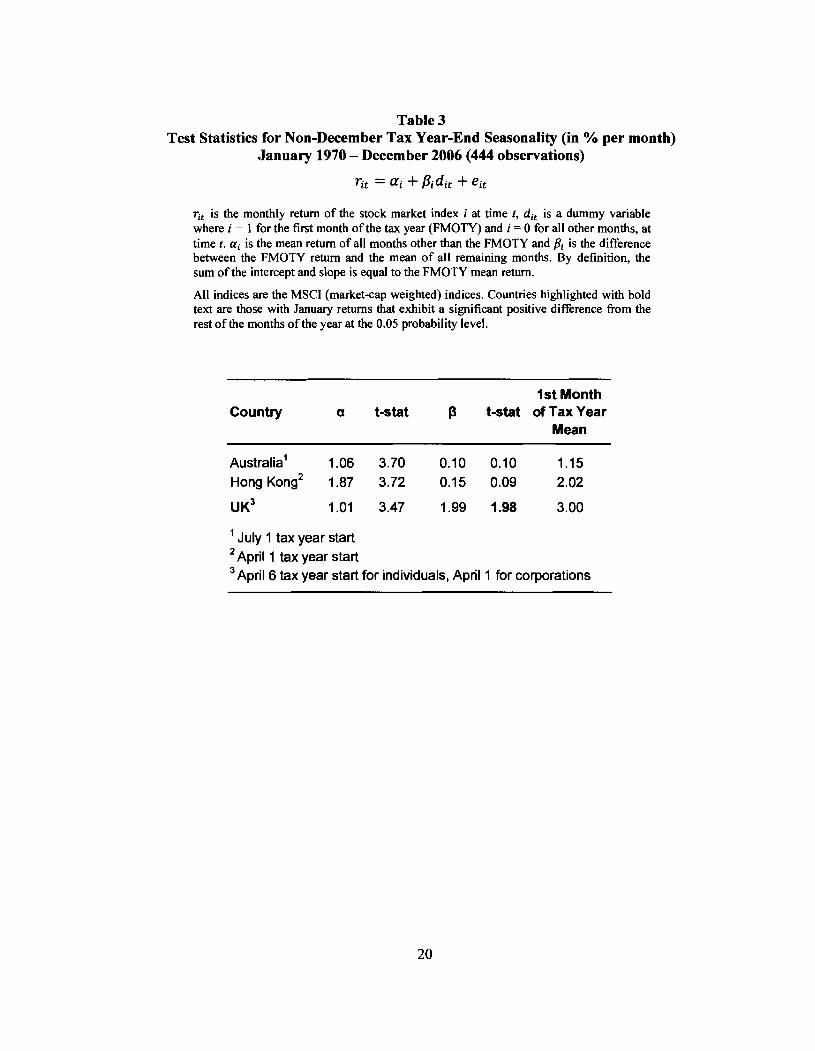
Table 3 Test Statistics for Non-December Tax Year-End Seasonality (in % per month)
January 1970 - December 2006 (444 observations)
rit is the monthly return of the stock market index i at time t , dit is a dummy variable where i = 1 for the first month of the tax year (FMOTY) and i = 0 for all other months, at time t . ai is the mean return of all months other than the FMOTY and Pi is the difference between the FMOTY return and the mean of all remaining months. By definition, the sum of the intercept and slope is equal to the FMOTY mean return.
All indices are the MSCI (market-cap weighted) indices. Countries highlighted with bold text are those with January returns that exhibit a significant positive difference from the rest of the months of the year at the 0.05 probability level.
1st Month Country a t-stat p t-stat of Tax Year
Mean
~ustralia' 1.06 3.70 0.10 0.10 1.15 Hong ~ o n g ~ 1.87 3.72 0.15 0.09 2.02
u K~ 1.01 3.47 1.99 1.98 3.00
July 1 tax year start April 1 tax year start
3 ~ p r i l 6 tax year start for individuals, April 1 for corporations

Table 4 Test Statistics for September Seasonality (in O h per month)
January 1970 - December 2006 (444 observations)
rit is the monthly return of the stock market index i at time t, dit is a dummy variable where i = 1 for September and i = 0 for all other months, at time t. a, is the mean return of all months other than September and Pi is the difference between the September return and the mean of all remaining months. By definition, the sum of the intercept and slope is equal to the September mean return.
All indices except the US EW (equal-weighted) are the MSCI (market-cap weighted) indices. The US EW is from the CRSP database. Countries highlighted with bold text are those with September returns that exhibit a significant positive difference from the rest of the months of the year at the 0.05 probability level.
Country a t-stat p t-stat Sept Mean
Australia Austria Belgium Canada Denmark France Germany Hong Kong Italy Japan Netherlands Spain Sweden Switzerland UK US US EW

REFERENCE LIST
Banz, R.W., "The Relationship Between Return and Market Value of Common Stocks," Journal of Financial Economics, 9 (1 98 1 ), pp. 3- 18.
Berges, A., J.J. McConnell, and G.G. Schlarbaum, "The Turn-of-the-Year in Canada," The Journal of Finance, 39 (1 984), pp. 185-1 92.
Cataldo A.J. 11, and A.A. Savage, "The January Effect and Other Seasonal Anomalies: a Common Theoretical Framework," Studies in Managerial and Financial Accounting, 9 (1 999).
Chan, K.C., "Can Tax-Loss Selling Explain the January Seasonal in Stock Returns?The Journal of Finance, 41 (1986), pp. 11 15-1 128.
Eakins, S., and S. Sewell, "Do Institutions Window Dress? An Empirical Investigation," Quarterly Journal of Business and Economics, 33 (1 994), pp. 69-78.
Eakins, S., and S. Sewell, "Tax-Loss Selling, Institutional Investors, and the January Effect: A Note," Journal of Financial Research, 16 (1993), pp. 377-384.
Fountas, S., and Segredakis, K.N., "Emerging Stock Markets Return Seasonalities: the January Effect and the Tax-Loss Selling Hypothesis," Applied Financial Economics, 12 (2002), pp. 29 1-299.
Gamble, R.C., "The January Effect and Intergenerational Transfers," The Quarterly Review of Economics and Finance, 33 (1993), pp. 295-304.
Gultekin, M.N., and N.B. Gultekin, "Stock Market Seasonality: International Evidence," Journal of Financial Economics, 1 2 (1 983), pp. 469-48 1.
Haug, M., and M. Hirschey, "The January Effect," Financial Analysts Journal, SepIOct (2006), pp. 78-88.
Johnston, K., and D.R. Cox, "The Influence of Tax-Loss Selling by Individual Investors in Explaining the January Effect," Quarterly Journal of Business and Economics, 35 (1996), pp. 14-20.
Jones, C.P., D.K. Pearce, and J.W. Wilson, "Can Tax-Loss Selling Explain the January Effect? A Note," The Journal of Finance, 42 (1987), pp. 453-461.
Jones, S.L., W. Lee, and R. Apenbrink, "New Evidence on The January Effect Before Personal Income Taxes," The Journal of Finance, 46 (1 991), pp. 1909-1924.
Keim, D.B., "Size-Related Anomalies and Stock Return Seasonality: Further Empirical Evidence," Journal of Financial Economics, 12 (1 983), pp. 1 3-32.

Kohers, T. and R.K. Kohli, "The Yearend Effect in Stock Returns Over Business Cycles: A Technical Note," Journal of Economics and Finance, 1 6 (1 992), pp. 6 1 -68.
Kramer, C., "Macroeconomic Seasonality and the January Effect," The Journal of Finance, 49 (1 994), pp. 1883-1 89 1.
Lakonishok, J, A. Shleifer, R. Thaler, and R. Vishny, "Window Dressing by Pension Fund Managers," American Economic Review, 81 (1 991), pp. 227-23 1.
Lakonishok, J, A. Shleifer, and R.W. Vishny, "The Impact of Institutional Trading on Stock Prices," Journal of Financial Economics, 32 (1992), pp. 23-43.
Ligon, J.A., "A Simultaneous Test of Competing Theories Regarding the January Effect," The Journal of Financial Research, 20 (1 997), pp. 1 3-32.
Ogden, J.P., "Turn-of-Month Evaluations of Liquid Profits and Stock Returns: A Common Explanation for the Monthly and January Effects," The Journal of Finance, 45 (1 99O), pp. 1259- 1272.
Pettengill, G.N., "A Non-Tax Cause for the January Effect? Evidence from Early Data," Quarterly Journal of Business and Economics, 25 (1 986), pp. 1 5-33.
Priestley, R., "Seasonality, Stock Returns and the Macroeconomy," The Economic Journal, 107 (1 997), pp. 1742- 1750.
Reinganum, M.R., "Misspecification of Capital Asset Pricing: Empirical Anomalies Based on Earnings' Yields and Market Values," Journal of Financial Economics, 9 (1981), pp. 19-46.
Reinganum, M.R., "The Anomalous Stock Market Behavior of Small Firms in January: Empirical Tests for Tax-Loss Selling Effects," Journal of Financial Economics, 12 (1983), pp. 89-1 04.
Ritter. J.R., "The Buying and Selling Behavior of Individual Investors at the Turn of the Year," Journal of Finance, 43 (1988), pp. 701-717.
Ritter, J.R. and N. Chopra, "Portfolio Rebalancing and the Turn-of-the-Year Effect," The Journal of Finance, 1 (1 989), pp. 149- 166.
Roll, R., "Vas ist das? The Turn-of-the-Year and the Return Premia of Small Firms" Journal of Portfolio Management, 9 (1 983), pp. 18-28.
Rozeff, M.S., and W.R. Kinney, Jr., "Capital Market Seasonality: The Case of Stock Returns," Journal of Financial Economics, 3 (1976), pp. 379-402.
Schultz, P. "Transaction Costs and the Small Firm Effect: A Comment," Journal of Financial Economics, 12 (1 983), pp. 8 1-88.
Stoll, H.R. and R.E. Whaley, "Transaction Costs and the Small Firm Effect," Journal of Financial Economics, 12 (1983), pp. 57-79.

Sullivan, R., A. Timmermann, and H. White, "Dangers of Data Mining: The Case of Calendar Effects in Stock Returns," Journal of Econometrics, 105 (2001), pp. 249-286.
Thaler, R.H., "Anomalies: The January Effect," The Journal of Economic Perspectives, 1 (1 987), pp. 197-20 1 .
Wachtel, S.B., "Certain Observations on Seasonal Movements in Stock Prices," The Journal of Business of the University of Chicago, 15 (1 942), pp. 184- 193.
Yanxiang Gu, A. and J.T. Simon, "Declining January Effect - Experience in the United Kingdom," American Business Review, 2 1 (2003), pp. 1 17- 12 1.